wiredspace.wits.ac.zawiredspace.wits.ac.za/jspui/bitstream/10539/24747/1/freeman lauren anne._the...
TRANSCRIPT
__________ '........ia_~~...,_,, _
THE NATURE OF HYDROTHERMAL FLUIDS
ASSOCIATED iNITH GRANITE-HOSTED,
POLYMETALLIC MINERALISATION IN THE
EASTERN LOBE OF THE BUSHVELD COMPLEX.
By
Lauren Anne Freeman
A thesis submitted in fulfilment of therequirements for the degree of
PhD inGeology
University of the Witwatersrand
1998
ABSTRACT
Numerous small base-metal deposits occur in the acidic rocks of the Bushveld Complex, and
modem exploration programs are currentlyre-exa-fning this metallotect in an attempt to refine
the current working hypothesis for mineralisation in these granites. The hypothesis proposed
for the origin of mineralisation is multifaceted, encompassing both spatial and temporal
relationships between at least three episodes of ore formation. The first episode of
mineralisation (typified by the Zaaiplaats tin deposit) occurred at relatively high temperatures
(>600"C to 4000 C), and resulted in the formation of orthomagmatic cassiterite, scheelite and
an early generation of fluorite. At lower temperatures (200°C<r<400°C), where processes
were essentially fluid dominated, a mesothermal Cu-Pb-Zn-As-Ag-Au assemblage wasdeposited (exemplified by the Spoedwel, Boschhoek and Albert copper and silver deposits). A
third episode of mineralisation resulted in the formation of an Fe-U-F assemblage and is
recognised at several, but not necessanly all, of the deposits examined (for example, the Albert
silver deposit). The extended nature of this three-stage paragenetic sequence is considered to
reflect widespread mixing between an early fluid derived by H20-saturation of the granitic
magma and an external meteoric/connate fluid, circulation of which was stimulated by the long-
lived high heat-productive capacity of the Bushveld granites, as well as exhumation of the
metallotect;
The early high-temperature Sn/W assemblage was precipitated while magmatic fluids
dominated the system. With time, the pluton cooled and was subject to regional uplift.
Fractures developed, acting as conduits for external fluids of meteoric and/or connate origin.
The late magmatic fluids, enriched in incompatible metals (and volatiles), interacted with the
latter fluid, resulting in the localised precipitation of a secondary, lower-temperature mineral
assemblage (Cu-Pb-Zn) in the zone of fluid mixing. As the external fluid component became
progressively more dominant, the paragenesis changed, forming the :final Fe-U-F assemblage.
The formation of these three different, temporally separate assemblages is adequately explained
in terms of a fluid mixing model, wherein the concentration ofmetaIs and localisation of ore
deposits are controlled by lithology and structure.
ii
DECLARATION
This thesis ismy own unaided work, conducted under the supervision of Prof. Laurence J.
Robb, It is being submitted for the degree of Ph.D. in Geology at the University of the
Wrtwatersrand, and has not been previously submitted for any degree or examination at
any other university.
Lauren Anne Freeman
iii
ACKNOWLEDGEMENTS
My sincere thanks to my supervisor Laurence Robb, for his guidance, support and
invaluable criticisms of this manuscript.
I am grateful to the following people who played an important role in the collection of
analytical data.
-Steve Kesler and Jim O'Neil at the University of Michigan, for allowing me to use their
laboratory facilities, and for discussions on the information obtained concerning the gas
chemistry and stable isotopic signatures of fluids inmy study area.
-Wojtek Przybylowiez at NAC for running PIXE analyses and for editing the PIXE
section.
-Mark Brandriss and Hank Jones at the University ofMic'u~gan for assistance 'Withoxygen
isotope analyses.
-Rudi Boer and Gillian Drennan for help with fluid inclusions during early stages of this
study.
-Angie Breithaupt for teaching me how to operate the quadrupole mass spectrometer and
fluid inclusion extraction line.
-Pamela Murphy for running Raman analyses
-RTZ for providing field assistance while mapping.
-Jim Reynolds for helpful discussions of fluid inclusion petrography and
microtherrnometry
-John Clemens for discussions of'hypersolvus and subsolvus granites in the field.
-Erna Hattingh. at the Council for Geosciences for assistance 'With cathodo-luminescence
and backscatter images.
- Special thanks go to my family, for their support and encouragement throughout my
studies.
iv

TABLE OF CONTENTS
ABSTRACT
DECLARATION
ACKNOWLEDGMENTS
TABLE OF CONTENTS
LIST OF FIGURES
LIST OF TABLES
iiilliv
v
xiv
xxix
INTRODUCTION 1
1.1 THEHYPOTIIESIS
1.2 METHODOLOGY
2
3
CHAPTER 2 GEOI ..OGICAL SETTING 8
2.1 REGIONAL GEOLOGY- the Bushvek, Complex
SHAPE AND STRUCTURE
GEOLOGY
Host rocks - The Transvaal Supergroup
The Busbveld Complex
Rashoop Gl'anopizyreSuite
Rustenberg Layered Suite
Lebowa Granite Suite
Nebo Granite
Klipkloof Granite
Makhutso Granite
8
9
11
11
12
12
13
14
16
16
17
v
GEOCHRuNOLOGY 19
Rashoop Granophyre Suite 21
Rustenberg Layered Suite 21
Lebowa Granite Suite 22
GENETIC MODEL FOR TIlE EVOLUTICi tVOF THE
BllSHVELD COMPLEX 26
2.2 THE GEOLOGY OF THE AREA EAST OF
MARBLE HALL -Field mapping area 29LOCAL GEOLO(fY 31
The Nebo Granite 31The Klipldo,I};:Granite 33
Typical fine-grained Klipkloof Granite 33Porphyritic Klipkloof Granite 33Albitised Klipklaof Granite 34
Coarse-grained Klipkloof Granite 35
STRUCTURE 36
2.3 CONCLUSION 37
CHAPTER 3 MINERALISATION IN THE
BUSHVELD GRANITES
39
3.1 OVERVIEW 393.2 LOCALITY DESCIPTIONS 52
GRASS VALLEY 52
Gco!ogy 52
SPOEDWEL AND DRONKFONTEIN 56
Geology 57
vi
ALBERT
Geology
HOUTENBEK
61
62
64
CHAPTER 4 MINFjRAL PETROGRAPHY 65
4.1 SAMPLE MATERIAL 65
4.2 SAMPLE DESCRIPTIONS 66
4.3 BYl'ERSOI.vUS AND STJBSOLVUS GRANITES IN THE
BUSHVELDCOMPLEX 66
HYPERSOL vasAND SllBSOLVUS GRANITES
ASSOCIATED »'ITH MINERAL! 'TION
4.4 PETROtJRAPmC OBSERVATIONS
GANGUE MINERALOGY
Feldspar
Chlorite
Quartz
Chalcedony
Muscovite and sericite
Fluorite
TourmalilleTitanite
Zircon
Monazite
Calcite and ankerite
ORE MINERALOGY
Cassiterite
Specularite
Molybdenite
6871
71
71
72
74757576767777
78
78
81
818282
vii
Arsenopyrite 82
Pyrite 83
Galena 83
Tetrahedrite-tennantite 84
Sphalerite 84Chalcopyrite 85Bornite 86Chafcocfte-dlgenlte-coveltlte 86
Magnetite 87
Hematite 87
Limonite 88Other minerals 88
4.5 PARAGENE1~CSEQUENCE 91
4.6 ALTERATION 97
ALTERATION ASSEMBLAGES 97
Advanced Argillic Alterdtion 97Phyllic Ok" Serieltie Alteration 97PropyUitic Alteration 98Chloritlsation 98Albitisation 98
Potassic Alteration 99
ALTERATION REACTIONS 99Hydrolysis (W metasomatism) 100
Hydration 100
Alkali !£arth Metasomatism 100
Silicification 101
Oxidation-reduction 101
Sulphldntion 101
4.7 CONCLUSION 102
viii
CHAPTERS FLUID INCLUSION PETROGRAPHY
AND MICROTHERMOMETRY 105
5.1 FLUID 1NCLUSIONS AND THEIR APPLICATIONS 107
IN THE STUDY OF ORE DEPOSITS
TEMPERATURE
PRESSURE AND DENSITY
COMPOSITION
112
113114
5.2 FLUID INCLUSIONS IN THE BUSBVELD GRANlTES 117
PREVIOUS WORK 117
Zaaiplaats 117
Leeuwpoort 124
AJbert 124
METHODOLOGY AND EQUIPMENT 126
Fluid Incluslon types and assemblages 127
Micrethermometry 132
RESULTS 132
Grass Valley 134
Houtenbek 153
Spoedwel 159
Drenkfontein 172
Albert 176
Leeafentein 198
DISCUSSION 208
Composition 209
Temperature, pressure and density 211
Boiling versus fluid mixing 212
Fluids associated with barren KlipkloofGranite 213
ix
Fluids in hypersolvns and subsolvns granites
associated with mineralisation
Fluitls associated with mineralisation
Fluids associated with vein quartz
Fluids associated with fluorite
5.3 CONCLUSION
216220226228231
CHAPTER 6 QUANTITATIVE FLUID
INCLUSION ANALYSIS 231
6.1 PTh.'"EANALYSIS
OVERVIEW
EQUIP)I'1ENT
SAMPLE .MATERIAL
Grass Valley
Spoedwel
Albert
Leeufonteia
Synthetic fluid inclusions
METHODS
RESULTS
Maxtaform finder grids
Inclusion-free quartz
Synthetic fhtld inclusions
Fluid inclusions
DISCUSSION
232232234235235235236236236237239
239240
241
242254
x
6.2 LASER RAMAN SPECTROSCOPY 257OVERVIEW 257
EQUIPMENT 259
SAMPLE MATERIAL 259
METHODS 260
RESULTS 261
Raman spectra generated by mounting media 261
Superglue 261
Epoxy 262
Raman spectre 15enerated by host minerals 263
Sphalerite 263
Qrtarlz 263
Fluorite 264
Raman spectra generated by fluid inclusions 265
Du,'CUSSION 269
6.3 QUADRUPOLE MASS SPECTROMETRY
OVERVIEW
EQUIPMENT
SAMI'LEMATEKIAL
METHODS
RESULTS
l'>ISCUSSlON
270270271
272
274
275
284
CHAPTER 7 STABLE ISOTOPES 291
OVERVIEW
Hydrogen and oxygen isotopes
291
292
Carbon isotopes 296
Stable isotopes inmeteoric-hydrothermal systems 297
EQUIPMENT AND METHODS 299
SAMPLE MATERIAL 300
REVOLTS 302
DLSCUSSIOlV 306
Oxygen and hydrogen isotopes 306
Carbon isotopes 309
CHAPTER 8 SYNTHESIS AND MODEL 310
REFERENCES 322
APPENDIX
Tables of sample descriptions
Geological maps of the field mapping area east of Marble Hill
Petrographic maps of fluid inclusions
Tables of microthermometric data
Tables of results of thermal decrepitation analyses
xii
ABSTRACTS
Freeman, L.A. and Robb, L.J. (1995). The nature of hydrothermal fluids associated with
the granite-hosted Spoedwel Copper Mine, Bnshveld Complex, South Africa.
Centennial Geocongress Extended Abstracts Vol. II. 719.
Freeman, L.A, Robb, L.J., Kesler, S.E. and O'Neil, J.R (1997). Fluid mixing and the
formation of polymetallic mineralisation in the Bushveld granites. International
Symposium on Plumes, Plates and Mineralisation. Abstracts. 14-18 April 1997.
Pretoria South Africa. 35-36.
Robb, L.J., Freeman, L.A, and Bailie, RH. (1998). Metallogeny of the Acid Phase of the
Bushveld Complex. IAvcm Cape Town, July1998.
LIST OF FIGURES
CHAPTER. 1
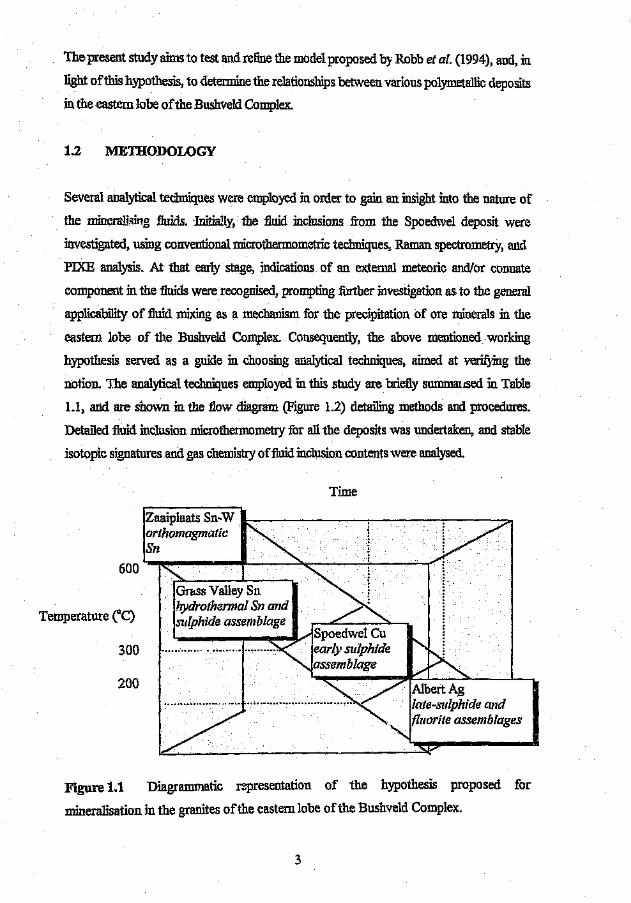
Figure 1.1 Diagrammatic representation of the hypothesis proposed for
mineralisation in the granites of the eastern lobe of the Bushveld Complex.
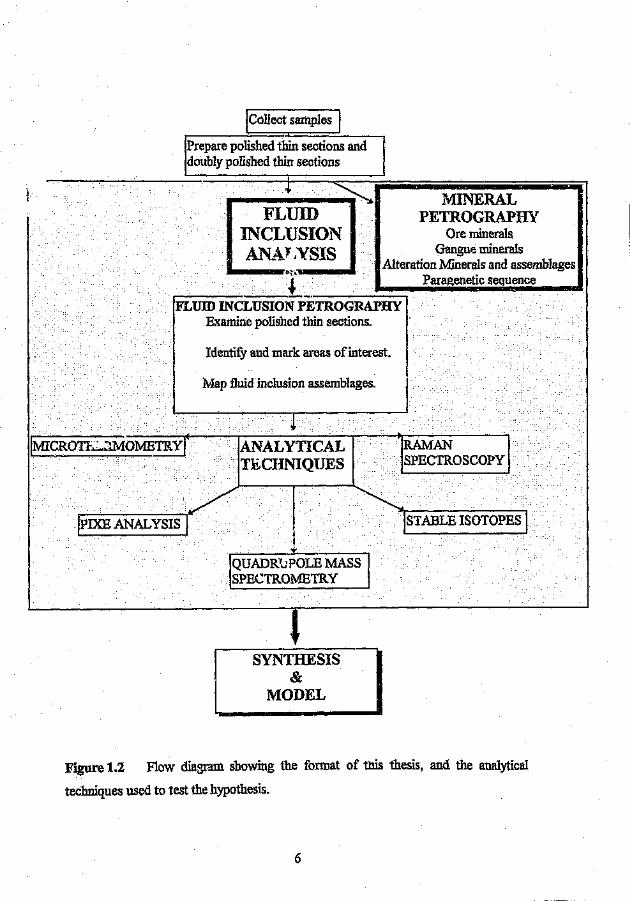
Figure 1.2 Flow diagram showing the format of this thesis, and the analytical
techniques used to test the hypothesis,
CHAPTER 2
Figure 2.1 Regional geological map of the Bushveld Complex (modified from
Walraven, 1997).
Figure 2.2 Lineament map showing aeromagnetic lineaments and gravity highs «70mga1s) . Prominent geological features and lineament domains are indicated (from Lee
and Sharpe, 1986).
Figm.1'! 2.3
Figure 2.4
Diagrammatic representation of the rocks ofthe Bushveld Complex.
Geological map showing granite plutons in the eastern lobe of the Bushveld
Complex, and known mineral occurrences (from Scoggins, 1991).
Fi!,rnre 2.5 A model for the origin of the Nero and Klipldoof Granites (redrawn from
Kleemann, 1985).
Figure 2.6 Map indicating location of field mapping area relative to the ore deposits at
Grass Valley, Spoedwel, Dronkfontein, and Boschhoek.
Figure 2.7 Geological map offield mapping area east of Marble HalL
Figure 2.8 Photograph of a tonrmaline spheroid in albitised Klipkloof Granite at
Leeufontein.
Figure 2.9 Schematic diagram showing the intrusive relationships between the rock
units in the Lebowa Granite Suite.
~R3
Figure 3.1 The hypothesised water mixing, ore precipitation and ore leaching scenario
inthe Olympic Dam Breccia Complex and in the Olympic Dam maar volcano (from Haynes
et al., 1995).
xiv

Figure 3.2 Geological map of the Bushveld Complex showing the major fault systems
and the mineral occurrences.
Figllre3.3
Figure 3.4
Mineral occurrences associated with the Wonderkop and Stee1poort faults.
Geological map and cross section A-B showing the stratigraphic position of
the mineralisation at Spoedwel, Dronkfontein, Vlakfontein, Stavoren and Grass Valley.
Modified from Scoggins (1991).
Figur~ 3.5 Geological chsiacteristics of the Zaaiplaats-, Rooiberg-, Albert- and
Spoedwel- styles of mineralisation in the Bushvekl Complex (from Robb et al., 1994).Figure 3.6 Generalised. metallogenic model for polymetallic mineralisation in granites
of the Bushveld Complex (from Robh et al., 1994).
Figure 3.7 a) Fractures in granite which trend parallel to overlying pegmatite sheets.
b) Cassiterite mineralisation along fractures in the granite (from Wagner, 1921).
Figure 3.8 a) Plan view of a small pipe at Grass Valley. b) Section of the elliptical
orebody at Grass Valley, containing cassiterite and sulphide mineralisation (from Wagner,
1921).
Figure 3.9
1921).
Figure 3. 10 General section of the Spoedwel Copper deposit, showing the northerly
dipping No.1 ore body and the stockwork-like No.1 ore body (after Frick, unpubl report,
1993).
Replacement of pegmatitic quartz by cassiterite and sericite (from Wagner,
Figure 3.11 Sketches of the walls inthe E-W tunnel at the Spoed.wel deposit.
Figure 3.12 Borehole core showing the associated Cu concentrations. Values are
indicated inppm and % in high grade samples.
Figure 3.13 Outcrop map of the farm Roodepoortjie showing the distribution of the
Albert Silver Mine veins inrelation to the fine- and coarse-grained porphyritic granite host
rocks. Section A-B has a 2x vertical exaggeration and shows actual elevations in feet (from
Robbetai., 1994).
Figure 3.14
Granite.
Diagrammatic representation of the Houtenbek breccia pipe in Nebo
xv
CHAPTER 4
Figure 4.1 Microphotograph of hypersolvus granite showing strongly altered and
hematitised interlocking perthite crystals (pPL X40).
Figure 4.2 Microphotograph of subsolvus granite associated with sulphide
mineralisation at Spoedwel (PPL Xl 00).
Figure 4.3 Microphotograph of the subsolvus Verena Granite which hosts
mineralisation at the A1bert Silver Mine (pPL X40).
Figure 4.4 Microphotograph of subsolvus granite containing Kfeldspar, albite, quartz
and muscovite. (XPL X40).
li'igure ~.5 Microphotograph of transsolvus granite composed of hypersolvus perthite
ina subsolvus matrix. (pPL X40).
Figure 4.6 Microphotograph of transsolvus granite containing pertbite, albite, K-
feldspar, quartz and muscovite. (XPL X,' I).
Figure 4.7 Microphotograph showing albitisation of'perthite crystals. (XPL X40).
Figure 4.8 Microphotograph showing muscovitisation of subsol IUS granite. (XPL
X40).
Figure 4.9 Microphotograph of subsolvus granite at Albert showing secondary albite
growth on primary albite. (XPL X40).
Figure 4.10 Microphotograph showing chloritic alteration of perthite, (pPL X 40).
Figure 4.11 Microphotograph of grass-green chlorite. (pPL X 100).
Figure 4.12 Microphotograph of a fine-grained variety of grass green chlorite which
often surrounds disseminated sulphide minerals. (pPL Xl 00).
Figure 4.13 Microphotograph of brown chlorite which is associated with altered
accessory cassiterite and titanite in unmineralised granites. (pPL Xl 00).
Figure 4.14 Euhedral crystal faces of quartz outlined by fluid :inclusionstrapped on the
surface and radiatirr 'nto the rewlyprecipitated quartz in subsequent growth stages. (pPL
X40).
Figure 4.15 Primary fluid inclusions along growth zones in quartz. (pPL X400).
Figure 4.16 Quartz vein from Spoedwel containing two generations of quartz. (PPL
X40).
xvi
Figure /' .17 0uartz vein from Albert containing numerous increments of quartz growth.
(PPLX40).
Figure 4.18 Scanned image ofvein quartz from Grass Valley containing numerous
increments of quartz growth.
Figure 4.19 Interstitial fluorite at Spoedwel (PPL X40).
Figure 4.20 Scanned image of a polished thin section cut through a tourmaline spheroid.
Figure 4.21. Zircon crystal surrounded by sulphides. Note the internal growth zonation
within the zircon crystal. (RL X40).
Figure 4.22 Altered zircon crystals with radiogenic alteration halos in a chlorite matrix.
(PPLX40).
Figure 4.23 Unaltered zircon crystals associated with grass-green chlorit: and sulphide
mineralisation. (pPL Xl 00).
Figure 4.24 Cathodo-luminescence image of a zoned zircon associated with the third
quartz generation at SpoedweL
Figure 4.25 Disseminated cassiterite from Spoedwel associated with later stage sulphide
sP\~(.,'!..S(pPL Xl 00).
Figure 4.26 Arsenopyrite overgrown by pyrite from Spoedwel (RL Xl 00).
Figure 4.27 Arsenopyrite overgrown by pyrite at Albert. (RL Xl 00).
Figure 4.28 Euhedral pyrite crystal fractured and filled by galena and chalcopyrite from
Spoedwel, (RLXIOO).
Figure 4.29 Microphotograph of pyrite (opaque) showing two growth stages separated
by muscovite precipitation (pPL X200).
Figure 4.30 Transparent sphalerite altered to opaque sphalerite along fractures and
grain boundaries. (RL XIOO).
Figure 4.31 Chalcopyrite associated with galena, tennantite an>j sphalerite at Spoedwel
(RLXIOO).
Figure 4.32 Chalcopyrite from Spoedwel altered to bornite and chalcocite (RL Xl 00).
Figu1"le 4.33 Chalcopyrite from Spoedwel altered to covellite along fractures and grain
boundaries. (RLXIOO).
Figure 4.34 Chalcocite, digenite and covellite completely replace cbalcopyrite (RL
Xl 00).Figure 4.35 Magnetite crystals associated with quartz and biotite at Albert (PPL Xl 00).
xvii
Figure 4.36 Magnetite crystals associated with fluorite at Albert (PPL X 100).
Figure 4.37 Magnetite pseudomorphs after muscovite in Nebo granite at Spoedwel
(Backscatter image).
Figure 4.33 Hematitised perthite crystals showing partial albitisation (XPL X200).
Figure 4.39 Hematite liberated from the perthite lattice occurs as rims around the
individual grains and along fractures within the grains (pPL X100).
Figure 4.40 Limonite staining associated with oxidation and hydration of Fe-bearing
minerals.
Figu.re 4.41 Paragenetic sequences at Grass Valley and Houtenbek.
Figure 4.42 Paragenetic sequence at Albert.
Figure 4.43 Parageneticsequence ill the zones of massive sulphide and disseminated
mineralisation at Spoedwcl.
CHAPTERS
Figure 5.1 OvL......~ of research approach and analytical techniques employed in order
to determine the physical and chemical conditions associated withmineralisation.
Figure 5.2 Microphotograph of several quartz-hosted fluid inclusions containingliquid and a vapour bubble, as wen as a solid daughter crystal (Magnification XSOO).
Figure 5.3 Primary :fluid.inclusions trapped ill quartz overgrowth on a pyrite crystal
(Magnification X400).
Figure 5.4 Primary fluid inclusions along a growth zone ill quartz. Note that the
hematite crystals are not present inall fluid inclusions, and thus may be trapped solids rather
than true daughter crystals 0\AagnificationX400).
Figure 5.5 Secondary fluid :inclusions along cross-cutting fractures in fluorite
(Magnification X400).
Figure 5.6 Pseudosecondary fluid inclusions trapped along a fracture emanating from
the face of an earlier formed crystal and which was annealed during subsequent crystal
growth (Magnification XIOO).
Figure 5.7 Figure showing primary fluid inclusions (trapped during crystal growth),
secondary and pseudo secondary fluid inclusions (trapped along annealed fractures in the
crystal).
xviii

Figure 5.8 Generalised and schematic P-V-T diagram for the unary system H20 (from
Goldstein and Reynolds, 1994).
Figure 5.9 T-X plot for the low temperature part (If the NaCl-H20 system, in
equilibrium with vapour at lbar total pressure (Roedder, 1962).
Figure 5.10 Frequency distribution of the homogenisation temperatures of primary (P)
and secondary (S) fluid inclusions in the Bobbejaankop and Lease Granites and in the
contact pegmatite. (From Ollila, 1981).
Figure 5.11 Frequency distribution for homogenisaticn temperatures of the fluid
inclusions of different origin in the vuggy minerals fluorite (VFl), quartz (YQ) and calcite
(VC) in the Bobbejaankop Granite, and of vuggy quartz associated with cassiterite (Q) in
the miarolitic cavities of the Lease Granite. (From Ollila, 1981).
Figure S.12 Plot of pressures versus homogeeisation temperatures for fluids at
Zaaiplaats. (From Ollila, 1981).
Figure 5.13 Plot of salinities versus homogenisation temperatures for fluids at
Zaaiplaats. 0'=' quartz associated with cassiterite, VFI= vuggy fluorite, VO'=' vuggy quartz,
VC.:vuggyca1cite. (From Ollila, 1981).
Figure 5.14 Microthennometric data for Type 1b fluid inclusions from granite quartz,
early cavity-fuling quartz, and quartz from the Bobbejaankop pipe Zaaiplaats mine. A
CO2 melting temperature. B. CO2 clathrate melting temperature. C. Homogenisation
temperature of CO2 phase (to vapour = shaded, to liquid = unshaded), critical = cross-
hatched. D. Final homogenisation temperatures (to CO2 phase= shaded, to H20 phase .:
unshaded), cross hatched = critical, diagonal shading = decrepitated. (From Pollard et al.;
1991).
Figure S.15 Homogenisation temperatures for Type 2 fluid inclusions at Zaaiplaats, A
Type 2a inclusions (decrepitation temperatures = hatched). B. Type 2 b inclusions. C. Type
2c inclusions. (From Pollard et al., 1991).
Figure 5.16 Homogenisation temperatures of Type 3 inclusions from Zaaip1aats for
quartz-, fluorite- and calcite-hosted fluid inclusions, (From Pollard et al.; 1991).
Figure 5.17 Summary of fluid inclusion microthermometry from the J 'eft Silver
Mine.; a) and b) low temperature (melting) phase changes for samples RP2 (28) and RP2
(Ila). c) homogenisation temperatures (H20 L to V) for the same two samples. (From
Robb et al., 1994).
xix
Figure 5.18 Schematic diagram showing the set-up of the microscope, drawing tube
and pedestal used for transcribing the field of view observed through the microscope on to
a piece of paper.
Figure 5.19 Schematic representations of the five main fluid inclusion types
recognised in the fluid inclusion assemblages of the Bushveld granites in the eastern
lobe of the Bushveld Complex.
Figure 5.20 Examples of types of fluid inclusion assemblages from this study,Figure 5.21 Type 1a fluid inC1,/3DS along a fracture in fluorite.
Figure 5.22 Type Ib fluid in,,~usion in a secondary swarm of inclusions containing
variable phase proportions.
Figure 5.23 Type 2 fluid inclusions containing a single daughter crystal and constant
phase proportions.
Figure 5.24 Primary fluid inclusions containing muscovite as a solid phase.
F\,oure 5 .25 Primary fluid inclusion containing hematite solid phase.
FIgure 5.26 Primaryinc1usions containing several solid phases, including a small opaque
solid.
Figure 5.21 Secondary trail containing Type la and Type 3 fluid inclusions.
Figure 5.28 Secondary trail containing Type 1a, Type 1b and Type 4 inclusions.
Figure 5.29 Petrographic maps of fields 1 and 2 in sample GVOl.
Figure 5. 30 Petrographic maps of GV02 showing quartz generations 1, 2 and 3 and
fields la, b and c referred to in the text.
Figure 5. 31 Petrographic maps of vein quartz with multiple episodes of quartz
growth i.1J sample GVOS.
Figure 5. 32 Left: Petrographic map of interstitial quartz with secondary C02~rich
inclusions from sample GVOS. Right: Petrographic map of inclusions in two interstitial
quartz generations in sample GV06.
Figure 5. 33 Petrographic map showing C02-rich inclusions associated with Type
1a, Type 2 and TYf1e3 inclusions.
Figure 5. 34 Petrographic maps showing secondary trails of inclusions associated
with alteration of'the granite.
Figure 5.35 Primary Type 1a fluid inclusion in sphalerite from Houtenbek.
xx
Figure 5.36 Secondary inclusions ill fractures cutting across zoned sphalerite from
Hcutenbek,
Figure 5.37 Sketch showing primary fluid inclusions in parallel growth zones in
sphalerite generations 1 and 2. The fluid inclusion walls inthe second generation have
been altered and the resulting opacity makes it difficult to observe phase changes
during rnicrothermometry,
Figure 5.38 Microphotograph showing the abundance of fluid inclusions in quartz
generation 2 (on the right hand side of the picture) compared with quartz generation 1 (on
the left). (X 200).
Figure 5.39 Cathodo-luminescence image showing three generations of quartz in
interstitial spaces between feld;,p;:rr,r;'Stals.
Figure 5.40 Petrographic maps showiag fluid inclusions associated with quartz
generations 1 and 2.
Figure 5.41 Petrographic map of interstitial quartz and fluorite showing secondary trails
of inclusions (a) and growth. zone containing primary inclusions (b).Figure 5.42 Cathodo-luminescence image showing three quartz generations. and the
association between zircon precipitation and quartz generations 1, 2 and 3.
Figure 5.43 Petrographic maps showing the fluid inclusions studied in the different
quartz generations in. vein 1, and in veins 2 and 3 in. sample RPl 11 from Albert.Figure 5.44 Petrographic maps showing fluid Inclusions in fluorite in sample RP2
20B.
Figure 5. 45 Petrographic maps showing the relationship of quartz-hosted fluid
inclusions with arsenopyrite and fluorite-hosted fluid inclusions with chlorite.
Figure 5. 46 Petrographic maps of interstitial quartz containing numerous cross-
cutting secondary trails of inclusions.
Figure 5.47 Petrographic maps of the daughter crystal-rich fluid inclusion
assemblage in quartz associated with biotite in sample RP2 27/9.
Figure 5. 48 Petrographic maps showing secondary trails of fluid inclusions in
interstitial quartz in Klipkloof granite (sample WG35).
Figure :5.49 Petrographic maps showing patches and trails of fluid inclusions in
WGA3S.
xxi
Figure 5.50 Petrographic maps showing secondary trails of fluid inclusions in fine-
grained Klipkloof granite (sample WOO3).
Figul7e 5.51 Petrographic maps of quartz-hosted and tourmaline-hosted fluid
inclusions in a tourmaline spheroid (sample TEO!).
Figure 5. 52 Schematic representation of fluid categories discussed in tenus of their
microthermoicetric behaviour and significance.
Figure 5.53 Histograms of temperatures of intermediate melting events, finai
melting temperatures and homogenisation temperatures in barren granites at
Leeufontein,
Figure 5.54 Plot of final melting temperatures and homogenisation temperatures of
fluid inclusions in the fine-grained Klipkloof Granites at Leeufontein.
Figure 5.55 Plot of final melting temperatures and homogenisation temperatures of
fluid inclusions in tourmaline spheroids in Albitised Klipkloof Granite at Leeufontein.
Figure 5.56 Diagram plotting T 1inal. melting versus Thomog<nisatiO!lfor the fluids in
hypersolvus (Spoedwel and Dronkfontein) and subsolvus granites (Albert).
Figure 5. 57 Histograms of temperatures of intermediate melting events at Albert
(A), Houtenbek (B), Grass Valley ( C), Spoedwel (D), and Dronkfontein (E).
Figure 5.58 Plot of homogenisation temperatures versus final melting temperatures
for fluids associated with mineralisation at Grass Valley, Houtenbek, Spoedwel,
Dronkfontein and Albert.
Figure 5.59 Diagram showing the fluids associated with mineralisation in the eastern
lobe of the Bushveld granites.
Figure 5.60 Diagram showing the variation in the salinity of fluids associated with
different stages in the paragenetic sequence.
Figure 5.61 The homogenisation temperatures and final melting temperatures of
fluids from vein quartz at Spoedwel, Albert and Grass Valley.
Figure 5.62 Diagram plotting fluids from Spoedwel, Albert and Grass Valley.
Figure 5.63 Plot of homogenisation temperature versus final melting temperature
for fluorite hosted f1l.1o. inclusions from Spoedwcl, Albert, Grass Valley and
Houtenbek.
Figure 5. 64 Dia~~:n comparing fluid populations in fluorite from Spoedwel, Albert
and Grass Valley.
Figure 5.65 Schematic diagram showing the change in salinity with time, decreasing
temperature and increasing external fluid component.
CBAPTER6
Figure 6.1 M"del geometry for PIXE analyses of fluid inclusions, schematically
indicating the proton beam, sample and detector arrangement, and the geometric
parameters used to quantify PIXE microprobe spectra. The dimensions x, y and z are
determined by optical microscopy; d is determined using the Cl Ka/Kr!ratio and/or optical
measurement (from Heinrich et al., 1992).
Figure 6.2 Screen printout showing how finder grids assist in relocation of fluid
inclusions once insample holder.
Figure 6.3 PIXE microprobe spectrum of quartz some distance from the finder grids
showing that only Si peaks are detected.
Figure 6.4 PIXE microprobe spectrum of quartz near the :finder grid, showing that
excitation of the grid (in this case Cu), interferes with the spectrum for pure quartz.
Figm·e. 6.5 A) Petrographic map of quartz-hosted fluid inclusions from the Grass
Valley Sn deposit, The inclusions occur along the border between quartz generations
1 and 2, both of which precede cassiterite precipitation.
B) PIXE microprobe spectrum (Q = 115 nC, 1= 250 pA) of inclusion C (depth
O.57J.U11,thiesness 2.281lID. dimensions 16JU1lX 12J,1m)in sketch A), indicating the
presence ofCa, Fe and Cu.
C) Enlargement of portion of B) inwhich S, K and Ca peaks become more obvious.
Figul'e 6.6 A) Petrographic map of quartz-hosted fluid inclusions from the Grass
Valley deposit. The inclusions occur in euhedral, pegmatitic quartz associated with
calcite and cassiterite. The inclusion probes occurs in a seconcary trail of inclusions inquartz generation 1 preceding cassiterite precipitation.
B) PIXE microprobe spectrum of fluid inclusion A in A), indicating the presence of
Fe and Ni. Only Fe is derived from the inclusion, Ni peaks are caused by
excitation of the Ni finder grid.
xxiii
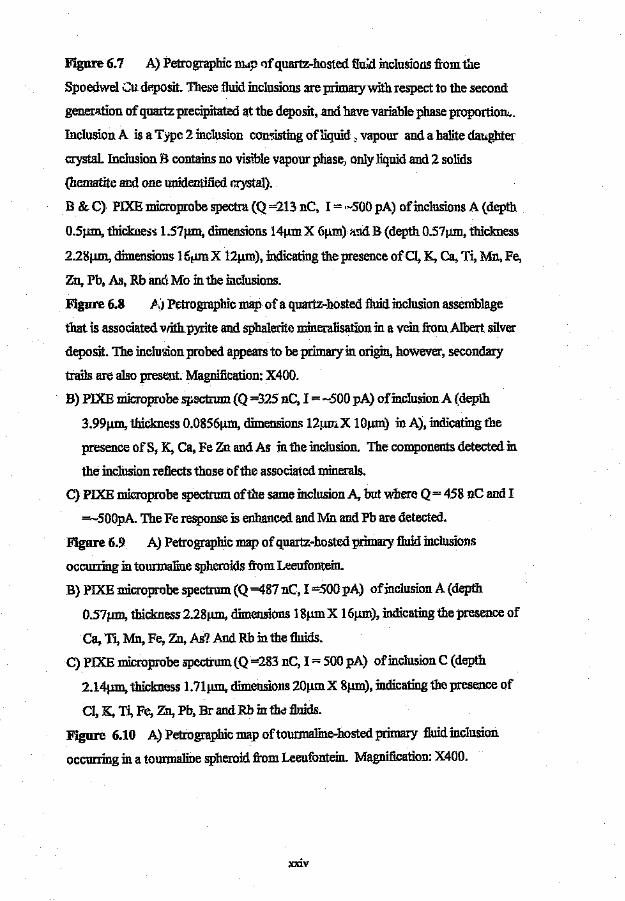
Figure 6.7 A) Petrographic DLlp of quartz-hosted flu~d inclusions from tile
Spoedwel ,::::udeposit. These fluid inclusions are primary with respect to the second
generation of quartz precipitated at the deposit, and have variable phase proportions.
Inclusion A is a Type 2 :inclusion consisting of liquid > vapour and a halite daughter
crystal. Inclusion 13 contains no visible vapour phase. only liquid and 2 solids
(hematite and one unidentified crystal).
B & C) PIXE microprobe spectra (Q =213 nC, I = ·~500 pA) of :inclusions A (depth
O.5Jlm, thickness 1.57Jlm, dimensions 14!lIDX 6!illl) lind B (depth O.57J.llD,thickness
2.28Jllll, dimensions l£,.unX 12!lID), indicating the presence of'Cl, K, Ca, Ti, Mn, Fe,
Zn, Pb, As, Rb anel Mo in the inclusions.
Figure 6.8 A) Petrographic map of a quartz-hosted fluid inclusion assemblage
that is associated with pyrite and sphalerite mineralisation ina vein from Albert silver
deposit. The inclusion probed appears to be primary in origin, however, secondary
trails are also present. Magnification: X400.
B) PIXE microprobe spectrum (Q =325 nC, I = ~500 pA) of inclusion A (depth
3.99J.UIl, thickness O.0856JllIl, dimensions 12JllILX 10J.l.m) inA), indicating the
presence o1'S, K, Ca, Fe Zn and As :inthe inclusion. The components detected in
the inclusion reflects those of the associated minerals.
C) PIXE microprobe spectrum of the same inclusion A, but where Q = 458 nC and I
=-500pA. The Fe response is enhanced and Mn and Pb are detected.
Figure 6.9 A) Petrographic map of quartz-hosted primary fluid inclusions
occurring in tourmaline spheroids from Leeufontein.
B) PIXE microprobe spectrum (Q =487 nC, 1=500 pA) of inclusion A (depth
0.57JlJD, thickness 2.28jlJD, dimensions 18!lIDX 16Jlm), indicating the presence of
Ca, Ti, Mn, Fe, Zn, As? And Rb in the fluids.
C) PIXE microprobe spectrum (Q =283 nC, 1= 500 pA) of inclusion C (depth
2. 14JlJD,thickness 1.71Jl1D,dimensions 20JlDlX Sum), :indicating the presence of
C~ K, Ti, Fe, Zn, Pb, Br and Rb in the fluids.
Figure 6.10 A) Petrographic map of'tourmaline-hosted primary fluid inclusion
occurring in a tourmaline spheroid from Leeufontein. Magnification: X400.
xxiv
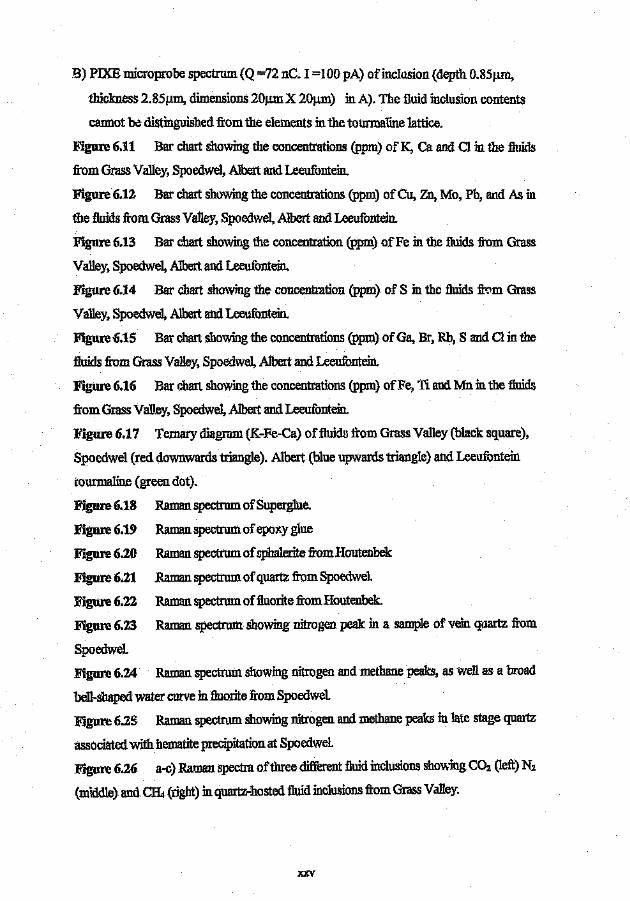
B) PIXE microprobe spectrum (Q ==72nCo 1=100 pA) of inclusion (depth O.851lffi,
thickness 2.851lID, dimensions 20llill X 20llm) in A). The fluid inclusion contents
cannot be distinguished from the elements in the tourmaline lattice.
Figure 6.11 Bar chart showing the concentrations (ppm) of K, Ca and Cl in the fluids
:from Grass Valley, Spoedwe1, Albert and Leeufontein.
Figure 6.12 Bar chart showing the concentrations (ppm) of Cu, Zn, Mo, Ph, and As in
the fluids from Grass Valley, Spoedwel, Albert and Leeufontein.
Figure 6.13 Bar chart showing the concentration (ppm) of Fe in the fluids from Grass
Valley, Spoedwel, Albert and Leeufontein.
Figure 6.14 Bar chart showing the concentration (ppm) of S in the fluids from Grass
Valley, Spoedwel, Albert and Leeufontein.
Figure 0.15 Bar chart showing the concentrations (ppm) of Ga, Br, Rb, S and Cl in the
fluids from Grass Valley, Spoedwel, Albert and Leeufontein.
Figure 6.16 Bar chart showing the concentrations (ppm) of Fe, Ti and Mn in the fluids
from Grass Valley, Spoedwel, Albert and Leeufontein.
:Figure 6.17 Ternary diagram (K-Fe-Ca) of fluids :from Grass Valley (black square),
Spoedwel (red downwards triangle). Albert (blue upwards triangle) and Leeufontein
tourmaline (green dot).
Figure 6.18 Raman spectrum of Super glue.
Figure 6.19 Raman spectrum of epoxy glue
F]gure 6.20 Raman spectrum of sphalerite from Houtenbek
Figure 6.21 Raman spectrum of quartz from Spoedwel
Figure 6.22 Raman spectrum of fluorite from Houtenbek.
Figure 6.23 Raman spectrum showing nitrogen peak in a sample of vein quartz from
Spoedwel,
Figure 6.24 Raman spectrum showing nitrogen and methane peaks, as well as a broad
bell-shaped water curve in fluorite from Spoedwel.
Figure 6.25 Raman spectrum showing nitrogen and methane peaks :in late stage quartz
associated with hematite precipitation at SpoedweL
Figure 6.26 a-c) Raman spectra of three different fluid inclusions showing C02 (left) N2
(middle) and CI4 (right) inquartz-hosted fluid inclusions from Grass Valley.
xxv
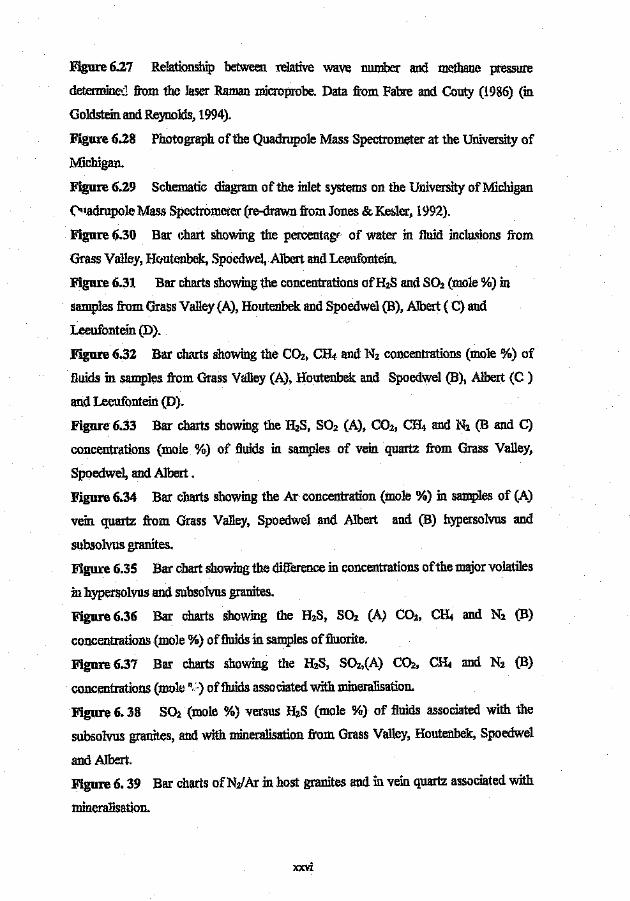
Figure 6.27 Relationship between relative wave number and methane pressure
determined from the laser Raman microprobe, Data from Fabre and Couty (1986) (in
Goldstein and Reynolds, 1994).
Figure 6.28 Photograph ofthe Quadrupole Mass Spectrometer at the University of
Michigan.
Figure 6.29 Schematic diagram of the inlet systems on the University of Michigan
01.adrupole Mass Spectrometer (re-drawn from Jones & Kesler, 1992).
Figure 6.30 Bar chart shewing the percentage of water in fluid inclusions from
Grass Valley, Houtenbek, Spoedwel, Albert and Leeufontein.
FiguI'e 6.31 Bar charts showing the concentrations ofRlS and SOl (mole %) insamples from Grass Valley (A), Houtenbek and Spoedwel (B), Albert (C) and
Leeufontein (D).
Figure 6.32 Bar charts showing the CO2, Cf4 and N2 concentrations (mole %) of
fluids in samples from Grass Valley (A), Houtenbek and Spoedwel (B), Albert (C )
and Leeufontein (D).
Figure 6.33 Bar charts showing the H2S, S02 (A), CO2, CB4 and 1'42 (B and C)
concentrations (mole %) of fluids in samples of vein quartz from Grass Valley,
Spoedwel, and Albert .
Figure 6.34 Bar charts showing the Ar concentration (mole %) in samples of (A)
vein quartz from Grass Valley, Spoedwel and Albert and (B) hypersolvus and
subsolvus granites,
Figure 6.35 Bar chart showing the difference in concentrations of the major volatiles
inhypersolvus and subsolvus granites.
Figure 6.36 Bar charts showing the H2S, S02 (A) CO2, C~ and N2 (B)
concentrations (mole %) of fluids in samples of fluorite.
Figure 6.37 Bar charts showing the H2S, SOz,(A) C02, C~ and Nz (B)
concentrations (molt: n) of fluids associated with mineralisation.
Figure 6. 38 S02 (mole %) versus H2S (mole %) of fluids associated with the
subsolvus granites, and with mineralisation from Grass Valley, Houtenbek, Spoedwel
and Albert.
Figure 6. 39 Bar charts ofNv'Ar in host granites and in vein quartz associated with
mineralisation.
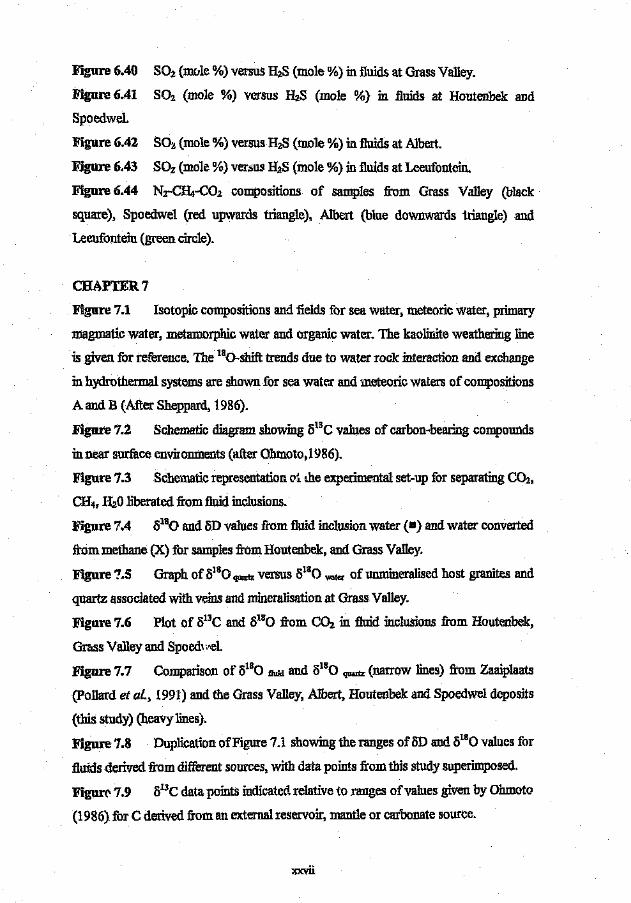
Figure 6040 S02 (mule %) versus HzS (mole %) in fluids at Grass Valley.
Figure 6.41 S02 (mole %) versus HlS (mole %) in fluids at Houtenbek and
SpoedweL
Figure 6.42 S02 (mole %) versus HzS (mole %) in fluids at Albert.
Figure 6.43 SOz (mole %) versus H2S (mole %) in fluids at Leeufontein,
Figure 6.44 Nz-CRt-C02 compositions of samples from Grass Valley (black
square), Spoedwel (red upwards triangle), Albert (blue downwards triangle) and
Leeufontein (green circle).
CHAPTER 7
Figure 7.1 Isotopic compositions and fields for sea water, meteoric water, primary
magmatic water, metamorphic water and organic water. The kaolinite weathering line
is given for reference. The 180_shift trends due to water rock interaction and exchange
in hydrothermal systems are shown for sea water and meteoric waters of compositions
A and B (After Sheppard, 1986).
Figure 7.2 Schematic diagram showing o13e values of carbon-bearing compounds
in near surface environments (after Ohmoto, 1986).
Figure 7.3 Schematic representation (Ii ihe experimental set-up for separating CO2,
CH4, H20 liberated from fluid inclusions.
:Ii'igure 7.4 (5180 and (5Dvalues from fluid inclusion water (II) and water converted
from methane (X) for samples from Houtenbek, and Grass Valley.
Figure 7.5 Graph of (5180 quartz versus (5180 ""let of umnineralised host granites and
quartz associated with veins and mineralisation at Grass Valley.
Figure 7.6 Plot of s=c and 0180 from CO2 in fluid inclusions from Houtenbek,
Grass Valley and Spoef "d.
Figure 7.7 Comparison of 0180 fluid and 0180 quartz (narrow lines) from Zaaiplaats
(Pollard. et al., 1991) and the Grass Valley, Albert, Houtenbek and Spoedwel deposits
(this study) (heavy lines).
Figure 7.8 Duplication of Figure 7.1 showing the ranges of oD and (5130 values for
fluids derived from different sources, with data points from this study superimposed.
Figure 7.9 aBC data points indicated relative to ranges of values given by Ohrnoto
(1986) for e derived from an external reservoir, mantle or carbonate source.
xxvii
CHAPTERS
Figure 8.1 Proposed model for the evolution of the Bushveld granites and the
associated mineralisation.

LIST OF TABLES
Table 1.1 Analytical techniques employed to test the hypothesis.
Table 2.1 Age determinations relevant to the Transvaal Supergroup (from
Walraven, 1997). Ages in bold print are the best current age estimates according to
Walraven (1997).
Table 2.2 Lithostratigraphic subdivisions of the Bushveld Complex according to
SACS (1980), and Walraven (1997). Ages in bold print are the best current age
estimates according to Walraven (1997).
Table 2.3 Compilation of existing geochronological data for the Lebowa Granite
Suite.
Table 3.1
Table 4.1
Mineral assemblages inthe ores of the acid phase (from Crocker, 1979).
Summary of paragenetic sequence at Grass Valley (after Wagner, 1921).
Table 5.1 Eutectic temperatures for various chemical systems. From Sheppard et
al, (1985) and *Reynolds (1991).
Table 5.2
1984).
Table 5.3
selection,
Table 5.4
List of micro thermometric terms and abbreviations used (after Roedder,
L1&of samples selected from Grass Valley and the reasons for their
List of samples selected for microtherrnometry from Spoedwel, and the
Table 5.5
reasons for th~~\. selection.
List of samples selected for microthermometry from Dronkfontein, and
the reasons for their selection.
Table 5.il) List of samples selected for microthermometry from Albert, and the
reasons for their selection.
Table 5.7 List of samples selected for microthermometry from Leeufontein, and
the reasons for their selection.
Table 5.8 Table summarising the characteristic features of the fluids associated
with quartz generations 1,2 and 3 at Spoedwel.
Table 5.9 Tabulation offluid characteristics associated with the subsolvus Verena
granite, hosting mineralisation at Albert silver deposit.
xxix

Table 5.10 Table comparing the fluids associated with deposition of minerals in
each of the mineral assemblages.
Table 6.1 Table of sample material selected for PIXE analysis from Spoedwel,
Albert, Grass Valley and Leeufontein.
Table 6.2 Expected and observed values for Cl and K from synthetic fluid inclusions.
Table 6.3 Quantitative PIXE yields (ppm) of samples from Grass valley
(GV022A, GV022C), Spoedwel (OFA, OFB), Albert (RPIIA) and Leeufontein
(TBOIB1, TBOIB13, TBOIA).
Table6.4
Houtenbek.
Table 6.5
Table 6.6
Table 6.7
Samples selected for Raman analysis from Spoedwel, Grass Valley and
Table showing components of each fluid inclusion analysed.
Methane peak positions and the corresponding methane pressure.
List of samples chosen for QMS from Grass Valley, SpoedweI, Albert,
Leeufontein and Houtenbek.
TobIe7.1 List of samples chosen for isotopic analysis of fluid inclusion
decrepitates.
Table 7.2 List of samples chosen for oxygen isotope analysis of quartz.
Table 7.3 Stable isotopic data for 8180 and 8D from fluid inclusion water and
methane.
Table 7.4 8180(quartz)and 8180 (fluid) values for quartz. 8180 (fluid) %0 values were
calculated using the equations of Clayton et al. (1972) and Matsuhisa et al. (1979) for
T= 300°C.
Table 7.5 013e and 0180 from CO? in fluid inclusions from Houtenbek, Grass
Valley and Spoedwel.
xxx
CHAPTERl
INTRODUCTION
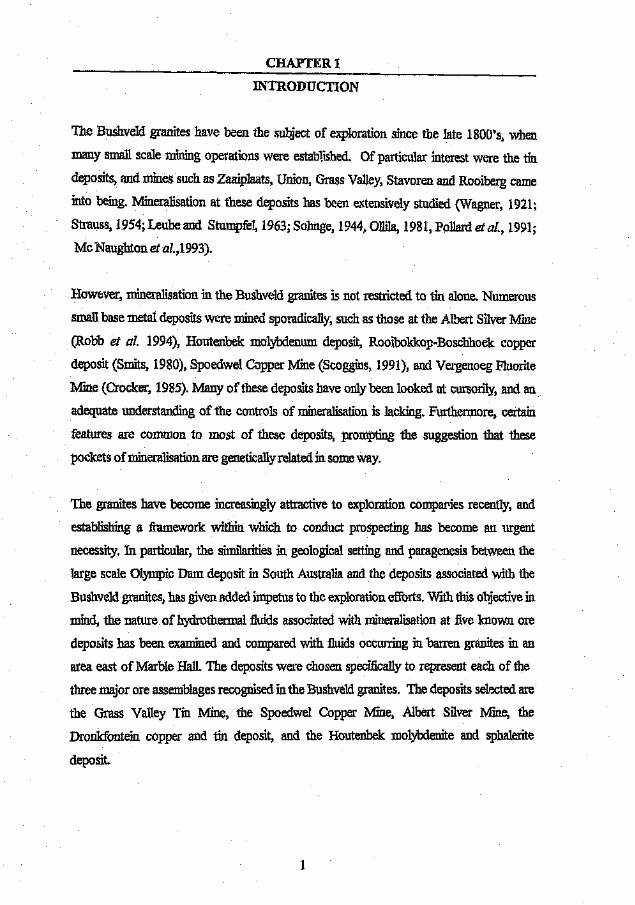
The Bushveld granites have been the subject of exploration since the late 1800's, when
many small scale mining operations were established. Of particular interest were the tin
deposits, and mines such as Zaaiplaats, Union, Grass Valley, Stavoren and Rooiberg came
into being. Mineralisation at these deposits has been extensively studied (Wagner, 1921;
Strauss, 1954; Leube and Stumpfel, 1963; Sohnge, 1944, Ollila, 1981, Pollard et al., 1991;Me Naughton et a1.,1993).
However, mineralisation in the Bushveld granites is not restricted to tin alone. Numerous
small base metal deposits were mined sporadically, such as those at the Albert Silver Mine
(Robb et al. 1994), Houtenbek molybdenum deposit, Rooibokkop-Boscbhoek copper
deposit (Smits, 1980), Spoedwel Copper Mine (Scoggins, 1991), and Vergenoeg Fluorite
Mine (Crocker, 1985). Many of these deposits have only been looked at cursorily, and an
adequate understanding of the controls of mineralisation is lacking. Furthermore, certain
features are common to most of these deposits, prompting the suggestion that these
pockets of mineralisation are genetically related in some way.
The granites have become increasingly attractive to exploration companies recently, and
establishing a framework within which to conduct prospecting has become an urgent
necessity. In particular, the similarities in. geological setting and paragenesis between the
'large scale Olympic Dam deposit in South Australia and the deposits associated with the
Bushveld granites, has given added impetus to the exploration efforts. With this objective inmind, the nature of hydrothermal fluids associated with mineralisation at five known ore
deposits has been examined and compared with fluids occurring in barren granites in an
area east of Marble Hall The deposits were chosen specifically to represent each of the
three major ore assemblages recognised in the Bushveld granites. The deposits selected are
the Grass Valley Tin Mine, the Spoedwel Copper Mine, Albert Silver Mine, the
Dronkfontein copper and tin deposit, and the Houtenbek molybdenite and sphalerite
deposit.
The deposits at Grass Valley, Albert, Spoedwel and Dronkfontein have several features in
common; they are all fracture related, hydrothermal replacement-type deposits, showing
similar parageneses but different principal ore minerals. At Houtenbek and Dronkfontein,
detailed geological mapping is yet to be undertaken, but, at first sight, the mineralisation
appears similar to the other deposits. At Grass Valley, tin dominates, while at Spoedwel, a
copper sulpbide assemblage dominates, and at Albert a hematite-fluorite-pitchblende
assemblage is well developed. Paragenetic relationships show that these three assemblages
represent temporally separate events, and thus, form the basis of the proposed hypothesis
for mineralisation. The fluids associated with each of these assemblages have been
examined, revealing an evolution in the nature of the fluids as a function of time,
temperature and source.
1.1 THE HYPOTIIESIS
The hypothesis proposed for the origin of mineralisation ismultifaceted, encompassing both
spatial and temporal relationships between at least three episodes of ore formation (Figure
1.1). The first episode of mineralisation (typified by the Zaaiplaats tin deposit) occurred at
relatively high temperatures (>600°C to 400° C), and resulted in the formation of
orthomagmatic cassiterite, scheelite, wolframite and moly1xlenite. At lower temperatures
(200°C<T<400°C), where processes where essentially fluid dominated, a mesothermal Cu-
Pb-Zn-As-Ag-Au assemblage was deposited (represented mainly at the Spoedwel,
Bosehhoek and Albert deposits). A third episode of mineralisation resulted in the formation
of an Fe-U-F assemblage, and is recognised at several, but not necessarily all, of the
deposits examined (for example, the Albert silver deposit). The extended nature of this
three-stage paragenetic sequence is considered to reflect widespread mixing between an
early fluid derived by H20-&dturation ofthe granitic magma and an externally-derived fluid,
circulation of which was stimulated by the long-lived high heat-productive capacity of the
Bushveld granites, as well as exhumation of the metallotect. A similar hypothesis was
suggested by Robb et at. (1994), in a study of mineralisation at the Albert Silver Mine.
However, the general applicability of the model to mineralisation in the Bushveld granites
was not tested, and only preliminary studies of the fluid characteristics had been conducted.
2
The present study aims to test and refine the model proposed by Robb et al. (1994), and, in
light oftbis hypothesis, to determine the relationships between various polymetallic deposits
in the eastern lobe of the Bushveld Complex.
1.2 METHODOLOGY
Several analytical techniques were employed in order to gain an insight into the nature of
the mineralising fluids. Initially, the fluid inclusions from the Spoedwel deposit were
investigated, using conventional microthermometric techniques, Raman spectrometry, and
PIXE analysis. At that early stage, indications of an external meteoric and/or connate
component in the fluids were recognised, prompting further investigation as to the general
applicability of fluid mixing as a mechanism for the precipitation of ore minerals in the
eastern lobe of the Bushveld Complex. Consequently, the above mentioned working
hypothesis served as a guide in cboosing analytical techniques, aimed at verifying the
notion. The analytical techniques employed in this study are briefly summansed in Table
1.1, and are shown in the flow diagram (Figure 1.2) detailing methods and procedures.
Detailed fluid inclusion microthermometry for all the deposits was undertaken, and stable
isotopic signatures and gas chemistry of fluid inclusion contents were analysed.
Time
300
Zaaiplaats Sn~W1:--------;------:---;------:;>'1orthomagmaticSn
Temperature (DC)
Grass Valley Snhydrothermal Sn andsulphide assemblage
200
Figure 1.1 Diagrammatic representation of the hypothesis proposed for
mineralisation in the granites ofthe eastern lobe of the Bushveld Complex.
3
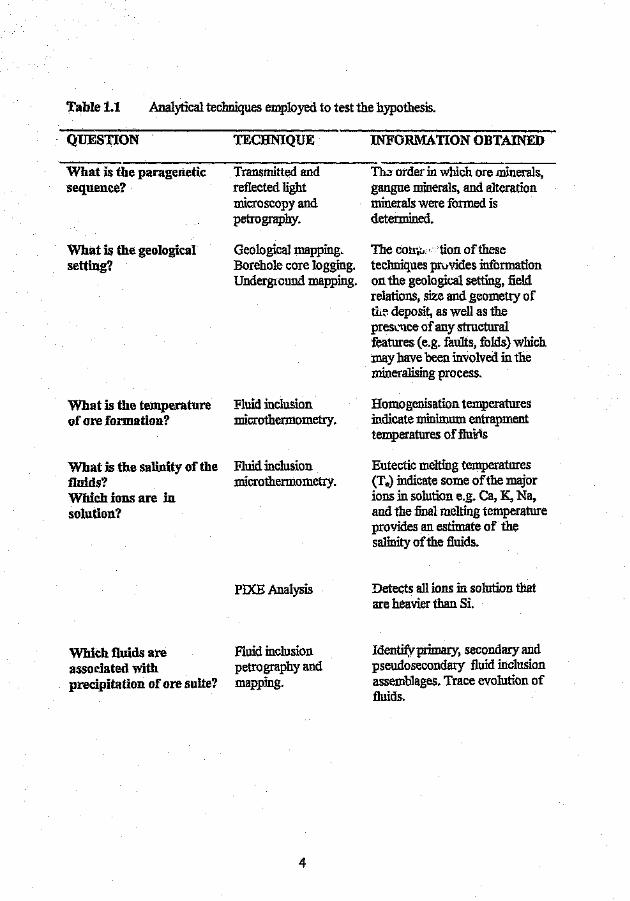
Table 1.1 Analytical techniques employed to test the hypothesis.
QIJESTION TECHNIQUE INFORMATION OBTAINED
What is the parageneticsequence?
What is the. geologicalsetting?
What is the temperatureof ore formation?
What is the salinity of thefluids?Which ions are insolution?
Which fluids areassociated withprecipitation of ore suite?
Transmitted andreflected lightmicroscopy andpetrography.
Geological mapping.Borehole core logging.Underground mapping.
Fluid inclusionmicrothermometry,
Fluid inclusionmicrothermometry.
PIXE Analysis
Fluid inclusionpetrography andmapping.
4
Th.3 order in which ore minerals,gangue minerals, and alterationminerals were formed isdetermined.
The couu, tion of thesetechniques provides informationon the geological setting, fieldrelations, size and geometry ofthe deposit, as well as thepresence of any structuralfeatures (e.g, faults, folds) whichmay have been involved in themineralising process.
Homogenisation temperaturesindicate minimum entrapmenttemperatures of fhiirts
Eutectic melting temperatures(Te) indicate some ofthe majorions in solution e.g. Ca, 1(,Na,and the final melting temperatureprovides an estimate of thesalinity of the fluids.
Detects all ions in solution thatare heavier than Si,
Identify primary, secondary andpseudo secondary fluid inclusionassemblages. Trace evolution offluids.
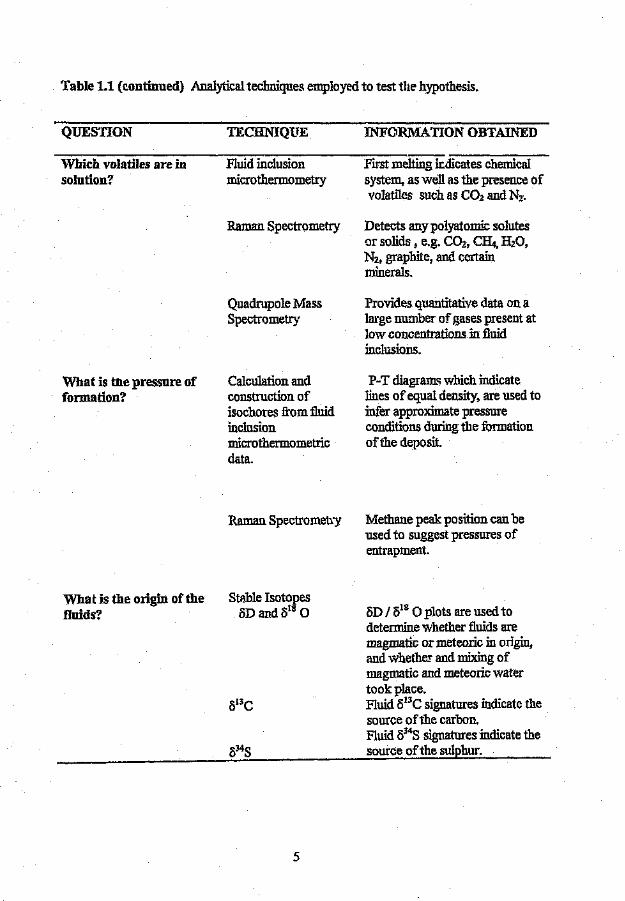
Table 1.1 (continued) Analytical techniques employed to test the hypothesis.
QUESTION
Which volatiles are insolution?
What is tile pressure offormation?
What is the origin of thefluids?
TECHNIQUE
Fluid inclusionmicrothermometry
Raman Spectrometry
Quadrupole MassSpectrometry
Calculation andconstruction ofisochores from fluidinclusionmicro thermometricdata.
Raman Spectrometry
Stable Isotopes8D andolS 0
INFORMATION OBTAINED
First melting indicates chemicalsystem, as well as the presence ofvolatiles such as COl and Nz.
Detects any polyatomic solutesor solids; e.g. C02, Cf4, H20,Nz, graphite, and certain.minerals.
Provides quantitative data on alarge number of gases present atlow concentrations in fluidinclusions.
P-T diagrams which indicatelines of equal density, are used toinfer approximate pressureconditions during the formationof the deposit.
Methane peak position can beused to suggest pressures ofentrapment.
oD / (518 °plots are used todetermine Whether fluids aremagmatic or meteoric in origin,and whether and mixing ofmagmatic and meteoric watertook place.Fluid s=c signatures indicate thesource of the carbon,Fluid 034S signatures indicate thesource of the sulphur.
5
Collect samples
Prepare polished thin sections anddoubly polished thin sections
I
Gangue minerals"' __ ",:.:.-___ Alteration Minerals and assemblages
,......._~ ----'-"_. _. ~~~_p_a_ra_g_e ..ne..ti,.c..seiiiiq_unen_c_e__ ..
FLUID INCLUSION PETROGRAPHY
Map fluid inclusion assembla~
t :s:FLUID
INCLUSIONANA1,YSIS
Examine polished thin sections.
Identify and mark areas of interest.
IMICROTh.~:lMOMEiiif ANALYTICALT.ECHNIQUES
'PIXEANALYSIS ,/-rI
,....._"--_~Y--~----,QUADRtJ POLE MASSSPECTROMETRY
MINERALPETROGRAPHY
Ore minerals
SYNTHESIS&
MODEL
RM1ANSPECTROSCOPY
STABLE ISOTOPES
Figure 1.2 Flow diagram showing the format of tnis thesis, and the analytical
techniques used to test the hypothesis.
6
Field mapping in the area east of Marble Hall was undertaken in order to obtain
sufficient knowledge of the nature of unmineralised Bushveld granites, and so be able
to recognize features associated with the deposition of ore minerals. A consistent
research procedure Wf;1S adopted for examining the unmineralised granites, as well as
the mineralised granites. Thus, comparisons between the various deposits and the
unmineralised granites could be easily drawn. In each case, thorough Petrographic
studies of the samples were carried out, and, hence, suitable samples selected for fluid
inclusion petrography and microthermometry, Once microthermometric data had been
collected and fluid assemblages recognized, samples were then prepared for PIXE
analysis, Raman spectroscopy, quadrupole mass spectrometry and isotopic analysis.
Wherever possible, the same samples were examined using the different techniques, so
that a comprehensive database, including all components of a particular fluid inclusion
assemblage, could be constructed.
In the chapters that follow, the evidence gathered fivm each analytical technique is
presented, and discussed. Inthe final chapter, the data are integrated and a model for
the mineralisation put forward.
7

CHAP1'ER2
GEOLOGICAL SETTING
2.1. REGIONAL GEOLOGY - the Bushveld Complex
The Bushveld Igneous Complex is early Proterozoic in age and is situated within the
Kaapvaal Craton, South Africa (Figure 2.1). The mafic and ultramafic units (Rusteuberg
Layered Suite), the felsic rocks (Lebowa Granite Suite) and the granophyres (Rashoop
Granophyre Suite), are intruded into the sedimentary rocks of the Transvaal Sequence and
form the largest known A-type igneous province in the wor+l (Kleemann and Twist,
1989). According to Hunter (1976), the intrusion covers an area of approximately 67
340km.2, but more recent estimates of the volume of'rock preserved suggest a minimum of
300 OOOkrrf(Cawthorn and Walraven, 1997).
26· 30·
30'
40 !un 80-l.~bo\VaGranlle SuiteRustenburg Layered SuiteRsshoop Granophyra Suite .
~Transvaal Suporgrpup (axel. RooJberg).r=-
Rooiberg Grpup
26 • 30·
Figure 2.1 Regional geological map of the Bushveld Complex (modified from
Walraven, 1997).
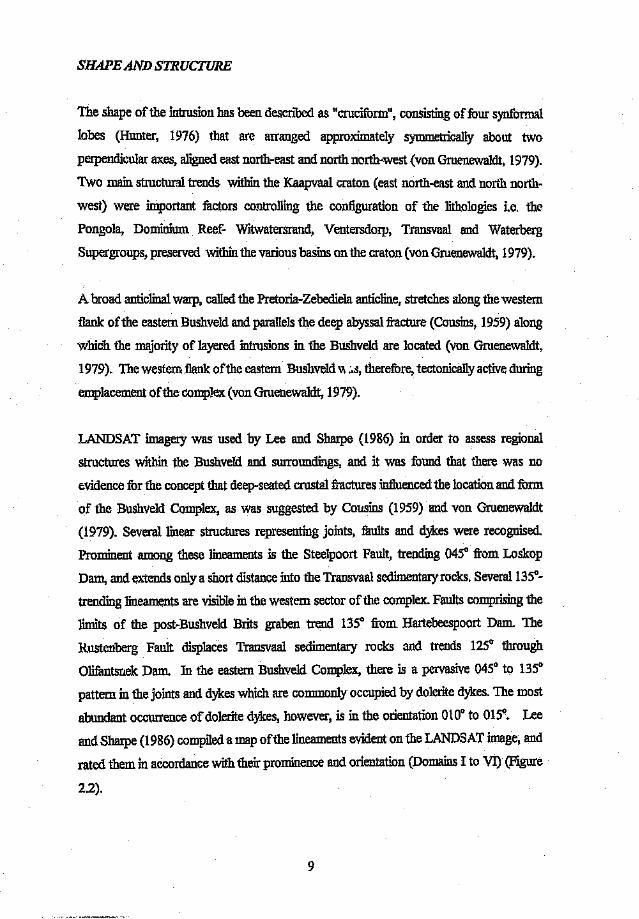
SHAPE AND STRUCTURE
The shape of the intrusion has been described as "cruciform", consisting offour synformal
lobes (Hunter, 1976) tbat are arranged approximately symmetrically about two
perpendicular axes, aligned east north-east and north north-west (von Gruenewaldt, 1979).
Two main structural trends within the Kaapvaal craton (east north-east and north north-
west) were important factors controlling the configuration of the lithologies i.e. the
Pongola, Dominium Reef- WItwatersrand, Ventersdorp, Transvaal and Waterberg
Supergroups, preserved within the various basins on the craton (von Gruenewaldt, 1979).
A broad anticlinal warp, called the Pretoria-Zebedie1a anticline, stretches along the western
flank of the eastern Bushveld and parallels the deep abyssal fracture (Cousins, 1959) along
which the majority of layered intrusions in the Bushveld are located (von Gruenewaldt,
1979). The western flank of the eastern Bushveld VI .:.s, therefore, tectonically active during
emplacement of the complex (von Gruenewaldt, 1979).
LANDSAT imagery was used by Lee and Sharpe (1986) in order to assess regional
structures within the Bushveld and surroundings, and it was found that there was no
evidence for the concept that deep-seated crustal fractures :influencedthe location and form
of the Bushveld Complex, as was suggested by Cousins (1959) and von Gruenewaldt
(1979). Several linear structures representing joints, faults and dykes were recognised.
Prominent among these lineaments is the Steelpoort Fault, trending 0450 from Loskop
Dam, and extends only a short distance into the Transvaal sedimentary rocks. Several 135°_
trending lineaments are visible in the western sector of the complex. Faults comprising the
limits of the post-Bushveld Brits graben trend 1350 from Hartebeespoort Dam The
Rustenberg Fault displaces Transvaal sedimentary rocks and trends 1250 through
Olifantsnek Dam In the eastern Bushve1d Complex, there is a pervasive 0450 to 1350
pattern in the joints and dykes which are commonly occupied by dolerite dykes. The most
abundant occurrence of dolerite dykes, however, is in the orientation 0100 to 015°. Lee
and Sharpe (1986) compiled a map of the lineaments evident on the LANDSAT image, and
rated them in accordance with their prominence and orientation (Domains I to VI) (Figure
2.2).
9

l!
'"s 51ffij~~ "'....ww E a ~
55~ 0;;
'" 10~~~ u
5 ~ lil~·<I(W a:.,.J:Ecl ,. '"I IID-+c s
n.
"
Figure 2.2 Lineament map showing aeromagnetic lineaments and gravity highs «70mgals). Prominent geological features and lineament domains are indicated (from Lee
and Sharpe, 1986).
10
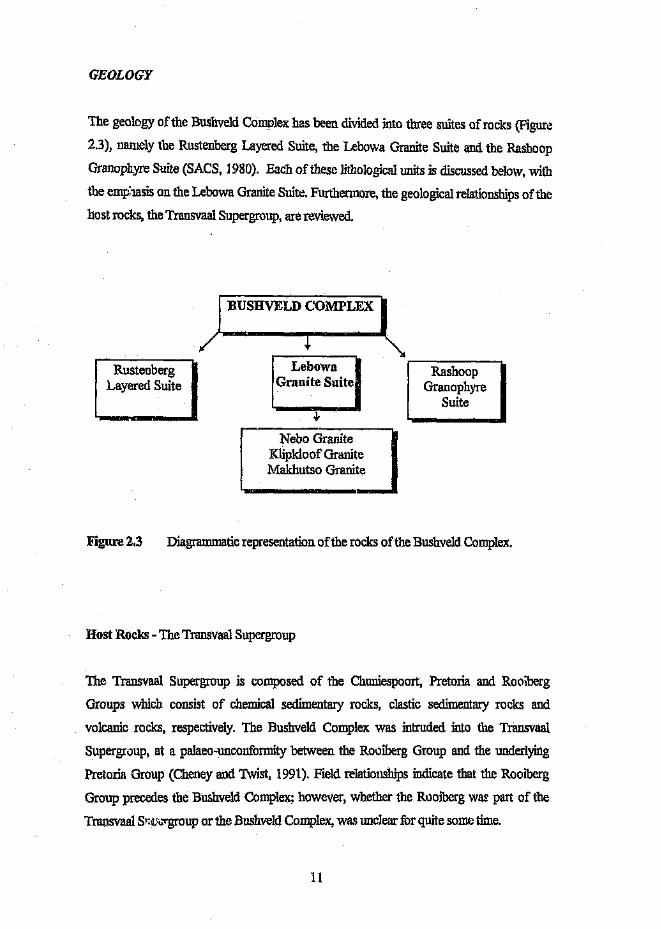
GEOLOGY
The geology of the Bushveld Complex has been divided into three suites of rocks (Figure
2.3), namely the Rustenberg Layered Suite, the Lebowa Granite Suite and the Rashoop
Granophyre Suite (SACS, 1980). Each of these lithological units is discussed below, with
the emp'iasis on the Lebowa Granite Suite. Furthermore, the geological relationships of the
host rocks, the Transvaal Supergroup, are reviewed.
BUSHVELD COMPLEX
RashoopGranophyre
Suite
RustenbergLayered Suite
LebowaGranite Suite
Nebo GraniteKlipkloof GraniteMakhutso Granite
Figure 2.3 Diagrammatic representation of the rocks of the Bushveld Complex.
Host Rocks - The Transvaal Supergroup
The Transvaal Supergroup is composed of the Chuniespoort, Pretoria and Rooiberg
Groups which consist of chemical sedimentary rocks, clastic sedimentary rocks and
volcanic rocks, respectively. The Bushveld Complex was intruded into the Transvaal
Supergroup, at a palaeo-unconformity between the Rooiberg Group and the underlying
Pretoria Group (Cheney and Twist, 1991). Field relationships indicate that the Rooiberg
Group precedes the Bushveld Complex; however, whether the Rooiberg was part of the
Transvaal S'ilL',,-rgrOUPor the Bushveld Complex, was unclear for quite some time.
11
At one stage, the Rooiberg felsites were placed within the Bushveld Complex, as the
precursor to the major magma injection (Twist, 1985). However, the consensus now is that
the Rooiberg felsites represent the final stage of volcanic activity in the development of the
Transvaal basin (Eriksson et al., 1993; Walraven, 1997).
The Rooiberg Group is a thick succession of acid volcanic rocks which OCCUi ',;1foughout
the Transvaal sedimentary basin and forms the upper third of the Transvaal Supergroup
(Eriksson et al., 1993). It consists of dacite flows, rhyodacite lava, and, in places, silicic
andesites. It varies from rhyodacite at the base to rhyolitic at the top (Walraven, 1997).
Twist (1985) recognised three felsite magma types, which were probably generated during
deep crustal anatexis, as the mafic magmas began their ascent from the mantle. Two
formations are recognised in the eastern and central Transvaal basin; they are the lower,
rhyodacitic Damwal Formation and the upper rhyolitic Selons River Formation. The Selons
River Formation has beer. subdivided into the lower Doornkloof Member and the upper
Klipnek Member. The Selons River Formation extends basin wide but, in the western part
of the basin, in the Rooiberg area, the two members are given formation status and are
called the Kwaggasnek and Schrikkloof'Formations (SACS, 1980; Eriksson et al., 1993).
The Bushveld Complex
Itashoop Granophyre SuiteThe Rashoop Granophyre Suite is the first of the Bushveld Complex lithologies and occurs
mainly as a sheet intruded into the Rooiberg Felsite Group, as well as between the Nero
and Transvaal Sequence rocks (Kleemann, 1985). The granophyres are include ..I in the
Bushveld Complex ~<:)ACS,1980), but are generally allied more closely with the pre-
Bushveld Rooiberg Group (Walraven 1987), Kleemann (1985) noticed intrusive
relationships between the mafic Rustenberg Layered Suite and the Stavoren granophyres.
indicating that the mafic suite post-dates the granophyre.
The granophyre is relatively homogeneous and displays a range of colours from brick-red
to grey. The granophyres are composed ofrough1y equal proportions of quartz and feldspar
which become finer-grained towards the top of the sheet (Kleemann, 1985). Kleemann
(1985) maintains that the Rashoop Granophyre probably crystallised from a partial melt
12
extracted from the felsites on metamorphism by the Rustenberg Layered Suite. Walraven
(1985, 1997) interpreted the bulk of the granophyric rocks (Stavoren Granophyre) as
resulting from shallow intrusion of acid magmas immediately following, and forming a
plutonic extension of; the Rooiberg Group volcanic event.
Other granophyre types are linked to the Bushveld granites and the basic layered r icks, and
were formed 'Jy metamorphism of Rooiberg Group Volcanics or Pretoria Group
sedimentary rocks, or by differentiation and assimilation of acid material by the basic
layered rocks (Diepkloof Granophyre) (Walraven,1997). Three formal granophyre units
were given by SACS (1980), namely the Stavoren Granophyre, the Rooikop Granophyre
Porphyry, and the Zwartbank Pseudogranophyre, The Stavoren Granophyre includes all
true granophyres, which are fairly coarse-grained and consist of intergrown quartz and K-
feldspar. The Rooikop Granophyre Porphyry occurs as sill-like intrusions in the Rooiberg
felsite and the LoSKOP Formation (Transvaal Supergroup), and consists ofK-feldspar and
quartz phenocrysts in a fine-grained granophyric matrix. The Zwartbank Granophyre
consists of irregular quartz-feldspar intergrowths.
Rustenberg Layered Suite
The genesis of the Rustenberg Layered Suite has long been the subject of debate, but the
general consensus is that magma mixing was involved in its evolution (von Gruenewaldt et
al., 1985). Cawthorn and Walraven (1997) maintained that the mafic layered rocks are the
product of multiple magmatic injections, some of which are comparable to previous
magmas, and others which are of a different composition.
The Rustenberg Layered Suite forms the lowermost unit of the Bushveld Complex and is
subdivided into four stratigraphic units, from the base upwards, the Lower, Critical, Main
and Upper Zones (von Gruenewaldt, 1973).
The Lower Zone is composed of a layered sequence of barzburgite to orthopyroxenite
cyclic units (Teigler, 1990 in Kruger, 1994). The Lower Critical Zone is characterised by
orthopyroxenite with lesser barzburgite and the Upper Critical Zone by orthopyroxenite,
norite, and anorthosite (Teigler, 1990 in Kruger, 1994). The Critical Zone is characterised
by major chromite layers. Cawthorn and Walraven (1997) have modelled the formation of
13
the Lower and Critical Zones in terms of six magma pulses, each one kilometre thick
which underwent 20% differentiation prior to the addition of the next pulse. The
calculations of Cawthorn and Walraven (1997) show that the entire Lower and Critical
Zones accumulated in about 25 000 years.
The lower Main Zone consists of chromite deficient norites and in the upper part of this
zone, gabbronorite becomes the dominant rock type. The Upper Main Zone is chemically
differentiated and consists of homogeneous gabbronorite. The base of the Upper Zone is
referred to as the 'Pyroxenite Marker', and this is followed by a highly differentiated
sequence of norite, gabbronorite, ferro gabbronorite, and ferrodiorite interlayered with
numerous layers of anorthosite, ferrodunite, titaniferous magnetite and apatite (Kruger,
1994),
Cawthorn and Walraven (1997) suggest that addition of2km of magma occurred at the top
of the Critical Zone, and the Lower Main Zone was calculated to have formed in a further
35 000 years. Major addition of magma then occurred at the level of the Pyroxenite
Marker, and is considered to be the last injection of magma into the Complex.
Lebowa Granite Suite
The Lebowa Granite Suite represents the final stage in the evolution of the Bushveld
Complex. Inthe literature it is commonly described as a "sheet-like intrusion c. f batholithic
dimensions" (von Gruenewaldt, 1979). Strauss (1954) recognised a zonation in the 2-3km
thick, gently dipping, sill-like pluton. Subsequent work has shown that the sheet has avariable thickness (~2.5-3.5km), covering an area of at least 30 OOOkm2 and dipping
centripetally towards the centre of the Complex at angles less than 10°. The sheet is buckled
and exposes inliers of the underlying sedimentary rocks, such as the Marble Hall Fragment
(Kleemann and Twist, 1989).
The nomenclature of the Bushveld granites has evolved since the first description of the
"Red Bushveld" granite (Molengraaf, 1901). Since then, it has been called the Red Granite
(Merensky, J909), the Bushveld Granite (Hall, 1906) and the Main Granite (Strauss and
'Iruter, 1944; Strauss, 1954). The Main Granite was renamed when detailed mapping
elucidated differences between the granite in the eastern and western portions of the
14
Bushveld Complex, and the local terms Veekraa1, Sekhukhuni, Magnet Heights, Steelpoort
Park and Verena granites were introduced.
The Bushveld granites were collectively referred to as the Lebowa Granite Suite by Coertze
et at. (1978), and formed the basis of the SACS (1980) terminology for the Bushveld
granites. SACS (1980) recognised seven categories of granite in the Lebowa Granite Suite,
namely the Nebo Granite, the Verena Porphyritic Granite, the Klipkloof Granite, the
Bobbejaankop Granite, the Lease Granite, the Balmoral Granite, and the Makhntso
Granite. Other names, such as the Red Granite, Sekhukuni Granite, Steelpoort Park
Granite, Magnet Heights Granite and Veekraal Granite, have been. incorporated in the
Nebo Granite category, since they are identical in appearance, mineralogy, chemistry and
age (Walraven and Hattingh, 1993).
In addition, the Bobbejaankop and Lease Granites, which are local terms for the coarse-
and fine-grained granites at the Zaaiplaats Mine, and which have been informally adopted
by many geologists in other areas of the Bushveld, have been recognised as varieties of the
Nebo Granite (Pollard et al., 1991). Walraven and Hattingh (1993), however, consider the
Bobbeiaankop, and Lease, as well as a variety of other granites named in the literature
(Klipkloof Foothills and Klipvoor Granites), as differentiates from the Nebo Granite
magma. The term Klipkloof Granite has been adopted for the :fine-grained aplitic granite
which occurs as dykes and sillswithin the upper portions of the Nebo Granite and in the
overlying granophyric roof rocks. Thus, the terms Nebo and Klipldoof Granite have
replaced the numerous synonymous terms in the literature.
The Verena Porphyritic Granite differs from the Nebo Granite in that it contains rapakivi-
textured feldspar phenocrysts, and the fine-grained equivalent contains atypical trace
element chemistry (Walraven and Hattingh, 1993). It is shown in subsequent chapters that
the nature of this granite is completely different to the Nebo Granite and justly deserves a
category of its own. The Makhutso Granite is younger than the Nebo and Klipkloof
Granites and is placed in a separate category. Thus, the Lebowa Granite Suite is currently
composed of the Nebo Granite, the Klipldoof Granite and the Makhutso Granite. The
position of the Verena Porphyritic Granite and the Balmoral granite is yet to be determined.
15
Nebo Granite
The Nebo Granite forms the bulk of the granite of the Lebowa Granite Suite. It is a coarse-
grained, hypersolvus granite which is composed mainly of quartz and perthite, and normally
interstitial hydrous mafic pbases (biotite). A well developed mineralogical and chemical
zonation exists in the Nebo Granite; from the base to the top there is an increasing albite
component of the plagioclase, increasing Al'Si ordering in alkali feldspars, increasing quartz
and perthite contents, decreasing plagioclase and hornblende contents, increasing SL K and
Rb, and decreasing Fe, T~ Ca, P, Ba, Sr, and Zr (Kleemann and Twist, 1989).
Klipkloof Granite
According to Kleemann and Twist (1989), the Klipldoof Granite is composed of three
facies, namely, the Coarse, Fine, and Albitised Klipkloof Granites. These facies are
comagmatic and have a similar mineralogy to the Nebo Granite, except that they are more
evolved and commonly aplitic. The Klipkloof Granite contains a greater proportion of
secondary and hydrothermal phases.
Kleemann and Twist (1989) suggest that the fine-grained KJipkloof is the result of
quenching through pressure release, and concomitant volatile loss during incipient
fracturing of the cooling body. It forms narrow dykes and sills intruding Nebo and other
Klipkloof intrusions and corresponds to th,; Lease Granite. The coarse-grained KJipk100f is
interpreted as forming in the transitional zone between the water saturated (above) and
undersaturated (below) zones near the ro.if of the magma chamber. It represents the
hydrothermally altered roof facies of the Nebo Granite and resembles the Bobbejaankop
Granite at Zaaiplaats, The albitised Klipkloof is a typical aplite that has been subject to
intense Na-silicate metasomatism (Kleemann and Twist, 1989).
The Klipkloof Granite was described by SACS (1980) as a medium- to fine-grained,
porphyritic granite which forms dykes and sills in the Nebo Granite, and may also be
developed between the Nebo Granite and the country rocks. The SACS (1980) description
of the Lease granite differs slightly from that of the Klipkloof Granite, and is referred to as
a fine-grained aplitic granite characterised by coarse pegmatitic patches. It is typically
developed along the margin ofthe Nebo Granite (SACS, 1980).
16
The Bobbejaankop Granite was described as a coarse-grained, red, biotite granite which
may be partially or completely altered, and 'l'hich appears to be developed in the higher
levels of the intrusion.
From the descriptions of the Lease and Klipkloof Granites, it is apparent that quenched
marginal Nebo Granite, as well as late stage, aplitic dykes and sills, are currently classified
as the same rock type. A distinction between these two modes of occurrence should temade, since detailed petrographical studies (see Chapter 4) have revealed that they are two
different granite types. Furthermore, the fine-grained quenched margins of the Verena
Porphyritic Granite should be distinguished from true Klipkloof aplite and quenched Nebo
Granite.
Makhutso Granite
The Makhutso Granite represents the final phase of grani.ic intrusion in the Burhveid
Complex, and occurs as small dykes, stocks and gently dipping sills in the Nebo Granite
(SACS, 1980). 'The rock is white to pink and contains 10 to 15% fernie minerals, the
dominant mineral being biotite (altered to chlorite) (De Bruiyn, 1980). Trace element
geochemistry, particularly KlRb, BalSr ratios, Ba and Zr values are lower in the Makhutso
Granite than in the Nebo Granite. The outcrop is limited to the northern part of the Verena
Dome (Figure 2.4). This granite has received very little attention and, hence, reference
literature is lacking.
17

Figure 2.4
25'00'
E N 0
$HAL£~SANC5TON&!' c:J YOUNGeR COV~R
MAKl1UT50 h··:·:'\ eUSHvtLO QFl:AHlTE
HEBO ~J'r:LSITr./QR.tNOPHYR~ g-"i'···I}
I. PRIIIIS ANNA QUAIlT%In ,;'~':i,OOOF ROC"}··o·.ToOuR.'~I2. HARTEBEESTSPRUIT3. ZUSTERSHOEK COl,OMIT2: (:----1 FLOOR ROCXS
4. ROOIPOORT WEST - - 1s. ROOIPOOF.T EAST QUARr,z BRECCIA VI:IH ~
6. ALBERT7. KWARRI:::LAAGTE
3. VLAKLAAGTE Js. 90EI(ENH0t1T~Lr.Of'10. Ol!:. BRON. KLIPORIF';'II. HOUTEN8~1(• '.a. XLIPPLAATORIFT13. SPOEOWEL14. l)PONKFONTE'N ------- --~~
:~ ~~;~;ROt'lTEIN •.....;:_2_=_.-_.~_. .lI__c_S_c_~ ':._E ~_-;_;j_~_OO_'_O__ ,
/-' j. ! I
.J r:L.....
Complex, and known mineral occurrences (from Scoggins, 1991).
Geological map ShOwL'.']gracite plutons in the eastern lobe of the Bushvekl
18
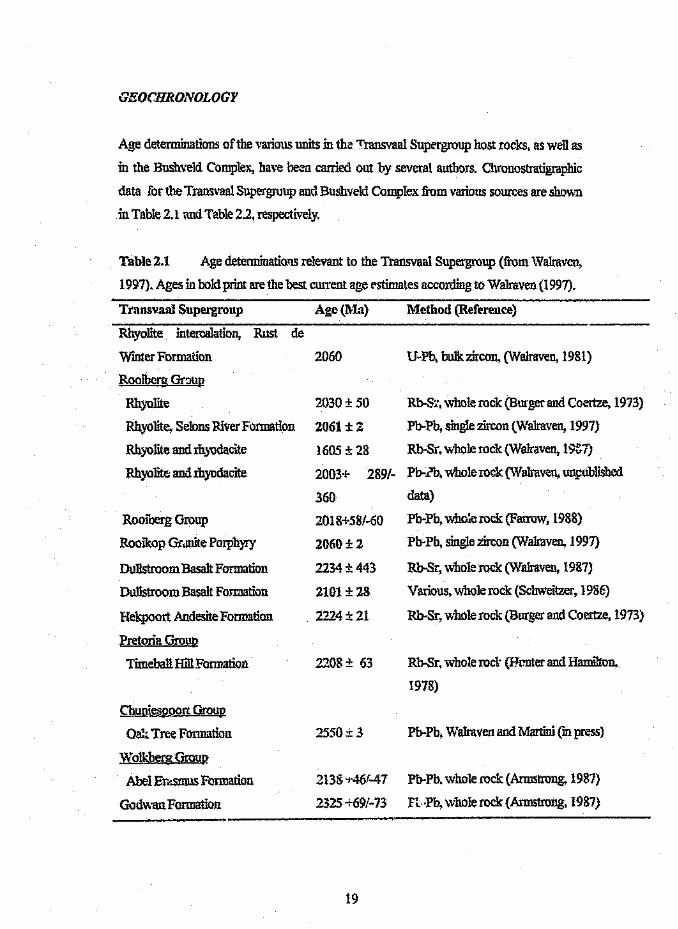
GEOCHRONOLOGY
Age determinations of the various units in the 'Transvaal Supergroup host rocks, as well as
in the Bushveld Complex, have been carried out by several authors. Chronostratigraphic
data for the Transvaal Supergroup and Bushveld Complex from various sources are shown
in Table 2.1 and Table 2.2, respectively.
Table 2.1 Age determinations relevant to the Transvaal Supergroup (from Walraven,
1997). Ages in bold print are the best current age estimates according to Walraven (1997).
Transvaal Supergroup
Rhyolite intercalation, Rust de
Winter Formation
Rooibcrg Gr'Jup
Rhyolite
Rhyolite, Selons River Formation
Rhyolite and rhyodacite
Rhyolite and rhyodacite
Rooiberg Group
Rooikop Granite Porphyry
Dul1stroom Basalt Formation
Dullstroom Basalt Formation
Hekpoort Andesite Formation
Pretoria GrQ!!!!
Timeball Hill Formation
Chuniespoort Group
Oak Tree Formation
Wolkberg Group
Abel Er.tsmus Formation
Gcdwan Formation
Age (l\1a)
2060
2030 ± 50
2061 ± 2
1605 ± 28
2003+ 289/-
360
2018+58/-60
2060 ± 2
2234± 443
2101 ± 28
2224± 21
2208 ± 63
2550± 3
Method (Reference)
U-Pb, bulk zircon, (Walraven, 1981)
Rh-S::, whole rock (Burger and Coertze, 1973)
Pb-Pb, single zircon (Walraven, 1997)
Rb-Sr, whole rock (Walraven, 19&7)
Pb-Pb, whole rock (Walraven, unpublished
data)
Pb-Pb, who:e rock (Farrow, 1988)
Pb-Pb, single zircon (Walraven, 1997)
Rb-Sr, whole rock (Walraven, 1987)
Various, whole rock (Schweitzer, 1986)
Rb-Sr, whole rock (Burger and Coertze, 1973)
Rb-Sr, whole rock (Hnnter and Hamilton.
1918)
Pb-Pb, Walraven and Martini (in press)
2138 -t-46(-41 Pb-Pb, whole rock (Armstrong. 1987)
2325 +69!~73 Fl; -Pb, whole rock (Armstrong, 1987)
19
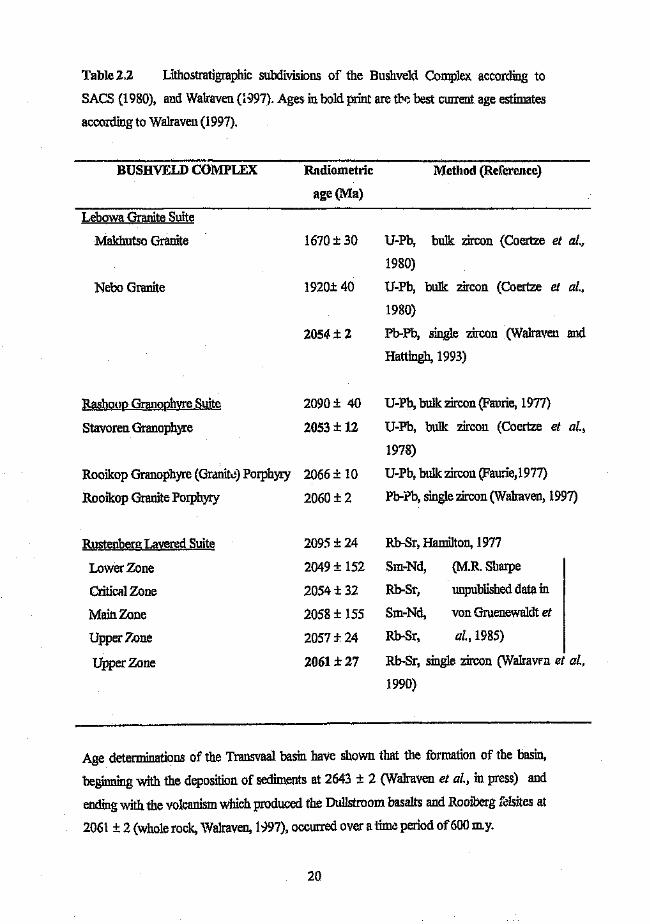
Table 2,2 Lithostratigraphic subdivisions of the Bushveld Complex according to
SACS (1980), and Walraven (1997). Ages in bold print are tbe best current age estimates
according to Walraven (1997).
Radiometric-----------------------------------------BUSHVELD COMPLEX Method (Reference)
age(Ma)
Lebowa Granite Suite
Makhutso Granite 1670 ± 30
Nebo Granite 1920± 40
2054 ± 2
U-Pb, bulk zircon (Coertze et al.,
1980)
U-Pb, bulk zircon (Coertze et al.,
1980)
Pb-Pb, single zircon (Walraven and
Hattingh, 1993)
Rashoop Granophvre Suite
Stavoren Granophyre
2090 ± 40 U-Pb, bulk zircon (Faurie, 1977)
2053 ± 12 U-Pb, bulk zircon (Coertze et al.,
1978)
Rooikop Granophyre (Granite) Porphyry 2066 ± 10
Rooikop Granite Porphyry 2060 ± 2
Rustenberg Layered Suite
Lower Zone
Critical Zone
Main Zone
Upper Zone
Upper Zone
2095 ± 24
U-Pb, bulk zircon (Fau!i.e,1977)
Pb-Pb, single zircon (Walraven, 1997)
Rh-Sr, Hamilton, 1977
2049 ± 152 Sm-Nd,
2054 ± 32 Rh-Sr,
2058 ± 155 Sm-Nd,
(MR. Sharpe
unpublished data in
von Gruenewaldt et
2057::!- 24
2061 ± 27
Rb-Sr. al., 1985) IRb-Sr, single zircon (Walraven et al.,
1990)
Age determinations of the Transvaal basin have shown that the formation of the basin,
beginning with the deposition of sediments at 2643 ± 2 (Walraven et al., in press) and
ending with the volcanism which produced the Dullstroom basalts and Rooiberg felsites at
2061 ± 2 (whole rock, Walraven, 1997), occurred over a time period of600 my.
20
Recent studies have demonstrated that the base of the Transvaal Supergroup is significantly
older than was. previously considered (Walraven and Martini, in press; Walraven et al., in
press). Walraven (1997) has produced the first precise and reliable age determinations for
the upper part of the Transvaal Supergroup, showing that the Rooiberg volcanism and the
emplacement of the Rustenberg Layered Suite and Lebowa Granite Suite of the Bushveld
Complex, occurred in a time span of only 7 million years.
Three important points emerge from the age determinations of Walraven (1997) for the
Rooiberg Group and the Rooikop Granite Porphyry, when compared with existing data for
the Bushveld Complex. Firstly, the similarity of ages implies that the Rooikop Granite
Porphyry was intruded almost immediately after, or even contemporaneously with, the later
stages of the extrusion of the Rooiberg Group. Secondly, the best current ages for the
Bushveld Complex, Rooiberg Group and related rocks are indistinguishable, and thirdly,
the data show that the duration of magmatic activity of the Rooiberg Group and the
Bushveld Complex did not exceed 7 million years.
Rashoop Granophyre Suite
Ages for the Rashoop granophyre were determined by Faurie and von Gruenewaldt (1979)
as 2000 ± 30 Ma using the U-Pb isotopic system, Ages for the Stavoren granophyre of
2084 ± 62 Ma (Walraven et al., 1981) have been published, but, according to Walraven
(l997), the only reliable ages are from U-Pb zircon determinations which indicate an age of
2053 ± 12 (Coertze et al., 1978). Whole-rock Pb-Pb isochron at,es for the Rashoop
granophyre in the Zaaiplaats area show a relatively restricted range from 961±129 Ma (Me
Naughton et al., 1993) and represents a reset age (or final closure age).
Rustenberg Layered Suite
The emplacement of the Rustenberg Layered Suite took place at ca. 2050 Ma and the
radiogenic isotope systems closed immediately (McNaughton et al., 1993). The rocks of
the Lower Zone have been dated at 2049± 152 Ma (Sm/Nd), the Critical Zone at 2054±32
Ma (Rb/Sr), the Main Zone at 2058±155 Ma (Sm/Nd) and the Upper Zone at 2051±24
Ma (Rb/Sr) (M.R. Sharpe unpublished data in von Gruenewaldt et al., 1985)
21
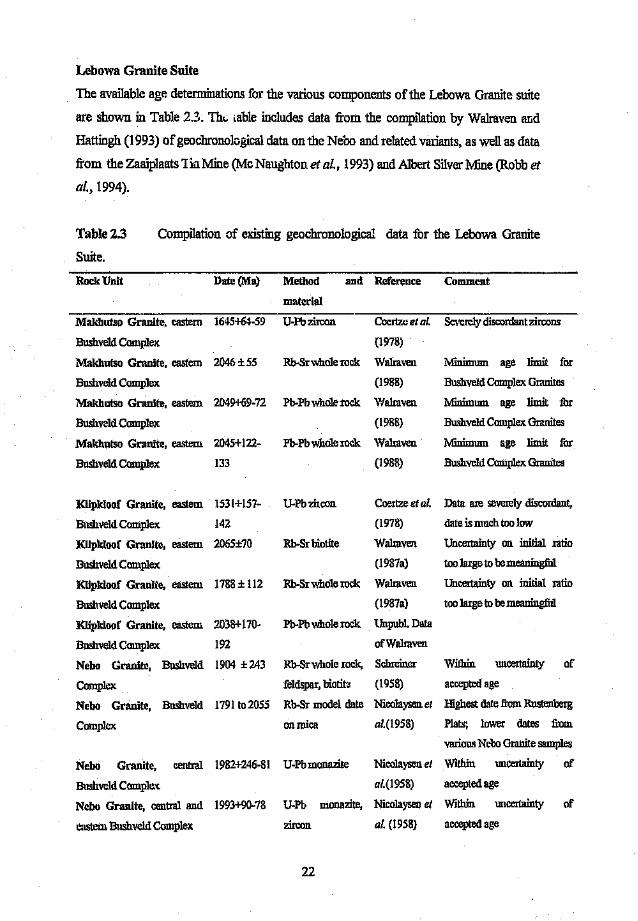
Lebowa Granite Suite
The available age determinations for the various components of the Lebowa Granite suite
are shown in Table 2.3. The .able includes data from the compilation by Walraven and
Hattingh (1993) of geochronological data on the Nebo and related variants, as well as data
from the Zaaiplaats Tin Mine (Me Naughton et al., 1993) and Albert Silver Mine (Robb et
al., 1994).
Table 2.3
Suite.
Compilation of existing geochronological data for the Lebowa Granite
Rock Unit Reference Comment
Makbutso Granite, eastern
Bushveld Complex
Makhutso Granite, eastern
Bushveld Complex
Makbutso Granite, eastern
Bnshveld Complex
Makhutso Granite, eastern
Bushveld Complex
Klipkloof Granite, eastern
Bnshveld Complex
Klipkloof Granitc, eastern
Bushveld Complex
Klipkloof Granlte, eastern
Bushveld Complex
Klipkloof Granite, eastern
Bushveld Complex
Nebo Granite, Bushveld
Date (Ma) Method and
material
1645+64-59 U-Pbzircon
2046 ±55 Rh-Sr whole rock
2049+69-72 Pb-Pbwhole rock
2045+122- Ph-Ph whole rock
133
1531+157- U-Phzircon
142
2065±70 Rb-Sr biotite
1788±112 Rb-Sr whole rock
Coertze et al. Severely discordant zircons
(1978)
Walraven Minimum age limit for
(1988) Bushveld Complex Granites
Walraven Minimum age limit for
(1988) Bushveld Complex Granites
Walraven Minimum age limit for
(1988) Bushveld Complex Granites
Coertze et al: Data are severely discordant,
(1978) date is much too low
Walraven Uncertainty on initial ratio
(1987a) too large to bemea.ningful
Walraven Uncertainty on initial ratio
(1987a) too large to be meaningful
Ph-Ph whole rock Unpubl. Data
of Walraven
Rb-Sr whole rock, Schreiner
2038+170-
192
1904 ±243 Within uncertainty of
Complex feldspar, bictite (1958) accepted age
Ncbo Granite, Bushveld 1791 to 2055 Rb-Sr model date Nico1aysen et Highest date from Rustenberg
Complex on mica
Nebo Granite, central 1982+246-81 U-Pbmonazite
al.(1958) Plats; lower dates from
varions Nebo Granite samples
Nicolaysen et Within uncertainty of
Bushveld Complex al.(1958) accepted age
Ncbo Granite, central and 1993+90-78 U-Pb monazite, Nico1aysen et Within uncertainty of
eastern Bushveld Complex zircon
22
al. (1958) accepted age

Table 2.3 continued Compilation of existing geochronological data for the Lebowa
Granite Suite.
Rock Unit Date(Ma) Method
material
and Reference Comment
Nebo Granite, Bushveld 1955+37-3C U-Pb monazite. Burger er al
Complex zircon (1967)
Nebo Granite, Bushveld 1915 ± 18 Pb-Pb monazite, Burger et 01.
Complex zircon, feldspar, (1967)
apatite
Nebo Granite, westem 1946 ±45 Rb-Sr whole rock Davies et 01.
Bushveld Complex (19'/O)
Granite, Bushveld Complex 1871 ± 102 Rb-Srwhole rock tl.mter8c Isotopic disturbance results
Hamilton in low date
(1978)
New Granite, eastern 2050+51-49 U-Pb zircon Faurie (1977)
Bushveld Complex
Nebo Granite, various 1948+42-39 U·Pbzircon Coertz.eet 01. Data are discordant, date is
parts ofBushveld Complex (1978) lower than aecejxed age
Nebo Granite, Bushveld 2052±48 U-Pbzircon Walravenet
Complex al. (1981)
Nebo Granite, eastern 1982±63 Rb-Sr biotite Walravenet Within uncertainty of
Bushvelu Complex al. (1985) accepted age
New Granite, eastern 1779 ± 102 Rb-Sr whole rock Walravenet Date too low compared to
Bushveld Complex al. (1985) accepted age
Nebo Granite, Fairfield, NE 1905 ±186 Rb-Sr whole rock Walraven Low but within U11 certainty
of Pretoria (1987b) of accepted age
Ncbo Granite, Fairfield, NE 2037 ±92 Rb-Sr whole rock Walraven Date obtained by regression
of Pretoria (1987b) of magnetite gabbro together
with Nebo Granite
Nebo Granite, Fairfield, NE 1842+350- Pb-Pb whole rock Walraven
of Pretoria 397 (1987b)
Nebo Granite, Bushveld 1990±9 U-Pb zircon Walravenet
Complex, area NW of al. (l987b)
Potgietersrus
Nebo Granite, eastern 2082+80-85 Pb-Pbv mole rock Unpublished Within uncertainty of
Bushveld Complex data Walraven accepted age
23
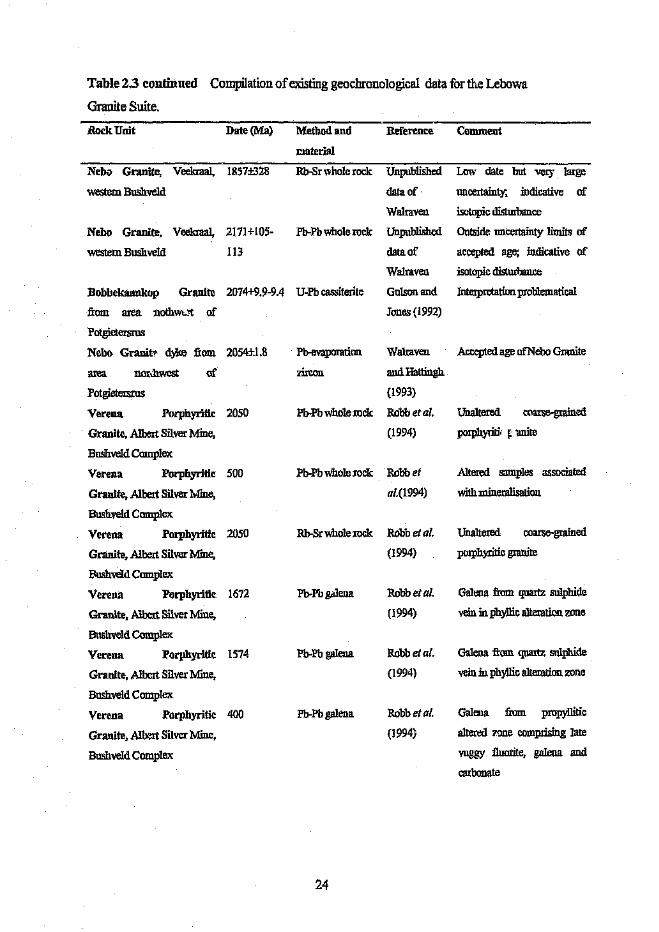
Table 2.3 continued Compilation of existing geochronological data for the Lebowa
Granite Suite.
Rock Unit Date(Ma) CommentMethod and
material
Reference
Nebo Granite, Veekraal, 1857±328
western Bushveld
Nebo Granite, Veekraal, 2171+105-
western Bushveld II3
area nOIillwest
Potgietersrus
of
Verena Porphyritic 2050
Granite, Albert Silver Mine,
Bushveld Complex
Verena Porphyritic 500
Granite, Albert Silver Mine,
Bushveld Complex
Verena Porphyritic 2050
Granite, Albert Silver Mine,
Bushveld Complex
Verena Porphyritic 1672
Granite, Aibert Silver Mine,
Bushveld Complex
Verena Porphyritic 1574
Granite, Albert Silver Mine,
Bushveld Complex
Verena Porphyritic 400
Granite, Albert Silver Mine,
Bushveld Complex
Rb-Sr whole rock Unpublished Low date but very large
data of
Walraven
uncertainty; indicative of
isotopic disturbance
Ph-Ph whole rock Unpublished Outside uncertainty limits of
data of accepted age; indicative of
Walraven
Gulsonand
Jones (1992)
Pb-evaporation Walraven
and Hattingh
(1993)
Pb-Pb whole rock Robb et al.
zircon
(1994)
Pb-Pb whole rock Robb et
al.(l994)
Rb-Sr whole rock Robb et al.(1994)
Pb-Pb galena Robb et al.
(1994)
Pb-Pb galena Robb et al.(1994)
Pb-Pb galena Robb et al.(1994)
24
isotopic disturbance
Interpretation problematical
Accepted age ofNeba Granite
Unaltered coarse-grainedporphyriti. ~.unite
Altered samples associated
withmineralisation
Unaltered coarse-grained
Bobhekaankop Granite 2074+9.9-9.4 U-Pb cassiterite
from area nothwert of
Potgietersrus
Nebo Granit~ dyke from 2054±1.8
porphyritic granite
Galena from quartz sulphide
vein in phyllic alteration zone
Galena from quartz slllphide
vein inphyllic alteration zone
Galena from propyllitic
altered zone comprising late
vuggy fluorite, galena and
carbonate

Table 2.3 continued Compilation of existing geochronological data for the Lebowa
Granite Suite.
Rock Unit .....-----Date(Ma) Method and Reference Comment
material
Lease Granite, Zaaiplaats 1033 ±71 McNaughton All data
et al. (1993)
Lease Granite, Zaaiplaats 1187 ±51 Pb-Pbwhole rock McNaughton Least altered samples
et al. {l993)
Lease Granite, Lenticular 1101 ± 51 Pb-Pbwhole rock McNaughton Towards low grade orebody
orebody, Zaaiplaats et al. (1993) with altered samples omitted
Lease Granite, Lenticular 116tl _ s2 Pb-Pb whole rock McNaugUton Towards low grade orebody
orebody, Zaaiplaats et al. (1993) with altered samples included
Rashoop Granophyre, 961 ± 129
Zaaiplaats
Pb-Pb whole rock McNaughton
et al. (1993)
The ages shown in Table 2.:' t . various units of the Lebowa Granite Suite suggest that
isotopic exchange was active tor approximately 1000 m.y. after emplacement of the
magma. Me Naughton et al. (1993) found that samples from the Bobbejaankop Granite,
Lease Granite and Rashoop Granophyre consistently record an event approximately Ib.y.
after the emplacement of the granites, and that Pb isotope modelling indicates that each
suite evolved independently between 2050 end ca. 1100 Ma.
The age of the Nebo has been narrowed down from 2050 Ma to 2054.4 ± 1.8 Ma using
conventional zircon Pb-Pb dating of a Nebo dyke. Ages younger than 2054 Ma are
interpreted as reflecting disturbance ofthe isotopic systems on which the determinations are
based by post-crystallisation processes (Walraven and Hattingh, 1993). For example, the
selective removal of radiogenic S1'from K-feldspar by late stage magmatic or hydrothermal
fluids, affects the Rb-Sr isotopic system, and results in isochrons younger than the
emplacement age being obtained (Walraven, 1990). Such disturbances in radiogenic isotope
systems have been recognised at Zaaiplaats Tin and Albert Silver Mines. At Zaaiplaats, an
event at approximately 1100 Ma caused closure of the U-Pb systems and is interpreted to
25
represent a blocking temperature age related to uplift and cooling of a long-lived
hydrothermal system and precipitation of the late stage minerals (galena) at 200°C to 300°C
(McNaughton et al., 1993).
In a similar study at Albert Silver Mine, Robb et al. (1994) found that two episodes of
isotopic disturbance are recorded in the Verena Porphyritic Granite hosting the deposit, in
the veins associated with sulphide precipitation, and in the late stage vuggy fluorite. The
late stage fluorite is considerably younger (400 Ma) than the samples containing suphides
(1672 Ma and 1574 Ma), which in turn is considerably younger than the unaltered host
granite (2050 Ma). Robb et al. (1994) suggested that the data could be interpreted to
reflect the ages of two discrete mineralisation events, the older age (1600Ma to 1700Ma)
corresponding to the age oflate-stage processes affecting the Bushveld granites, while the
younger age (400 Ma) would imply a later unrelated event.
GENETIC MODEL FOR THE EVOLUTION OF THE BUSHVELD COMPLEX
The relationships between the units of the Bushveld Complex and the sedimentary and
volcanic components of the Transvaal Supergroup have been elucidated by the
geochronological studies reviewed above, and, together, a model for the evolution of the
Bushveld Complex has developed.
According to Walraven (1997), the Bushveld Complex developed as follows: The volcanic
rocks of the Du11stroom Formation and the Rooiberg Group were intruded after the
deposition of the Pretoria Group sediments (Transvaal Supergroup). Initially this volcanism
was bimodal and areally restricted to the south-eastern Transvaal basin (the Dullstroom
Formation), but soon became acid and, after extrusion of the Damwal Formation, extended
across the entire Transvaal basin. The Rashoop Granophyre Suite was emplaced near the
end of, or immediately after, the Rooiberg volcanism. The first of the Bushveld Complex
units (Rustenberg Layered Suite) was the., emplaced, followed by the Lebowa Granite
Suite.
The Lebowa Granite Suite developed as a function of the crystallisation of the granitic
magma. The Nebo and Klipkloof Granites are geneti Uy related, and a model for their
26
origin was proposed by Kleemann (1985). The model suggests that the Nebo Granite was
intruded at shallow depth, beneath an impermeable cover sequence of granophyre and
Rooiberg Felsite. Towards the end of the crystallisation history of the Nebo Granite, a late-
stage volatile-rich liquid separated, and formed thin sills and dykes referred to as Klipkloof
Granite, which occur in the upper portion of the Nebo Granite. It was concluded that the
more differentiated sills occurred at higher levels in the Nebo Granite. Late-stage liquids
from both the Nebo and Klipkloof Granite intruded into higher levels to form. the fine-
grained Klipkloof dykes (Kleemann, 1985).
27
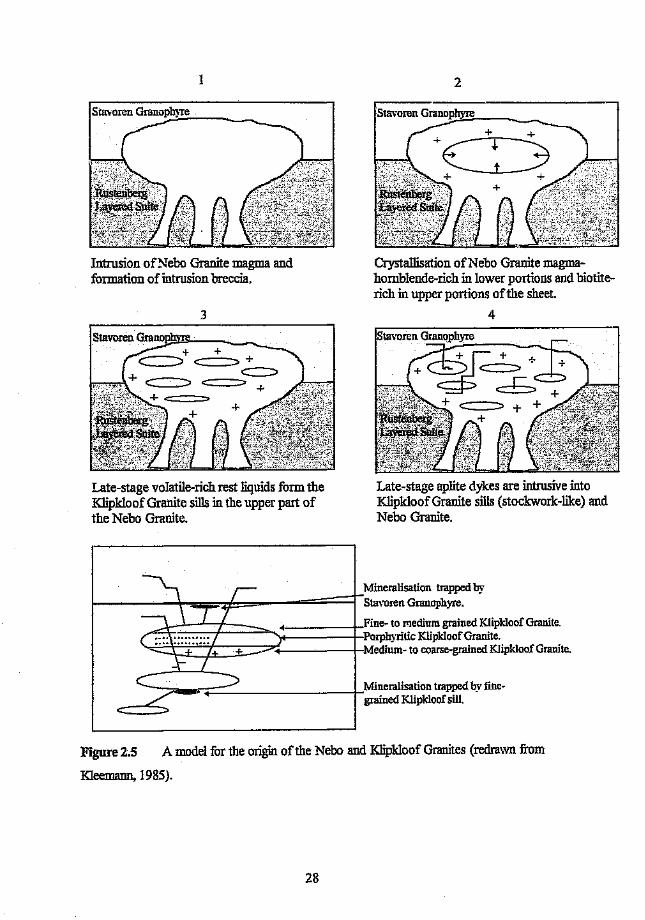
Stavoren Grano;:;ph::;y.:,:re;.__ -.._
Intrusion ofNebo Granite magma andformation of intrusion breccia.
3
Late-stage volatile-rich rest liquids form theKlipkloof Granite sills in the upper part ofthe Nebo Granite.
2
Crystallisation ofNebo Granite magma-hornblende-rich in lower portions and biotite-rich in upper portions of the sheet.
4
Late-stage aplite dykes are intrusive intoKlipkloofGranite sills (stockwork-like) andNebo Granite.
Figure 2.5 A model for the origin of the Nebo and Klipkloof Granites (redrawn from
Kleemann, 1985).
28
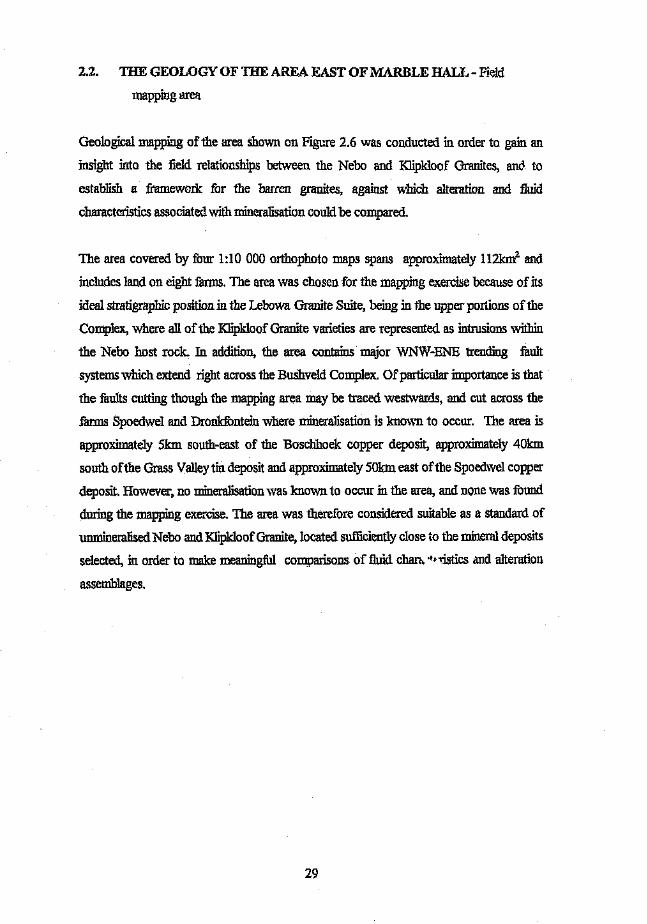
2.2. THE GEOLOGY OF THE AREA EAST OF MARBLE HALL - Fieid
mapping area
Geological mapping of the area shown on Figure 2.6 was conducted in order to gain an
insight into the field relationships between the Nebo and KJipkloof Granites, and to
establish a framework for the barren granites, against which alteration and fluid
characteristics associated with mineralisation could be compared.
The area covered by four 1:10 000 orthophoto maps spans approximately 112km2 and
includes land on eight farms. The area was chosen for the mapping exercise because of its
ideal stratigraphic position in the Lebowa Granite Strite, being in the upper portions of the
Complex, where all of the Klipkloof Granite varieties are represented as intrusions within
the Nebo host rock. In addition, the area contains major WNW-ENE trending fault
systems which extend right across the Bushveld Complex. Of particular importance is that
the faults cutting though the mapping area may be traced westwards, and cut across the
farms Spoedwel and Dronkfontein where mineralisation is known to occur. The area is
approximately Skm south-east of the Boscbhoek copper deposit, approximately 40km
south of the Grass Valley tin deposit and approximately 50km east of the Spoedwel copper
deposit. However, no mineralisation was known to occur in the area, and none was found
during the mapping exercise. The area was therefore considered suitable as a standard of
unmineralised Nebo and KJipkloof Granite, located sufficiently close to the mineral deposits
selected, in order to make meaningful comparisons of fluid char", ,t'mtics and alteration
assemblages.
29
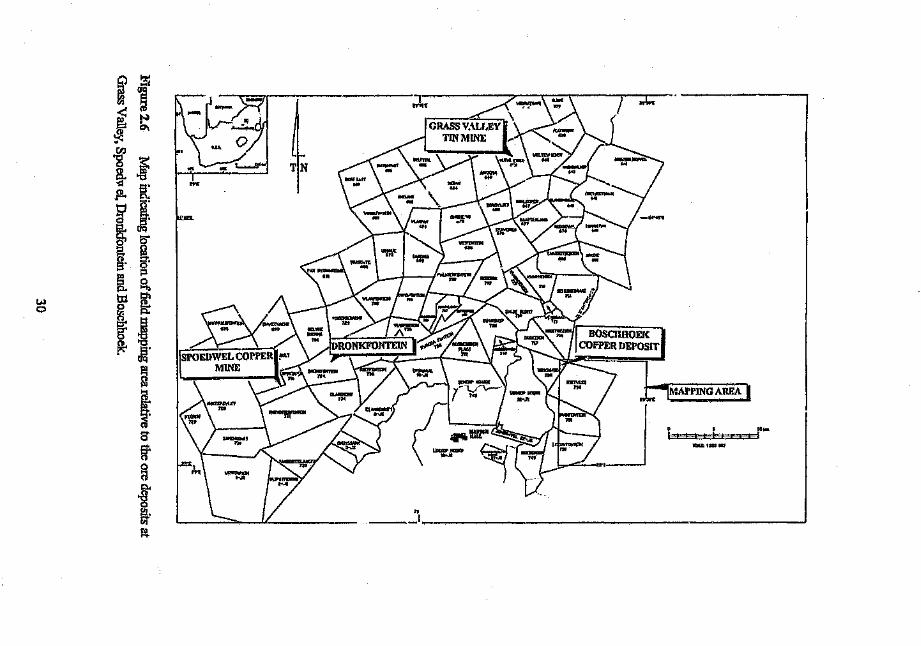
i~~~.
wo
CIJ
Ii~ s·.r- 171,~ ~.o Ej.
~~o a:a £s' g.f§ ~p. ....,
ttl ~a ~tr. P.
~i~ '0r' tfcl·
~
t(11
8'g-Oca
~til~.f;l,.
~~.~N~
----,---.,.;,~
'fINI
....
'=
o , 10 ...I ' £-1 + I 1+4 j
WlU; t.:HOfI02
---:,
LOCAL GEOLOGY
The geological map of the area marked in Figure 2.6 is shown in Figure 2.7. Each of the
rock types indicated on the map are discussed below. The 4 individual 1:10 000 geological
maps are to be found in the back pocket.
The Nebo Granite
The Nebo Granite is the most abundant rock type in the study area, forming the country
rock into which the flue-grained aplitic Klipkloof material is intruded. The appearance of
the Nebo Granite varies and three distinct types have been recognised.
• Medium- to coarse-grained equigranu1ar granite, with discrete euhedral crystals of
quartz and feldspar. Hornblende occurs as disseminated clusters and makes up 1.0-15%
of the rock composition. The quartz is commonly orange-coloured and the feldspars
cream-coloured. Weathered surfaces are cream to orange in colour) with angular
feldspar crystals projecting from the surface.
" Coarse-grained to very coarse-grained rock in which the large euhedral to subhedral
crystals of white perthite (feldspar) form the bulk of the rock mass. Minor amounts of
interstitial quartz and hornblende are present. Localised haematisation of this rock near
shear zones produces a deep red discoloration which closely resembles the
Bobbejaankop (coarse-grained Klipkloof) Granite. On closer inspection, it is clear that
the mafic content is too great for it to be classified as Klipkloof and the characteristic
linked quartz chains which stand proud of weathered surfaces are absent. The feldspars
of this Nebo variety are more resistant to weathering than those in the coarse-grained
Klipkloof Granite.
• A contact facies has been observed where the original Nebo host has been partially
invaded by fine-grained Klipkloof Granite. The majority of the rock is composed of
medium- to coarse-grained quartz and feldspar crystals, but small amounts of fine-
grained material occurs interstitially. This rock type occurs in shear zones and along
contacts between typical fine-grained and porphyritic Klipkloof Granite and the Nebo
host.
31

FigureZ.7
overleaf).
Geological map of the field mapping area east of Marble Hall (see fold out
32
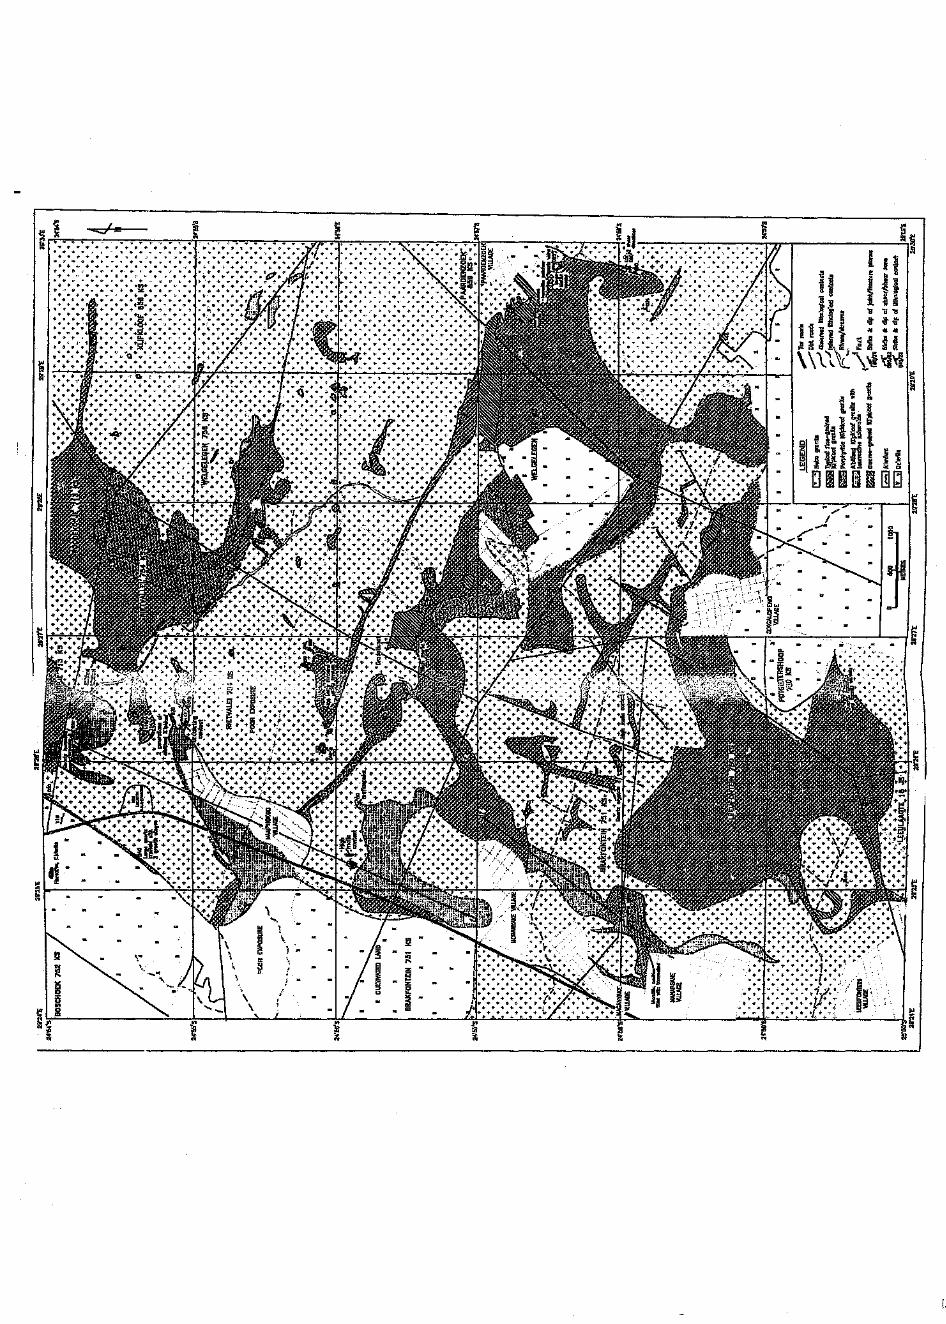
I,
The KlipkloofGranite
Typical fine-grained Kltpkioof'Granite
The fine-grained Klipkloof Granite is relatively abundant in this area, occurring as dykes,
sheets and plugs in the Nebo host rock. The grain size is approximately lrnm and a
preliminary petrographical investigation indicates that it has subsolvus granite mineralogy
i.e. plagioclase, K-feldspar and quartz, as opposed to tne hypersolvus mineralogy (no
primary plagioclase) of the New and Bobbejaankop Granites.
Evidence for at least two generations of fine-grained Klipkloof Granite exists in the study
area. Cross-cutting relationships have been observed, where the earlier dykes, sills and
plugs have been intruded by a younger generation of fine-grained material. The second
generation material is commonly slightly coarser-grained, and forms narrow veins and
dykes composed of quartz, feldspar and, rarely, tourmaline.
Porphyritic Blipkloof Granite
This facies has been described as the contact facies between partially consolidated Nebo
Granite and the typical fine-grained KlipkJoof Granite (Kleemann and Twist, 1989). Tills
relationship has been observed in some instances, but not all. A broad band of porphyritic
granite trending roughly east-west on the farm Welgelegen 756KS is a good example,
illustrating the intermediate position of the porphyritic Klipkloof Granite between the fine-
grained KlipkJoof and the Nebo Granite. However, several other instances where there is
no porphyritic contact facies between the fine- and coarse-grained granites, have been
observed.
Three types of porphy itic Klipldoof material have been observed. Types a) and b) are
associated wit]' New Granite while c) 15 associated with Bobbejaankop Granite.
a) Large (2-4mm) disseminated, euhedral feldspar phenocrysts/xenocrysts illa fine-grained
matrix. Quartz phenocrysts are minor or absent. This type of porphyritic granite is
distinctive in outcrop, forming medium sized, rounded l'nd smooth surfaced boulders that
are relatively resistant to weathering. Two areas where significant amounts of this rock
type are exposed are on the farms Rietvalei and Welgelegen,
33
b) Medium-sized (>2mm), rounded phenocrysts/xenocrysts of both feldspar and quartz
occur in a fine-grained matrix that is commonly hematitised and chloritised. The outcrop is
less distinctive and can easily be mistaken for typical fine-grained Klipkloof granite, since
they both weather to small, angular fragments .
c) A single instance 'f this rock typ was recognised where Bobbejaankop Granite
(coarse-grained Klipkloof) was intruded by ....:..te-grainedKlipkloof granite. An intermediate
rock type was produced which is deep red in colour, with red feldspars and rounded quartz
blebs in a matrix of fine-grained granite. It is worth noting that the lack of mafic minerals in
the Bobbejaankop Gr:mite (coarse-grained Klipkloof) is inherited by this contact facies and
no chloritisation of hornblende xenocrysts (inherited crystals) is ohr~"1/ed.
Albitised Blipkioof Oranite
This facies is an altered version of the typical fine-grained Klipkloof gracile, and hosts
tourmaline balls (Figure 2.8). The appearance of the rock varies depending on the extent of
albitisation. Inhight'y albitised zones, the rock is white in colour with a sugary texture and
disseminated specks of a platey, mafic mineral, which has been identifiec' as biotite. The size
and abundance of mafic specks varies from small, barely visible particles to medium
(>2mm) sized grains. Isolated occurrences of a fine-grained Klipkloof Granite with between
50-60% of disseminated tourmaline have been observed in association with tourmaline-
bearing, albitised plugs ofKlipkloof Granite.
A second generation of fine-grained Klipkloof aplite which contains crystalline tourmaline
blebs along the central portion of the veins, cross-cuts the earlier formed fine-grained
granite which bears the tourmaline spheroids. On careful inspection, it appears that the
tourmaline spheroids are most abundant adjacent to the secondary aplite veins. 'This
suggests that the tourmalinisation and albitisation of the fine-grained Klipkloof granite is a
secondary overprint resulting from the action of fluids introduced with the second pulse of
aplitic material. Pneumatolytic fluids containing boron (and fluorine and chlorine),
percolated through the Klipkloof Granite wall rock precipitating tourmaline in miarolitic
cavities, inveinlets and as spheroids of tourmaline intergrown with albite and quartz.
34
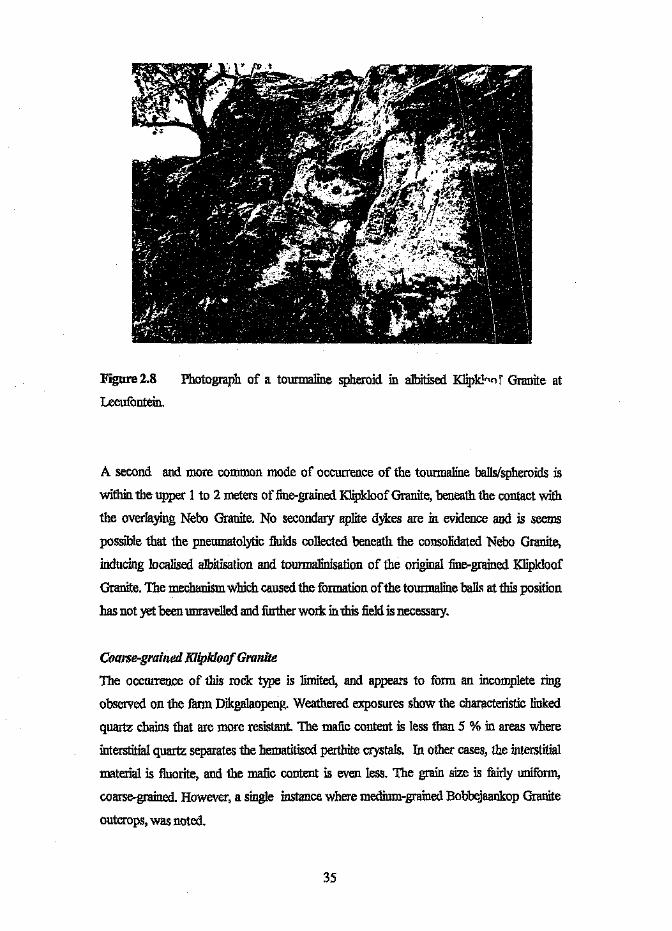
Figure 2.8
Leeufontein.
Photograph of a tourmaline spheroid in albitised Klipklo« f Granite at
A second and more common mode of occurrence of the tourmaline balts/spheroids is
within the upper 1 to 2 meters of fine-grained Klipkloof Granite, beneath the contact with
the overlaying Nebo Granite. No secondary aplite dykes are in evidence and is seems
possible that the pneumatolytic fluids collected beneath the consolidated Nebo Granite,
inducing localised albitisation and tourmalinisation of the original fine-grained Klipkloof
Granite. The mechanism which caused. the formation of the tourmaline balls at this position
has not yet been unravelled and further work in this field is necessary.
Coarse-grained Klipkloof Granite
The occurrence of this rock type is limited, and appears to form an incomplete ring
observed on the farm Dikgalaopeng, Weathered exposures show the characteristic linked
quartz chains that are more resistant. The mafic content is less than 5 % in areas where
interstitial quartz separates the hematitised perthite crystals. In other cases, the interstitial
material is fluorite, and the mafic content is even less. The grain size is fairly uniform,
coarse-grained. However, a single instance where medium-grained Bobbejaankop Granite
outcrops, was noted.
35
STRUCTURE
The dominant style of structural modification is faulting and associated shearing. Three
categories of fault trends have emerged from tbe data collected. The first category
comprises a set of three parallel faults trending 120°. Th ese faults are immediately obvious
on the orthophoto map, as deeply incised river valleys or gorges. The flanks of these gorges
are extremely steep and show a cross-section of the geology to some depth. It is clear that
the intrusive relationships are complex, and that surface mapping alone is insufficient to
gain a proper understanding of the structure of'the area.
Unduiating sills, bifircating dykes and irregular plugs of more than one generation of fine-
grained Klip1doof Granite have been intruded into the Nebo host rock. To further
complicate matters, secondary faulting ~. oblique angles to the main fault have been
observed. Two sets of parallel faults have been recognised, one set trending 030° and the
other set trending 055° to 060". The displacement along most of these faults is negligible,
and where abrupt changes occur, the displacemen, cannot be measured since the continuing
lithologies have either been removed by erosion or occur at some depth beneath the
surface, Thus, it is impossible to determine the nature of the fault
The second and third categories of fault and sbear trends trend parallel to the secondary
faults described in the first category. These trends reflect regional faults that are
radiometrically evident. The one fault trends 040° and the other at 060°, and they are
associated with a band of tourmalinised, albitised Klipkloof Granite, prompting the
suggestion that the fault may have served as a fluid conduit for hydrothermal fluids.
From the geological relationships (Figure 2.9) it appears that the regional faults occur in
zones occupied by fine-grained Klipkloof Granite. This material may be less competent than
the Nebo Granite, and, thus, represent zones of weakness. This observation is supported by
the weathering characteristics of the different lithologies. The Nebo Granite forms resistant
outcrops whereas the fine-grained Klipkloof granite weathers easily, forming valleys and
flat laying areas with soil and vegetation cover. An alternative possibility is that the fine-
grained Klip1doof granite was preferentially emplaced into fundamental structures that were
beth pre- and post-Bushveld in activity.
36
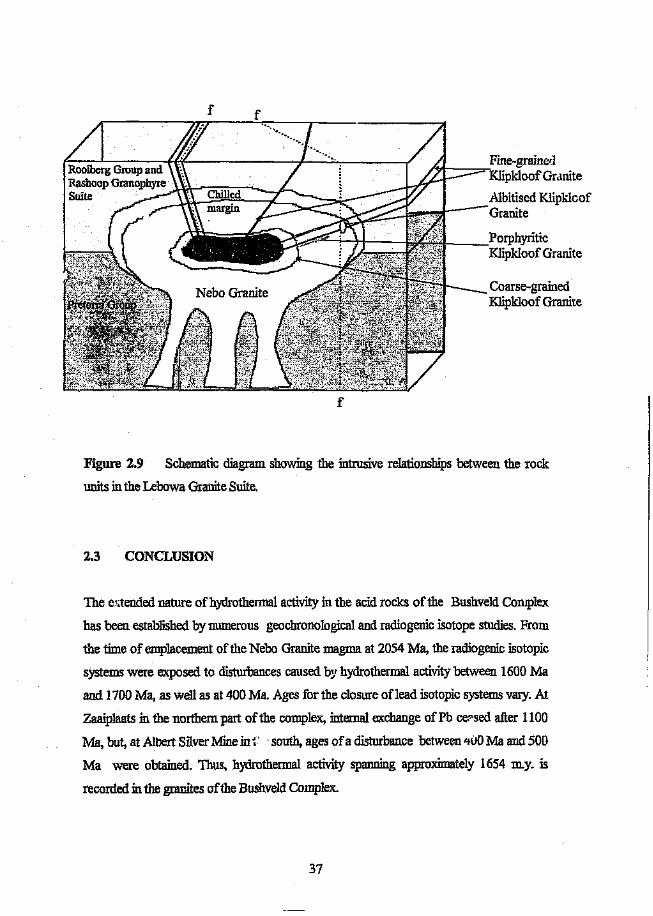
~~'''',,----!-Jt+--_t;;;t;~4- __ PorphyriticK1ipkloof Granite
f
Figure 2.9 Schematic diagram showing the intrusive relationships between the rock
units in the Lebowa Granite Suite.
2.3 CONCLUSION
The extended nature of hydrothermal activity in the acid rocks of the Bushveld Complex
has been established bynutnerous geochronological and radiogenic isotope studies. From
the time of emplacement of the Nebo Granite magma at 2054 Ma, the radiogenic isotopic
systems were exposed to disturbances caused by hydrothermal activity between 1600 Ma
and 1700 Ma, as well as at 400 Ma. Ages for the closure oflead isotopic systems vary. At
Zaaiplaats in the northern part of the complex, internal exchange of Pb ce-sed after 1100
Ma, but, at Albert Silver Mine in t south, ages of a disturbance between If(JO Ma and 500
Ma were obtained. Thus, hydrothermal activity spanning approximately 1654 m.y. is
recorded in the granites of the Bushveld Complex.
37
The relationship between the coarse-grained Nebo Granite and the various fine-grained
varieties of Klipkloof Granite has been attributed to the crystallisation of the granitic
magma and volatile enrichment of the residual magma. Geological mapping bas revealed
that two generations of fine-grained KJipkloof Granite dykes and sills have been intruded
into the Nebo Granite, which are markedly different to the fine-grained chilled margins of
Nebo Granite. In addition, the porphyritic Klipkloof Granite is often found to occur
between the Nebo host rocks and the fine-grained Klipkloof intrusive, and is interpreted as
representing portions of the magma chamber which were incompletely crystallised before
the injection of the aplitic material. Incases where the porphyritic Klipkloof is absent. and
sharp contacts between the Nebo and Klipb::loofGranites are observed. it is suspected that
the pluton was completely crystallised at the time of aplite injection. In addition, the
Klipkloof Granite is often focused along large-scale fractures which extend several
hundreds of metres.
38
CHAPTER 3
MINERALISATION IN THE BUSHVELD GRANITES
3.1 OVERVIEW
Polymetallic mineralisation in the Bushveld granites has been the subject of research and
exploration for many years. However, since the discovery of the Fe oxide-rich Cu-
AU±U±REE deposit at Olympic Dam (South Australia), interest in this type of
mineralisation has intensified considerably. The deposit is controlled by faults or shear
zones, and shows no clear association with the plutons assumed to have generated the
fluids. In particular, similarities between the mineralisation at Olympic Dam, and the
numerous small deposits in the Bushveld granites, have given direction to exploration
efforts in the region.
The Olympic Dam deposit is hosted by the Olympic Dam Breccia Complex, which iswithin
the Roxby Downs Granite. The granite and the breccia complex are coeval with the Gawler
Range volcanics-Hiltaba Suite volcano-plutonic association, and all are products of a major
middle Proterozoic thermal event on the Gawler craton, South Australia ( Haynes et al.,
1995). The Olympic Dam Breccia Complex comprises a large body of fractured,
brecciated and hydrothermally altered Roxby Downs Granite, as well as a variety of
hematite breccias, and minor tuffs and sedimentary rocks (Haynes et al., 1995). The Roxby
Downs Granite is an A-type granite, with high KzO, REE, Zr, Y, U, Th, and F content
(Johnson and McCulloch, 1995), which was produced by fractional crystallisation of a
quartz-me :"""'01::t", melt derived from partial melting of a deep-crustal tonalitic source
(Creaser, 1989). The granite has been dated at 1588 ± 4 Ma (Creaser and Cooper, 1993).
Three mineral associations have been recognised at Olympic Dam The early magnetite (±
hematite), chlorite, sericite, siderite, and minor pyrite, chalcopyrite and uraninite
(association 1) is extensively overprinted by hematite, sericite, chalcocite, bornite,
pitchblende, barite, fluorite, and chlorite (association II). The paragenetically latest major
mineral association consis _-.f'hematite, or hematite + granular quartz ± barite (association
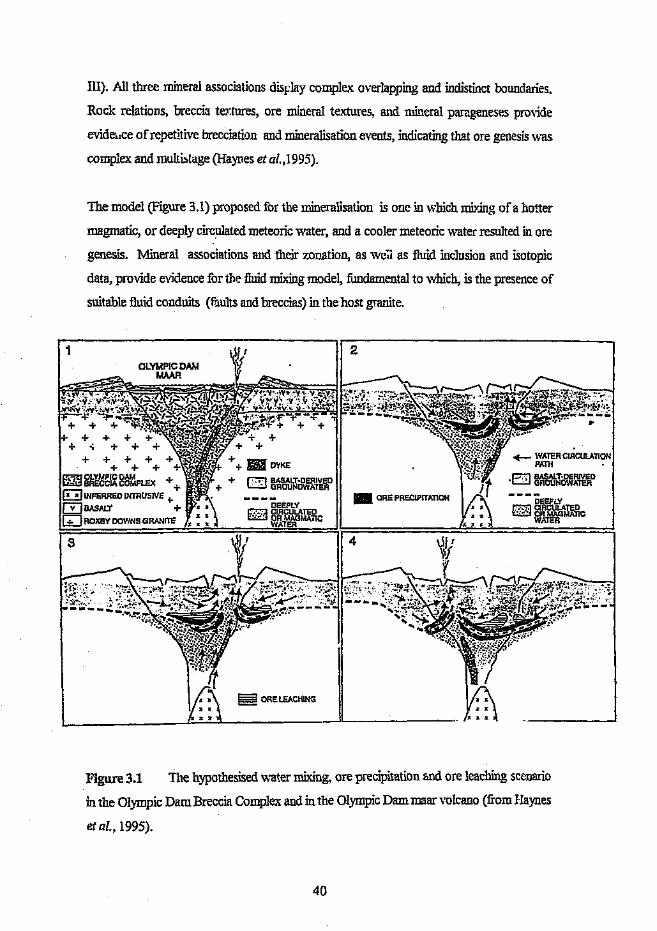
Ill}. All three mineral associations display complex overlapping and indistinct boundaries.
Rock relations, breccia tenures, ore mineral textures, and mineral parageneses provide
evidence of repetitive brecciation and mineralisation events, indicating that ore genesis was
complex and multistage (Haynes et al.,1995).
The model (Figure 3.1) proposed for the mineralisation is one inwhich mixing of a hotter
magmatic, or deeply circulated meteoric water, and a cooler meteoric water resulted in ore
genesis. Mineral associations and their zonation, as wed. as fluid inclusion and isotopic
data, provide evidence for the fluid mixing model, fundamental to which, is the presence of
suitable fluid conduits (faults and breccias) in the host granite.
1 2
Figure 3.1 TIle hypothesised water mixing, ore precipitation and ore leaching scenario
in the Olympic Dam Breccia Complex and in the Olympic Dam maar volcano (from Haynes
et al., 1995).
40
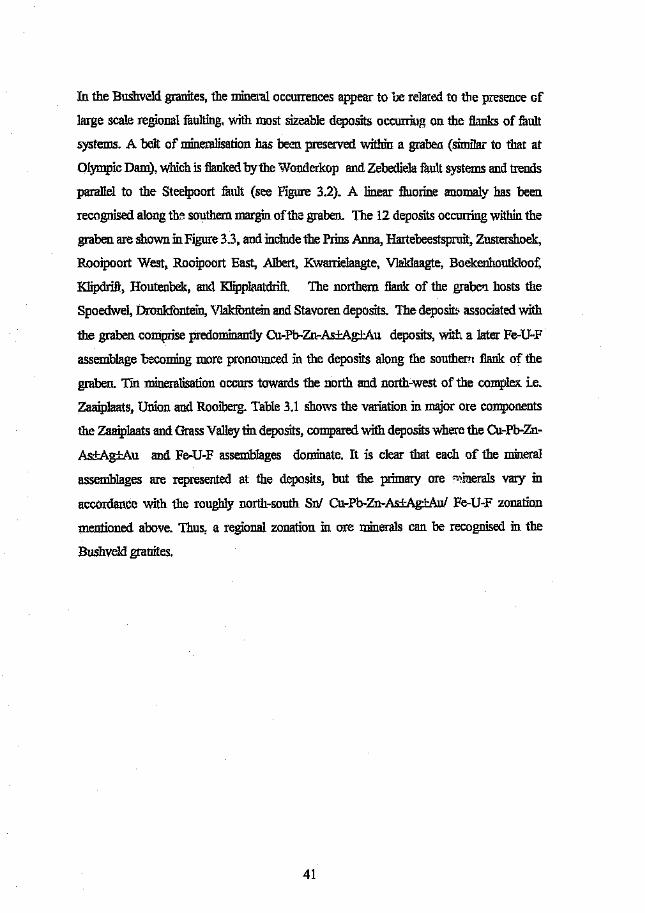
In the Bushveld granites, the mineral occurrences appear to be related to the presence of
large scale regional faulting, with most sizeable deposits occurring on the flanks of fault
systems. A belt of mineralisation has been preserved within a graben (similar to that at
Olympic Dam), which is flanked by the Wonderkop and Zebediela fault systems and trends
parallel to the Steelpoort fault (see Figure 3.2). A linear fluorine anomaly has been
recognised along the southern margin of the graben. The 12 deposits occurring within the
graben are shown in Figure 3.3, and include the Prins Anna, Hartebeestspruit, Zustershoek,
Rooipoort West, Rooipoort East, Albert, Kwarrielaagte, Vlaklaagte, Boekenhoutkloof
Klipdrifr, Houtenbek, and Klipplaatdrift. The northern flank of the graben hosts the
Spoedwel, Dronkfontein, Vlakfontein and Stavoren deposits. The deposits associated with
the graben comprise predominantly Cu-Pb-Zn-As±Ag±Au deposits, with a later Fe-U·F
assemblage becoming more pronounced ill the deposits along the southern flank of the
graben. Tin mineralisation occurs towards the north and north-west of the complex i.e.
Zaaiplaats, Union and Rooiberg. Table 3.1 shows the variation in major ore components
the Zaaiplaats and Grass Valley tin deposits, compared with deposits where the Cu-Pb-Zn-
As±Ag±A.u and Fe-U-F assemblages dominate. It is clear that each of the mineral
assemblages are represented at the deposits, but the primary ore "'~h1era1s vary in
accordance with the roughly north-south Sni Cu-Pb-Zn-As+_.Ag±Au! Fe-U-F zonation
mentioned above. Thus, a regional zonation in ore minerals can be recognised in the
Bushveld granites.
41
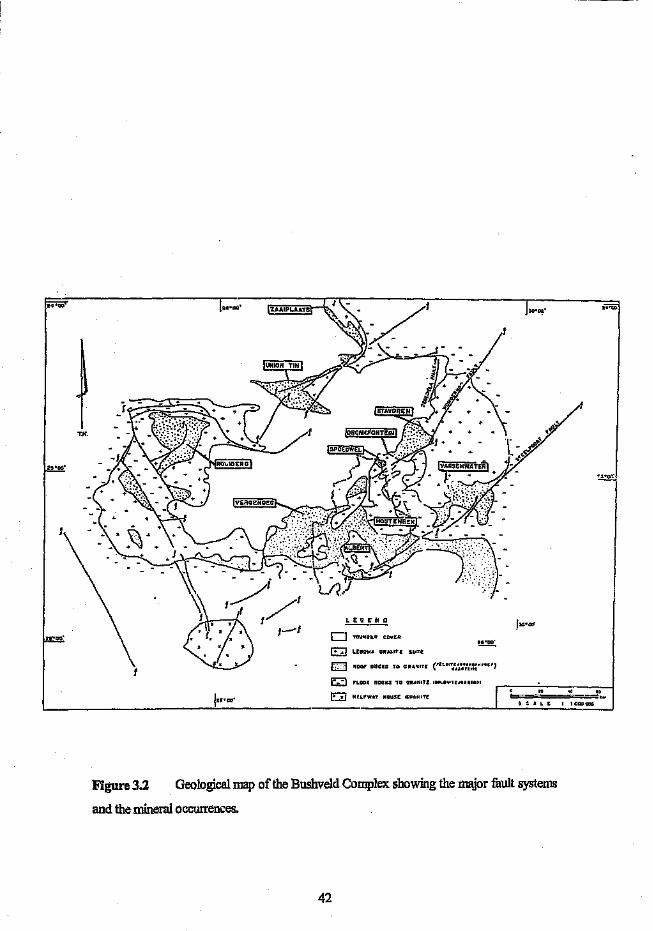
Z~ .D:,\''lAMPI.AATS
T.II.
CJ "fO\Jl1tl~~ C.OV!;;>
E:.J LE80WIo GRANITE ecee
c::J ROOF R'OCIICS TO GRA-.IT!
fi.:;:::) I"LOOR AOCIIC$ TO GRAN IT e. IOQ"a""U/u'IIDI
51 W'.I.'WAl' HauSE _GIU,NI'!I!:
Figure 3.2 Geological map of the Bushveld Complex showing the major fault systems
and the mineral occurrences.
42

Figure 3.3
2~'OO'
MAKHUTSO
o YOUNGER CavER
t~·:~:}OU3»V<LO GRANIT<NCBO
mmW:N::::: f~:~:~~:}RG.' ROC •• }PA!:TORIA
. G!AOUPOQL,OMIT! G:'gj f'LQOR ROC1C!
aU~ATZ BRECCIA vr.:m 6
I. PRINS ANNAZ. H4RTeaEESTSPRUIT3, ZUSTERSHOEK4. ROOIPOORT WESTs RO;:tIPOORT EAST6 ALSERT1. ICWARRIELA4GTEa. VlA.cLAA'lTE3 90EKENHOUTY.LCOF10. DIE aRON. KLIPQRIFTII. HOUTEN9EK12 KUPPLAATORIFT13. SPO,QI/EL14 O?CNKFCNTEIN15, VLAKFONTEIN16 S"'A~ORE"
:Z9"4e'
25"00'
25'30'
Mineral occurrences associated with the Wonderkop and Steelpoort faults.
43
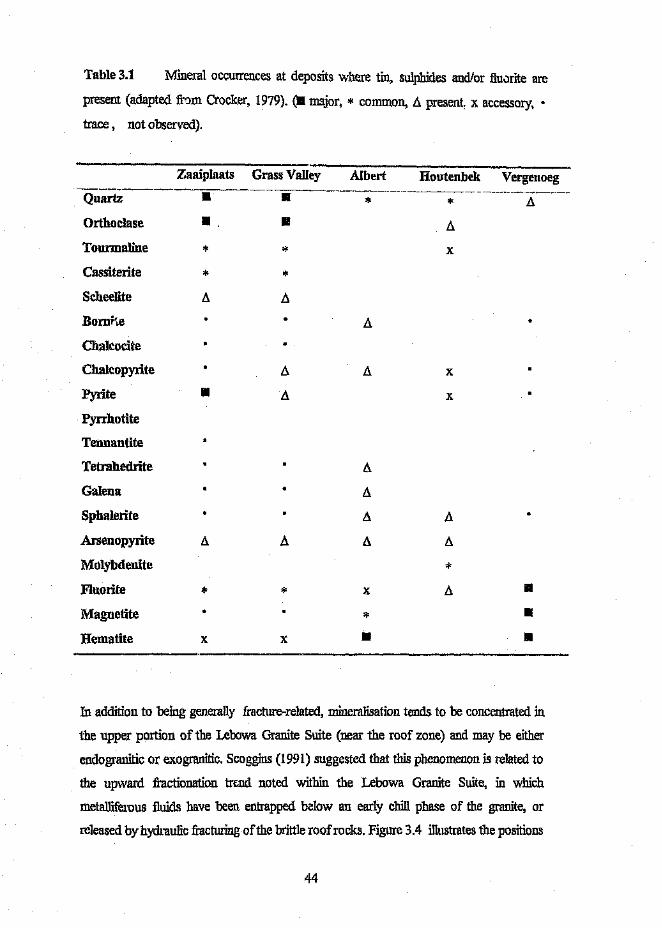
Table 3.1 Mineral occurrences at deposits where tin, sulphides andlor fluorite are
present (adapted from Crocker, 1979). (II major, * common, A present x accessory, •
trace, not observed).
Zaaiplaats Grass Vall~outenbek-Q~;~~-------------.-------------- ----li------- ---------;;.------- ---------------~-----
Orthoclase II II! A
Vergenoeg
Tourmaline
Cassiterite
Scheelite
* x
* *
Chalcocite
Chalcopyrite
Pyrite
Pyrrhotite
Tennantite
Tetrahedrite
xII x
Galena
Sphalerite
Arsenopyrite
Molybdenite
Fluorite*
Magnetite
Hematite*
•II
Ii
* * x
x x II
In addition to being generally fracture-related, mineralisation tends to be concentrated in
the upper portion of the Lebowa Granite Suite (near the roof zone) and may be either
endogranitic or exogranitic. Scoggins (1991) suggested that this phenomenon is related to
the upward fractionation trend noted within the Lebowa Granite Strite, in which
metalliferous fluids have been entrapped below an early chill phase of the granite, or
released by hydraulic fracturing of the brittle roofrocks. Figure 3.4 illustrates the positions
44

of Spoedwel, Dronkfontein, Vlakfontein, Stavoren and Grass Valley, and the A-B section
shows the stratigraphic position of the mineralisation at each deposit. The diagram shows
that mineralisation is concentrated at the contact between the granite and the overlying
granophyric roof rocks, or within the roof rocks themselves.
+ + o LEBOWA GRANlTF' SUITEGRASS VALLEY +
r-:-:-7IL:..:....!..J
GRANOPHYR" }ROOF ROCKS
QUARTZITE:
~~
MINERALIZATION III ROOr" ROCKS'!:3 SCHEMATIC POS,TION ALONG
secno« LIN:::
KNOWN Mt'lERAt.IZATION.
QUARTZ 8RECClA. VEtN.
®-.r:
Figure 3.4 Geological map and cross section A-B showing the stratigraphic position of
the mineralisation at Spoedwel, Dronkfontein, Vlakfontein, Stavoren and Grass Valley.
Modified from .oggins (1991).
45
Pi 'VlOUS studies on the nature at the mmerahsation at well known deposits, such as
Zaaiplaats and Albert, have brought to light a number of important points related to the
mineralisation in the Bushveld granites, and several attempts to model the ore genesis have
been made. Crocker (1979) undertook a regional assessment of the fluorite, tin and
associated rare-metal carbonate occurrences, and concluded that centripetal crystallisation
ofthe granite pluton resulted :in enrichment of the melt in non-essential residual and vo latile
constituents, which were released by tensional fracturing of the crystallised peripheral rind.
Pneumatolytic-pegmatites developed in the fracture/joint system formiag flat manto
orebodies. The resulting mineral assemblages consist of either actinolite-fluorite or of
magnerite-siderire-fluorite, which became altered to the common hematite-quartz-fluorite
assemblage.
The results of a study by Smits (1980) on the Rooibokkop-Boschhcek copper deposit in
the Marble Hall area are imp. rtant, because the model proposed for the mineralisation
incorporates the concepts of fluid channelling along fracture zones and subsequent mixing
of magmatic and meteoric fluids. Smits (1980) found that the orebody was composed of
sulphide-bearing siderite and quartz hydrothermal veins which were emplaced along an
existing fracture zone in the Nebo Granite. Recurrent fracturing improved the permeability
of the host rock, permitting circulation and mixing of meteoric and magmatic fluid. The
veins parallel the Wonderkop Fault, as well as parallel to the mineralised fissures associated
'with the Stavoren and Grass Valley tin deposits. Smits (1980) recognised three major
episodes offissure formation. The first major episode produced steeply dipping crevasses
with a maximum width of 7m, resulting in a composite vein system within the fracture
system, The fissures were filledwith large siderite crystals, enclosing sparsely disseminated
pyrite and pyrrhotite. Two episodes of delayed brittle fracturing of decreasing magnitude
followed the major hydrothermal event in response to the gradual release of stress. During
the second episode offracturing, fissures of1ess than 1m were formed and fluids channelled
along the open space were silica-rich. Sulphide mineralisation and quartz veins commonly
occur in the hanging wall or foot wall of the siderite veins. The third episode of fracturing
occurred towards the end of the sulpaide mineralisation, producing an intricate set of
micro-fissures.
46

Smits (1980) established a paragenetic sequence of minerals in this multi-stage
hydrothermal system which is related to the three fracturing events described. The
paragenetic sequence is as follows:
Early stage: 1. Pyrite 1 - pyrrhotite - siderite 1 - quartz 1, pyrrhotite having been
replaced by marcasite - pyrite 2 before the introduction of the assemblages
in the 2 later stages
Main Stage: 2. Pyrite 3 - quartz 2
3. Sulpharsenides - quartz 3
4. Quartz 4 - bismuthinite 1 - galena 1 - sphalerite 1 - chalcopyrite -pyrite 4
- tennantite (assemblage interrupted by quartz 5)
5. bismuthinite 2 - sulphosalts - galena 2 - sphalerite 2 - quartz 6 -
Late Stage: 6. Sphalerite 3 - galena 3 - quartz 7
7. Siderite 2
8. Quartz 8
At the surface, the mineralisation displays a zonal distribution: a central elongated copper-
rich belt is bordered on both sides by zones in which galena and sphalerite become
progressively more abundant. According to Smits (1980), the introduction of meteoric
water resulted in the transformation of pyrrhotite into open textured marcasite-pyrite
aggregates, and the pervasive sericitisation of the host granite. At a later stage, oxygenated
waters of atmospheric origin caused hematitisation of siderite, the replacement of
chalcopyrite with bornite, and the chloritisation of'the granite between the oxidised veins.
However, not all deposits in the Bushveld granite are fracture-related. For example, the
Zaaiplaats tin deposit was formed in the absence of deeply penetrating fractures or the
interaction of meteoric fluids. Pollard et al. (1991) have shown that primary concentration
of Sn occurred by means of crystal fractionation, and that later magmatically-derived fluids
further concentrated the Sn into pipe-like orebodies. Pollard et al. (1991) maintain t.hat the
distribution of disseminated and pipe-style mineralisation at Zaaiplaats reflects a
47

combination of processes including: 1) early separation of an H20~NaCI-C02 fluid enriched
:in boron to produce pipe-like conduits by collection and upward flow beneath
crystallisation fronts. supplemented by later dissolution of granite, 2) accumulation of
fluorine-rich fluids evolved at a more advanced stage of crystallisation beneath downward-
advancing crystallisation fronts to produce strongly miarolitic zones of Lease Granite
containing disseminated cassiterite (low grade), 3) accumulation of fluorine-rich
hydrothermal fluids, possibly between upward- and downward- advancing crystallisation
fronts to produce the di. t .ninated cassiterite mineralisation zone, and 4) pervasive
alteration of the granites accompanied by filling of miarolitic cavities and pipes. The
crucial factor in the formation of the Zaaiplaats deposits was the lack of hydraulic or
tectonic fracturing during crystallisation (pollard et al., 1991). According to Crocker
(1979), this type of endogranitic deposit forms one end member of the range of mineral
occurrences in the Bushveld granites, while the fault-related exogranitic Sn deposit at
Rooiberg represents the other extreme.
The Rooiberg tin deposit is hosted by a sedimentary roof pendant of the upper Pretoria
Group. Mineralisation occurs along bedding planes within the arkosic layers and as joint-
or fracture-related lodes. However, the ore-mineral and alteration parageneses in both
styles are identical. The paragenetic sequence is orthoclase-quartz follow ed by tourmaline-
apatite-cassiterite and finally carbonate-chalcopyrite-pyrite (associated with minor galena,
sphalerite bismithinite and gersdorihte) (Leube and Stumpf}, 1963). Robb et ai. (1994)
suggest that the Rooib-rg mineralisation was derived from an original magmatic fluid that
migrated some distance from its granitic source, and that the predominance of Sn in the
paragenesis suggests that hydrothermal fluids may have interacted with a zone of primary
cassiterite concentrated by progressive crystal fractionation, as at Zaaiplaats.
The concept of fluid mixing playing a role in the mineralisation process in the Bushveld
granites was first put forward by Wagner (1921) in a study of mineralisation in the Mutue
FidesiStavoren tin field. Wagner (1921) recognised that the deposits were fracture-related
and that the observed alteration features were produced by oxygenated surface waters.
Robb et al., (1994) drafted conceptual models (Figure 3.5) of the mineralisation at
Zaaiplaats and Rooiberg, and compared them to a preliminary model for mineralisation in
48
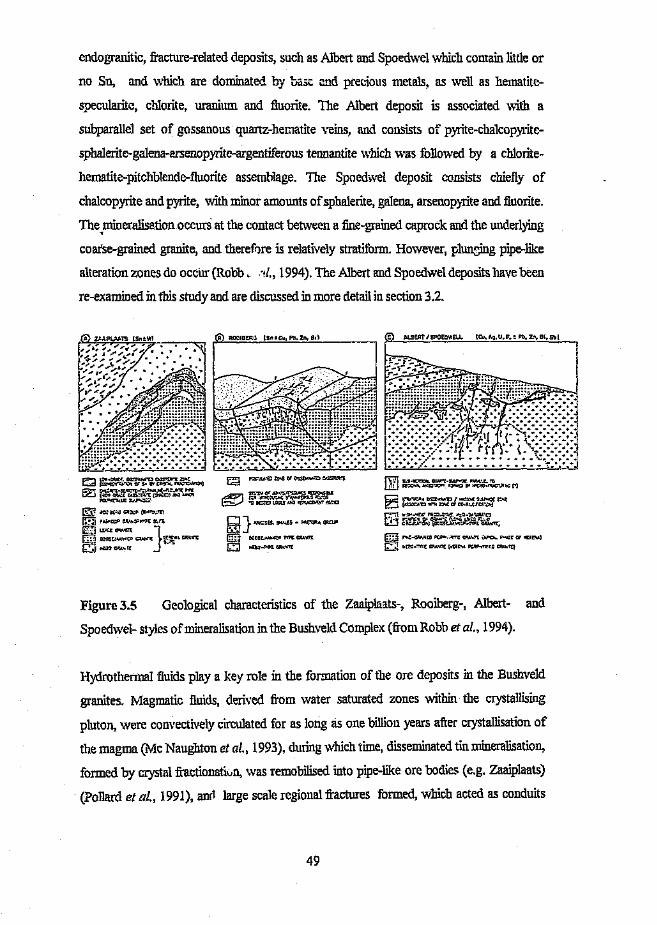
endogranitic, fracture-related deposits, such as Albert and Spoedwel which contain little or
no Sn, and which are dominated by base and precious metals, as well as hematite-
specularite, chlorite, uranium and fluorite. 'The Albert deposit is associated with a
subparallel set of gossanous quartz-hematite veins, and consists of pyrite-chalcopyrite-
sphalerite-galena-arsenop}rite-argentiferous tennantite which was followed by a chlorite-
hematite-pitchblende-fluorite assemblage. The Spoedwel deposit consists chiefly of
chalcopyrite and pyrite, with minor amounts of sphalerite, galena, arsenopyrite and fluorite.
The ,mineralisation occurs at the contact between a fine-grained caprock and the underlying
coarse-grained granite, and therefore is relatively stratiform. However, plunging pipe-like
alteration zones do occur (Robb , -d., 1994). The Albert and Spoedwel deposits have been
re-examined in this study and are discussed in more detail in section 3.2.
~ ~.:, ~~~~..£c{ u:t~~i~i zc..t
".fI3 ~~~:\g~;¥~~~~~~~~:G "":M<;F.o.'IO p('!I:I>;;'t"'i"1:;' w ...;'!'t ;:,t,po.. p..cr CF V!:iI!Mj
G:J fI(C:l·Mt CPA'I~t t.!;IIt'o.l ~!lp ..'t'J;'f.e C"""-,<-!Q
Figure 3.5 Geological characteristics of the Zaaiplaats-, Rooiberg-, Albert- and
Spoedwel- styles of mineralisation in the Bushveld Complex (from Robb et al., 1994).
Hydrothermal fluids playa key role :in the formation of the ore deposits in the Bushveld
granites. Magmatic fluids, derived from water saturated zones within the crystallising
pluton, were convectively circulated for as long as one billion years after crystallisation of
the magma (Mc Naughton et al., 1993), during which time, disseminated tin mineralisation,
formed by crystal fractionation, was remobilised into pipe-like ore bodies (e.g. Zaaiplaats)
(Pollard et al., 1991), and large scale regional fractures formed, which acted as conduits
49
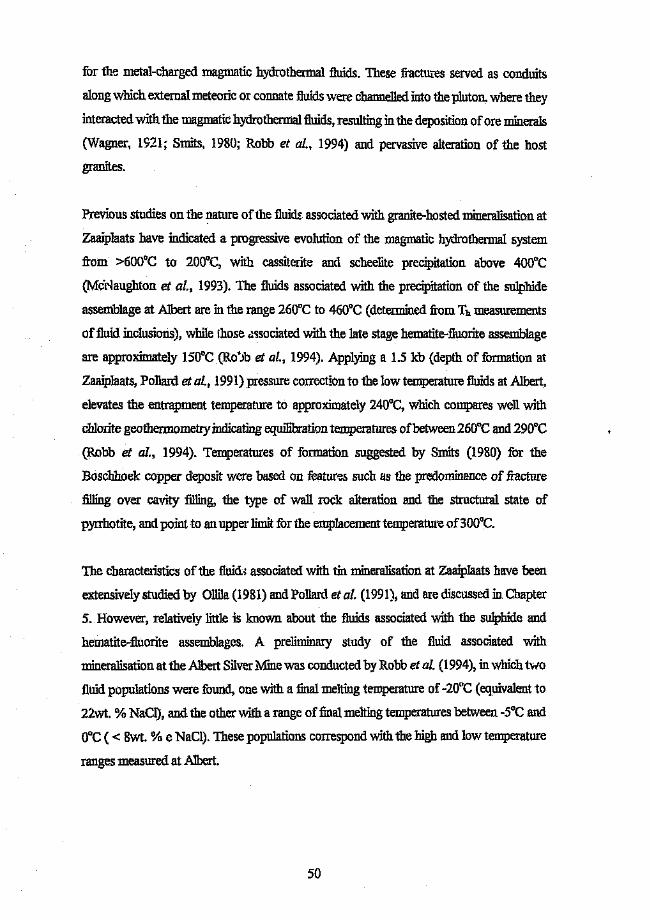
for the metal-charged magmatic hydrothermal fluids. These fractures served as conduits
along which external meteoric or connate fluids were channelled into the pluton. where they
interacted with the magmatic hydrothermal fluids, resulting.in the deposition of ore minerals
(Wagner, 1921; Smits, 1980; Robb et al., 1994) and pervasive alteration of the host
granites.
Previous studies on the nature of the fluids associated with granite-hosted mineralisation at
Zaaiplaats have indicated a progressive evolution of the magmatic hydrothermal system
from >600°C to 200°C, with cassiterite and scheelite precipitation above 400°C
(Mcelaughton et al., 1993). The fluids associated with the precipitation of the sulphide
assemblage at Albert are in the range 260°C to 460°C (determined from Th measurements
offluid inclusions), while those associated with the late stage hematite-fluorite assemblage
are approximately 150°C (Ro'Jb et al., 1994). Applying a 1.5 kb (depth of formation at
Zaaiplaats, Pollard et al., 1991) pressure correction to the low temperature fluids at Albert,
elevates the entrapment temperature to approximately 240°C, which compares well with
chlorite geothermometty :indicating equilibration temperatures of between 260°C and 290°C
(Robb et al., 1994). Temperatures of formation suggested by Smits (1980) for the
Boscbhoek copper deposit were based on features such as the predominance of fracture
filling over cavity filling, the type of wall rock alteration and the structural state of
pyrrhotite, and point to an upper limit for the emplacement temperature of 300°C.
The characteristics of the fluid; associated with tin mineralisation at Zaaiplaats have been
extensively studied by Ollila (1981) and Pollard et al. (1991), and are discussed in Chapter
5. However, relatively little is known about the fluids associated with the sulphide and
hematite-fluorite assemblages. A preliminary study of the fluid associated with
mineralisation at the Albert Silver Mine was conducted by Robb et al. (1994), in which two
fluid populations were found, one with a final melting temperature of -20°C (equivalent to
22wt. % NaCl), and the other with a range of final melting temperatures between -SoC and
O°C( < 8wt. % e NaCl). These populations correspond with the high and low temperature
ranges measured at Albert.
50
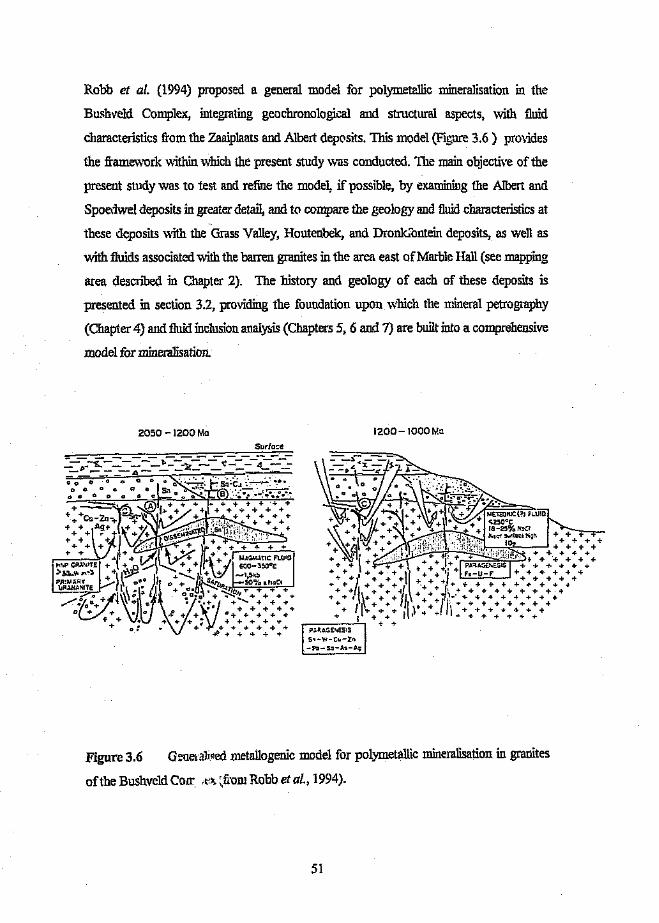
Robb et al. (1994) proposed a general model for polymetallic mineralisation in the
Bushveld Complex, integrating geochronological and structural aspects, with fluid
characteristics from the Zaaiplaats and Albert deposits. This model (Figure 3.6) provides
the framework within which the present study was conducted. The main obiective of the
present study was to test and refine the model, if possible, by examining the Albert and
Spoedwel deposits in greater detail, and to compare the geology and fluid characteristics at
these deposits with the Grass Valley, Houtenbek, and Dronkfontein deposits, as well as
with fluids associated 'with the barren granites in the area east of Marble Hall (see mapping
area described in Chapter 2). The history and geology of each of these deposits is
presented in section 3.2, providing the foundation upon which the mineral petrography
(Chapter 4) and fluid inclusion analysis (Chapters 5, 6 and 7) are built into a comprehensive
model for mineralisation.
2050 -1200 Me IZOO-IOOOMa
Figure 3.6 Generalised metallogenic model for polymetallic mineralisation in granites
ofthe Bushveld COIl' ,t::r. :>}'tolllRobb et al., 1994).
51

3.2. LOCALITY DESCRIPTIONS
The five ore deposits chosen for this study, i.e. Grass Valley, Spoedwel, Dronkfontein,
Albert, and Houtenbek, are located in the eastern lobe of the Bushveld Complex (Figure
3.7). Spoedwel and Dronkfontein occur on the northern flank of the Wonderkop Fault and
are hosted by the Spoedwel granite pluton. Grass Valley is also associated with the
Wonderkop Fault, occurring approximately ~7km northeast of Spoedwel. Albert and
Houtenbek are situated 'within the graben bound by the Wonderkop and Steelpoort Faults,
and occur on the Dennilton and Verena plutons, respectively (refer to Figure 3.3 for map of
plutons),
GRASS VALLEY
The Grass Valley tin deposit was discovered in 1912, when prospecting in the area led to
the discovery of tin on the farms Mutue Fides No.1844, Stavoren No.1871, Gaasterland
No. 1972 and Roodewaal No.1948. The tin deposit on the farm Mutue Fides No. 1844
belonged to the Transvaal Consolidated Land and Exploration Company Ltd., and mining
began in 1915. However, the small size and erratic nature of the orebody, the inaccessibility
of the deposit, and the lack of water made mining unprofitable and it was abandoned in
1918.
Geology
All the deposits in the Mutue Fides/Stavoren tin field are located within a narrow zone
trending in a SSE-NNW direction, The deposits are net confined to any particular horizon,
and occur within the granite, granophyre and sedimentary roofrocks. The Grass Valley tin
deposit is hosted by the Lebowa Granite Suite, and occurs in two modes i.e. associated
with pegmatite and within file granite. The deposits in the granite were classified into
tabular replacement veins, irregular replacements or impregnations, pockets, and pipe-like
orebodies (Wagner, 1921).
52
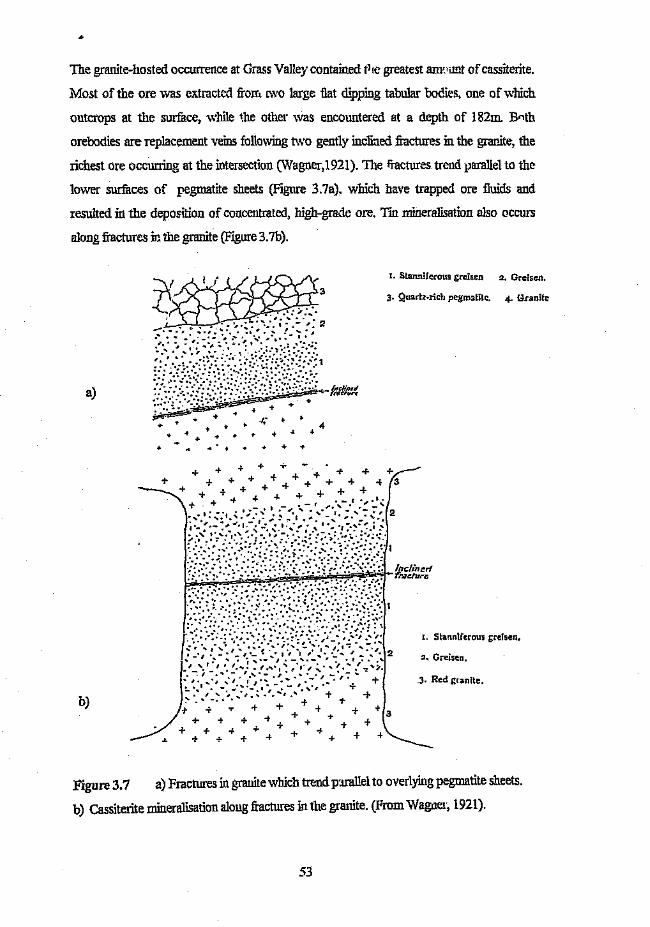
The granite-hosted occurrence at Grass Valley contained t1,(, greatest amount of cassiterite.
Most of the ore was extracted from ['.YO large flat dipping tabular bodies, one of which
outcrops at the surface, while the other was encountered at a depth of 182m. Both
orebodies are replacement veins following two gently inclined fractures in the granite, the
richest ore occurring at the intersection (Wagner,1921). The fi:actures trend parallel to the
lower surfaces of pegmatite sheets (Figure 3.7a), which have trapped ore fluids and
resulted in the deposition of concentrated, high-grade ore. Tin mineralisation also occurs
along fractures in the granite (Figure 3.7b).
a)
I. Stanniferous grelsen
3· Quartz-rich pegmatite.
2. Greisen.
4. Granite
.. ..
b)
1. Stannlferous grelsen,
:l. Greisen •
.3· Red granlte,
Figure 3.7 a) Fractures ingranite which trend parallel to overlying pegmatite sheets.
b) Cassiterite mineralisation along fractures in the granite. (From Wagner, 1921).
53

The relationship between the pipe-style of mineralisation and fractures is not certain. From,
Wagner's (1921) descuption, these pipes are not always associated with fractures. In
Figure 3.8a, the pipe is associated with an inclined fracture, while in Figure 3.8b, no
fracture was illustrated with the orebody. However, the shape of the orebody prompts the
question of'whether the parallel projections at the bottom of the ellipse are fault related.
a)
r. Red peg"':ltH.ic Ielspar.:. '\·hite F~gma!ltrc fcISFar..3. r-.ras:·;h:e sdp~ide ore (mainly pyri~e with d'!3koyyrite)-4, C:!ssite~l:e.'e\. Ar:'s;enor·.~tite.6. Flu~rsp.i;.
b) 7 .. Green:sp ..ye:b ....· sericite..qu:lrtz: :ro;:1.;:w ith crystals anI'! r:ltches c: "a~sHE:i:e.arsenopyrke and fh:·'-;t'sp3r ..
$.. Narrow z;:ne:of s·-:tt se::idtic matter.9 Gc:wi:e,
Figure 3.8 a) Plan view of a small pipe at Grass Valley. b) Section of the elliptical
orebody at Grass Valley, containing cassiterite and sulphide mineralisation (from Wagner,
1(21).
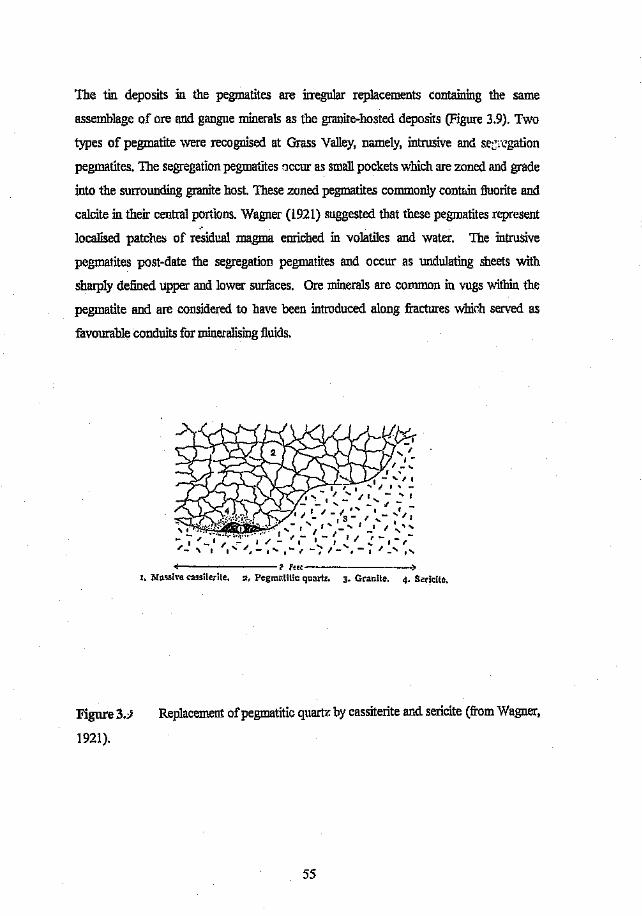
The tin deposits in the pegmatites are irregular replacements containing the same
assemblage of ore and gangue minerals as the granite-hosted deposits (Figure 3.9). Two
types of pegmatite were recognised at Grass Valley, namely, intrusive and sec\'gation
pegmatites. The segregation pegmatites occur as small pockets which are zoned and grade
into the surrounding granite host. These zoned pegmatites commonly contain fluorite and
calcite in their central portions. Wagner (1921) suggested that these pegmatites represent
localised patches of residual magma enriched in volatiles and water. The intrusive
pegmatites post-date the segregation pegmatites and occur as undulating sheets with
sharply defined upper and lower surfaces. Ore minerals are common in vugs within the
pegmatite and are considered to have been introduced along fractures which served as
favourable conduits for mineralising fluids.
«--------2 f"c-------_1. lIf:mjYe cassiterite. 2. Pegmalltic quartz. 3. Granite. 4. Sericite.
Figure3.J
1921).
Replacement ofpegmatitic quartz by cassiterite and sericite (from Wagner,
55
Wagner (1921) described the mineralogy of the Grass Valley tin deposit in detail. The
paragenetic sequence was divided into three main stages (to be discussed in greater
lietail in Chapter 4). The principal ore minerai is cassiterite but subordinate amounts of
the following minerals are present: stannite, wolframite, chalcopyrite, pyrite,
arsenopyrite, molybdenite, specularite, eisenrham, zircon, titanite, magnetite, galena,
sphalerite, secondary copper minerals, malachite and azurite, chalcanthite, limonite,
quartz, chalcedony, feldspar, fluor-apatite, sericite, chlorite, fluorite, calcite, and
ankerite. The mineralogy of this deposit has been re-examined and is presented in
Chapter 4.
SPOEDJ1IEL AND DRONKFONTEIN
The Spoedwel and Dronkfontein deposits are situated on adjacent farms in the Groblersdal
District north-west of Marble Hall. The Spoedwel Copper Mine, located on the farm
Spoedwel701KS, and the farm adjacent to Spoedwel, Dronkfontein 724KS, both contain
sulphide mineralisation in the form ofveins and tabular are bodies.
The presence of a copper ore OO1ybelow the surface at Spoedwel was only detected in
1973, when a private contra-tor; commissioned to find and drill for ground water on the
farm Spoedwel 701 KS, found chalcopyrite in the percussion chips. A period followed
during which various mining companies showed passing interest in the ore body. Somerset
Mining Company acquired an option to prospect in 1975. After drilling a few holes, some
of which did not intersect the orebody, it was decided to first delineate the orebody by
geophysical and geochemical methods.
Despite the possibility of a small high grade copper deposit, no mining companies were
prepared to risk development. By 1985, Concor had acquired the option to exploit the
orebody. During 1985 and 1986, a 36m vertical shaft was sunk: into the orebody and a
40rn development tunnel was driven across the orebody to prove the consistency of the
grade (2,4% Cu). Shortly after the completion of the shaft Concor, sold all their mining
interests. The company Spoedwel Copper Mine was founded by Mr, A Frick (a geologist
with Concor) and a number of directors with Concor. A 100 ton/day plant was erected and
production began in September 1987.
56

Several cores were drilled on Dronkfontein in 1989 and at least four orebodies were
intersected. The northern part of Dronkfontein contains mineralisation in the overlying
granophyre, The major ore components are Sn, Cu, Pb, Zn, Ag, Au and CaF2 (Frick,
unpubl report, 1993). A grade of 1.5% Cu + Sn was estimated by Frick (1993) for the
Dronkfontein deposit.
Geology
Borehole drilling and geophysical investigations at Spoedwel have shown that three tabular
orebodies exist at depth (Figure 3.10) The mineralisation occurs at the contact between a
medium- to coarse-grained granite and a fine-grained granite, as a tabular massive sulphide
body dipping 8° to the north. The almost vertical, stockwork-like mineralisation to the
south is hosted by the Nebo Granite and is interpreted as being feeder veins to the tabular
body. The orebody reaches a maximum width of approximately 60m in the central portion
and a thickness of up to 5m. Mineralisation and de-silicification of the host Nebo Granite
occurred simultaneously, with excess silica being expelled into the immediate hanging-wall,
where it manifests as crypto-crystalline quartz veins. The de-silicified Nebo is often referred
to as an episyenite. The north-east-trending quartz veins outcrop at surface approximately
1 km south of the Spoedwel Mine, and are interpreted to be the result of leakage from a
tabular "ponded" body trapped below the fine-grained granite/granophyre caprock (L.
Robb, Pers. Comm., 1993).
57

s
........
+-------
(UWSI'-(JR·\I:\ED G:'ASllE
+ + +
(l 1011
Figure 3. 10 General section of the Spoedwel Copper deposit shewing the northerly
dipping No.1 ore body and the stockwork-like No.7 ore body (after Frick, unpubL report,
1993),
Diamond drilled cores at Spoedwel and Dronkfontein were logged by Thomas Stone.
Figure 3.11 is a composite of sketches made by Stone of the walls of the E-W tunnel at
Spoedwel, and is included here as part of the previous work done on the deposit. In
addition, one of the 25 borehole cores drafted by Stone is shown in Figure 3.12 indicating
the 01grades throughout the core.
In :li'i descriptions, Stone referred to an "Upper Phase Granite", a "Lower Phase Granite"
and a "Hybrid Contact Phase Granite". The Upper Phase granite (Fine-grained granite in
Figure 3.11) was described as fine-grained maroon granite, in which the grain-size
increases slightly with depth. It has variegated colouring and Stone called it a "mottled"
granite due to the brown, bleached and orange patches which occur in places. It contains
abundant interstitial hematite, a few anhedral pyrite blebs, and quartz, feldspar and
amphibole phenocrysts. The feldspars show myrmekitic (granophyric'?) intergrowth, and
the amphibole (hornblende) is commonly altered to chlorite. Minor Fe-rich quartz veins
with associated fluorite are present. Shears and fractures are occasionally coated with
chlorite, hematite and limonite The Upper Phase Granite forms sharp but irregular cont. .ts
with the Lower Phase Granite.
58
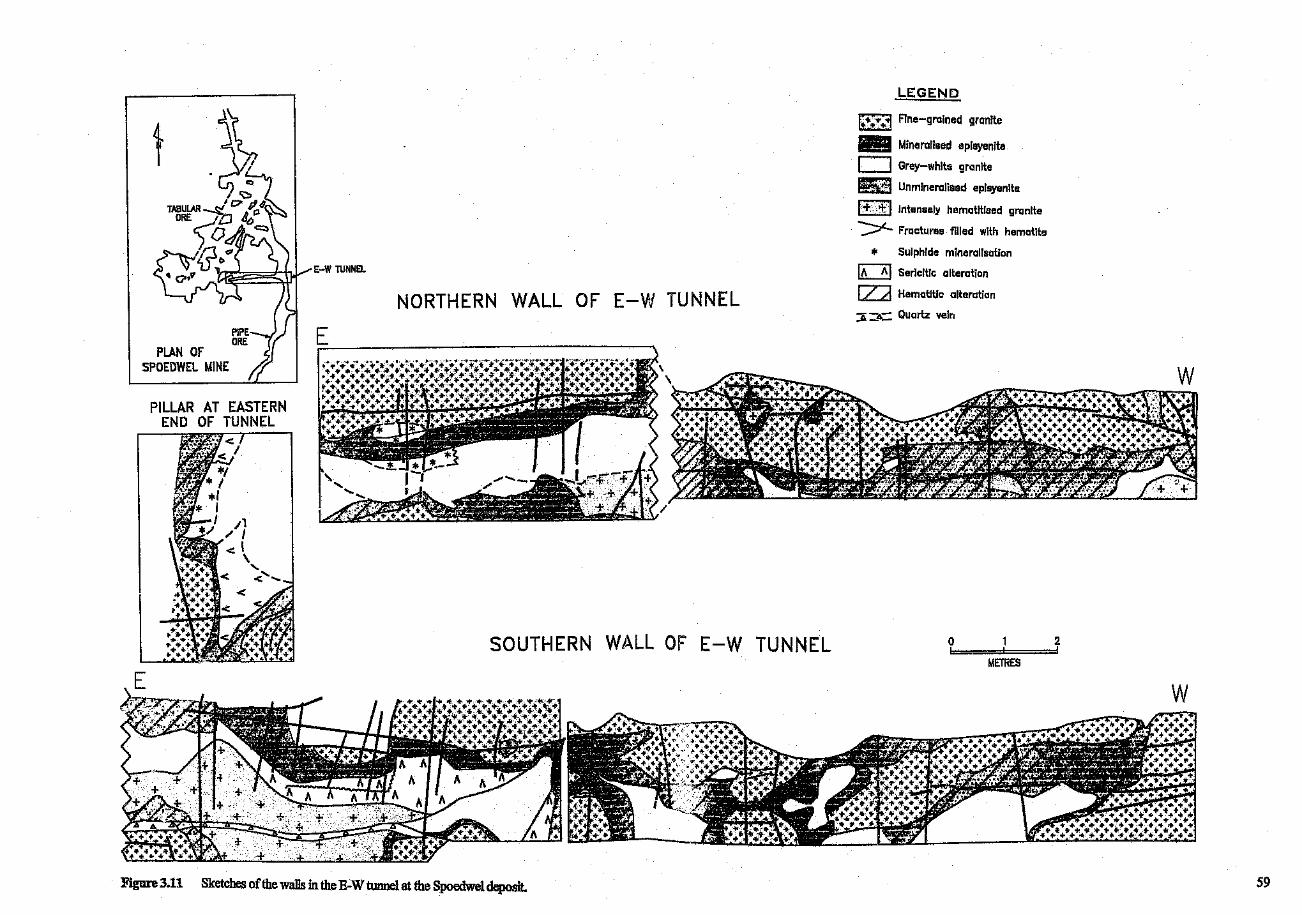
LEGEND
t ~ Fine-grained granite~~ Mineralised episyenite
c::J Grey-white granite
Et1 Unmineralised episyenite
1+ d: I Intensely hematitised granite
">"- Fractures filled with hematite
* Sulphide mineralisation
E:2I Sericitlc alteration
[Z:;;a Hematitic alteration
::A=A:: Quartz vein
E-W TUNNEL
NORTHERN WALL OF E-W TUNNEL
PLAN OFSPOEDWEL MINE
PILLAR AT EASTERNEND OF TUNNEL
SOUTHERN WALL OF E-W TUNNEL 012L= I d
MEfRES
:Figure 3.11 Sketches of the walls in the E-W tunnel at the Spoedwel deposit. 59
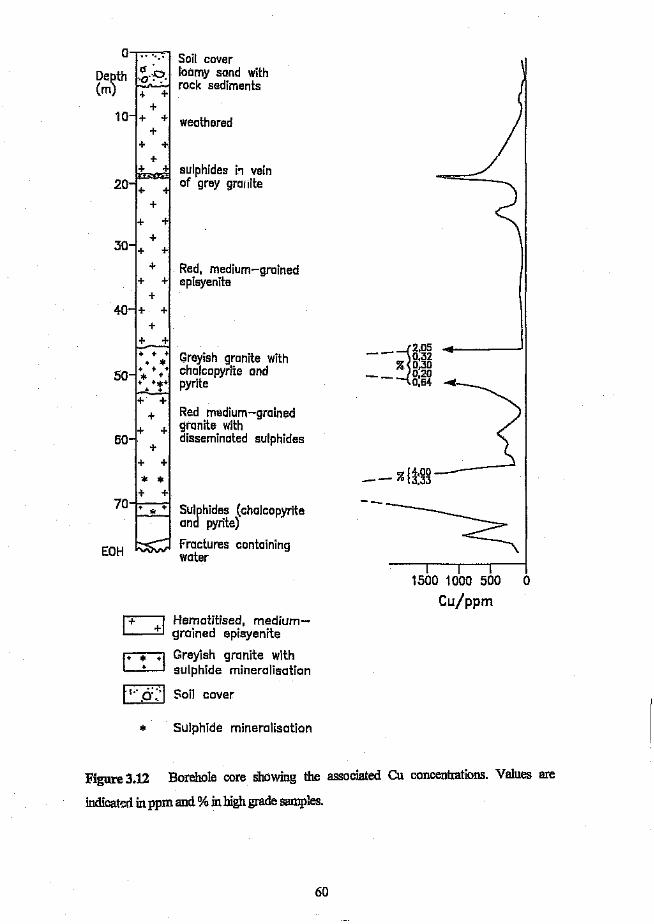
0 , <>, : Soil coverDepth
1$' loamy sand with,·0
(m)',0, " rock sediments
weathered
sulphides i'1 veinof grey qrcnlte
+
30 +Red, medium-grained
+ episyenite
+
50
60
EOH
*
Greyish granite withchalcopyrite andpyrite
Red medium-grained+ granite with
disseminated sulphides++
Sulphides (chalcopyriteand pyrite)
Fractures containingwater
+1 Hematitised, medium-. grained episyenite
Greyish granite withsulphide mineralisation
Soil cover
Sulphide mineralisation
~
205-- 0'32
0:30__ 0,200,64 ~
%14000-- 3,33-_
~
1500 1000 500 0Cu/ppm
Figure 3.12 Borehole core showing the associated Cu concentrations. Values are
indicated inppm and % inhigh grade samples.
60

The Lower Phase Granite is a pale, orange-pink. fine- to medium-grained. quartz-rich
granite. The quartz and feldspar are more distinctly segregated than in the Upper Phase
Granite, with discrete quartz and feldspar crystals. It contains numerous quartz, fluorite
and hematite veins. Patches of chloritic alteration occur. The crystalline granite grades into
vesicular, brick red, feldspathic episyenite, which contains pyrite, chalcopyrite and
chalcocite (Mineralised episyenite in Figure 3.11). The highest grades of mineralisation
occur in a white, bleached feldspathic granite (Grey-white granite in Figure 3.11) within the
episyenite. This white granite occurs in two horizons (at around 52m depth) which are
separated by the red episyenite with lower grades (Unmineralised episyenite in Figure 3.11).
A third zone of highest mineralisation occurs at slightly greater depth (56m ). Several
horizons of mineralisation exist.
The Hybrid contact phase consists of Fe-rich, maroon-coloured, partially assimilated Upper
Phase Granite hosted by pale, orange/pink, fine-grained, chloritic Lower Phase Granite. It
is porphyritic containing aggregates of quartz-amphibole and partially assimilated Lower
Phase Granite blebs.
ALBERT
The historical aspects of the Albert Silver Mine have been rest".ached and documented by
Robb et at. (1994) and the reader is referred to that paper for a detailed recount. For the
sake of completeness, some of the salient points are repeated below.
The Albert Silver Mine was discovered in 1885 and mined until 191O. It occurs on the farm
Roodepoortjie 250JR about 80 km west-northwest of Pretoria. Four boreholes were drilled
in 1952 and a further 26 in the period 1967-1969. Geophysical and geochemical surveys
were carried out over the deposit by the Geological Survey of South Africa and, in 1970,
an M.Sc. dissertation was submitted to the University of Natal (Champion, 1970). In 1956
scintillometer surveys showed that significant concentrations of uranium (up to 1kg. ton-I)
are associated with the base- and precious-metal lodes. In the period 1978-1980, the
property was re-examined as a potential copper-silver- uranium prospect and a further five
bore-holes drilled. Present ore reserves to a depth of 150m are estimated to be 1.2 million
tons at 73 g. ton" Ag, 0.42% Cu, 0.27%Pb and 100 ppm U308; the deposit is generally
61
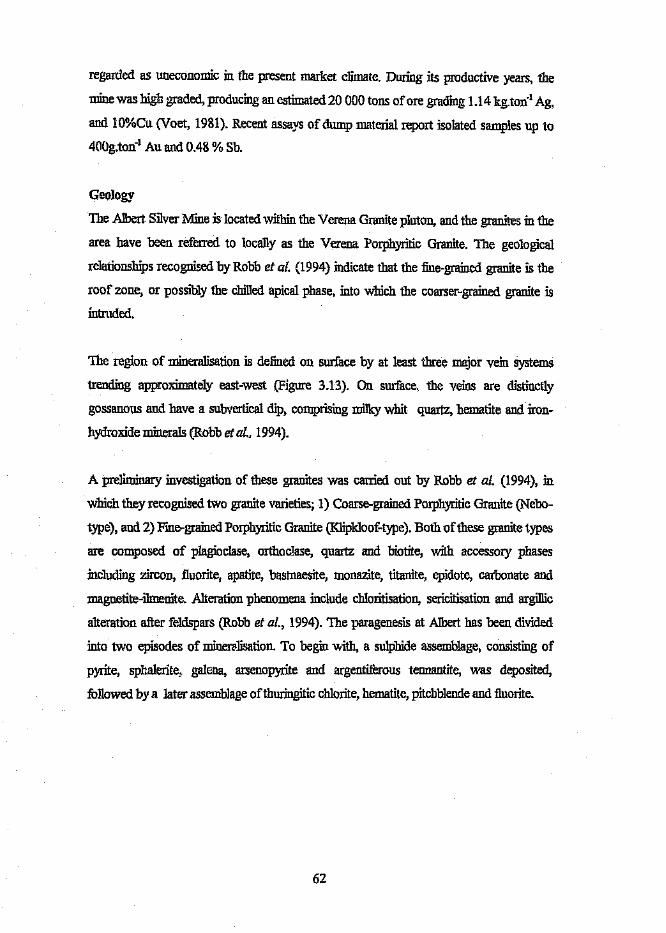
regarded as uneconomic in the present market climate. During its productive years, the
mine was high graded, producing an estimated 20 000 tons of ore grading 1.14 kg.ton" Ag,
and lO%CU (Voet, 1981). Recent assays of dump material report isolated samples up to
4DOg.ton-1Au and 0.48 % Sb.
Geology
The Albert Silver Mine is located within the Verena Granite pluton, and the granites in the
area have been referred to locally as the Verena Porphyritic Granite. The geological
relationships recognised by Robb et al. (1994) indicate that the fine-grained granite is the
roof zone, or possibly the chilled apical phase, into which the coarser-grained granite is
intruded.
The region of mineralisation is defined on surface by at least three major vein systems
trending approximately east-west (Figure 3.13). On surface, the veins are distinctly
gossanous and have a subvertical dip, comprising milky whit quartz, hematite and iron-
hydroxide minerals (Robb et al; 1994).
A preliminary investigation of these granites was carried out by Robb et al. (1994), in
Which they recognised two granite varieties; 1) Coarse-grained Porphyritic Granite (Nebo-
type), and 2) Fine-grained Porphyritic Granite (Klipkloof-type). Both of these granite types
are composed of plagioclase, orthoclase, quartz and biotite, with accessory phases
including zircon, fluorite, apatite, bastnaesite, monazite, titanite, epidote, carbonate and
magnetite-ilmenite, Alteration phenomena include chloritisation, sericitisation and argillic
alteration after feldspars (Robb et al., 1994). The paragenesis at Albert has been divided
into 1\VO episodes of minerslisation, To begin with, a sulphide assemblage, consisting of
pyrite, sphalerite, galena, arsenopyrite and argentiferous tennantite, was deposited,
followed by it later assemblage of'thuringitic chlorite, hematite, pitchblende and fluorite.
62

LEGEND
k.:d. ALLUVIUM
[2EJ DIABASE DYKE
t=l aUARTZ-HEMATITE VEiN (ACCOMPANIEO 6'1'.t::=:j GOSSANOUS ZOj,lES A~C PRONOUN:'EO
WALL·ROCK AL.iERATtON 1
B COA~SE REO. PORPHYtitTiC GRAt~lreo F:I'JE 'GR4tNEO PORPH'I'RlrtC CRAM1 E
~- GEOLOGICAt CONT:'CT CACTU~t. s, tW=Ef>AEO)
AS'.. BOREHOLE lOC;"!;.tT'Y
1 K!l...OMETRE--- c::::::J
~ASllCz:r
,- .....:,.'_ .• 't..-"
A B4650-r-~ __ ~460045504500445044004350
465?4600455045004450
·... - __ _j..440(\
4350
SECTION A - B
Figure 3.13 Outcrop map of the farm Roodepoortjie showing the distribution of the
Albert Silver J\.11neveins in relation to the fine- and coarse-grained porphyritic granite host
rocks. Section A-B has a 2x vertical exaggeration and shows actual elevations in feet (from
Robb et al., 1994).
63
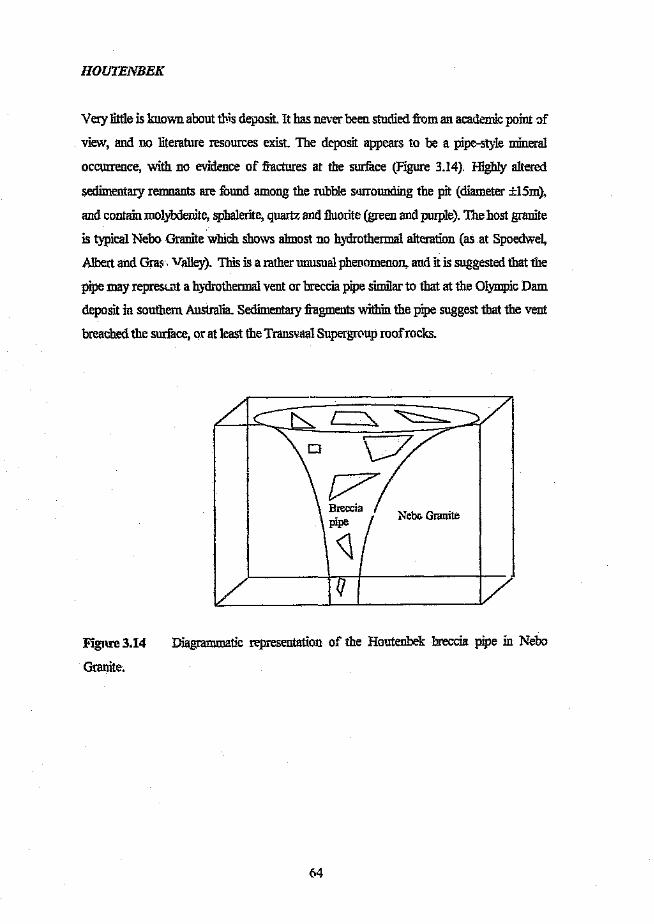
HOUTENBEK
Very little is known about this deposit. It has never been studied from an academic point of
'view, and no literature resources exist. The deposit appears to be a pipe-style mineral
occurrence, with no evidence of fractures at the surface (Figure 3.14). Highly altered
sedimentary remnants are found among the rubble surrounding the pit (diameter ±15m),
and contain molybdenite, sphalerite, quartz and fluorite (green and purple). The host granite
is typical Nebo Granite which shows almost no hydrothermal alteration (as at Spoedwel,
Albert and Gras. valley). This is a rather unusual phenomenon, and it is suggested that the
pipe may represent a hydrothermal vent or breccia pipe similar to that at the Olympic Dam
deposit in southern Australia. Sedimentary fragments 'within the pipe suggest that the vent
breached the surface, or at least the Transvaal Supergroup roofrocks.
/
Nebc Granite
Figure 3.14
Granite.
Diagrammatic representation of the Houtenbek breccia pipe in Nebo
64
CHAPTER 4
MINERAL PETROGRAPHY
A comparative petrographic study was conducted on the rocks from the six different
locations described in Chapters 2 and 3. Five of these (Grass Valley, Spoedwel,
Dronkfontein, Albert and Houtenbek) are ore deposits, and the sixth (Leeufontein), a site
where no ore body exists (Figures 2.6 and 3.2).
The granites in the area east of Marble Hall (which is referred to as Leeufontein) serve as
the control, against which the mineralogy of the altered granites in the ore deposits are
compared. The mineralogy 0 he different granites in the area varies, and has been
described in Chapter 2. The focus of this chapter is to compare the deposits with ore
mineralisation, pointing out the similarities and differences in primary assemblages,
alteration and ore assemblages.
The ore and gangue minerals of all samples from each deposit examined are tabulated in the
Appendix. The following sections represent a comparative discussion of the mineralogy,
paragenesis and alteration assemblages at Grass Valley, Spoedwel, Dronkfontein, Albert,
Houtenbek, and Leeufontein,
4.1. SAMPLEMATERIAL
The Spoedwel granites wen m.pped in 1989 by Thomas Stone, as part of an MSc project
which he later abandoned. Several thin sections and polished thin sections were made at the
Geological Survey of South Africa, Pretoria, and were not thoroughly examined before the
project was aborted. The following mineralogical observations based on the ore and gangue
mineralogy at Spoedwel are derived from a detailed examination of these 356 thin sections
and polished thin sections. Additional polished thin sections were made at the University of
the Witwatersrand from samples collected from the waste dumps of the non-operational
mine workings, The sample material from Albert Silver mine was collected by V. Robb and
L.J. Robb as part of an earlier study of the deposit. A total of 141 polished thin sections, 27
polished wedges, and 10 doubly polished thin sections were examined.
65
The sample material from Grass Valley and Leeufontein was collected while mapping the
area for RTZ Exploration Ltd. A total of twenty seven polished thin sections, ten doubly
polished thin sections and five thin sections were cut from Grass Valley. Ten polished thin
sections and ten doubly polished wafers were cut from granites in the Leeufontein area.
4.2. SAMPLE DESCRIPTIONS
Polished thin section descriptions have been tabulated for easy reference and are shown inthe Appendix. The gangue mineralogy, are mineralogy and paragenetic sequences in each
section, as well as the average grain-size and characterisation of the granite (i.e.
hypersolvus, subsolvus ortranssolvus) are indicated.
4.3 HYPERSOLVUS AND SUBSOLVUS GRANITES IN THE BUSHVELD
COMPLEX
Petrographic studies of the granites hosting mineralisation at tb~ Grass Valley, Spoedwel
and Albert deposits, as well as of the barren granites in the Leeufontein area, have revealed
the presence of three textural varieties in the eastern lobe of the Bushveld Complex,
namely hypersolvus, subsolvus and transsolvus granites. Previous descriptions of the
Bushveld granites had recognised their hypersolvus character (Kleemann, 1985; Kleemann
and Twist, 1989), but the presence of subsolvus and transsolvus textures had not previously
been described in the literature. Evidence for the presence 0 - these granite types in the
Bushveld is presented here for the first time.
The primary difference between hypersolvus and subsolvus granites is the presence or
absence of discrete plagioclase crystals. Hypersolvus granites are characterised by the
absence of a primary albitic plagioclase, except as a component of perthite. The alkali
feldspars consist of coarsely perthitic micro cline and are derived from relatively dry liquids
in near-surface environments (Martin and Bonin, 1976). Subsolvus granites are
characterised by discrete grains ofK-feldspar and albite. The alkali feldspars consist of non-
perthitic micro cline which were derived from 'we.ter" liquids formed at deeper levels in the
crust. The grain-size is smaller than in hypersolvus granites (Martm and Bonin, 1976).
Transsolvus granites are intermediate varieties between the hypersolvus and subsolvus
66
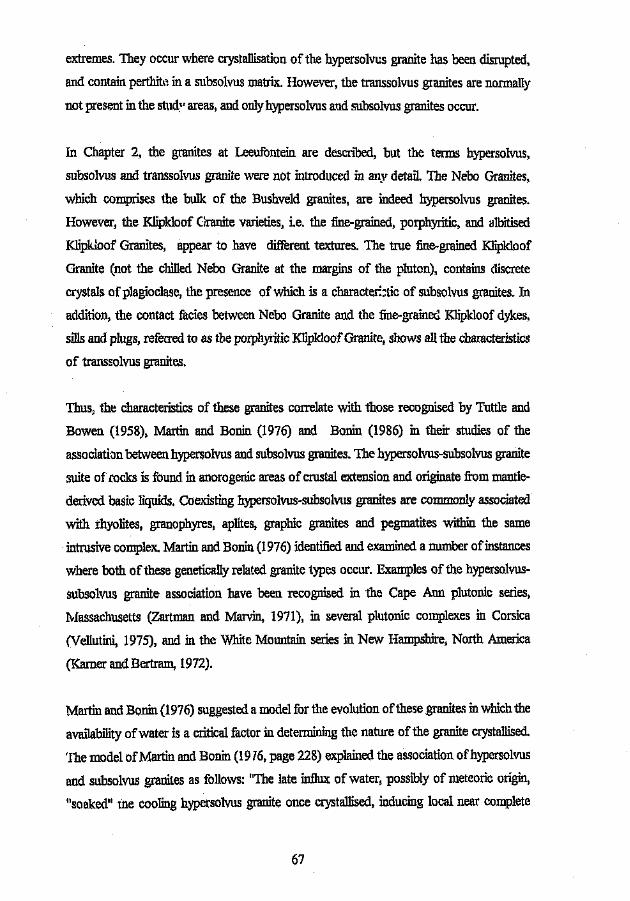
extremes. They occur where crystallisation of the hypersolvus granite has been disrupted,
and contain perthite in a subsolvus matrix. However, the transsolvus granites are normally
not present in the study areas, and only hypersolvus and subsolvus granites occur.
In Chapter 2, the granites at Leeufontein are described, but the terms hypersolvus,
subsolvus and transsolvus granite were not introduced in any detail. The Nebo Granites,
which comprises the bulk of the Bushveld granites, are indeed hypersolvus granites.
However, the Klipkloof Granite varieties, i.e. the fmc-grained, porphyritic, and albitised
Klipkloof Granites, appear to have different textures. The true fine-grained Klipkloof
Granite (not the chilled Nebo Granite at the margins of the pluton), contains discrete
crystals of plagioclase, the presence of which is a characteristic of subsolvus granites. In
addition, the contact facies between Nebo Granite and the fine-grained Klipkloof dykes,
sills and plugs, referred to as the porphyritic Klipldoof Granite, shows all the characteristics
of transsolvus granites.
Thus, the characteristics of these granites correlate with those recognised by Tuttle and
Bowen (1958), Martin and Bonin (1976) and Bonin (1986) in their studies of the
association betweenhypersolvus and subsolvus granites. The hypersolvus-subsolvus granite
suite ofrocks is found in anorogenic areas of crustal extension and originate from mantle-
derived basic liquids. Coexisting hypersolvus-subsolvus granites are commonly associated
with rhyolites, granophyres, aplites, graphic granites and pegmatites within the same
intrusive complex. Martin and Bonin (1976) identified and examined a number of instances
where both of these genetically related granite types occur. Examples of the hypersolvus-
subsolvus granite association have been recognised in the Cape Ann plutonic series,
Massachusetts (Zartman and Marvin, 1971), in several plutonic complexes in Corsica
(Vellutini, 1975), and in the White Mountain series in New Hampshire, North America
(Karner and Bertram, 1972).
Martin and Bonin (1976) suggested a model for the evolution ofthese granites in which the
availability of water is a critical factor in determining the nature of the granite crystallised.
The model of Martin and Bonin (1976, page 228) explained the association of hyperso1vus
and subsolvus granites as follows: "The late influx of water, possibly of meteoric origin,
"soaked" tne cooling hypersolvus granite once crystallised, inducing local near complete
67

fusion and remobilization of the early granite. At lower temperatures the influx of water
would be reflected in deuteric changes such as the alteration of mafic mineral assemblages,
precipitation ofIate albite, replacement of pre-existing feldspars by albite and local increase
in the degree of order of'Kfeldspar",
Hypersolvus and subsolvus granites associated with mineralisation
The bulk of the Lebowa Granite Suite is made up of the hypersolvus Nebo Granite, into
which the aplitic, subsolvus KJipkloof Granite is intruded. The country rock hosting
mineralisation and the subsolvus granites at Spoedwel, Grass Valley, Dronkfontein and
Houtenbek, consists of altered, hypersolvus Nebo Granite. In contrast to the cream-
coloured, barren granites in the lower portions of the pluton, the colour of the mineralised
granite is brick-red, and is composed almost entirely of intensely hematitised perthite and
quartz. It occurs as coarsely crystalline granite, and as a fine-grained equivalent which was
rapidly chilled at the margins of the pluton.
A feature of the coarse-grained hypersolvus granite is the apparent compaction or fusion of
the perthites, which may be extreme in some cases, with no interstitial spaces between
grains and no euhedral crystal structure remaining (Figure 4.1). In other cases, the
compaction is less pronounced, and some euhedral interlocking perthite crystals are still
recognisable.
The interstitial material is predominantly secondary in origin, introduced after crystallisation
or partial solidification of the perthite crystals. The material between the large perthite
crystals (>2mm) is usually secondary quartz, muscovite, chlorite and fluorite in varying
proportions. The degree of sulphide mineralisation is variable and has a direct influence on
the gangue assemblage associated with it. In relatively unmineralised samples, minute
specks of chalcopyrite «O.Olmm) occur disseminated throughout the rock. As the
abundance of sulphides increases, the amount of chlorite, quartz and muscovite increases.
68
At Spoedwel and Grass Valley, the subsolvus granite is less abundant than the hypersolvus
granite, and commonly is associated with the sulphide mineralisation (Figure 4.2). At
Spoedwel, the subsolvus granite occurs as undulating dykes and sills within the Nebo
Granite. In contrast, the Albert Silver deposit is situated within a large pluton of subsolvus
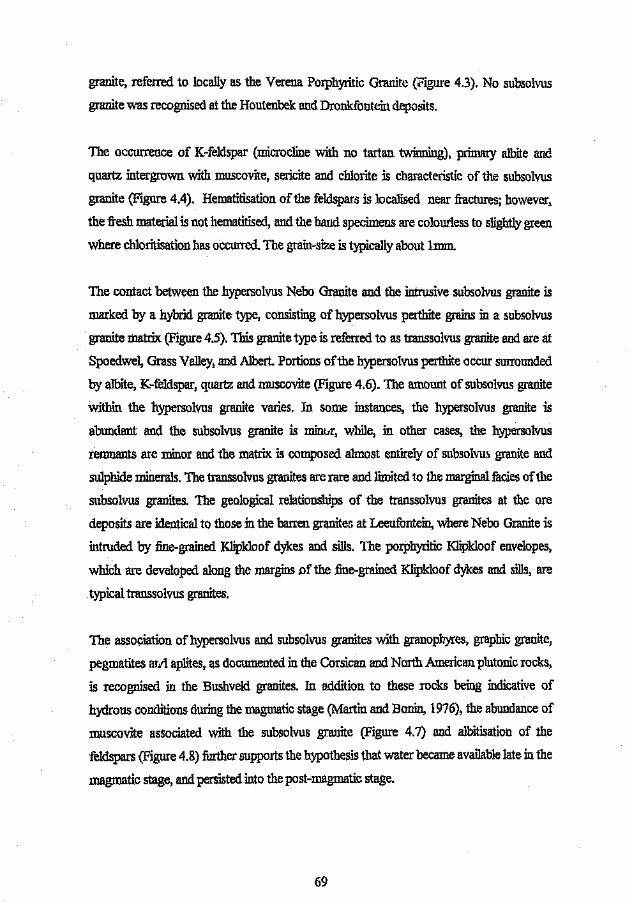
granite, referred to locally as the Verena Porphyritic Granite (Figure 4.3). No subsolvus
granite was recognised at the Houtenbek and Dronkfontein deposits.
The occurrence of K-feldspar (microc1ine with no tartan twinning), primary albite and
quartz intergrown with muscovite, sericite and chlorite is characteristic of the subsolvus
granite (Figure 4.4). Hematitisation of the feldspars is localised near fractures; however,
the fresh material is not hematitised, and the hand specimens are colourless to slightly green
where cb1oritisation bas occurred. The grain-size is typically about Imm,
The contact between the hypersolvus Nebo Granite and the intrusive subsolvus granite is
marked by a hybrid granite type, consisting of hypersolvus perthite grains in a subsolvus
granite matrix (Figure 4.5). 'Ibis granite type is referred to as transsolvus granite and are at
Spoedwel, Grass Valley, and Albert. Portions of the hypersolvus perthite occur surrounded
by albite, Kfeldspar, quartz and muscovite (Figure 4.6). The amount ofsubsolvus granite
within the hypersolvus granite varies. In some instances, the hypersolvus granite is
abundant and the subsolvus granite is minor, while, in other cases, the hypersolvus
remnants are minor and the matrix is composed almost entirely of subsolvus granite and
su1phide minerals. The transsolvus granites are rare and limited to the marginal facies of the
subsolvus granites. The geological relationships of the transsolvus granites at the ore
deposits are identical to those in the barren granites at Leeufontein, where Nebo Granite is
intruded by fine-grained Klipkloof dykes and sills. The porphyritic Klipkloof envelopes,
which are developed along the margins of the fine-grained Klipkloof dykes and sills, are
typical transsolvus granites.
The association of hypersolvus and subsolvus granites with granopbyres, graphic granite,
pegmatites arA aplites, as documented in the Corsican and North American plutonic rocks,
is recognised in the Bushveld granites. In addition to these rocks being indicative of
hydrous conditions during the magmatic stage (Martin and Bonin, 1976), the abundance of
muscovite associated with the subsolvus granite (Figure 4.7) and albitisation of the
feldspars (Figure 4.8) further supports the hypothesis that water became available late in the
magmatic stage, and persisted into the post-magmatic stage.
69
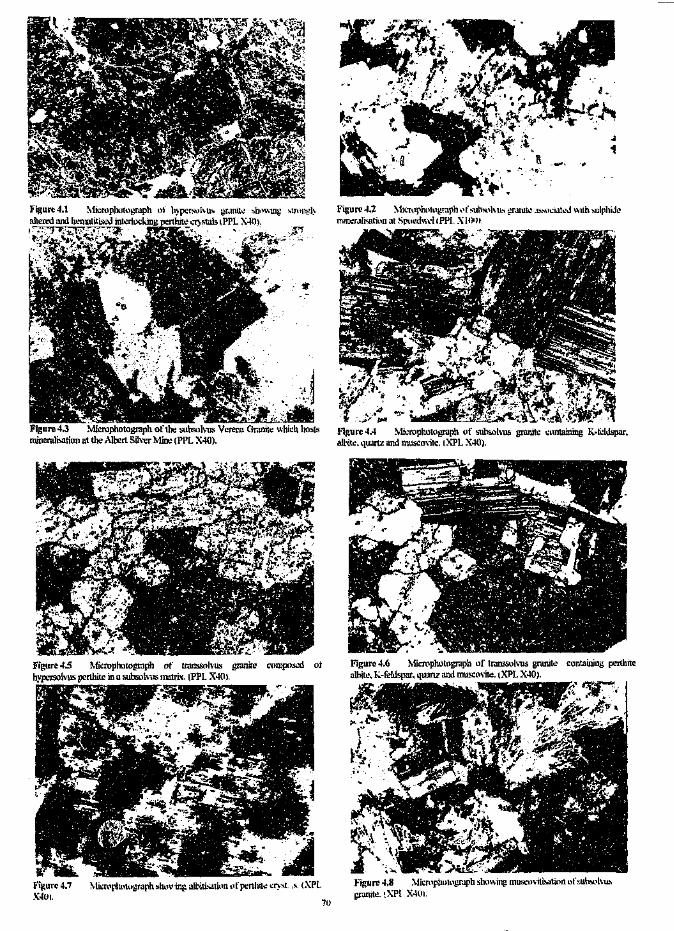
Microphotograph or the subsolvus Verena Granite which hostsmineralisation at the Albert Silver Mine (PPL X40).
Figure 4.5 Microphotograph or transsolvus granite composed othypersolvus pcrthite in a subsolvus matrix. lPPI. X40)
Figure 4.7X~(JI
Mkwph\lt<,graph sh,wing albitisation otperthite cryst. ,So (:\I'L
Figure 4.2 ~1tI.:nlrll{)t(lgr3ph~'fsuhS\.ll\u:'\ gr.uutc J:';!'\ll121Jh?J WIth !'IulphiJI!nuneralisation ar SPlledwd(PPL XIH'H
Figure 404 Microphotograph of subsolvus granite containing Ksfcldspar.albite. quartz and muscovite. (XPI. X40).
Figure 4.6 Microphotograph of transsolvus granite containing perthitealbite. K-teldspar. quartz and muscovite. tXPI. X40).
70
Figure 4,8 \licrophot,lgl'aph shll\\ing muscovitisation "f';ui1SlllvlLsgranite. \XPI X4111.

4.4 PETROGRAPIDC OBSERVATIONS
GANGUE MINERALOGY
The gangue mineralogy is directly related to the occurrence of mineralisation at each of the
deposits In areas where high-grade mineralisation is present, the primary gangue
assemblage has been almost entirely obliterated, being replaced by alteration minerals such
as sericite, chlorite, muscovite, and secondary albite. The ore and gangue minerals have
been separated, are discussed in order of their appearance in the paragenetic sequence.
Feldspar
The feldspars have been discussed in some detail in the section on hypersolvus and
subsolvus granites. The hypersolvus granites contain perthitised alkali feldspar and no
albite. The perthites are brick-red in colour, which imparts the characteristic red colour to
the rock. Incontrast, the subsolvus granites contain both K-feldspar and albite. There is no
perthitisation or hematitisation of the feldspars in the subsolvus granites at Grass Valley and
Spoedwel However, the host granites at Albert, which are all subsolvus in nature, exhibit
varying degrees ofhematitisation, particularly near the fractures and mineralisation.
Subsolvus granite samples from Spoedwel contain K-feldspar crystals, showing Carlsbad
twinning, which are associated with albite, quartz and muscovite. The crystals are euhedral
to subhedral and are intergrown with the quartz and muscovite. The muscovite occurs
between crystals and :fills cracks in the quartz. It also surrounds irregular masses of
chalcopyrite. The same association occurs at Grass Valley and Albert. However, at Albert,
the original albite is commonly overgrown by a second episode of albite precipitation,
which has not been observed at the other deposits (Figure 4.9).
At Spoedwel, the contrast in colours between poorly mineralised, deuterically altered
orange-red perthite of the hypersolvus granite, and the white unaltered reldspars of the
subsolvus granite, may be observed on the scale of a single thin section. The zone
containing predominantly hematitised feldspar is not well mineralised. Few small
chalcopyrite grains with covellite alteration rims are disseminated among chlorite masses.
Isolated grains of cassiterite occur with chalcopyrite growth on the rims. The mineralised
71

portion contains both hematitised perthite and unhematitised albite and Kfeldspar grains, in
addition to quartz and muscovite. The main ore mineral, chalcopyrite, embays feldspar
grains and :fills cavities formed by euhedral crystals. The perthites show chloritic alteration
that was associated with crystallisation of the subsolvus granites and the sulphide
mineralisation (Figure 4.10).
The host jranites at Albert are all subsolvus in nature and there are no hypersolvus-
snbsolvus granite contacts near the zone of mineralisation. However, perthite phenocrysts
:in a matrix: of subsolvus granite, which are typical oftranssolvus granites, do occur.
Chlorite
Five different varieties of chlorite have been identified at Spoedwel (1-5 below). The wide
variety of chlorites at Spoedwel is not present at Albert, where only the grass green chlorite
occurs. The presence of chlorite at Grass Valley is not as abundant, occurring only in
patches where copper mineralisation is found.
1) Grass-green Chlorite (Figure 4.11)
This chlorite is grass-green in colour and highly pleochroic. It occurs as fibres, flakes and
rosettes, in masses filling cavities formed by the euhedral borders of feldspar and quartz
crystals. It also occurs as linings of quartz veinlets cutting across feldspar crystals and pyrite
grains. This chlorite is associated with chalcopyrite precipitation. Evidence for this includes
co-precipitation of chlorite and chalcopyrite within pyrite grains, as chlorite rosettes within
chalcopyrite, and along fracture planes within pyrite and feldspar crystals.
The chlorite invades feldspar/perthite and, in extreme cases, almost obliterates the original
mineral assemblage. This chlorite is also associated with a pulse of quartz precipitation.
This quartz generation post-dates the grass-green chlorite precipitation, since perfect
rosettes of chlorite are found within large masses of quartz. The quartz is c.early secondary
in origin, since it shows distinct triple junctions and straight crystal faces. This quartz also
contains fibrous and rosette shaped muscovite crystals. The sulphide mineriiisation occurs
within the quartz masses and along grain boundaries. Chlorite occurs as solid inclusions
within the sphalerite.
72
The grass-green chlorite is intergrown with muscovite and quartz. The chlorite and
muscovite are intimately intergrown and assumed to have precipitated from the same fluid.
Fragments of chlorite, muscovite, quartz and hematitised feldspar have been observed
trapped in a vein filled with the are minerals chalcopyrite, bornite, chalcocite and digenite,
In areas closer to the main copper mineralisation, chloritisation of the feldspars is the
predominant alteration phenomenon, in contrast to the hematisation which is dominant inareas away from the orebodies.
2) A variation of this grass-green chlorite has been recognised in which the grain-size is
finer and the colour tends to be tinted with brown or black flecks. The distinctive
pleochroism of the normal grass-green chlorite is absent.
3) Another variation of the grass-green chlorite is extremely fine-grained, showing no
fibres or rosettes, consisting of an amorphous ground mass surrounding the sulphide
minerals (Figure 4.12). It is clearly distinguished from the rosette-shaped, grass-green
chlorite in sections where the fine-grained material is transected by quartz veinlets lined by
the rosette-shaped material Slight colour variations between the two generations of
chlorite are noticeable.
4) Broun ChloriteThis type of chlorite is scarce and is easily distinguished from the green chlorite by its
colour, lack of well developed rosettes and irs extremely fine grain size. It is light brown to
olive green in colour and shows weak pleochroism (Figure 4.13).
It occurs as veinlets transecting feldspar crystals and forming a network surrounding the
chalcopyrite masses. This chlorite seems to be associated with the alteration of cassiterite
and titanite, forming borders around them or:filling cavities into which they project.
5) Olive-green ChloriteThis type of chlorite looks similar to the grass-green chlorite, except that the colour tends
more towards the colour of the brown chlorite discussed above. It occurs as welt developed
73
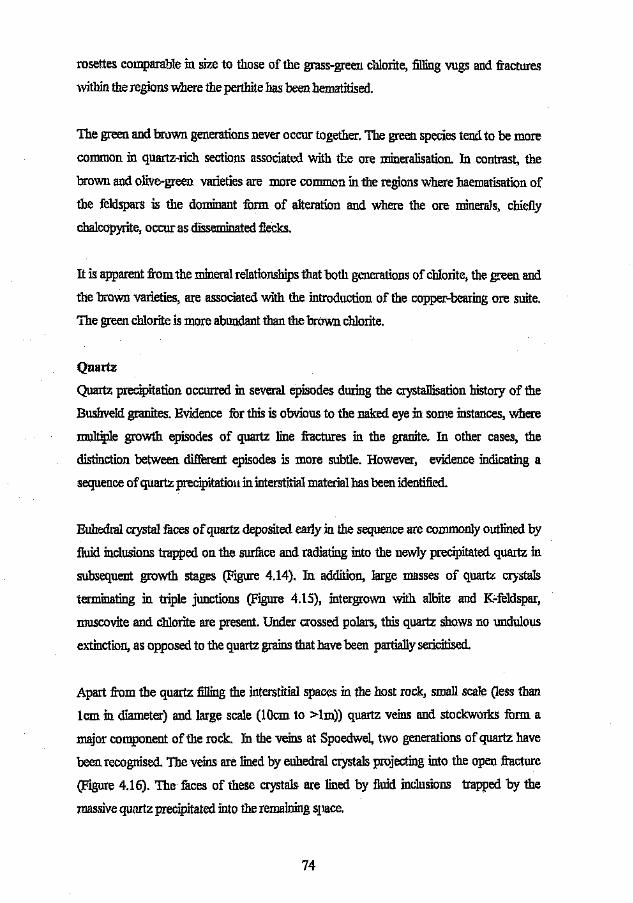
rosettes comparable in size to those of the grass-green chlorite, filling 'tugs and fractures
within the regions where the perthite has been hematitised.
The green and brown generations never occur together. TIle green species tend to be more
common in quartz-rich sections associated with the ore mineralisation. In contrast, the
brown and olive-green varieties are more common in the regions where haematisation of
the feldspars is the dominant form of alteration and where the ore minera1s, chiefly
chalcopyrite, occur as disseminated flecks.
It is apparent from the mineral relationships that both generations of chlorite, the green and
the brown varieties, are associated with the introduction of the copper-bearing ore Strite.
The green chlorite ismore abundant than the brown chlorite.
Quartz
Quartz precipitation occurred in several episodes during the crystallisation history of the
Bushveld granites, Evidence for this is obvious to the naked eye :in some instances, where
multiple growth episodes of quartz line fractures in the granite. In other cases, the
distinction between different episodes is more subtle. However, evidence indicating a
sequence of quartz precipitation in interstitial material has been identified.
Euhedral crystal faces of quartz deposited early in the sequence are commonly outlined by
fluid inclusions trapped on the surface and radiating into the newly precipitated quartz in
subsequent growth stages (Figure 4.14). In addition, large masses of quartz crystals
terminating in triple junctions (Figure 4.15), intergrown with albite and K-feldspar,
muscovite and chlorite are present. Under crossed polars, this quartz shows no undulous
extinction, as opposed to the quartz grains that have been partially sericitised.
Apart from the quartz filling the interstitial spaces in the host rock, small scale (less than
lcrn in diameter) and large scale (lOcm to >lm») quartz veins and stockworks form a
major component of the rock. In the veins at Spoedwel, two generations of quartz have
been recognised. The veins are lined by euhedral crystals projecting into the open fracture
(Figure 4.16). The faces of these crystals are lined by fluid inclusions trapped by the
massive quartz precipitated into the remaining space.
74
The vein-fill at Albert and Grass Valley is much more complex, with at least eight episodes
of precipitation being recognised at each deposit (Figures 17 and 18). Inaddition. evidence
from Grass Valley indicates that at least two episodes of quartz precipitation occurred
before cassiterite was deposited, making a total often increments of quartz growth.
Chalcedony
Veins and stringers of cryptocrystalline silica have been observed at Grass Valley. They
intersect the ore body and some of the veins have been re-utilised by later generations of
transparent quartz and late-stage hematite.
Muscovite and sericite
The occurrence of muscovite is alluded to in previous sections in association with other
minerals and is present at all three deposits. It occurs as relatively large fibres (-1Omm) to
smaller sized rosettes (.....Q,25mro).It is highly pleochroic, and, upon rotation of the stage,
shows alternating shades of green, blue and pink. The muscovite is associated with the
subsolvus granite and is intimately intergrown with albite, K-feldspar, grass-green chlorite
and quartz. It occurs intersitially with quartz in spaces between perthite crystals. It also is
associated with quartz filling interstices in the hypersolvus granite and subsolvus granite
(Figure 4.7).
Fine-grained muscovite (sericite) is the most common alteration mineral at the Albert and
Grass Valley deposits, and is formed by hydrothermal alteration of feldspars in the host
granites. At Albert, sericitisation of plagioclase is extreme in some areas, obliterating the
original minerals. The precipitation of secondary albite at Albert occurred after sericitisation
of'the core albite crystals. Perthite is not commonly highly sericitised.
75
Fluorite
Fluorite is abundant in the hypersolvus granite, where it fills vugs and open fractures. It is
distinguished from quartz by its higher relief, purple coloration, and isotropism. It contains
no mineral inclusions, such as chlorite, muscovite or quartz (Figure 4.19). Central portions
of some vugs contain zoned crystals of CaF2 which are surrounded by clear masses of
fluorite commonly showing fractures along the cleavage planes.
Fluorite also occurs in vein form, intergrown with the ore minerals galena, sphalerite,
tennantite and chalcopyrite. Paragenetic relationships do not suggest that fluorite
precipitation occurred at any particular point in the sequence of mineralisation, but rather
that precipitation continued throughout the sequence.
In addition to its association with the above mentioned ore minerals, fluorite is also
associated with quartz and muscovite in the same veins. Quartz and fluorite occur in
roughly equal proportions in ore veins, the quartz preceding the fluorite precipitation.
Furthermore, the relationship of muscovite with the quartz and fluorite and with the other
ore minerals is not easily unravelled. The quartz and muscovite were precipitated
throughout the paragenetic sequence, beginning during the precipitation of pyrite.
Cathodo-luminescence imagery has shown that two main episodes of fluorite occurred at
Spoedwel. An early massive in-fill of interstitial spaces is overgrown by a second generation
which shows progressive growth increments. At Albert, the second generation fluorite is
abundant and is associated with massive hematite and pitchblende, and post-dates the
sulphide assemblage.
Tourmaline
Tourmaline is not present at any of the ore deposits examined, although it is found in the
area east of Marble Hall (Leeufontein). Veins and spheroids of tourmaline are confined to
areas where faulting is evident, and are hosted by albitised fine-grained Klipkloof Granite.
The tourmaline spheroids (Figure 4.20) consist of plagioclase, quartz and K-feldspar. The
plagioclase and tourmaline are clearly secondary, being superimposed on the original
granite host. Granophyric intergrowths of quartz and tourmaline are observed, suggesting
76
that tourmaline and quartz were precipitated together. Furthermore. colour zonation within
the tourmaline is observed, implying that precipitation occurred as more than one event.
Small specks of chalcopyrite and sphalerite have been noted in some tourmaline spheroids.
Titanite
Crystals of titanite are relatively common and are disseminated th~oughout the granite.
They are subhedral to euhedral in shape, varying in length from small (>O,5mm) to
relatively large (L Jmm). Relief in these zrains is high, as in cassiterite and zircon, but the
birefringence is slightly lower than that ill cassiterite.
The titanite crystals are more abundant than the cassiterite crystals, showing r.istinctive
symplectic inter-growth. Alteration of the original titanite crystals is observed at different
stages in tln, -<,rogressioll towards leucoxene (a general term referring to the alteration
product of'Ti-bearing minerals). In specimens where the alteration is far advanced, there is
almost inevitably chalcopyrite and/or fine-grained brown pleochroic chlorite surrounding
the grains. Titanite/leucoxene is a similar shade of grey to altered cassiterite in reflected
light, but shows the symplectic texture described above. However, this texture is not
characteristic; some unaltered crystals appear homogeneous and the internal reflections
resemble those of sphalerite.
ZirconZircon crystals are small in diametre (2 - 5mm) and colourless to pale brown in colour.
They occur as subhedral to euhedral prisms with high relief, commonly bearing minute
cbalcopyrite and covellite grains along the borders (Figure 4.21). Several grains contain
specks of chalcopyrite inside the grains. Zircon has a lower bireflectance I birefringence
than either titanite or cassiterite, and is relatively scarce in comparison.
Evidence for at least two generations of zircon was observed at Spoedwel by petrographic
means. The first generation of zircon crystals are altered and are surrounded by alteration
halos caused by radiogenic ,-;,cay (Figure 4.22). The second generation of zircons are
unaltered, and are associated with the sulphide mineralisation (Figure 423). Supporting
evidence for l.ilepresence of multiple episodes of zircon precipitation has been obtained by
cathodo-luminescence imagery.
77
Figure 4. 24 is a cathodo-luminescence image which shows a euhedral zircon crystal with
multiple growth stages. The zircon occurs within a fracture in early generation quartz. that
has been filled by two later quartz generations.
Monazite
Monazite crystals are abundant in the samples associated with mineralisation at Spoedwel
and Dronkfontein, The high relief crystals are euhedral and are highly birefringent. Sulphide
specks are often found within the crystal, indicating that the precipitation of monazite
coincided with sulphide precipitation.
Calcite and ankerite
Calcite and ankerite were observed only at Grass Valley and occur late in the paragenetic
sequence, filling open cavities and fractures.
78
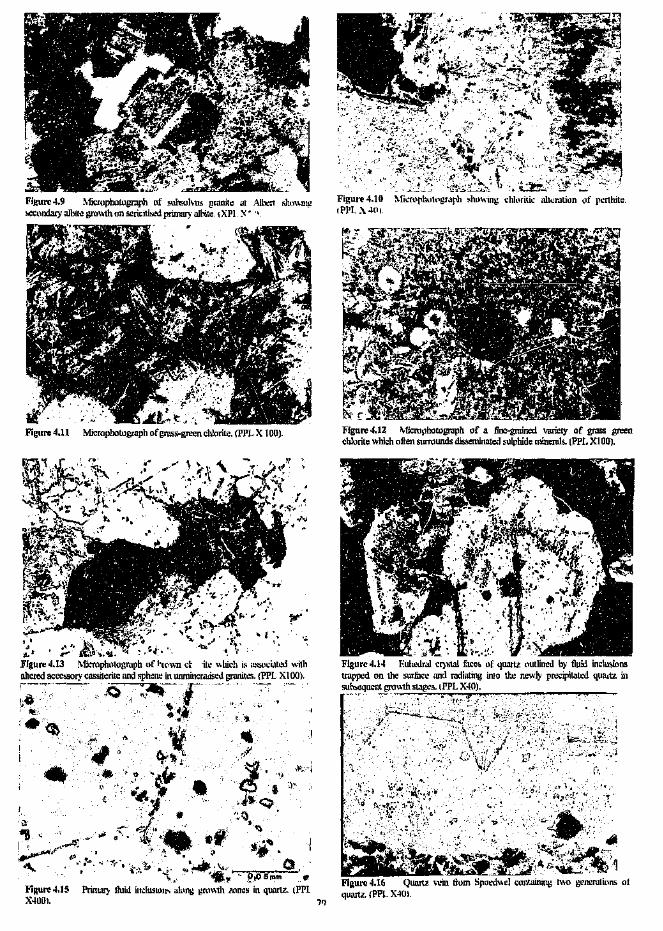
Figure 4.9 Microphotograph of subsolvus granite at Albert Shn\\lIl~
secondary albite growth on scricitised primary albite (XPI X' \
Figure 4.11 Microphotograph of grass-green chlorite. (PPL X 100).
~.
!,.o~.~ ."
•Figure 4.15 Primal} fluid inclusuui-, along growth /A)!lCSin quartz. (1'1'1X4110l.
Figure 4.10 Microphotograph showing chloritic alteration of perthite.,PI'L ,\,41>1
Figure -1.12 Microphotograph of a fine-grained variety of grass greenchlorite which often surrounds disseminated sulphide minerals. (I'I'L XIOO).
Figure 4.14 Euhcdral crystal [Ices of quartz outlined by fluid inclusionstrapped on the surface andsubsequent (I'I'L
7'1
""f ':J,~:;;,,_tt:~·~-. ~
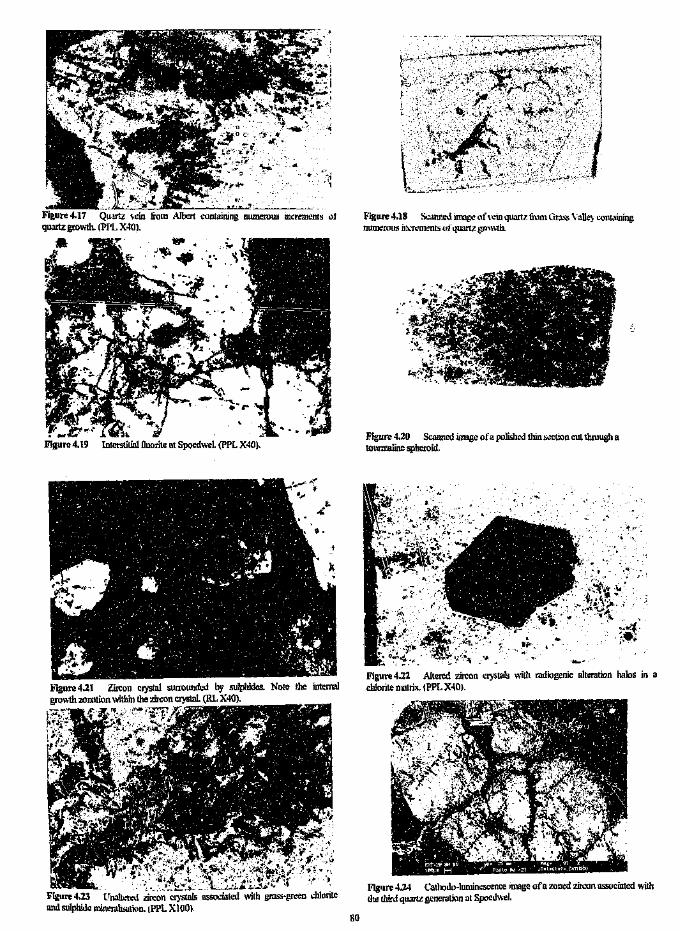
' __ .jA.'-'--~__;__' "_~'"- ....'-'''~'~. _. __ ..•
Figure 4.17 Quutz vein from Albert containing numerous mcrements 1)1quartz growth. (PPL X40).
Figure 4.19 Interstitiallluorite at Spoedwel, (PPL X40).
Figure 4.21 Zircon crystal surrounded by sulphides. Note the internalgrowth zonation within the zircon crystal. (RL X40).
Figure 4.23 Unaltered zircon crvstals associated \Iith grass-green chloriteand sulphide mineralisation. (PPL XiOO).
Figure 4.18 Scanned image of vein quartz from Grass \ aIIe~containingnumerous mcrements "I'quartz growth,
Figure 4.20 Scanned linage of a polished thin section cut through atourmaline spheroid.
Figure 4.22 Altered zircon crystals with radiogenic alteration halos in achlorite matrix. (PPL X40).
Figure 4.24 Cathodo-luminescence Image of'a zoned zircon associated withthe third quartz generation at Spocdwel,
80
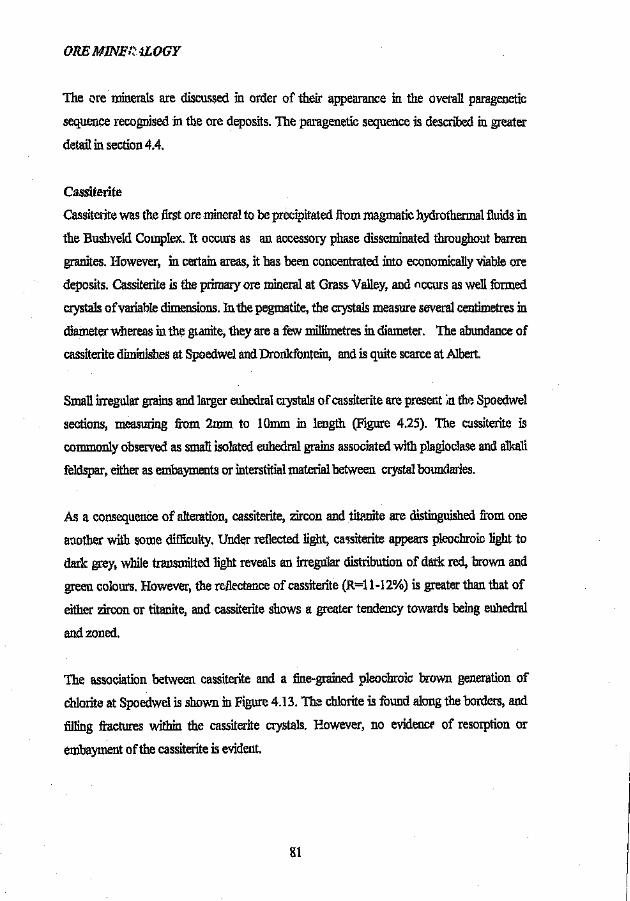
ORE MINEr;: 4LOGY
The ore minerals are discussed in order of their appearance in the overall paragenetic
sequence recognised in the ore deposits. The paragenetic sequence is described in greater
detail in section 4.4.
Cassiterite
Cassiterite was the first ore mineral to be precipitated from magmatic hydrothermal fluids in
the Bushveld Complex. It occurs as an accessory phase disseminated throughout barren
granites. However, in certain areas, it has been concentrated into economically viable ore
deposits. Cassiterite is the primary ore mineral at Grass Valley, and occurs as well formed
crystals ofvariable dimensions. In the pegmatite, the crystals measure several centimetres in
diameter whereas illthe granite, they are a few millimetres in diameter. The abundance of
cassiterite diminishes at Spoedwel and Dronkfontein, and is quite scarce at Albert.
Small irregular grains and larger euhedral crystals of cassiterite are present ill. the Spoedwel
sections, measuring from 2mm to lOmm in length (Figure 4.25). The cassiterite is
commonly observed as small isolated euhedral grains associated with plagioclase and alkali
feldspar, either as embayments or interstitial material between crystal boundaries.
As a consequence of alteration, cassiterite, zircon and titanite are distinguished from one
another with some difficulty. Under reflected light, cassiterite appears pleochroic light to
dark grey, while transmitted light reveals an irregular distribution of dark red, brown and
green colours, However, the reflectance of cassiterite (R=11-12%) is greater than that of
either zircon or titanite, and cassiterite shows a greater tendency towards being euhedral
and zoned,
The association between cassiterite and a fine-grained pleochroic brown generation of
chlorite at Spoedwel is shown in Figure 4.13. The chlorite is found along the borders, and
filling fractures within the cassiterite crystals. However, no evidence of resorption or
embayment of the cassiterite is evident.
81
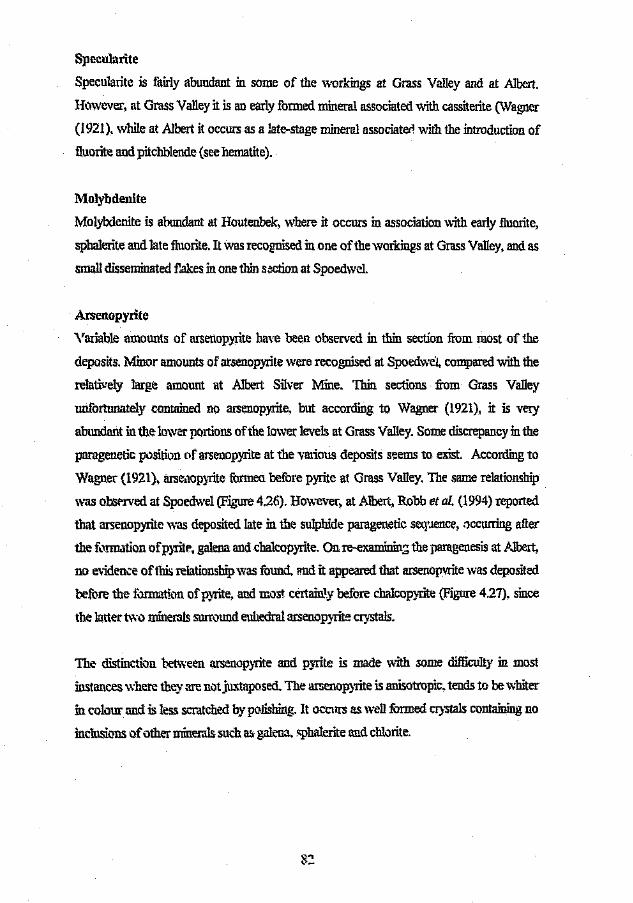
Specularite
Specularite is fairly abundant in some of the workings at Grass Valley and at Albert.
However, at Grass Valley it is an early formed mineral associated with cassiterite (Wagner
(1921). while at Albert it occurs as a late-stage mineral associate! with the introduction of
fluorite and pitchblende (see hematite).
Molybdenite
Molybdenite is abundant at Houtenbek, where it occurs in association with early fluorite,
sphalerite and late fluorite. Itwas recognised in one of the workings at GrdSS Valley, and as
small disseminated flakes in one thin section at Spoedwel,
Arsenopyrite
Variable amounts of arsenopyrite have been observed in thin section from most of the
deposits. Minor amounts of arsenopyrite were recognised at Spoedwei, compared with the
relatively large amount at Albert Silver Mine, Thin sections from Grass Valley
unfortunately contained no arsenopyrite, but according to Wagner (1921), it is veryabundant in the lower portions of the lower levels at Grass Valley. Some discrepancy in the
paragenetic position of arsenopyrite at the various deposits seems to exist. According toWagner (1921), arseaopyrite formea before pyrite at Grass Valley. The same relationship
was observed at Spoedwel (Figure 4.26). However, at Albert, Robb et al. (1994) reported
that arsenopyrite was deposited late in the sulphide paragenetic sequence, occurring after
the formation of pyrite, galena and chalcopyrite, On re-examining the paragenesis at Albert,
110 evidence of Ibis relationship was found, and it appeared that arsenopvrite was deposited
before the: formation of pyrite, and most certainly before chalcopyrite (Figure 4.27). since
the latter two minerals surround euhedral arsenopyrite crystals.
The distinction between arsenopyrite and pyrite is made with some difficulty in most
instances where they are notjuxtaposed. The arsenopyrite is anisotropic. tends to be whiter
in colour and is less scratched by polishing. It occurs as well formed crystals containing no
inclusions of other minerals such as galena, sphalerite and chlorite.
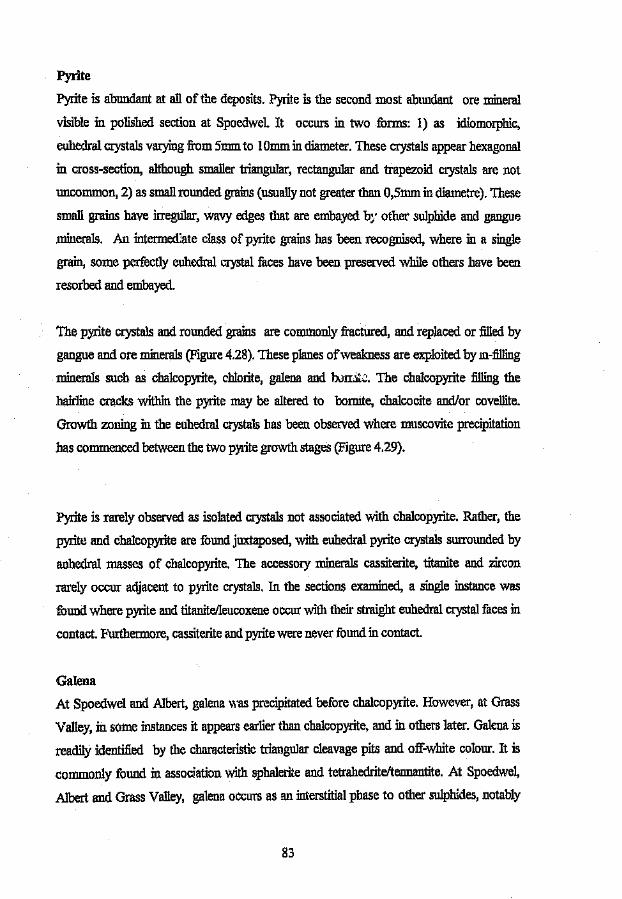
Pyrite
Pyrite is abundant at all of the deposits. Pyrite is the second most abundant ore mineral
visible in polished section at Spoedwel It occurs in two forms: 1) as idiomorphic,
euhedral crystals varying from 5mm to lOmm in diameter. These crystals appear hexagonal
in cross-section, although smaller triangular, rectangular and trapezoid crystals are not
uncommon, 2) as small rounded grains (usually not greater than O,5mm indiametre). These
small grains have irregtilar, wavy edges that are embayed by other sulphide and gangue
minerals. An intermedate class of pyrite grains has been recognised, where in a single
grain, some perfectly euhedral crystal faces have been preserved while others have been
resorbed and embayed.
The pyrite crystals and rounded grains are commonly fractured, and replaced or filled by
gangue and ore minerals (Figure 4.28). These planes of weakness are exploited by in-filling
minerals such as chalcopyrite, chlorite, galena and OOUJlW. The chalcopyrite filling the
hairline cracks within the pyrite may be altered to bormte, chalcocite and/or covellite.
Growth zoning in the euhedral crystals has been observed where muscovite precipitation
has commenced between the two pyrite growth stages (Figure 4.29).
Pyrite is rarely observed as isolated crystals not associated with chalcopyrite. Rather, the
pyrite and chalcopyrite are found juxtaposed, with euhedral pyrite crystals surrounded by
anhedral masses of chalcopyrite. The accessory minerals cassiterite, titanite and zircon
rarely occur adjacent to pyrite crystals. In the sections examined, a single instance was
found where pyrite and titanitelleucoxene occur with their straight euhedral crystal faces in
contact. Furthermore, cassiterite and pyrite were never found in contact.
GalenaAt Spoedwel and Albert, galena was precipitated before chalcopyrite. However, at Grass
Valley, in some instances it appears earlier than chalcopyrite, and in others later. Galena is
readily identified by the characteristic triangular cleavage pits and off-white colour. It is
commonly found in association with sphalerite and tetrahedrite/tennantite. At Spoedwel,
Albert and Grass Valley, galena occurs as an interstitial phase to other sulphides, notably
83
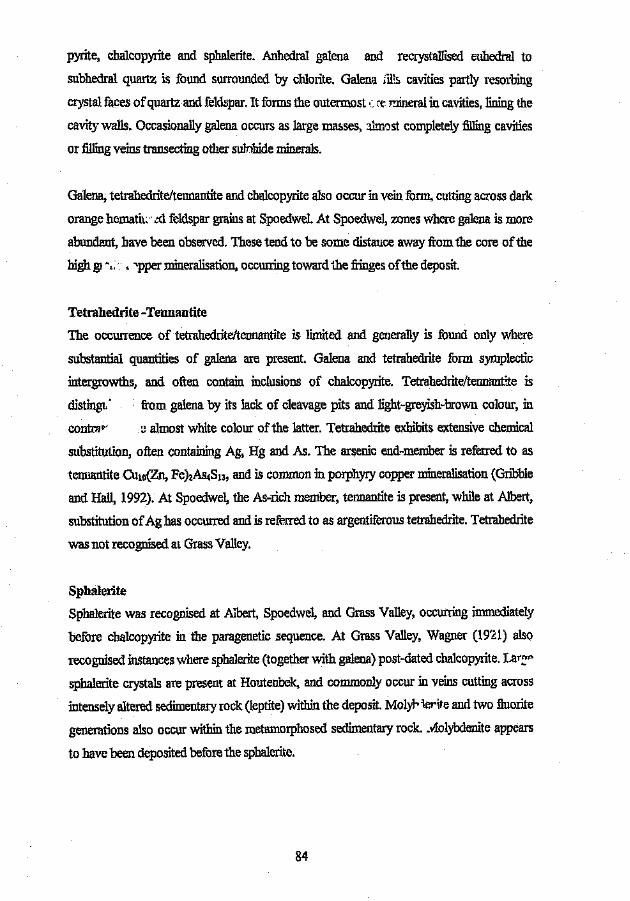
pyrite, chalcopyrite and sphalerite. Anhedral galena and recrystallised euhedral to
subhedral quartz is found surrounded by chlorite. Galena @s cavities partly resorbing
crystal faces of quartz and feldspar. It forms the outermost .- ct· mineral in cavities, lining the
cavity walls. Occasionally galena occurs as large masses, almost completely filling cavities
or filling veins transecting other sulnbide minerals.
Galena, tetrahedrite/tennantite and chalcopyrite also occur in vein form, cutting across dark
orange hematn. zd feldspar grains at Spoedwel. At Spoedwel, zones where galena is more
abundant, have been observed. These tend to be some distance away from the core of the
high gJ "" ,"'pper mineralisation, occurring toward tile fringes of the deposit.
Tetrahedrite -Tennantite
The occurrence of tetrahedrite/tennantite is limited and generally is found only where
substantial quantities of galena are present. Galena and tetrahedrite form symplectic
intergrowths, and often contain inclusions of chalcopyrite. Tetrahedriteltennantite is
distingt.' from galena by its lack of cleavage pits and light-greyish-brown colour, in
contra= ~ almost white colour of the latter. Tetrahedrite exhibits extensive chemical
substitution, often containing Ag, Hg and As. The arsenic end-member is referred to as
tennantite CulO(Zn, Fe)2As4S13,and is common in porphyry copper mineralisation (Gribble
and Hall, 1992). At Spoedwel, the As-rich member, tennantite is present, while at Albert,
substitution of Ag has occurred and is referred to as argentiferous tetrahedrite. Tetrahedrite
was not recognised at Grass Valley.
Sphalerite
Sphalerite was recognised at Albert, Spoedwel, and Grass Valley, occurring immediately
before chalcopyrite in the paragenetic sequence. At Grass Valley, Wagner (1921) also
recognised instances where sphalerite (together with galena) post-dated chalcopyrite, Lar~p
sphalerite crystals are present at Houtenbek, and commonly occur in veins cutting across
intensely altered sedimentary rock (leptite) within the deposit. Moly}- ierite and two fluorite
generations also occur within the metamorphosed sedimentary rock .• v101ybdenite appears
to have been deposited before the sphalerite.
84
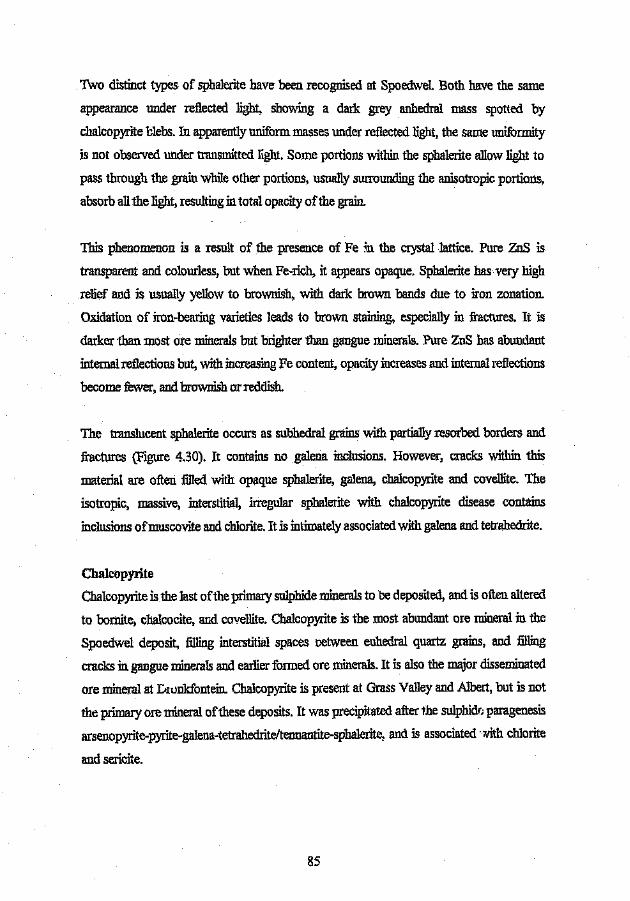
Two distinct types of sphalerite have been recognised at Spoedwel. Both have the same
appearance under reflected light, showing a dark grey anhedral mass spotted by
chalcopyrite blebs. In apparently uniform masses under reflected light, the same uniformity
is not observed under transmitted light. Some portions within the sphalerite allow light to
pass through the grain while other portions, usually surrounding the anisotropic portions,
absorb all the light, resulting in total opacity of the grain.
This phenomenon is a result of the presence of Fe ~n the crystal lattice. Pure ZnS is
transparent and colourless, but when Pe-rich, it appears opaque. Sphalerite has very high
relief and is usually yellow to brownish, with dark brown bands due to iron zonation.
Oxidation of iron-bearing varieties leads to brown staining, especially in fractures. It is
darker than most ore minerals but brighter than gangue minerals. Pure znS has abundant
internal reflections but, with increasing Fe content, opacity increases and internal reflections
become fewer, and brownish or reddish.
The translucent sphalerite occurs as subhedral grains with partially resorbed borders and
fractures (Figure 4.30). It contains no galena inclusions. However, cracks within this
material are often filled with opaque sphalerite, galena, chalcopyrite and covellite. The
isotropic, massive, interstitial, irregular sphalerite with chalcopyrite disease contains
inclusions of muscovite and chlorite. It is intimately associated with galena and tetrahedrite.
ChalcopyriteChalcopyrite is the last of the primary sulphide minerals to be deposited, and is often altered
to bornite, chalcocite, and covellite. Chalcopyrite is the most abundant ore mineral in the
Spoedwel deposit, filling interstitial spaces oetween euhedral quartz grains, and filling
cracks in gangue minerals and earlier formed ore minerals. It is also the major disseminated
ore mineral at Dronkfontein, Chalcopyrite is present at Grass Valley and Albert, but is not
the primary ore mineral of these deposits. Itwas precipitated after the sulphide paragenesis
arsenopyrite-pyrite-galena-tetrahedrite/tennantite-sphalerite, and is associated vith chlorite
and sericite.
85
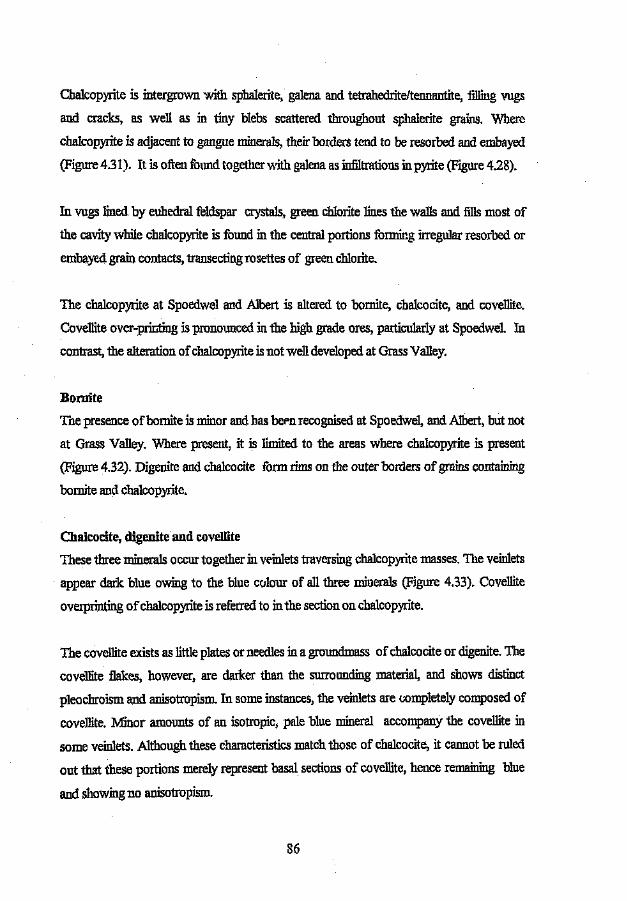
Chalcopyrite is intergrown with sphalerite, galena and tetrahedrite/tennantite, filling vugs
and cracks, as well as in tiny blebs scattered throughout sphalerite grains. Where
chalcopyrite is adjacent to gangue minerals, their borders tend to be resorbed and embayed
(Figure 4.31). It is often found together with galena as infiltrations in pyrite (Figure 4.28).
Invugs lined by euhedral feldspar crystals, green chlorite lines the walls and fills most of
the cavity while chalcopyrite is found in the central portions forming irregular resorbed or
embayed grain contacts, transecting rosettes of green chlorite.
The chalcopyrite at Spoedwel and Albert is altered to bornite, chalcocite, and covellite,
Covellite over-printing is pronounced in the high grade ores, particularly at Spoedwel. In
contrast, the alteration of chalcopyrite is not well developed at Grass Valley.
Bornite
The presence of bornite is minor and bas been recognised at Spoedwel, and Albert, but not
at Grass Valley. Where present, it is limited to the areas where chalcopyrite is present
(Figure 4.32). Digenite and cbalcocite form rims on the outer borders of grains containing
bornite and chalcopyrite.
Chalcocite, digenite and covellite
These three minerals occur together in veinlets traversing chalcopyrite masses. The veinlets
appear dark blue owing to the blue colour of all three minerals (Figure 4.33). Covellite
overprinting of chalcopyrite is referred to in the section on chalcopyrite.
The covellite exists as little plates or needles in a groundmass of chalcocite or digenite. The
covellite flakes, however, are darker than the surrounding material, and shows distinct
pleochroism and anisotropism. In some instances, the veinlets are completely composed of
covellite. Minor amounts of an isotropic, pale blue mineral accompany the covellite in
some veinlets. Although these characteristics match those of chalcocite, it cannot be ruled
out that these portions merely represent basal sections of covellite, hence remaining blue
and showing no anisotropism.
86
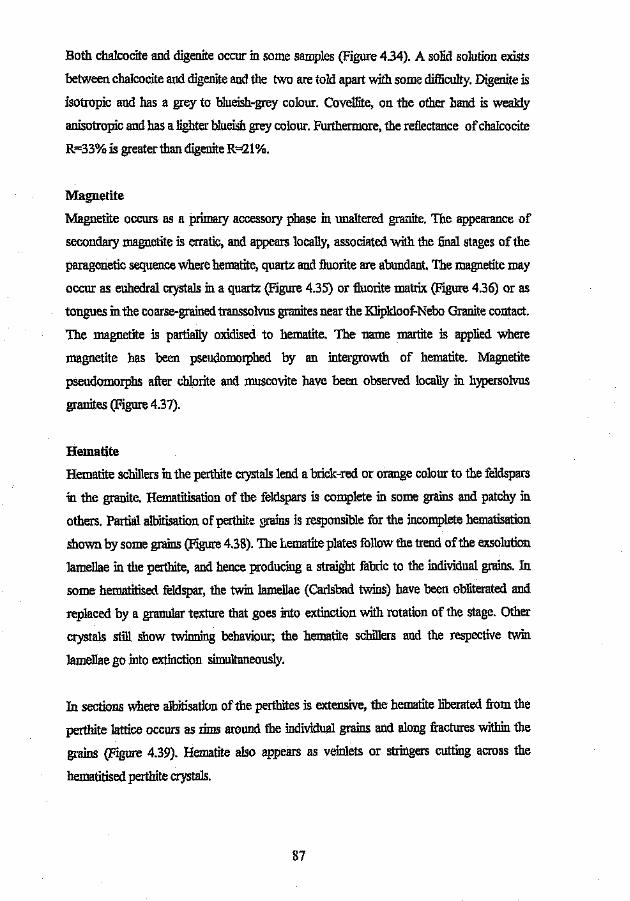
Both chalcocite and digenite occur in some samples (Figure 4.34). A solid solution exists
between chalcocite and digenite and the two are told apart with some difficulty. Digenite is
isotropic and has a grey to blueish-grey colour. Covellite, on the other band is weakly
anisotropic and bas a lighter blueish grey colour. Furthermore, the reflectance of chalcocite
R=33% is greater than digenite R'='21%.
Magnetite
Magnetite occurs as a primary accessory phase in unaltered granite. The appearance of
secondary magnetite is erratic, and appears locally, associated with the final stages of the
paragenetic sequence where hematite, quartz and fluorite are abundant. The magnetite may
occur as euhedral crystals in a quartz (Figure 4.35) or fluorite matrix (Figure 4.36) or as
tongues inthe coarse-grained transsolvus granites near the KJipkloof-Nebo Granite contact.
The magnetite is partially oxidised to hematite. The name martite is applied where
magnetite has been pseudomorphed by an intergrowth of hematite. Magnetite
pseudomorphs after chlorite and muscovite have been observed locally in hypersolvus
granites (Figure 4.37).
Hematite
Hematite schillers in the perthite crystals lend a brick-red or orange colour to the feldspars
in the granite. Hematitisation of the feldspars is complete in some grains and patchy in
others. Partial albitisation of perthite grains is responsible for the incomplete hematisation
shown by some grains (Figure 4.38). The Lematiteplates follow the trend of the exsolution
lamellae in the perthite, and hence producing a straight fabric to the individual grains. In
some hematitised feldspar, the twin lamellae (Carlsbad twins) have been obliterated and
replaced by a granular texture that goes into extinction with rotation of the stage. Other
crystals still show twinning behaviour; the hematite: scbillers and the respective twin
lamellae go into extinction simultaneously.
In sections where albitisation of the perthites is extensive, the hematite liberated from the
perthite lattice occurs as rims around the individual grains and along fractures within the
grains (Figure 4.39). Hematite also appears as veinlets or stringers cutting across the
hematitised perthite crystals.
87
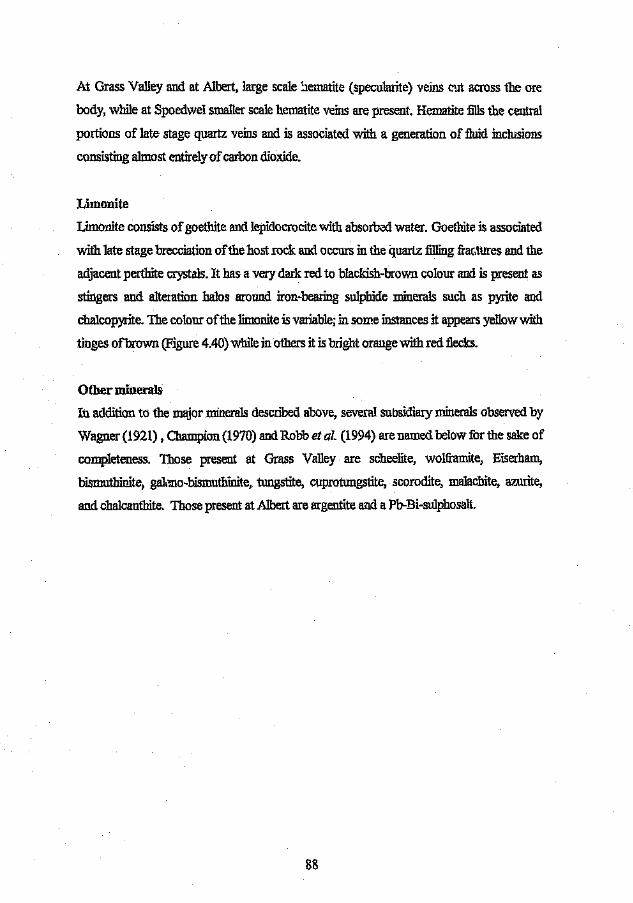
At Grass Valley and at Albert, large scale iiematite (specularite) veins cut across the ore
body, while at Spoedwel smaller scale hematite veins are present. Hematite fills the central
portions of late stage quartz veins and is associated with a generation of fluid inclusions
consisting almost entirely of carbon dioxide.
Limonite
Limonite consists of goethite and lepidocrocite with absorbed water. Goethite is associated
with late stage brecciation of the host rock and occurs in the quartz filling fractures and the
adjacent perthite crystals. It has a very dark red to blackish-brown colour and is present as
stingers and alteration halos around iron-bearing sulphide minerals such as pyrite and
chalcopyrite. The colour of the limonite is variable; in some instances it appears yellow with
tinges of brown (Figure 4.40) while in others it is bright orange with red flecks.
Other minerals
In addition to the major minerals described above, several SUbsidiary minerals observed by
Wagner (1921) ,Champion (1970) and Robb et al. (1994) are named below for the sake of
completeness. Those present at Grass Valley are scheelite, wolframite, Eiserham,
bismuthinite, galeno-bismuthinite, tungstite, cuprotungstite, scorodite, malachite, azurite,
and cha1canthite. Those present at Albert are argentite and a Pb-Bi-sulphosalt,
88

" ..•...... ' .. "_.. . ... ", ..
,. ... '#
•. i"."C.
Figure 4,29 Microphotograph otpyntc (opaque) showing two growth stage'separated by muscovite and albite precipitation (PPl. X2(0).
"""'r-:.<'-?'F¥ -?;,."f
Figure 4.:.u Ch;lk"p)ri:e ,l,,,,,i"tcu with galcna. tennantite and 'phaknrc atSpocdwd IRI XIII", 89
Figure 4.2R Euhedral pyrite crystal fractured and ..ued b~ galena andchalcopyrite, (RL XIOO).
Figure 4.30 rransparent sphalerite altered to opaque spnalerne alongfrac tures and grain boundaries. (RL XI 00).
Figure 4.3:tRL Xl(H))
Chalcopyrite from Spoedwcl altered to bormte and chalcocite

(PPLXIOO).
Figure 4.37 Magnetite pseudomorphs afler muscovite in Nebo granite atSpocdwe' !Backscatter image).
Figure ·Ll9 l lemarne liberated from the perthite lauice occurs .I.' runs aroundthe individual grains and ak111gfractures within the grains t l'Pl. XIOII).
Figure ....J... Chalcocite. digenite ;H1d covellitc ~i.'mrll?td~ rl..'pbl'echalconvrite tRL XIOO).
Figure 4.36 Magnetite crystals associated with fluorite at Albert ,PPLXIOO).
Figure 4.38 Hernatitised perthite crystals showing partial albitisation (XPLX20(l)
Figure 4.40 Limonite staining aSSOclateJ with oxidation and hydmtion 01Fe-bearing mineral»
'10

4.5 PARAGENETICSEQUENCE
The paragenetic sequence of ore minerals has been presented in tile preceding section
describing the occurrence of the different minerals. It appears that the overall paragenetic
sequence at each of the deposits is similar, with some minor variations. The paragenetic
sequence as described by Wagner (1921) for the Mutue Fides-Stavoren Tin Field, in which
the Grass Valley deposit is situated, is shown in Table 4,1. The paragenetic sequence has
been divided into three major phases with subdivisions, namely the Pneumatolytic phase,
the Hydrothermal Phase, and the Phase of Alteration. This paragenetic sequence broadly
compares with the sequences recorded at the Spoedwel and Albert deposits in this study.
At Albert and Spoedwel, the minerals associated with the first phase of mineralisation are
not well represented, but the assemblages of the Hydrothermal and Alteration Phases are
abundant. Variations in the paragenetic position of certain minerals at Albert were
recognised by Robb et at. (1994). Inparticular, arsenopyrite was placed after chalcopyrite
in the paragenetic sequence and no early generation was observed. This was not the case at
Spoedwel, where the position of arsenopyrite is the same as at Grass Valley. It is possible
that a second generation of arsenopyrite was recognised by Robb et al. (1994).
Furthermore, although minor amounts of galena and SF...alerite precede chalcopyrite at
Grass Valley, the paragenetic position of the bulk of the galena and sphalerite was
recorded by Wagner (1921) as occu+ing after chalcopyrite, in contrast with Spoedwel and
Albert, where galena and sphalerite were deposited before chalcopyrite.
In Chapter 3, it was mentioned that similarities between the Bushveld Complex and the
Olympic Dam deposit in South Australia were responsible for stimulating the exploration
efforts in the Bushveld granites, and it is worth comparing the parageneses of this deposit
with that determined for mineralisation in the Bushveld.
Three mineral association have been recognised at Olympic Dam. The early magnetite (±
hematite), chlorite, sericite, siderite, and minor pyrite, chalcopyrite and uraninite
(association I) is extensively overprinted by hematite, sericite, chalcocite, bornite,
pitchblende, barite, fluorite, and chlorite (association IT). The paragenetically latest major
mineral association consists of'hematite, or hematite + granular quartz ± barite (association
IIl). All three mineral associations display complex overlapping and indistinct boundaries.
91
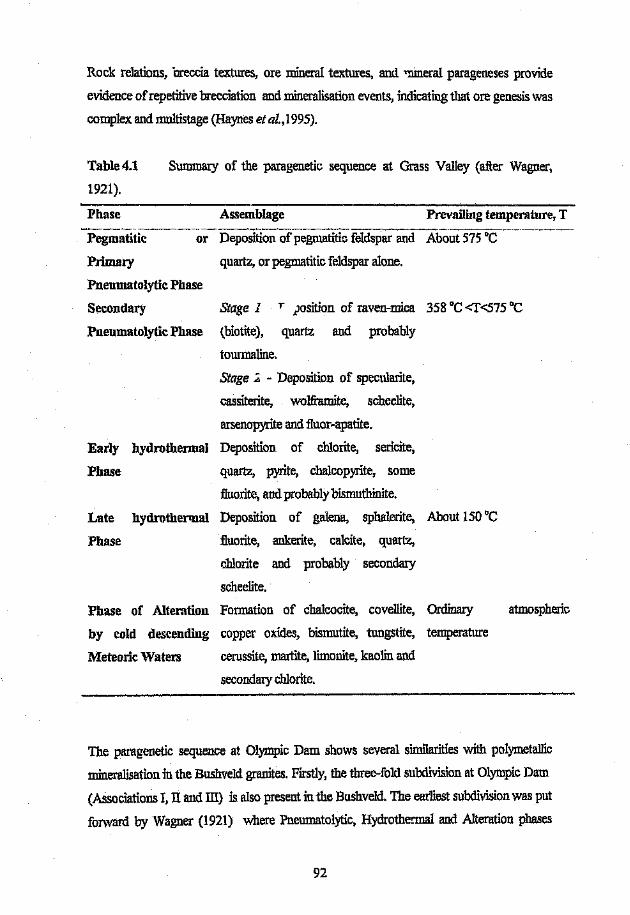
Rock relations, breccia textures, ore mineral textures, and -nineral parageneses provide
evidence of repetitive brecciation and mineralisation events, indicating that ore genesis was
complex and multistage (Haynes et al., 1995).
Table 4.1
1921).
Summary of the paragenetic sequence at Grass Valley (after Wagner,
Assemblage Prevailing temperature, T-'P~g-;n-~titi~-~~----- ~~---Dep~~tion~fpegn1.~titi;feldspar-~d Abo;rt-57S- °C-- - _- -- ----
Primary quartz, or pegmatitic feldspar alone.
Phase
Pneumatolytic Phase
Secondary
Pneumatolytic Phase
Stage 1 r position of raven-mica 358°C <r<575 "C
(biotite), quartz and probably
tourmaline.
Stage ~ - Deposition of specularite,
cassiterite, wolframite, scheelite,
arsenopyrite and fluor-apatite.
Early hydrothermal Deposition of chlorite, sericite,
Phase quartz, pyrite, chalcopyrite, some
fluorite, and probably bismuthinite,
Late hydrothermal Deposition of galena, sphalerite, About 150°C
fluorite, ankerite, calcite, quartz,
chlorite and probably secondary
scheelite.
Phase of Alteration Formation of chalcocite, covellite, Ordinary
Phase
atmospheric
by cold descending copper oxides, bismutite, tungstite, temperature
Meteoric Waters cerussite, martite, limonite, kaolin and
secondary chlorite,
The paragenetic sequence at Olympic Dam shows several similarities with polymetallic
mineralisation in the Bushveld granites. Firstly, the three-fold subdivision at Olympic Dam
(ASsociations I, II and III) is also present in the Bushveld. The earliest subdivision was put
forward by Wagner (1921) where Pneumatolytic, Hydrothermal and Alteration phases
92

were recognised in the Mutue Fides-Stavoren tin fields. Smits (1980) recognised a similar
three stage division in the paragenesis at the Boschhoek copper deposit, and referred to
them as the Early, Main and Late Stages of mineralisation (see Chapter 3).
As discussed above, the classification of Wagner (1921) for mineralisation at Grass Valley,
compares favourably with the scheme proposed in this study for Grass Valley, Spoedwel
and Albert (Figures 4.41, 4.42 and 4.43). Some of the discrepancies in paragenetic
sequences between these deposits may be explained by considering the paragenetic
sequence proposed by Smits (1980) at Boschhoek. Smits (1980) recognised multiple
generations of pyrite, bismutbinite, galena, sphalerite, quartz and siderite This may explain
the varying positions of galena and sphalerite in the paragenetic sequence at Grass Valley,
Albert and Spoedwel, since no distinction was made between different generations of these
minerals.
Comparing the mineral assemblages of the different stages of mineralisation at Olympic
Dam with that at Boschhoek, Grass Valley, Albert and Spoedwel, some striking similarities
are obvious. Association I at Olympic Dam correlates with the Early Stage at Boschhoek,
where the presence of siderite, hematite/magnetite/marcasite and pyrite seem to be
characteristic. The Main and Late Stages at Boscbhoek dir:r from Associations II and II at
Olympic Dam. They also differ from the three subdivisions created in this study for
mineralisation at Grass Valley, Spoedwel and Albert, Association I is not present at Grass
Valley, Spoedwel and Albert. Stage 1 at these deposits is represented by the specularite-
cassiterite-wolfratnite-molybdenite-scheelite-arsenopyrite-fluorapatite assemblage, which is
not represented at Olympic Dam. The main episode of sulphide mineralisation in the
Bushveld occurred in Stage 2. Alteration of this assemblage is associated with the
introduction of the hematite-fluorite-pitchblende assemblage, and correlates with
Association II at Olympic Dam.
Thus, it can be concluded that, although of smaller scale, mineralisation in the Bushveld
granites is somewhat similar to that at Olympic Dam, not only in terms of the geological
setting, but also in terms of the observed paragenetic sequence.
93
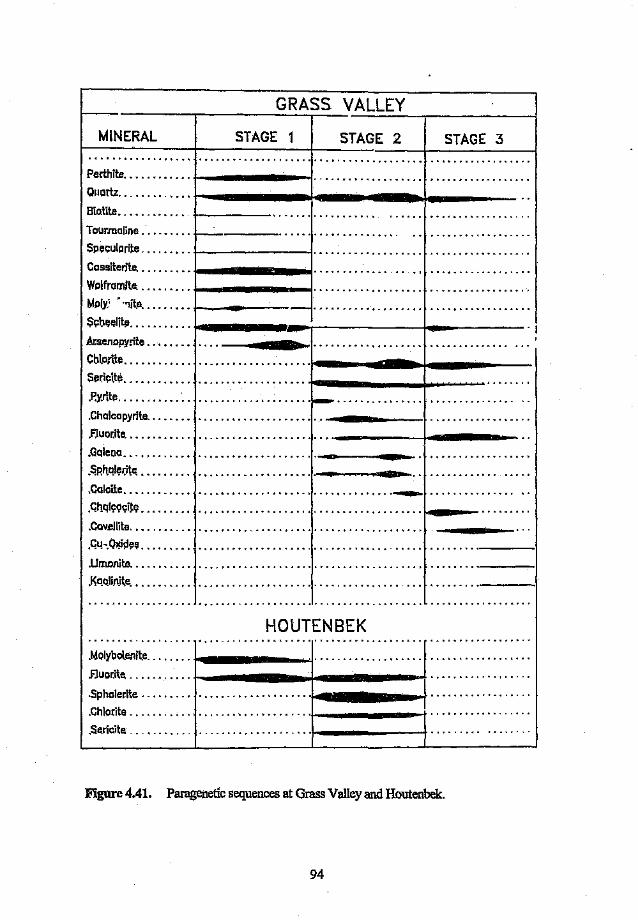
GRASS VALLEYSTAGE 2 STAGE 3
Perthlte '" t-------., .QIIOrU ...•..••.•••• t----..--,....-...,...--~r_-----8io.Ute .
Tourmaline ....•.... t-~----. ................... . .Speculoriie ......•.. t-----~--J. .................. . .Cossiterite l-------~ ,... .Wolframite i--------i , .Mpfy: • ·.,jt.e ...•..••. t-------- '"..'"., .S~t:u~elit~.. . . .. . . . . . . 1
Ars.enopyrite ..•.....Cbl.ortte .S!!,i~i.t!l .
t-----.................. . .
M!NERAL STAGE 1.~ ~ .
---- l1li---1··········· .
.Chalcopyrite .
.F.Iuor.ite. ..Galeoa ...!:iRh.ql~l;itl<•.•.......Calcite ..GhqI9QC;itE?•.........Cav.ellite. " ..G4-.Q~igel? ..Umonite .J~qQlinjt.e .
.................................. _....................................... j-da-_ .........
....................!4IB-..,...g--+-_ .....--.P.Y.lite. . . . . . . . . • . .. . :-- ..•............
......... ~ ~----~~ .
························.......----f ..........·....·... ... , . .... . . . . . . .. . '_-..,0_-_11 _.................... --------~~ aaEDee--
HOUTENBEKJ~C)lybol.enik jo4I -j .FJuol"'i~Q -'---------+ _-----t '.... '.\ l'
.Sphalerite. .
.Chlorite .
.Se.ric.ite. .
.....................~---r .····················I-----t......·....··....................I------t ..
AD-.·
·........----1........·----1·........·----1
Figure 4.41. Paragenetic sequences at Grass Valley and Houtenbek.
94
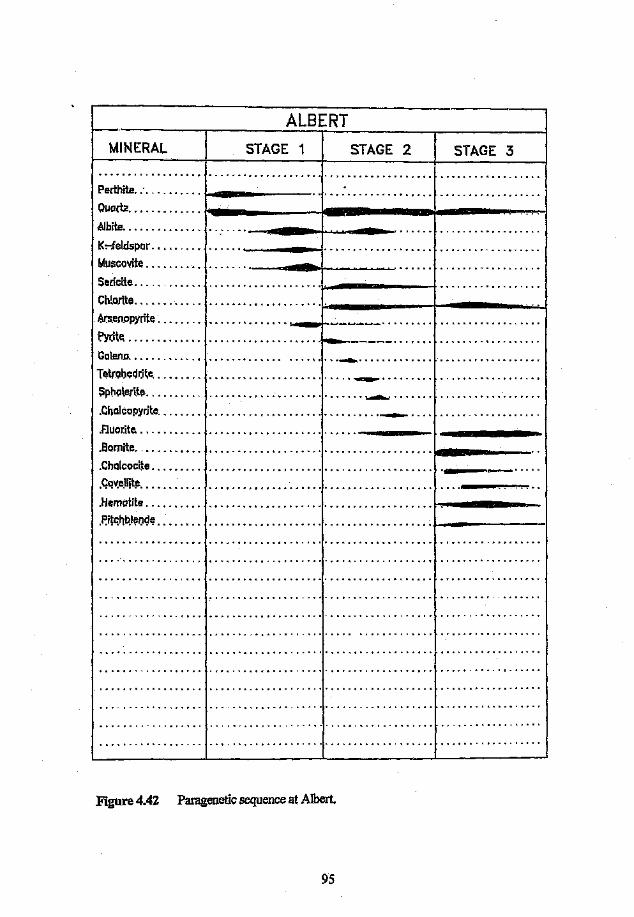
ALBERTr--------------,------------MINERAL STAGE 1 STAGE 2 STAGE 3
Perthlte t------- .Quort2 r-- ----l4-----.,..-.,.--.,..,..,...,..~bjte .
K:-felrlspor .Muscovite .
Sericite .
......................................... ~.....
~~-"'-j"'"'''''''''''''' ..
.. .. .. .. -~ .... iII-!lIIr>i~~~~~.. ".f-.. --------l .
Ch!o.rite p.. ---j- ---- I~(s.eJ1Ppyriie. '" .. " _I-~-~-~- .P.yr.ite.......................•.......... 1------- .Galena .TetrQbecj~ite...•.....Sph(ll.eri~e ..Chalcopyrite .
.F.Iuor.ite. .
Bcrnlte .........•..
.Chalcocite ...•.•...
.Gqv:eJlit!! ...•.......
.Hematite .
.~nc;~I{I~l!g~ .
.. ~. .. .. .. .. .. .. .. . \ ..
........................... ._. .
.............................. ....-.,.... ....
..................... ... .._---
....................................... ----._--_ .....
.......................................r.-----. ..._
·······································}.------I
Figure 4.42 Paragenetic sequence at Albert.
95

SPOEDWELMINERAL STAGE 1
. _--
STAGE 2 STAGE 3Massive Sulphide Zone
••••••••••. 0." •••••••••.••••• _ .. """ , ....
Perthlts, . . . . . . . . . .. """5 . . . . . . . . . . . . . . . .. . .P.Jbite. . . . . . . . . . . . .. . ..•••..... ~ .
Quartz. ....•. '" ..• t--IIIIII---r-jII--- __-'~----_IK:-felrlspar .Muscovite .Ar.s.enopyrite. . . . . . .. . .pyr.ite ...•.•...............•......•.... _ ............•
Cnol.c.opyritEl .Galen.a .Spbalerite .C' ellite ..
........._---.1 ..
.. -----l----~-~- .
............................... ---- ..
................................. _ , .
............................. ..- ..
", """ " .. " " ........................' t--~-
. 'Disseminated' Mfrie·rciifsaHon······················Perthite +-_--- .Cassiterite. .....•... f--"''''-' .Zircoo .Sphene '" .Ars.enopyrite . . . . . . .. •.•...... . .Pyr.ite .....•.......•.•.••...•..•...•..• 1- ,
Muscovite/sericitE: ...
Quartz ...•......... 1-------....------+-------1Gole.no .Tennantite. .. . .Spbalerite .Chalcopyrite .Fluorite, .Chclcoclte .
Cavellitll .Urnonite , .Kaolioite .
Figure 4.43 Paragenetic sequence in the zones of massive sulphide and disseminated
mineralisation at Spoedwel
---- .•••• ~ 1' .
·····················-----f..·..·....··......
..................... _-- ..
....................... -~~._ .
..................... ~....~- ....
........................... _--
. . . . . . .. . . . . . . . . . . . . . . . . ----~--------,_......~~~
.................... t---- ..
96
4.6 ALTERATION
Alteration is an integral part of each of the deposits studied. The minerals and assemblages
provide useful insights into the processes of mineralisation and the consequent overprinting
of alteration minerals on existing ore and gangue minerals. This section deals with the types
of alteration, alteration assemblages and their significance.
ALTERATION ASSElYfBLAGES
An alteration assemblage refers to a set of minerals that grew in equilibrium with one
another during the hydrothermal process. At the Spoedwel, Grass Valley and Albert
deposits, several such assemblages have been recognised, each defining a characteristic
alteration assemblage, as proposed by Meyer and Hemley (1967) and discussed in detail in
Barnes (1967) and Guilbert and Park (1986).
Advanced Argillic Alteration
According to Meyer and Hem1ey (1967), this type of alteration represents extreme
hydrolytic base-leaching from all aluminous phases. Guilbert and Park (1986) report that it
represents low Km+and Na+iIr by low activities of the alkalis and strongly acidic, high Ffluids. The resultant assemblages are characterised by dickite, kaolinite, pyrophyllite,
sericite, quartz, alunite, pyrite, tourmaline, topaz, zuynite, and amorphous clays (Meyer
and Hemley, 1967). This type of alteration-is evident at Spoedwel and Albert, where
alteration of chalcopyrite to covellite and digenite is pronounced, and where alteration of
the feldspars has produced gangue minerals such as kaolinite, sericite, quartz, alunite, and
tourmaline. At Leeufontein, the presence of tourmaline veins and spheroids, which are
developed along fracture zones, is indicative of this type of alteration.
Phyllic or Sericitic Alteration
The assemblage, sericite-quartz-pyrite is the most abundant of all the alteration types. At
Albert and Spoedwel, seriritir alteration is the predominant type associated with t'
mineralisation, while, at Grass Valley, althoug, it is pronounced, it is somewhat less
abundant. Normal accessories include chlorite, rutile/leuccxene, and titanite.
97
Propyllitic Alteration
Propyllitic assemblages are characterised by epidote and chlorite. and include albite.
septechlorite, and carbonate, commonly with sericite, pyrite, or Fe-oxides
Chloritisation
The alteration of feldspars, notably K-feldspar perthite to chlorite, is common in the
granites hosting mineralisation. Chlorite is also present as masses of well-formed rosettes.
associated with the sulphide mineralisation at both Albert and Spoedwel, The extent of
cbloritisation of the host granite is variable; in extreme cases, the original minerals are
obliterated. Compositional variations have also been noted. Fe-rich grass green varieties
tend to be associated with the sulphide assemblage, whereas Fe-deficient brown cblorites
are associated with orthomagmatic tin deposition.
Since there is a marked absence of hornblende and biotite at Spoedwel and copious
amounts of a variety of chlorites, it is probable that the original hornblende and lor biotite
grains have been altered to chlorite. The subsolvus granites in particular have localised
zones of extreme cbloritisation of the plagioclase crystals. This type of alteration is net
observed in the hypersolvus granites well removed from the sulphide mineralisation.
Albitisation
Albitisation occurs inpatches within the fine-grained Klipkloof Granites in the area east of
Marble Hall, as well as associated with the mineralisation at Albert, Spoedwel and Grass
Valley. It is manifested in several forms, viz. as partial replacements in perthite, as
secondary overgrowth on albite crystals of the subsolvus Verena Granite, and as complete
replacement pockets in fine-grained Klipkloof Granite, where it is referred to as Albitised
Klipkloof Granite. Albitisation is not associated with the introduction of sulphides, but is
commonly accompanied by Fe-oxides. This relationship is evident at Albert where vast
amounts of secondary albite and hematite has been precipitated.
98
Potassic Alteration
Potassic alteration involves the presence of introduced or recrystallised Kfeldspar in a rock
with or without biotite and sericite, commonly with traces of anhydrite, apatite, tluorite,
calcite, scheelite, chalcopyrite, molybdenite, pyrite, magnetite, or hematite.
This assemblage is present at all the ore deposits studied, and is associated with the
subsolvus granites. At Spoedwel, the hypersolvus granites were composed primarily ofK-
feldspar, which subsequently became hydrothermally altered by the fluids associated with
the subsolvus granite. The introduction of secondary K-feldspar is associated with the
crystallisation of the subsolvus granite. The secondary K-feldspar is in equilibrium with
muscovite (sericite). Biotite is limited to the highly differentiated pegmatitic and aplitic
portions of the intrusion. In contrast, the subsolvus Verena Granites which host
mineralisation at Albert contain significant amounts of biotite disseminated thought the
rock. Biotite is scarce in the Grass Valley deposit and occurs associated with hematite as
specks and patches in Albitised Klipkloof Granite.
Potassic alteration played a major role in the mineralising process, particularly during the
introduction of the sulphide paragenesis, and suggests high K'II-r'" conditions at the time.
ALTERAT10N REACTIONS
The chemical processes identified as being responsible for the observed alteration are the
following:
1) hydrolysis
2) hydration-dehydration
3) alkali or alkali-ear.L L·.l~'lC;oroatism
4) silicification
5) oxidation-reduction
6) su1phidation
99
Hydrolysis (If" metasomatism)
Examination of the alteration minerals suggests that hydrolysis was a major contributor to
the evolution of the wall rock and fluid composition. Hydrolysis reactions involve H\ and
hence have a large influence on the pH of the fluids. Buffering of pH by the conversion of
anhydrous silicates like feldspars to hydrolysed silicates like mica and clay minerals has a
pronounced effect on the solubility and association-dissociation relationships (Guilbert and
Park, 1986).
The consumption errr to alter the feldspar to muscovite affects the pH of the fluid and
the degree of dissociation of the hydrogen containing complexes, such as Bel As a
consequence the degree of associatic "'fNaCl and KCl and metal chloride complexes and
the solubility of metals in solution is affected,
Apart from consuming tr in reactions like
3KA1Si30s + 2W (aq) B KAhShOlO(OH)z + 6Si02 + 2K'(aq)
K-feldspar Muscovite
(Sericite)
W ions may be liberated by reactions between metals and (HS)" to produce sulphides,
Thus, hydrolysis controls the stability of the feldspars, micas and clays, as well as the
transfer ofions like r,Na+ Ca 2+ and Mi+ from the rock into solution.
Hydration
Evidence ofbydration is seen in the supergene alteration ofbematite to goethite.
Hematite Goethite
Alkali Earth Metasomatism
The most important reaction of this type involves the alteration of Kfeldspar to chlorite
according to the following equation:
100

3KAJShOg + 6.5 Mg2T ++ M~.5(ShAl)OlO(OH)S + K++ 11}f
K-feldspar Chlorite
Alkali earth metasomatism is also responsible for the conversion of Kfeldspar to albite
during albitisation.
Silicification
Silicification involves theaddition or production ofa quartz-family member. This type of
reaction is represented by the simple precipitation of quartz in open pore spaces, and as
quartz veins. Several episodes of silicification occurred during the history of the Bushveld
granites. The precipitation of late-stage, low temperature chalcedony veins at Grass Valley
amongst earlier and later generations 0+ quartz is unusual, and it is not clear what caused
this change in the nature of silica.
Oxidation-reduction
Oxidation-reduction reactions are particularly important at Spoedwel since it is primarily anFe-Cu deposit. These reactions affect ferrous-ferric iron and sulphur mineralogies. For
example,
Magnetite Hematite
2 KFe:;AiSh01U(OH)2 + 01. +-l>2I(AISilOg + 2Fe203 + 2H20
Ferrous iron biotite Kfeldspar Magnetite
SulphidationThese reactions are also likely to have occurred at the deposits since the products of this
reaction are abundant, although the reactants are absent.
2 KFe3AlShOlO(0H)z + 6S2 B2KA1ShOs + 6FeS2 + 2HzO +302 (g)
Ferrous iron biotite K-feldspar Pyrite
101

4.7 CONCLUSION
Petrographic studies of the granites in the Leeufontein area, as well as in areas of
mineralisation in the eastern lobe of the Bushveld Complex, have elucidated several key
factors in understanding the development of the Lebowa Granite Suite and the localisation
of mineralisation,
The association of mineralisation with subsolvus granites at Grass Valley, Spoedwel, and
Albert is one of the most important points to come out of this petrographic study. In
addition, the hypothesis proposed by Martin and Bonin (1976) to explain the hypersolvus-
subsolvus granite association involves the (Conceptsof water saturation of the magma, and
the incursion of meteoric water. 'The significance ofthis is that it lends weight to the model
of Y" .emann (1985), in which he ascribes the development of the aplitic Klipkloof Granite
to volatile enrichment of rest liquids.
Water enrichment probably occurred during the solidification of the Klipkloof Granite,
when crystallisation of the pluton was well advanced (Kleemann and Twist, 1989). This
statement is verified by mineralogical relationships at Spoedwel. The host granite at
Spoedwel is the Nebo Granite, and the petrographical evidence suggests that water
saturation occurred during the final stages of the crystallisation of this hypersolvus granite,
coinciding with the onset of subsolvus granite crystallisation. Evidence for an influx of
water is abundant at the deposits in the eastern lobe of the Bushveld Complex.
Muscovitisation, local fusion of perthites, albitisation of feldspar, and precipitation of late
albite, suggest that an increase in P(H20) occurred after partial solidification of the
hyperso lvus granite, Tensional fracturing resulted in the escape of volatiles, as well as the
Klipkloof Granite, which occurs as dykes as sills occupying large scale regional faults.
Thus, the fractures form the link between the subsolvus granite, and the metal charged
hydrothermal fluids which deposited the complex paragenesis in the Bushveld granites
The concept of water enrichment of the magma is supported by evidence from Ollila
(1981), who conducted a study of the structural state and composition of the alkali
feldspars in the Bushveld granites, and found that the alkali feldspars in the Bobbejaankop
granite (coarse-grained Klipkloof Granite) exhibit the highest degree of ordering and are
102
maximum micro cline, indicating the lowest thermal state. The alkali feldspars from the
Lease Granite (fine-grained Klipkloof Granite) are intermediate micro cline, indicating a
higher thermal state, or less ordered state, which is due to the rapid cooling rate of this
granite (Ollila, 1981). The Nebo (or "Main") Granite alkali feldspars are monoclinic,
reflecting a state of greater disorder in the lattice. OlIDa (1981) explained this phenomenon
as the result of volatile deficiency during initial crystal growth stages, which may have
prevented the later development of triclinic alkali feldspars. The variation in the structural
state of the alkali feldspars is directly related to the availability of hydrothermal fluids during
their cooling history (Parsons, 1978). Thus, the absence of volatiles during the
crystallisation of the Nebo Granite is reflected in the monoclinicity of the K-feldspars, even
though the rate of cooling was sufficiently slow for the formaticn nf large interlocking
crystals. As the degree of'fractionation of the host rock increases, the water content of the
residual melt increases, causing increased order in the younger K-feldspar crystals. ThJS,
the higher degree of order in the coarse-grained Klipkloof Granite reflects the increasing
water content of the residual melt. This trend would have continued during the formation of
the Lease Granite (Fine-grained KlipkloofGranite) were it not for the rapid cooling of this
magma (Kleemann and Twist, 1989).
The overall paragenetic sequence suggests that mineralisation took place in three discrete
episodes. The first episode of mineralisation resulted in the formation of cassiterite-
scheelite-wo1:framite-mQlybdenite-specularite and possibly arsenopyrite. The mineralisation
is disseminated and formed by processes related to fractional crystallisation of the magma.
The second episode of mineralisation is represented by the sulphide paragenesis pyrite-
galena-tetrahedriteltennantite-sphalerite-chalcopyrite. The occurrence of this assemblage is
fracture-related, with sizeable deposits located on the flanks of large-scale regional faults.
These fracture systems presumably acted as conduits for mineralising fluids. The third
episode of mineralisation resulted in the deposition of hematite, pitchblende and large
amounts of fluorite. The introduction of this third assemblage along the same fracture
systems which localised the sulphide assemblage, resulted in alteration of the sulphides, to
secondary minerals such as bornite, chalcocite, digenite, covellite and limonite.
The comparison between granite-hosted mineralisation in the Bushveld and Olympic Dam
granites indicates that the geological setting and paragenetic sequences are somewhat
103
similar. Although the siderite-bearing assemblage, which is recognised as the first
association at Olympic Dam, has not been recognised at Houtenbek, Grass Valley.
Spoedwel, Dionkfontein and Albert, it is preserved at the Boschhoek copper deposit and
was described by Smits (1980). According to Smits (1980), the CO..,-rich magmatic gases
reacted with Fe2+ in the fluids, precipitating siderite and releasing It. This reaction resulted
in a lowering of the fluid pH, which is reflected as a change to silica gangue minerals in the
subsequent mineral assemblages.
The excess hydrogen ions caused pervasive sericitisation ofthe wall rock, liberating metals
such as 1('", Na+ Ca2+ and Mg2- from the wall rock into solution, where they are transported
and re-precipitated as alteration minerals such as chlorite, albite and K-feldspar in the
propyllitc zone of alteration.
'The alteration assemblages associated with the subsolvus granite, and the precipitation of
the SUlphide assemblage, indicate that the mineralising fluids were not particularly acidic
and that high K:J1f" conditions prevailed at the time. Supergene enrichment of chalcopyrite,
tourmalinisation, hematitisation of siderite veins and the presence of hematite veins were
interpreted by Smits (1980) as being indicative of the introduction of oxygenated meteoric
water along the fractures. In addition, the alteration of feldspar to chlorite and albite, and
the oxidation and hydration of sulphides lowered the pH of the fluids consderably,
favouring the transport of ferric iron (at pH less than 3). These late-stage fluids were
strongly acidic and contained low Ie-lIt and Na+,'y_rratios. The ferric oxides that form
through hydrolysis ofFe20J are highly insoluble in the presence of oxygen and cannot be
rehydrated. Tbus, iron is transported by highly acidic fluids until it comes into contact with
oxygenated ground waters, that are channelled along fractures, after which it is
precipitated.
Thus, the alteration assemblages and stages in the paragenetic sequence in the granite-
hosted deposits in the Bushveld are, in part, controlled by fluctuations in the pH of the
hydrothermal fluids, caused by wall rock alteration, and the introduction of oxidising fluids.
These fluids were channelled along fractures in the granite, which served to concentrate
and localise polymetallic mineralisation in the Bushveld granites.
104
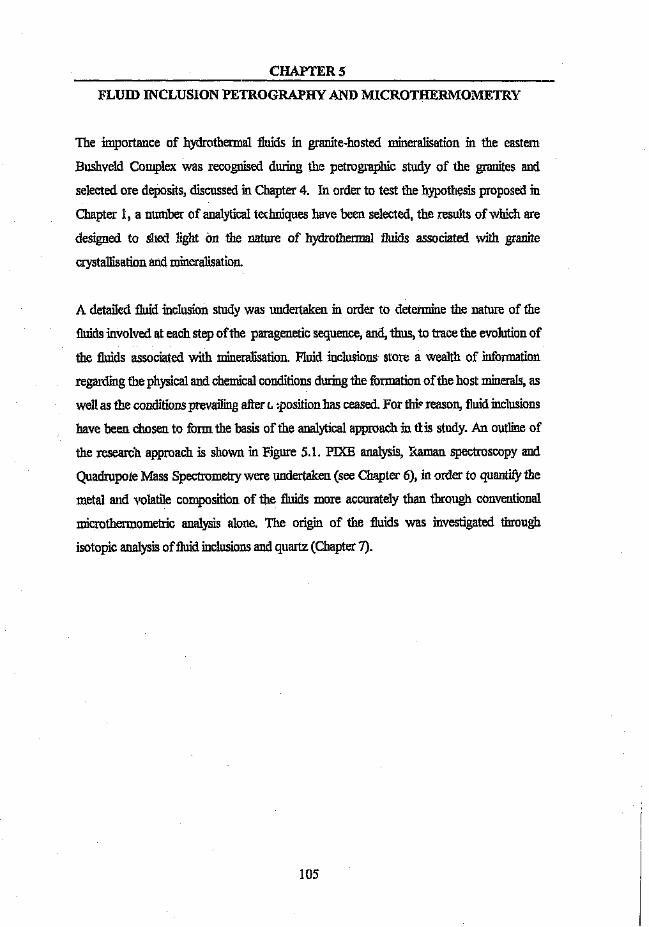
CHAPTERS
FLUID INCLUSION PETROGRAPHY AND MICROTHERMOMETRY
The importance of hydrothermal fluids in granite-hosted mineralisation in the eastern
Bushveld Complex was recognised during the petrographic study of the granites and
selected ore deposits, discussed in Chapter 4. In order to test the hypothesis proposed in
Chapter 1, a number of analytical techniques have been selected, the results of which are
designed to shed light on the nature of hydrothennal fluids associated with granite
crystallisation and mineralisation.
A detailed fluid inclusion study was undertaken in order to determine the nature of the
fluids involved at each step of the paragenetic sequence, and, thus, to trace the evolution of
the fluids associated with mineralisation. Fluid inclusions store a wealth of information
regarding the physical and chemical conditions during the formation of the host minerals, as
well as the conditions prevailing after (, -position has ceased. For this reason, fluid inclusions
have been chosen to form the basis of the analytical approach in tlis study. An outline of
the research approach is shown in Figure 5.1. PIXE analysis, Raman spectroscopy and
Quadrupole Mass Spectrometry were undertaken (see Chapter 6), in order to quantify the
metal and volatile composition of the fluids more accurately than through conventional
micro thermometric analysis alone. The origin of the fluids was investigated through
isotopic analysis offluid inclusions and quartz (Chapter 7).
105
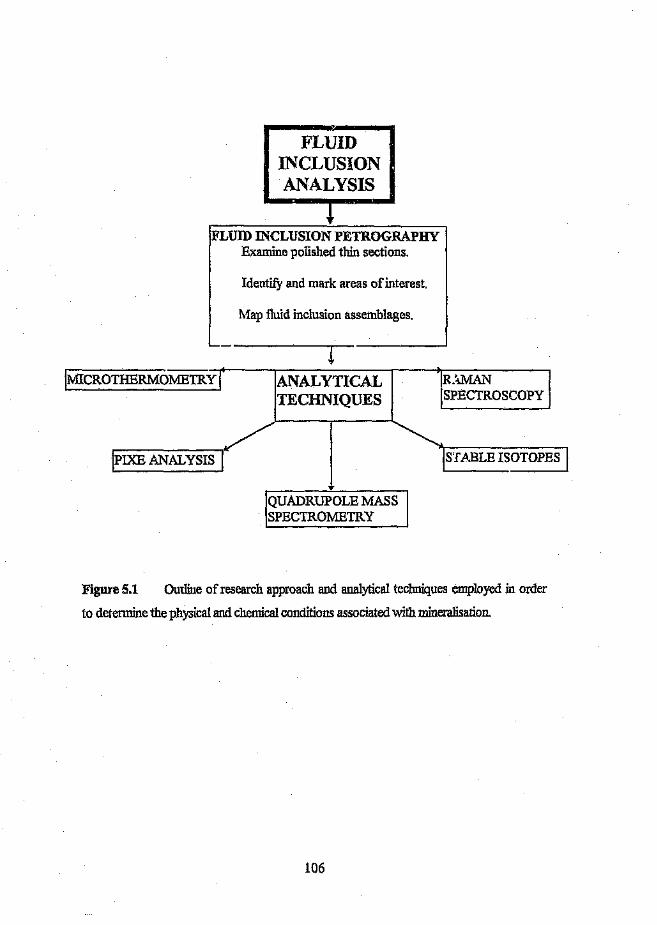
FLUIDINCLUSIONANALYSIS
I"FLUID INCLUSION PETROGRAPHY
Examine polished thin sections.
Identify and mark areas of interest.
Map fluid inclusion assemblages.
IM1CROTHERMOMETRY I ANALYTICALTECHNIQUES
,----,/[FIXE ANALYSIS I 1STABLE ISOTOPES I
IQUADRUPOLE MASS IISPECTROMETRY
Figure 5.1 Outline of research approach and analytical techniques employed in order
to determine the physical and chemical conditions associated with mineralisation.
106

5.1 FLUID INCLUSIONS p.J\i']) THEIR APPLICATIONS IN TIlE STUDY OF
ORE DEPOSITS
During the crystallisation of most minerals, minute amounts of the fluid from which the
crystal is growing are trapped in small imperfections in the crystal lattice, or along fractures
within the crystal. These small fluid-filled cavities (generally smaller than O.1mm) become
sealed during subsequent crystal growth, forming what are referred to as fluid inclusions.
Minerals are generally precipitated from hydrothermal fluids at elevated temperatures, and
as the cooling proceeds, a number of changes in the fluid inclusion take place, the most
obvious change being the appearance of a vapour bubble (Figure 5.2), which forms by
differential contraction between the host crystal and the fluid. When the pressure of the
inclusion drops below the saturation vapour pressure of the contained fluid at a particular
temperature, the fluid splits into two phases - liquid and vapour. The relative amounts of
these two . - -;with the original fluid density. Any volatile species present (such as HI-O,
C02 and L.4) is partitioned into the bubble. In some instances, the fluids contain
significant am «nts of CO2, which if, after being partitioned into the vapour bubble, issufficiently dense, may split into two phases, i.e. liquid CO2 and vapour CO2• Thus, the fluid
inclusion consists of three phases (Figure 5.3).
In addition to the formation of a vapour bubble, upon cooling the fluids often become
saturated with respect to certain components, and precipitate solid phases. Since the
trapped fluids are saturated with respect to the host mineral (Roedder, 1984), crystallisation
of those component; occurs on the walls of the inclusion. Other solid phases may also be
crystallised within the inclusion, and are referred to as daughter crystals (Figure 5.4). These
solids are distinguished from solids which were trapped along with the fluid, and were not
precipitated from solution inside the fluid inclusion.
The size and shape of fluid inclusions is controlled by several factors; the crystallography,
as well as the rate of cooling and precipitation of the host mineral, are among the most
important. The shape of inclusions varies from well-defined euhedral negative crystal
outlines which mirror the symmetry of the host crystal, to highly irregular, flattened,
spheroidal, oblate or tabular shaped inclusions. Fluid inclusions are rarely observed with
the naked eye due to their minute size. Some museum specimens of the largest inclusions
107
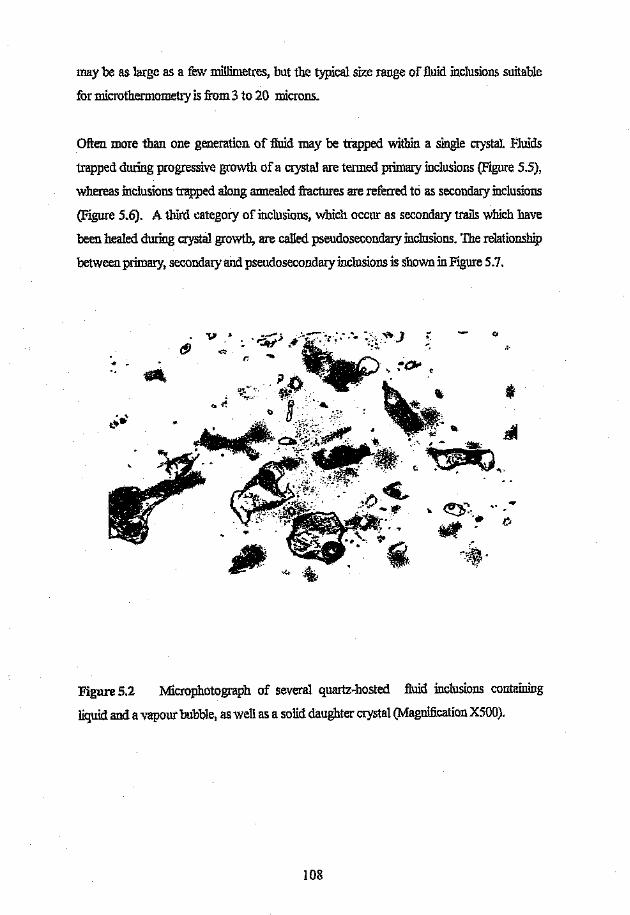
may be as large as a few millimetres, but the typical size range of fluid inclusions suitable
for microthermometry is from 3 to 20 microns.
Often more than one generation of fluid may be trapped within a single crystal. Fluids
trapped during progressive growth of a crystal are termed primary inclusions (Figure 5.5),
whereas inclusions trapped along annealed fractures are referred to as secondary inclusions
(Figure 5.6). A third category of inclusions, which occur as secondary trails which have
been healed during crystal growth, are caIIed pseudo secondary inclusions. The relationship
between primary, secondary and pseudo secondary inclusions is shown in Figure 5.7.
Figure 5.2 Microphotograph of several quartz-hosted fluid inclusions containing
liquid and a vapour bubble, as well as a solid daughter crystal (Magnification X500).
108

'Jii.~1"
*
:0 "
, ()f
, ,._, 't.J l) 4)1;"" '0
~''1 ~."'" Rt ,if
.."-~.~ ~j-.,,,"'.•..:•......•iJ!..'. <t!.n
') " "'.~I .'"
";"~t.'", . o, ,
·f .~ Vi-
.(....:''ij)
• :.";Q',} c
.~..) ..
@!Jr'
" t..Ii ;:.
FiglLlre5.3 Primary fluid inclusions trapped in quartz overgrowth on a pyritecrystal (Magnification X400).
.,_.o\0
~I
,/'~
h!
~...
"!7-'. ,-{'j ~ .,, ~
Y,
:. .. ~'C:r "
o
,,1,
at'
f ..~
".
.:,~.>II!' "",'~-:~~: '*",:-- -~.'" < . ,".... ''''~".~ .~\:.e
'?"' . '," ""~".Figure 5.5 Secondary 1luidinclusions along cross-cutting fractures influorite (Magnification X400).
........J}l ' '~j
• -:. t.•. 1; ?.
~ ·i.. • II· .
..... II$.
, , q •" (.,J. ~;;..~
if .. ~ ~
"~ 1;)
~ .~'~• \-1'1'.~ ""Ii
e
"..'.' ..~\
~ ",v -,
.·* :...'f,)Ilt ~QQ. '.::>('I ¢I. ,
'\.. :~',~ "
o Co \.:)~0'
."'.~\~
~{!: $. ~
"
e.
,r.,f ..\ •.. ~ 'J
".Figure 5.4 Primary fluid inclusions along a growth zone ill quartz. Notethat the hematite crystals are not present in all fluid inclusions. and thus may betrapped sl!.!idsrather than true daughter crystals. (Magnification X4(0) .
('til ,,'.
<II
; ." ..",
..Figure 5.6 Pseudosecondary fluid inclusions trapped along a fractureemanating from the face of an earlier formed crystal and which wa» annealedduring subsequent crystal growth (Magnification XlOO),
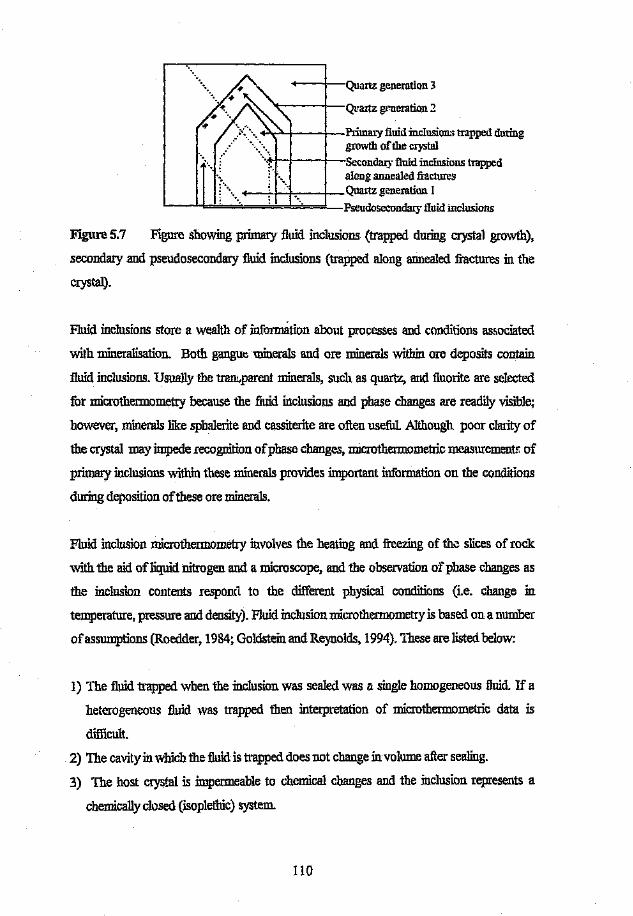
Figure 5.7
+---I--Quartz generation3
......
Figure showing primary fluid inclusions (trapped during crystal growth),
secondary and pseudosecondary fluid inclusions (trapped along annealed fractures in the
crystal).
Fluid inclusions store a wealth of information about processes and conditions associated
with mineralisation. Both gangue minerals and ore minerals within ore deposits contain
fluid inclusions. Usually the transparent minerals, such as quartz, and fluorite are selected
for micro thermometry because the fluid inclusions and phase changes are readily visible;
however, minerals like sphalerite and cassiterite are often useful. Although poor clarity of
the crystal. may impede recognition of phase changes, microthermometric measurements of
primary inclusions within these minerals provides important information on the conditions
during deposition of these ore minerals.
Fluid inclusion microthermometry involves the heating and freezing of the slices of rock
with the aid of liquid nitrogen and a microscope, and the observation of phase changes as
the inclusion contents respond to the different physical conditions (i.e. change in
temperature, pressure and density). Fluid inclusion micro thermometry is based on a number
of assumptions (Roedder, 1984; Goldstein and Reynolds, 1994). These are listed. below:
1) The fluid trapped when the inclusion was sealed was 11 single homogeneous fluid. If a
heterogeneous fluid was trapped then interpretation of microthermometric data is
difficult.
2) The cavity in which the fluid is trapped does not change involume after sealing.
3) The host crystal is impermeable to chemical changes and the inclusion represents a
chemically closed (isoplethic) system.
110

4) The effects cf pressure are insignificant, or are known.
5) The origin of the fluid inclusion is known.
6) The determinations of Tn (homogenisation temperature) are not only precise, but
accurate.
The temperature, pressure, and density at the time of entrapment, and composition of the
fluid are determined by measuring the temperatures of particular phase changes during
heating and freezing of the fluid inclusion. These variables control the transitions between
the three physical states (solid, liquid and gas), and are depicted in P- V- T diagrams (phase
diagrams). The phase changes in the unary system pure H20is the foundation on which the
more complicated binary, ternary and multi-component systems are based. Figure 5.8
shows the relationship between pressure, volume and temperature, and the corresponding
phase changes as cooling of the fluid inclusion proceeds. The natural cooling path of an
inclusion may be reversed in the laboratory by heating the inclusion. From F to C, the
bubble will gradually shrink and at C the bubble will disappear. The temperature at C is
known as the homogenisation temperature (Tj).
W0::::>(./)(./)W0::e,
SPECIFIC VOLUME-- --- DENSITY
Figure 5.8 Generalise+ 14 1 schematic P-V-T diagram for the unary system H20 (from
Goldstein and Reynolds, 1994).
111

In Figure 5.8, the intersections of planes of constant volume with the surface representing
stable single-phase equilibria are shown as dashed lines. The intersections of planes of
constant temperatures are shown as curved, light solid lines. The surface representing
stable two-phase (liquid-vapour) equilibria is delimited by heavy soi.d lines. The intersection
of these surfaces of stable equilibria with a plane of constant specific volume defines a
curve known as an isochore. If an inclusion traps a fluid of specific volume (of that shown
by the shaded plane) at the P-T conditions at point A, the inclusion will be constrained to
the locus of points inP-V -T space by the intersection of the surface of the shaded (constant
volume) plane with the surface of the stable equilibria (for cooling A-B-C-D-E-F~G-H is
shown). The fluid inclusion sketches schematically show relative proportions of liquid
(clear) and vapour (shaded) at the various labelled points shown on the phase diagrams
(Goldstein and Reynolds, 1994).
The information obtained from the temperatures of phase changes pertinent to the
detennination of entrapment temperatures, pressure, density and composition is discussed
below.
TEMPERATURE
The temperature offormation (T, or trapping temperature) of the host crystal, as well as
the temperature of later fluids may be determined indirectly by measuring the
homogenisation temperature (Th) of primary and secondary fluid inclusion assemblages,
respectivel; The homogenisation temperature is an estimate of the minimum entrapment
temperature of the fluid, and, by applying a pressure correction, the true trapping
temperature may be inferred.
In two phase liquid/vapour inclusions, the homogenisation temperature is measured by
heating the inclusion until the vapour bubble disappears. This temperature represents the
minimum entrapment temperature of the fluid, and the true entrapment temperature may be
determined by applying an appropriate pressure correction (see pressure and density).
In three phase inclusions, the temperature at which dissolution of the daughter crystal takes
place provides important information of the composition of the fluids, as well as assisting in
112
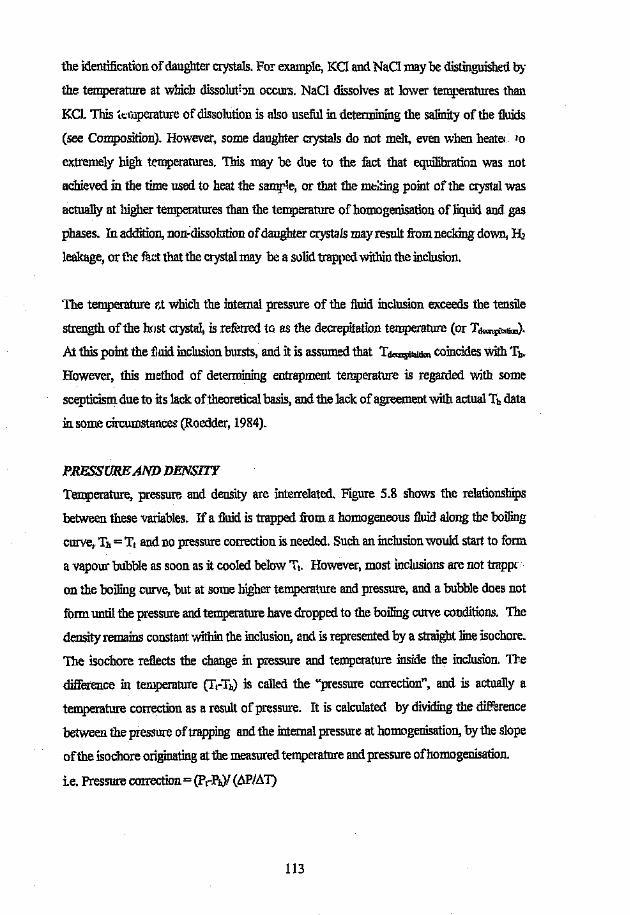
the identification of daughter crystals. For example, KCl and NaCI may be distinguished by
the temperature at which dissolution occurs. NaCl dissolves at lower temperatures than
KCL This kwperature of dissolution is also useful in determining the salinity of the fluids
(see Composition). However, some daughter crystals do not melt, even when heate to
extremely high temperatures. This may be due to the fact that equilibration was not
achieved in the time used to heat the sampte, or that the melting point of the crystal was
actually at higher temperatures than the temperature of homogenisation of liquid and gas
phases. Inaddition, non-dissolution of daughter crystals may result from necking down, H2
leakage, or the fact that the crystal ma.y be a solid trapped within the inclusion.
The temperature f.t which the internal pressure of the fluid inclusion exceeds the tensile
strength of the host crystal, is referred to as the decrepitation temperature (or Td"""'Fitaticn).
At this point the fluid inclusion bursts, and it is assumed that Td=epitaiti<ncoincides with Th•
However, this method of determining entrapment temperature is regarded with some
scepticism due to its lack of theoretical basis, and the lack of agreement with actual Ts data
in some circumstances (Roedder, 1984).
PRESSCfRE AND DENSITY
Temperature, pressure and density are interrelated. Figure 5.8 shows the relationships
between these variables. If a fluid is trapped from a homogeneous fluid along the boiling
curve, Tn = T, and no pressure correction is needed. Such an inclusion would start to form
a vapour bubble as soon as it cooled below Tt• However, most inclusions are not trappe
on the boiling curve, but at some higher temperature and pressure, and a bubble does not
form until the pressure and temperature have dropped to the boiling curve conditions. The
density remains constant within the inclusion, and is represented by a straight line isochore.
The isochore reflects the change in pressure and temperature inside the inclusion. The
difference in temperature (Tt-Th) is called the "pressure correction", and is actually a
temperature correction as a result of pressure. It is calculated by dividing the difference
between the pressure of trapping and the internal pressure at homogenisation, by the slope
of the isochore originating at the measured temperature and pressure ofhomogenisation.
i.e, Pressure correction =CPt-Ph)! (MillT)
113
Graphs of pressure corrections at particular temperatures, pressures, and salinities were
published by Potter (1977), but are appropriate if the inclusions contain pure NaCl
solutions, the salinity has been correctly determined, the estimate of pressure of formation
is correct and the inclusion homogenises in the liquid phase. Highly concentrated solutions
and those containing CO2 or other gases result in significant errors.
COMPosmON
Most geothermal fluids are not simple H20 systems, but are complex mixtures of a number
of components. The effect of additional components is to shift the liquid phase equilibrium.
The model H20-NaCl system is commonly used to evaluate the final melting temperature
of ice and the salinity of the fluid is reported as NaCl salinity equivalent (or eNaCl).
According to Goldstein and Reynolds (1994), this approximation is reasonable because
comparisons of the cotectic surfaces, where ice melts for various systems, show relatively
small variations.
The composition of the fluid may be estimated by measuring a number of phase changes.
These are the freezing temperature (Tfreeze), eutectic melting temperature (Te), temperature
of intermediate melting events, the final melting temperature (T finll mclm,.J. and the
temperature of freezing, melting and homogenisation temperature of CO2• The temperature
at which the fluid freezes depends on the gaseous component and salinity of the fluids.
Fluid inclusions containing methane and nitrogen, as well as higb 'me fluids, freeze at
lower te.nperatures than fluid inclusions containing little in the way of dissolved solutes.
The temperature at which the liquid phase becomes frozen is recorded as the freezing
temperature (Tfreezeor Tr). A suddenjerk in the inclusion 1.3 observed as the liquid expands
on freezing and the vapour bubble becomes distorted. TIle temperature at whicr, i..e liquid
freezes depends to a large extent on the amount of dissolved solute and the nature of
volatiles contained in the fluids. The greater the concentration of ions in solution, the lower
the freezing temperature. In addition, the presence ofN2, CI-1tand CO2 depress the freezing
point further. The pbysical appearance of tbe frozen solid can also provide information on
the fluid character. Fluids containing CaCh andlor MgCh develop a brown-coloured
mosaic of crystals which is easily distinguished from the colourless mosaic produced by
solutions containing NaCl, and KCl.
114
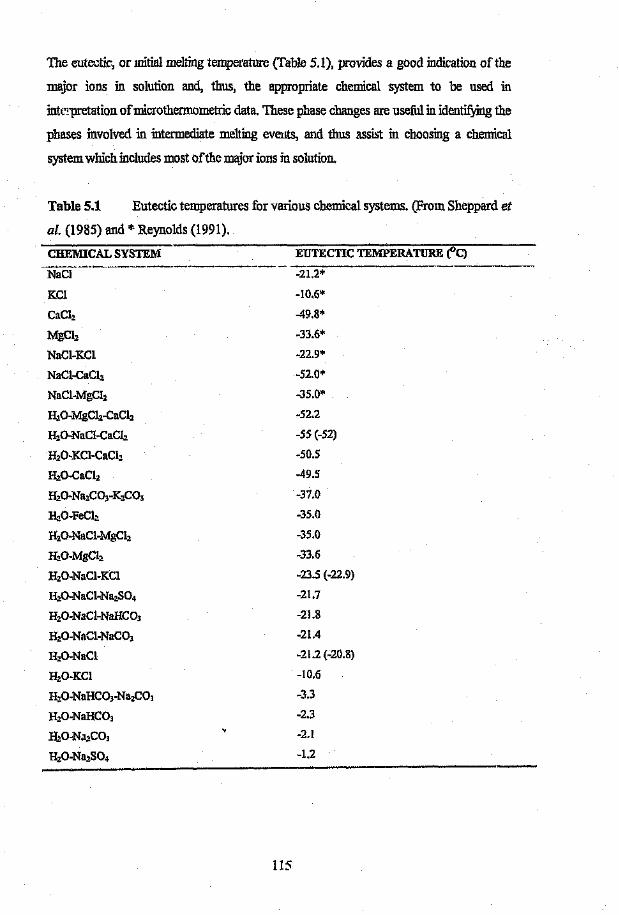
The eutectic, or mitial melting temperature (Table 5.1), provides a good indication ofthe
major ions in solution and, thus, the appropriate chemical system to be used in
interpretation of microthermometrlc data. These phase changes are useful in identifying the
phases involved in intermediate melting events, and thus assist in choosing a chemical
system which includes most ofthe major ions in solution.
Table 5.1 Eutectic temperatures for various chemical systems. (From Sheppard et
al. (1985) and * Reynolds (1991).
CHEMICAL SYSTEM EUTECTIC TEMPERATURE (lC)
NaCI -21.2*
KCl -10.6*
CaCl2 -49.8*
MgCh -33.6*
NaCl-KCl -22.9*
NaCl-CaClz -52.0*
NaCI-MgCl2 -35.0*
H2O-MgClz-CaClz -52.2
H2O-NaCI-CaCh -55 (-52)
H2O-KCI-CaClz -50.5
H2O-CaCh -49.5
H20-Na2C03-K2C03 -37.0
H2O-FeCIz -35.0
HzO-NaCI-MgCh -35.0
H2O-MgCI2 -33.6
H2O-NaCI-KCI -23.5 (-22.9)
HzO-NaCI-NazS04 -21.7
H2O-NaCl-NaHCOJ -21.8
HzO-NaCI-NaCOJ -21.4
H2O-NaCl -21.2 (-20.8)
H2O-KCl -10.6
HzO-NaHCOJ-Na2COl -3.3
HzO-NaHC01 -2.3
H.:P-N.1ZCO] -2.1
'HzO-Na1.S04 -1.2
115
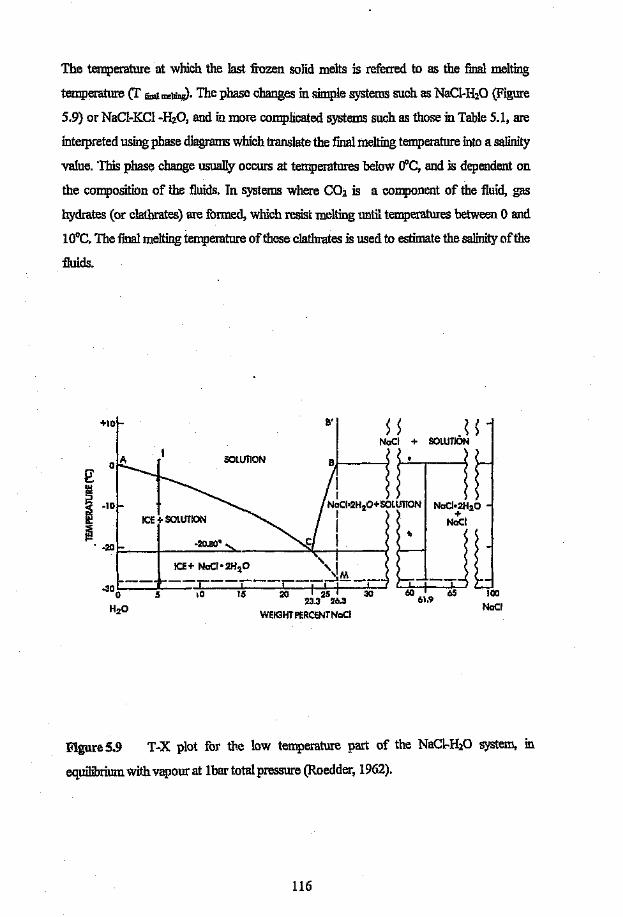
The temperature at which the last frozen solid melts is referred to as the final melting
temperature (T final trelting). The phase changes in simple systems such as NaCl-H20 (Figure
5.9) or NaCI-KCI-H20, and 1.11more complicated systems such as those in Table 5.1, are
interpreted using phase diagrams which translate the final melting temperature into a salinity
value. This phase change usually occurs at temperatures below O°C, and is dependent on
the composition of the fluids. In systems where CO2 is a component of the fluid, gas
hydrates (or clathrates) are formed, which resist melting until temperatures between 0 and
lOoC. The final melting temperature of'these clath:rates is used to estimate the salinity of'the
fluids.
+10 B'~ ~ .~ ~
+ SOLUTION
SOLUTION
e:~~ ·10 NoCl.2H20~ ICE + SOLUTION N.;'C'
~"20~_~' l·300l--_'_---.J,,--~15:----'!20':--+-:2~5 +---f:-....l '--I'=--!-----"'::-' 100
23.3 26.3 NoelH20 WEIGHT PERCENT NoCl
Figure 5.9 T-X plot for the low temperature part of the NaCI-H20 system, in
equilibrium with vapour at 1bar total pressure (Roedder, 1962).
116
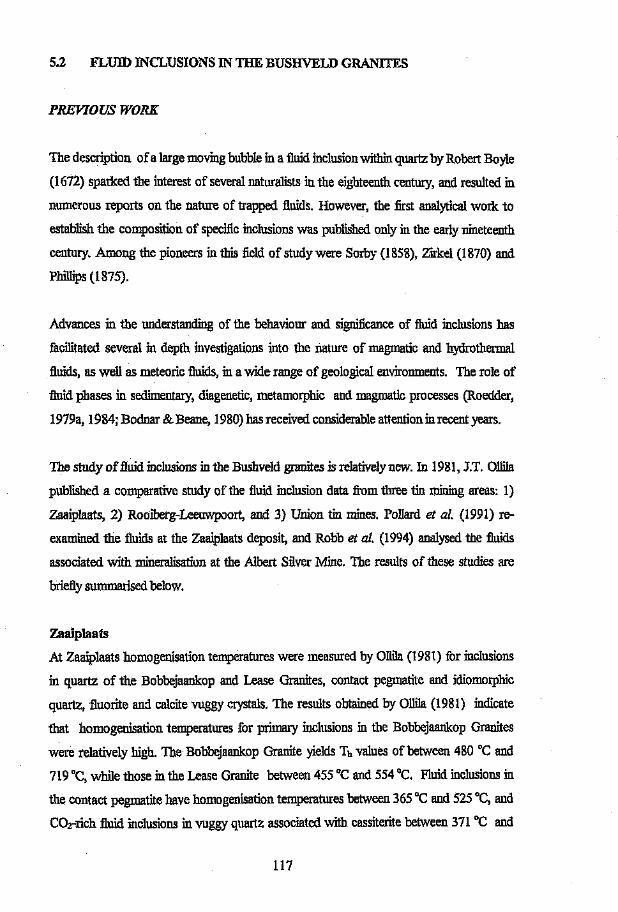
5.2 FLUID INCLUSIONS IN THE BUSHVELD GRANITES
PREVIOUS WORK
The description of a large moving bubble in a fluid inclusion within quartz by Robert Boyle
(1672) sparked the interest of several naturalists in the eighteenth century, and resulted in
numerous reports on the nature of trapped fluids. However, the first analytical work to
establish the composition of specific inclusions was published only in the early nineteenth
century. Among the pioneers in this :fieldof study were Sorby (1858), Zirkel (1870) and
Phillips (1875).
Advances in the understanding of the behaviour and significance of fluid inclusions has
facilitated several in depth investigations into the nature of magmatic and hydrothermal
fluids, as well as meteoric fluids, in a wide range of geological environments. The role of
fluid phases in sedimentary, diagenetic, metamorphic and magmatic processes (Roedder,
1979a, 1984; Bodnar &Beane, 1980) has received considerable attention in recent years.
The study of fluid inclusions in the Bushveld granites is relatively new. In 1981, J.T. Ollila
published a comparative study of the fluid inclusion data from three tin mining areas: 1)
Zaaiplaats, 2) Rooiberg-Leeuwpoort, and 3) Union tin mines. Pollard et al. (1991) re-
examined the fluids at the Zaaiplaats deposit, and Robb et al. (1994) analysed the fluids
associated with mineralisation at the Albert Silver Mine. The results of these studies are
briefly summarised below.
Zaaiplaats
At Zaaiplaats homogenisation temperatures were measured by Ollila (198l) for inclusions
in quartz of the Bobbejaankop and Lease Granites, contact pegmatite and idiomorphic
quartz, fluorite and calcite vuggy crystals, The results obtained by Ollila (1981) indicate
that homogenisation temperatures for primary inclusions in the Bobbejaankop Granites
were relatively high. The Bobbejaankop Granite yields Th values of between 480°C and
719 "C, while those in the Lease Granite between 455°C and 554 "C. Fluid inclusions in
the contact pegmatite have homogenisation temperatures between 365°C and 525 °c, andCOrrich fluid inclusions in vuggy quartz associated with cassiterite between 371 "C and
117
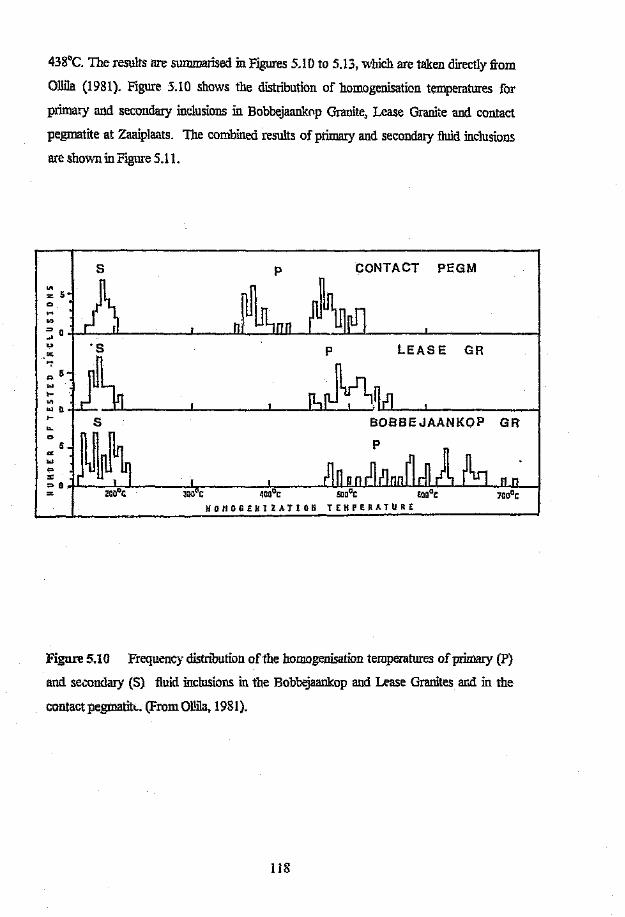
438°C. The results are summarised in Figures 5.1 0 to 5.13, which are taken directly from
Ollila (1981). Figure 5.10 shows the distribution of homogenisation temperatures for
primary and secondary inclusions in Bobbejaankop Granite, Lease Granite and contact
pegmatite at Zaaiplaats. The combined results of primary and secondary fluid inclusions
are shown in Figure 5.11.
s P CONTACT PEGMII>
'" 5o
III~ o4-L- __~ L-__~U_ __ ~~~ __ ~ll-~ ~ _'u p LEAS E GR'"
...I-<II
...0J- BOBBEJAANKOP GR
Po
5c:....,:r~o4L ~L- ~ ~ ~~~~~~~~L-~ __ ~~~~'" 400°, 500°, fOOoC
HOnOGEUIZATIOH TEMPERATURE
Figure 5.10 Frequency distribution of the hornogenisation temperatures of primary (P)
and secondary (S) fluid inclusions in the Bobbejaankop and Lease Granites and in the
contact pegmatite, (From Ollila, 1981).
us
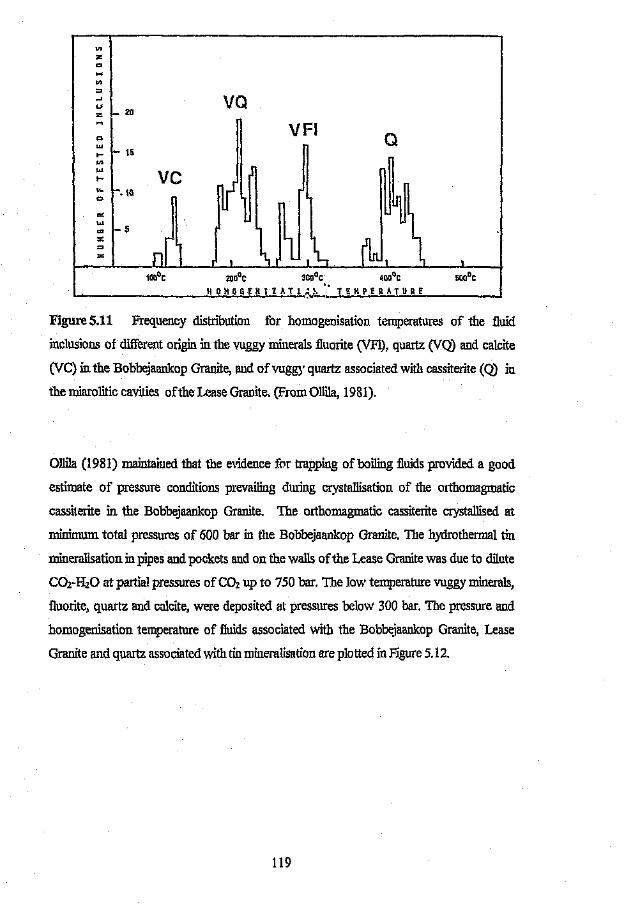
III
%0
VI:::>
-' L :10u
=
'"wI- 15V)
wVCI-
"- .100
""...."" 5:>:
=IOOoC
vaVFI Q
2000e 3000e ~ooQe sooDe1l0HOGENIZATl~~. '. tEMPERATURE._._---------"'-"-'.;..;:...;;;_;;..;"-'-~...__.-.- ..
Figure 5.11 Frequency distribution for homogenisation temperatures of the fluid
inclusions of different origin ill the vuggy minerals fluorite (VFl), quartz 0f0) and calcite
eve) ill the Bobbejaankop Granite, and of vuggy quartz associated with cassiterite (0) 1U
the miarolitic cavities of the Lease Granite. (From Ollila, 1981).
Ollila (1981) maintained that the evidence for trapping of boiling fluids provided a good
estimate of pressure conditions prevailing during crystallisation of the orthomagmatic
cassiterite ill the Bobbejaankop Granite. The orthomagmatic cassiterite crystallised at
minimum total pressures of 600 bar in the Bobbejaankop Granite, The hydrothermal tin
mineralisation in pipes and pockets and on the walls of the Lease Granite was due to dilute
C02-H20 at partial pressures of CO2 up to 750 bar. The low temperature vuggy minerals,
fluorite, quartz and calcite, were deposited at pressures below 300 bar. The pressure and
homogenisation temperature of fluids associated with the Bobbejaankop Granite, Lease
Granite and quartz associated with tin mineralisation are plotted in Figure 5.12.
119
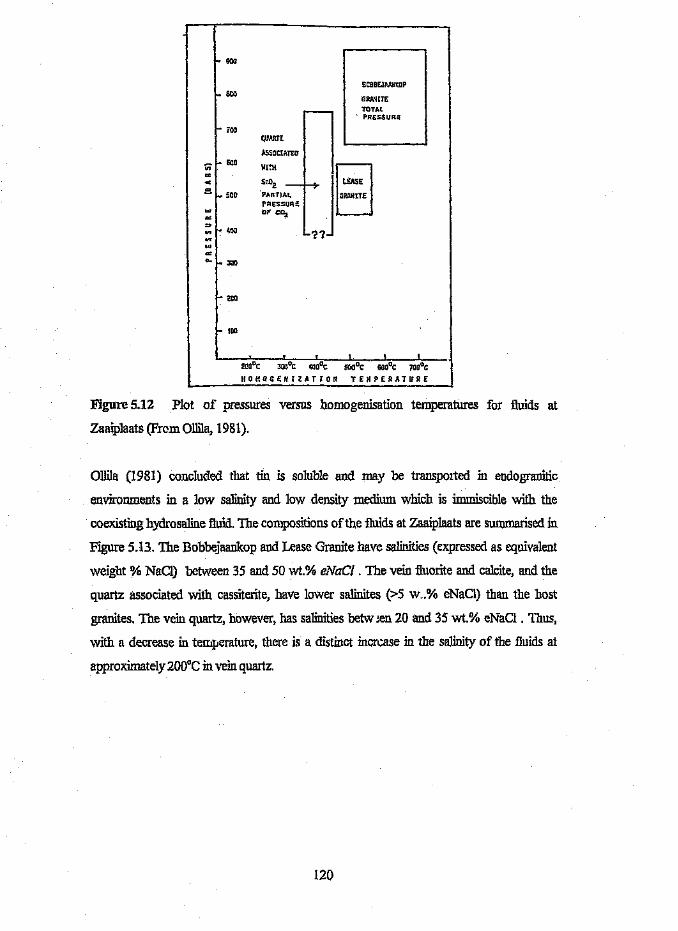
lIIn! §Sr.OZ -f-7 LEASE
. PARTIAL J' GAANlTEPRESSUREOF Co.,
'??
r see GAAHTETOTAl
" PRESSURE
Figure 5.12 Plot of pressures versus homogenisation temperatures for fluids at
Zaaiplaats (FraID Ollila, 1981).
700
Ollila (1981) concluded that tin is soluble and may be transported in endogranitic
environments in a low salinity and low density medium which is immiscible with the
coexisting hydrosaline fluid. The compositions of the fluids at Zaaiplaats are summarised in
Figure 5.13. The Bobbejaankop and Lease Granite have salinities (expressed as equivalent
weight % NaCl) between 35 and 50 wt.% eNaCt . The vein fluorite and calcite, and the
quartz associated with cassiterite, have lower salinites (>5 w ..% eNaCl) than the host
granites. The vein quartz, however, has salinities betw .en 20 and 35 wt.% eNaCl. Thus,
'with a decrease in temperature, there is a distinct increase in the salinity of the fluids at
approximately 20DoC in vein quartz.
~UAAIZ
ASSOCIATED600
e 500
I- 2CO
100
2COOC 300°C <1000, StilO, 6aOOC lcaoeHOMOGENIZATION TEHPERATDRE
120
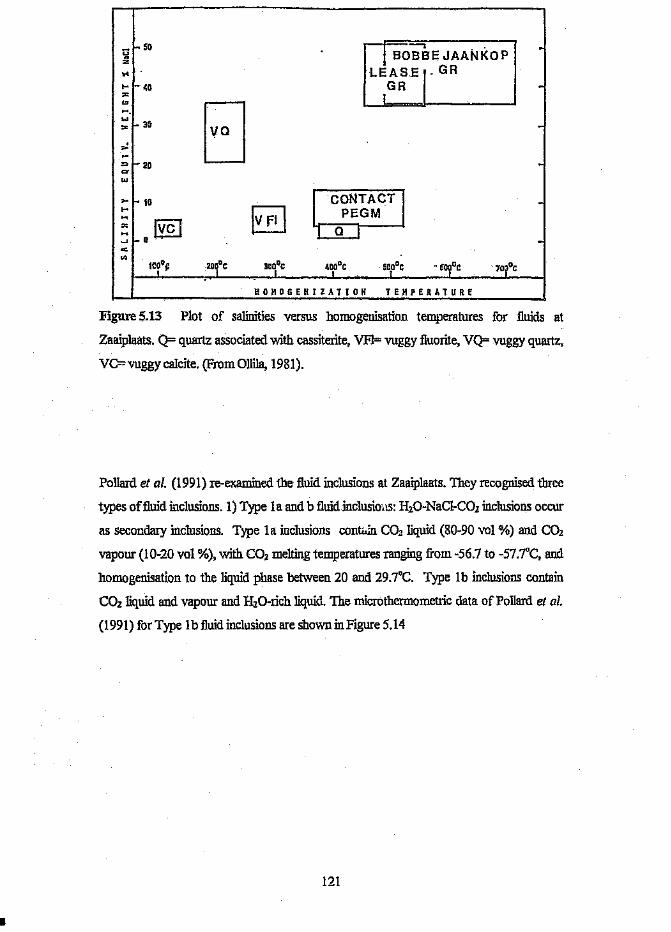
_r 50 I BOBBE JAANKOP -';;:;::
... LEASE,' GRI- - 40 GR -0: I .'" EJ~.w
3(}:x ->-;> - 20 -c:r....
~ f-o 10 I CONTACT II-
IV fll PEGM...'" ryc I 1 Q I~..J o .o¢
VI lct~ 20~oC 30~oC ~ooOe sote .• 60YoC 70~oC
HOMOGEtlIZATIOII TEMPERATURE
Figure 5.13 Plot of salinities versus homogenisation temperatures for fluids at
Zaaiplaats, Q= quartz associated with cassiterite, VF1= ''Uggy fluorite, VQ= V'uggy quartz,
VC==vuggy calcite. (From Ollila, 1981).
Pollard et al. (1991) re-examined the fluid inclusions at Zaaiplaats. They recognised three
types of fluid inclusions. 1) Type la and b fluid inclusions: H20-NaCl-COz inclusions occur
as secondary inclusions. Type la inclusions contain CO2 liquid (80-90 vol %) and CO2
vapour (10-20 vol %), with CO2 melting temperatures ranging from -56.7 to -57.7°C, and
homogenisation to the liquid phase between 20 and 29.7°C. Type 1b inclusions contain
COzliquid and vapour and H20-rich liquid. The micro thermometric data of Pollard et al.
(1991) for Type 1b fluid inclusions are shown in Figure 5.14
121
I
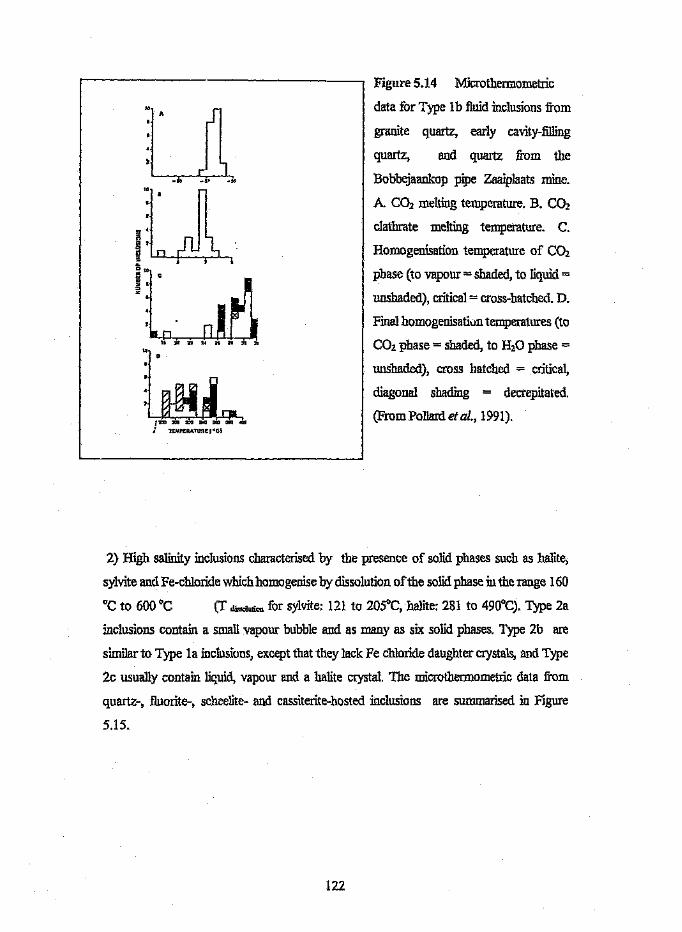
iLll-50 _5." ~SS
l n,~. . , .
Figure 5.14 Microthermometric
data for Type 1b fluid inclusions from
granite quartz, early cavity-filling
quartz, and quartz from the
Bobbejaankop pipe Zaaiplaats mine.
A CO2 melting temperature. B. CO}.
clathrate melting temperature. C.
Homogenisation temperature of CO}.
phase (to vapour = shaded, to liquid =
unshaded), critical = cross-hatched. D.
Final homogenisation temperatures (to
CO2 phase = shaded, to H20 phase =
unshaded), cross hatched = critical,
diagonal shading = decrepitated.
(FromPollardetal., 1991).
2) High salinity inclusions characterised by the presence of solid phases such as halite,
sylvite and Fe-chloride which homogenise by dissolution of the solid phase illthe range 160
°C to 600°C (T dimlution for sylvite: 121 to 205°C, halite: 281 to 490°C). Type 2a
inclusions contain a small vapour bubble and as many as six solid phases. Type 2b are
similar to Type 1a inclusions, except that they lack Fe chloride daughter crystals, and Type
2c usually contain liquid, vapour and a halite crystal. The microthermometric data from
quartz-, fluorite-, scheelite- and cassiterite-hosted inclusions are summarised in Figure
5.15.
122
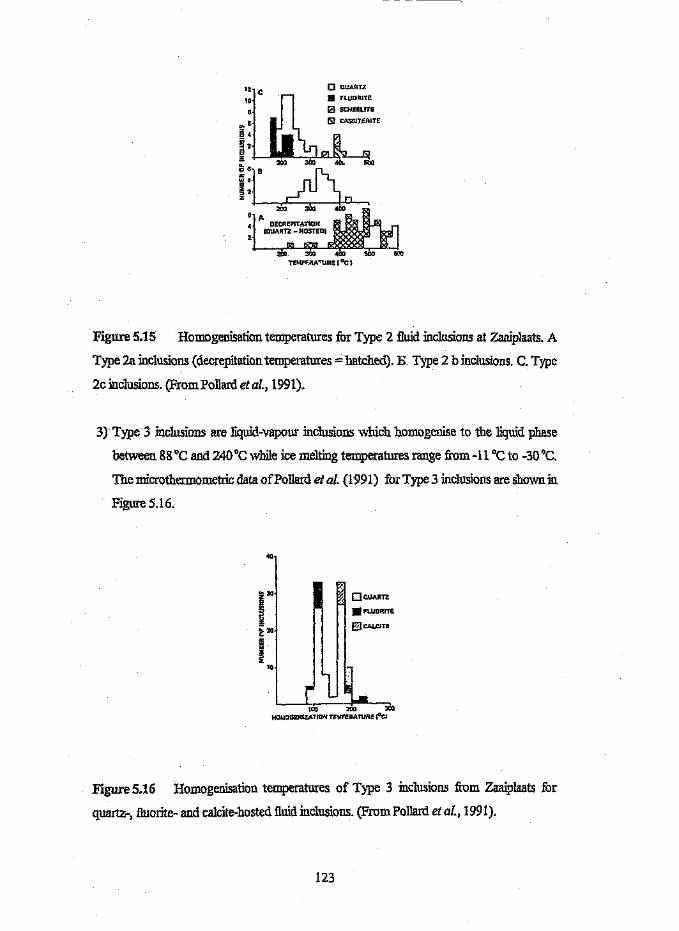
12 C
'0o Q~A~TZ
• HUM.TE
I2l SC>IEEUTE
rsJ CASSJTERlTE
Figure 5.15 Homogenisation temperatures for Type 2 fluid inclusions at Zaaiplaats. A
Type 2a inclusions (decrepitation temperatures = hatched). B Type 2 b inclusions. C. Type
2c inclusions. (From Pollard et al., 1991).
3) Type 3 inclusions are liquid-vapour inclusions which homogenise to the liquid phase
between 88 "C and 240 DCwhile ice melting temperatures range from -11°C to -30 "C.
The microthermometric data of Pollard et al. (1991) for Type 3 inclusions are shown in
Figure 5.16.
40
~ ~~~:::.II B~lC'TE
~JL~--~.oo~--,oo ~HOMOGENIZATfON TF.·\(pEnATURE fe)
Figure 5.16 Homogenisation temperatures of Type 3 inclusions from Zaaiplaats for
quartz-, fluorite- and calcite-hosted fluid inclusions. (From Pollard et al., 1991).
123

Pollard et al. (1991) conclude that early fluid inclusions contain solid phases (halite, sylvite
and F~ chloride) and homogenise at temperatures up to 600°C, and that fluid circulation
occurred mainly via grain boundaries, microfcactures, cavities and dissolution channel ways
under lithostatic pressure of 1250 bars. They noticed a progressive decrease in temperature
from 600°C to 200 °C, which is accompanied by a decrease in salinity fir m 68 to 15
equivalent weight percent NaCl and a decrease in 8180 fluid values from 6.4 per mil. to 1.4
per mil. They maintain that the evolution of the fluid was dominated by interaction between
granites and the magmatically derived fluid phase. The compositional range and
homogenisation behaviour of tL ..~ inclusions suggests immiscibility around 350°C and
1000 bars. No mention was made of entrapment of boiling fluids or second boiling.
Leeuwpoort
Ollila (1981) studied fluid inclusions in gangue quartz at Leeuwpoort tin mine, which
yielded homogenisation temperatures between 174°C and 220 °C, and moderate salinities
(between 13.9 and 22.0 mass % NaCl). In contrast with the inclusions at Zaaiplaats which
commonly contain daughter crystals, no daughter crystals are found in the two phase
inclusions at Leeuwpoort or the Union tin mines, indicating that the fluids were
undersaturated with respect to the ore-forming constituents. A wide range of
horrogenisation temperatures are observed which may be due t'1 mixing of the
hydrothermal fluid with meteoric water. However, Ollila (1981) ascribes this variation as
the interaction of the ore-forming fluid with the wall rocks. No evidence for boiling was
found at Leeuwpoort.
Albert
A preliminary study cfthe fluids at Albert was carried out by Robb et at. (1994). The fluids
were dominated by two phase aqueous inclusions (H20 liquid and vapour) with
approximately 10% three-phase inclusions (H20 Equid and vapour, and solid). CO2 was not
detected as a separate phase in any inclusion. Two fluid populations were recognised, by
final melting temperature at around -20°C (12 wt. % eNaCl) and between -5 and O°C«8
wt. % eNaCl). Homogenisation temperatures also indicate two fluid populations, one
between 150±30°C and the other between 260 and 460°C. Eutectic melting temperatures
124
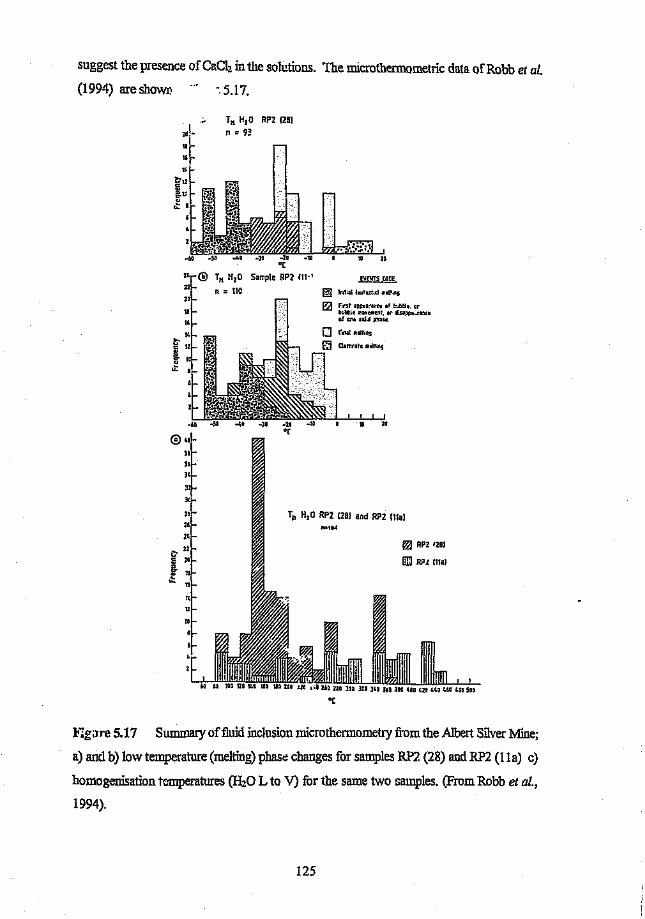
suggest the presence ofC3.Ch in the solutions. The microthermometric data of Robb et al.(1994) are showr; . 5.l7.
Til H,D RP2 (28110 n = 9:11
I.
-cTil H20 Sample RP2 111-'
2'
gn lr.ltial 't:"~l:tld Clt{·.ng
E2 Firlt a~il:ura~Cl of t:!.I!::!:1t:.crt::.ihe:e C'I::I'tL'lmL"~. Dr c!i.n;:pt..ta!l.t:!.af t:nt Siltid pl'!au
Tn H20 RP2 (28) and RP2 (l1al
~ RPZ ''lSI
[!]] RPl mal
-c
:FlgiJre 5.17 Summary of fluid inclusion micro thermometry from the Albert Silver Mine;
a) and b) low temperature (melting) phase changes for samples RP2 (28) and RP2 (lla) c)
homogenisation temperatures (H20 L to V) for the same two samples. (From Robb et aI.,
1994).
125
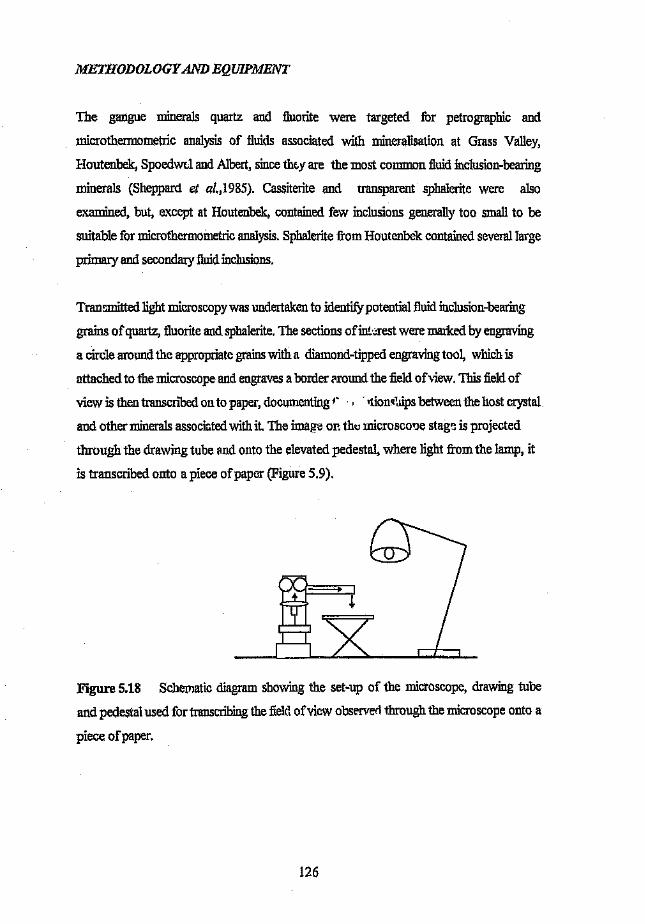
METHODOLOGY AND EQ[]JP1J-fENT
The gangue minerals quartz and fluorite were targeted for petrographic and
roicrothennometric analysis of fluids associated with mineralisation at Grass Valley,
Houtenbek, Spoedwel and Albert, since they are the most common fluid inclusion-bearing
minerals (Sheppard et al.,1985). Cassiterite and transparent sphalerite were also
examined, but, except at Houtenbek, contained few inclusions generally too small to be
suitable for microthermometric analysis. Sphalerite from Houtenbek contained several large
primary and secondary fluid inclusions.
Transmitted light roicroscopywas undertaken to identify potential fluid inclusion-bearing
grains of quartz, fluorite and sphalerite. The sections of'interest were marked by engraving
a circle around the appropriate grains with a diamond-tipped engraving tool, which is
attached to the microscope and engraves a border around the field of view. This :fieldof
view is then transcribed on to paper, documenting r' ., . -tionsuips between the host crystal
and other minerals associated with it. The image 01'. the microscope stage is projected
through the drawing tube and onto the elevated pedestal, where light from the lamp, it
is transcribed onto a piece of paper (Figure 5.9).
Figure 5.18 Schematic diagram showing the set-up of the microscope, drawing tube
and pedestal used for transcribing the field of view observed through the microscope onto a
piece of paper.
126
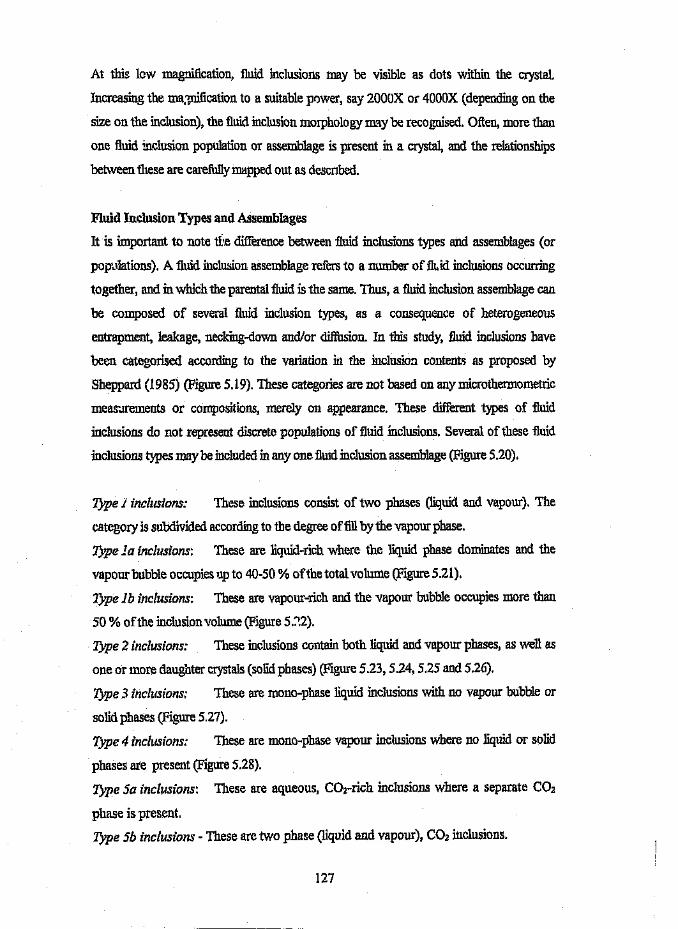
At this low magnification, fluid inclusions may be visible as dots within the crystal.
Increasing the magnification to a suitable power, say 2000X or 4000X (depending on the
size on the inclusion), the fluid inclusion morphology may be recognised. Often, more than
one fluid inclusion population or assemblage is present in a crystal, and the relationships
between these are carefully mapped out as described.
Fluid Inclusion Types and Assemblages
It is important to note tle difference between fluid inclusions types and assemblages (or
populations), A fluid inclusion assemblage refers to a number of fh.id inclusions occurring
together, and in which the parental fluid is the same. Thus, a fluid inclusion assemblage can
be composed of several fluid inclusion types, as a consequence of heterogeneous
entrapment, leakage, necking-down andlor diffusion. In this study, fluid inclusions have
been categorised according to the variation in the inclusion contents as proposed by
Sheppard (1985) (Figure 5.19). These categories are not based on any microthermometric
measurements or compositions, merely on appearance. These different types of fluid
inclusions do not represent discrete populations of fluid inclusions. Several of these fluid
inclusions types may be included in anyone fluid inclusion assemblage (Figure 5.20).
1}'Pe 1 inclusions: These inclusions consist of two phases (liquid and vapour). The
category is subdivided according to the degree offill by the vapour phase.
1}'Pe 1a inclusions; These are liquid-rich where the liquid phase dominates and the
vapour bubble occupies up to 40-50 % ofthe total volume (Figure 5.21).
Type Jb inclusions: These are vapour-rich and the vapour bubble occupies more than
50 % of the inclusion volume (Figure 5.~2).
Type 2 inclusions: These inclusions contain both liquid and vapour phases, as well as
one or more daughter crystals (solid phases) (Figure 5.23,5.24,5.25 and 5.26).
Type 3 inclusions: These are mono-phase liquid inclusions with no vapour bubble or
solid phases (Figure 5.27).
Type 4 inclusions: These are mono-phase vapour inclusions where no liquid or solid
phases are present (Figure 5.28).
Type 5a inclusions: These are aqueous, CO2-rich inclusions where a separate CO2
phase is present.
Type 5b inclusions - These are two phase (liquid and vapour), CO2 inclusions.
127
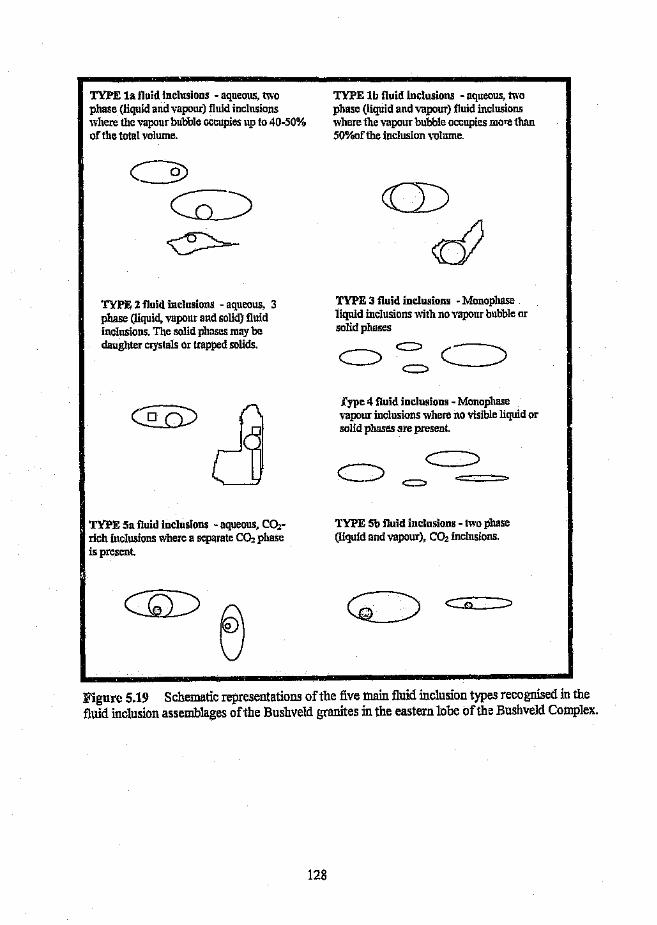
TYPE 1a fluid inclusions - aqueous, twophase (liquid and vapour) fluid inclusionswhere the vapour bubble occupies up to 40-50%of the total volume.
TYPE 2 fluid inclusions - aqueous, 3phase (liquid, vapour and solid) fluidinclusions. The solid phases may bedaughter crystals Or trapped solids.
TYPE 1b fluid Inclusions - aqueous. twophase (liquid and vapour) fluid inclusionswhere the vapour bubble occupies more than50'Yooftheinclusion volume.
TYPE 3 fluid inclusions - Monophuseliquid inclusions with no vapour bubble orsolid phases
TYPE 5a fluid inclusions - aqueous, CO2-
rich inclusions where a separate CO2 phaseis present.
fype 4 fluid inclusions - Monophasevapour inclusions where no visible liquid orsolid phases are present.
Figure 5.19 Schematic representations of the five main fluid inclusion types recognised in thefluid inclusion assemblages of the Bushveld granites in the eastern lobe of the Bushveld Complex.
=-======:::>
TYPE 5b fluid inclusions - two phase(liquid and vapour), CO2 inclusions.
128
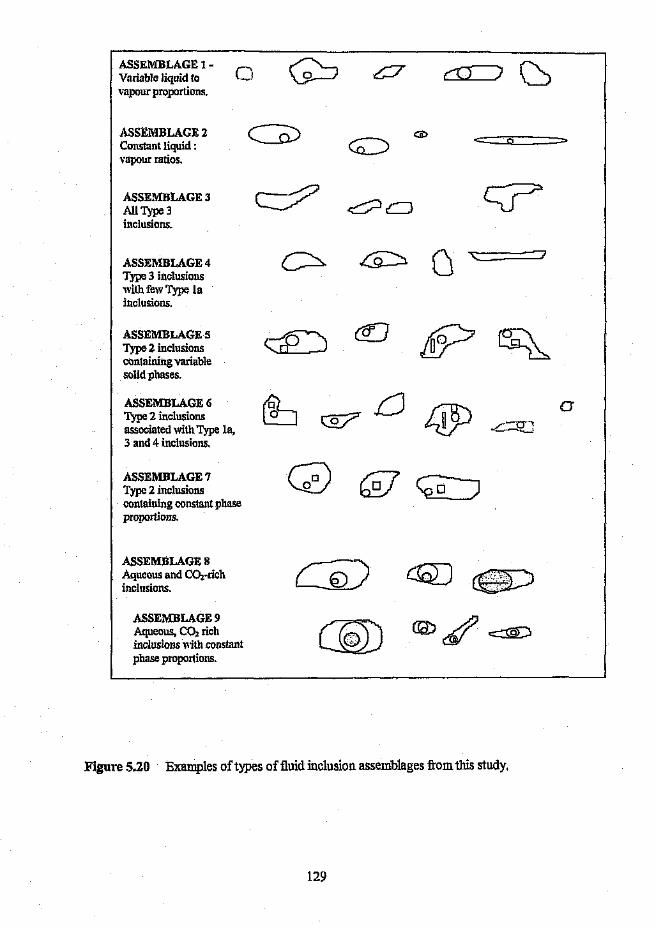
ASSEMBLAGE 1 ~Variable liquid tovapour proportions.
ASSEMBLAGE 2Constant liquid:vapour ratios.
ASSEMBLAGE 3All Type 3inclusions.
ASSEMBLAGE 4Type 3 inclusionswith few Type Iainclusions.
ASSEMBLAGE 5Type 2 inclusionscontaining variablesolid phases.
ASSEMBLAGE 6Type 2 inclusionsassociated with Type Ia,3 and 4 inclusions.
ASSEMBLAGE 7Type 2 inclusionscontaining constant phaseproportions.
ASSEMBLAGE 8Aqueous and CO2-richinclusions.
ASSEMBLAGE 9Aqueous, CO2 richinclusions with constantphase proportions.
o
a
cQ:)CQ)
"'::><::. Q
c::;/ ~c:J
~ a '" 7
Figure 5.20 Examples of types of fluid inclusion assemblages from tbis study.
129
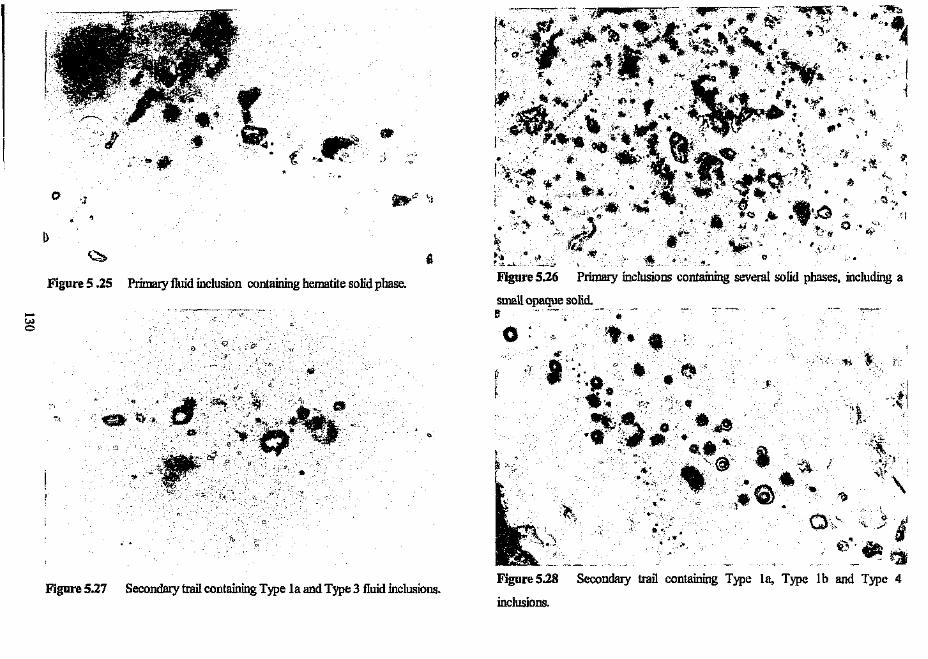
Ii ...e -s
1)
~
f'.~. .~
(' "ftiwrJfo:"•~.:
,_u.>o
Figure 5 .25 Primary fluid inclusion containing hematite solid phase.
!l
o
o d·o
,.
o o
c
Figure 5.27 Secondary trail containing Type la and Type 3 fluid inclusions.
<iii
\II;
. ~ ~~.'iIi; •. . _.........;'::..~ "~.,!-_., •...~-"-'.:~t. ~ ~,~ .' 7.:'...•QZ~.\(;.".>I.. :""It. ~ ~.:~ ..•..••.. l! .•..... '.'11' ~~' ••••"" . "'..... ',_' ""'" '" ~'. ......'..•~..~~~.,,'t·.·iJ~·. '.~ 't":"~.' ,fI\...•....'Ih. ';':t.~,.;:. '-\\'~~ '.
• ,.']i t,' "',. (7' .• > '\ '!" ,;'lP[.~..'I.' ". ., ' ~'" '"., 'y •.... ••• '.• .'.~.....'f .,r .. :. ".' <,., ~,•.• '." ...... ~
~ ~"';/ t::' ..W!:~ 0' -' . i", ,I M;..~:o;~,~.,.'~.t•./;;;¢;l~.:.' c.
,,' ;"'" ,."l...• •'/" ....IIi)i • 3~,.".if/., \ :"f1l ,; ."'" ' ., '. .. "., ........J' '" .. . ,
*" V ."" ~\ ..#;.~ . . >.?i.'¥ ;,..,.e ,~~
~;:,!/fl ..."'-4
~)
•Q;
Figure 5.26 Primary inclusions containing several solid phases, including a
small opaque solid.1'i 1I!i
o :ft ••
•'"a .~.~'.•• '0.'~.'.' •.......··,··..··.··.. 0·, ,~-..-,:.;....~ ~ .. A "'t... ~
... ' ~!,,!111!'" .... ". .. -:,'h i
' ~. i@ '.~- .~" ..... .'VJ"1
~.
~
o...","
'h
"Js~~~
Figure 5.28 Secondary trail containing Type la, Type 1b and Type 4
inclusions.

,......V.l.......
Figure 5.21 Type la fluid inclusions along a fracture in fluorite.
G
~'II/IIIF~:>~
'.0
".,
• ~t
I: f9~"'0 ~\~; ~_, \;
(.:,<> ~." .'.~. ,;.::,.~
1(u
." "
._ 0,05mm
Figure 5.23 Type 2 fluid inclusions containing a single daughter crystal and
constant phase proportions.
Figure 5.22 Type 1b fluid inclusion in a secondary swarm of inclusior
containing variable phase proportions .
..,. '. . '. ~.,.
i~..••.•~." '." :~ ..•. 'I .., ':~'_'" .
'··'.~ .. o...4 .
....
,i{:"'0:::
'"~
.~.~ ,
~h '..'!
":::::'.. 1I1!',jI." ...Iir,(It.
"" ;( •.if 4-~ .;,
!!l~
-:'"')
Figure 5.24 Primary fluid inclusions containing muscovite as a solid phase.
Microthermometry
Microthermometric analyses were carried out at the University of the Witwatersrand, using
both USGS and Linkam heating-freezing stages. The heating freezing stages were
calibrated using synthetic fluid inclusions provided by Flincor® and the calibration was
routinely checked during the study, in order to maintain uniform analytical conditions.
Once the fluid inclusions identified during the petrographical SUlV.:yhad been relocated on
the heating-freezing stage, the sample was first supercooled to induce freezing of the fluid
inclusion contents, and then gradually heated in order to record the temperatures at which
first melting, :final melting and intermediate melting events occurred. After these
measurements were obtained, the sample was heated ani the homogenisation temperature
recorded. Wherever possible, aU phase changes were recorded from each fluid inclusion
assemblage studied.
The approach when measuring phase changes in fluorite-hosted fluid inclusions was
slightly different to that employed when studying quartz-hosted fluid inclusions. Due to the
weakness of the fluorite crystal lattice, the expansion of ice on freezing often causes
stretching and leakage from the fluid inclusion, a situation not encountered with the strong
quartz host crystal. Thus, fluorite-hosted fluid inclusions were heated before freezing was
initiated, so that, ill the event of stretching, at least reliable homcgenisaticn temperatures
were obtained from the inclusions. With the quartz hosted fluid inclusions, this approach
was routinely adopted, for the purposes of cross checking.
RESULTS
Fluid inclusion maps of each fluid inclusion assemblage discussed ill the r.,Uowing sections
are shown in the Appendix, Selected maps are included in the presentation of results in
order to illustrate salient points. These maps indicate the host mineral, the associated
minerals, the grain size, the size of fluid inclusions, the types offluid inclu .ions, their origins
(primary or secondary), and the relationships of various assemblages within the field of
view, For each field of view, a low magnification (40X) map showing mineral relationships
132

is given, as well as a high magnification (200X or 400X) map which shows the fluid
inclusion petrography. In addition, hand specimen descriptions (and where possible,
scanned images of the polished thin section), fluid inclusion petrography and
microthermometry of selected samples from Spoedwel, Albert, Grass valley, Houtenbek,
Dronkfontein and Leeufontein are presented separately, and the data integrated in the
discussion and interpretation. Several. terms and abbreviations (Table 5.2) are referred to
repeatedly, and it should be clear at the outset what each of these mean.
Roedder, 1984).
List of microthermometric terms and abbreviations used (afterTable 5.2
ABBREVIATION 1l'ERM EXPLANATION
Homogenisatlon temperature
Eutectic melting temperature
Freezing temperature
T fmnl"",lting Final melting temperature
Temperature at which liquid and vapour
phases homogenise.
Temperature at which melting begins.
Temperature at which the liquid phase
freezes to a solid.
Temperature at which the last frozen solid
Tdj,soult!on
melts.
Dissolution temperature of a solid Temperature at which a daughter crystal
melts completely.
Temperature at which the internal
temperature of the flui.:, inclusion exceeds
the strength of the host crystal.
Homogenisation temperature of Temperature at which Cal vapour
phase
Tdccr<pitalio\l Decrepitation temperature
Wt.% eNaCl
Cal homogenises into the C02liquid phase.
Weight percent equivalent NaCl Unit of salinity.
The samples from Grass Valley, Houtenbek, Spoedwel, Dronkfontein and Albert were
selected with specific questions ill mind. The questions were:
1) How do the fluids associated with the different quartz and fluorite generations in
interstitial spaces compare with one another?
2) Are the fluids invein quartz different to those in the interstitial spaces'?
3) How do the fluids in vein quartz relate to the fluids associated with mineralisation?
133
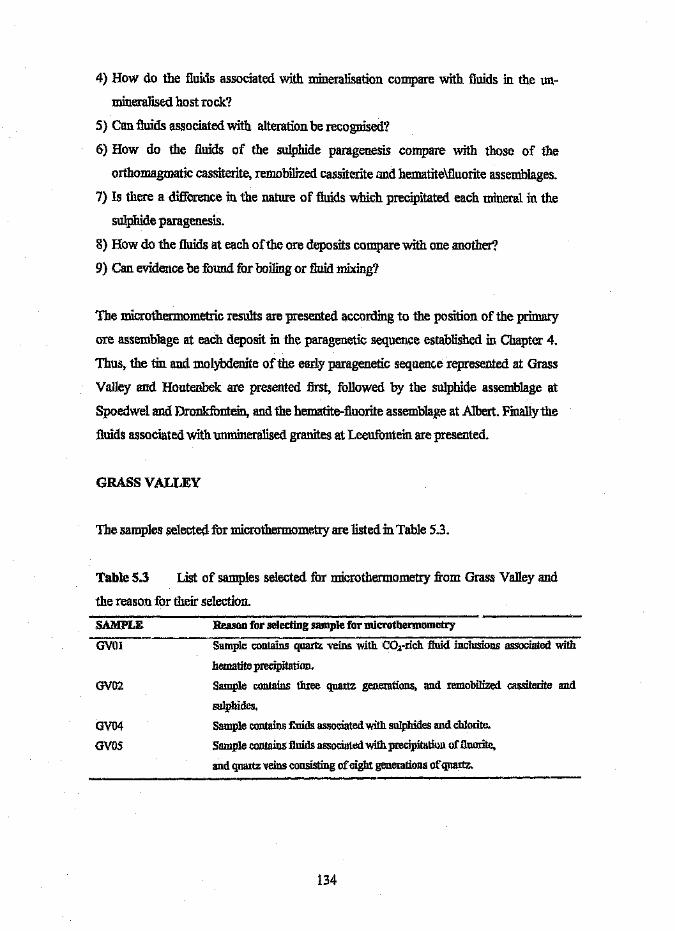
4) How do the fluids associated with mineralisation compare with fluids in the un-
mineralised host rock?
5) Can fluids associated with alteration be recognised'!
6) How do the fluids of the sulphide paragenesis compare with those of the
orthomagmatic cassiterite, remobilized cassiterite and hematite\fluorite assemblages.
7) Is there a difference in the nature of fluids which precipitated each mineral in the
sulphide paragenesis.
8) How do the fluids at each of the ore deposits compare with one another?
9) Can evidence be found for boiling or fluid mixing?
The microthermometrlc results are presented according to the position of the primary
ore assemblage at each deposit in the paragenetic sequence established in Chapter 4.
Thus, the tin and molybdenite of the early paragenetic sequence represented at Grass
Valley and Houtenbek are presented first, followed by the sulphide assemblage at
Spoedwel and Dronkfontein, and the hematite-fluorite assemblage at Albert. Finally the
fluids associated with unmineralised granites at Leeufontein are presented.
GRASS VALLEY
The samples selected for microthermometry are listed inTable 5.3.
Table 5.3 List of samples selected for microthermometry from Grass Valley and
the reason for their selection.
SAMPLE
GVOI
Reason for selecting sample for microthennometry
. Sample contains quartz veins with COrrich fluid inclusions associated with
hematite precipitation.
Sample contains three quartz generations, and remobilized cassiterite and
sulphides.Sample contains £uids associated with sulphides and chlorite.
Sample contains fluids associated with precipitation of fluorite,
and quartz veins consisting of eight generations of quartz,
GV02
GV04
GV05
134
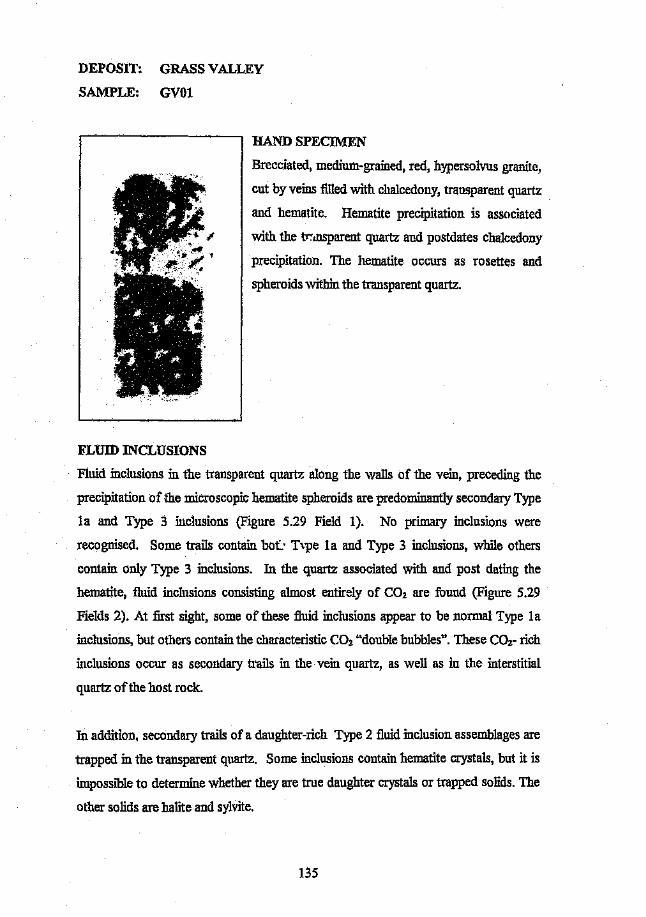
DE.POSIT: GRASS VALLEY
SAMPLE: GVOI
HAND SPECIMEN
Brecciated, medium-grained, red, hypersolvus granite,
cut by veins filled with chalcedony, transparent quartz
and hematite. Hematite precipitation is associated
~ with the tr~illsparent quartz and postdates chalcedony
precipitation. The hematite occurs as rosettes and
spheroids within the transparent quartz.
FLUID INCLUSIONS
Fluid inclusions in the transparent quartz along the walls of the vein, preceding the
precipitation of the microscopic hematite spheroids are predominantly secondary Type
la and Type 3 inclusions (Figure 5.29 Field 1). No primary inclusions were
recognised. Some trails contain bot> T\'Pe Ia and Type 3 inclusions, while others
contain only Type 3 inclusions. In the quartz associated with and post dating the
hematite, fluid inclusions consisting almost entirely of CO2 are found (Figure 5.29
Fields 2), At first sight, some of these fluid inclusions appear to be normal Type l a
inclusions, but others contain the characteristic C02 "double bubbles". These COz- rich
inclusions occur as secondary trails in the vein quartz, as well as in the interstitial
quartz of the host rock.
In addition, secondary trails of a daughter-rich Type 2 fluid inclusion assemblages are
trapped in the transparent quartz. Some inclusions contain hematite crystals, but it is
impossible to determine whether they are true daughter crystals or trapped solids. The
other solids are halite and sylvite.
135
MICROTHERMOMETRY
Individual secondary trails of the Typ ~ la aqueous fluid inclusions, have been
measured, and five groups of measurements have emerged,
The first group, consisting of Type la and Type 3 fluid inclusions, froze at -38.5 "C
and developed clear, colourless mosaics. Eutectic melting could not be seen. The first
signs of melting were visible at -33°C when the edges of the frozen solid started
becoming wavy. No other intermediate melting events were observed before final
melting (between -5.5 °C and -4.7 0C). Th was not measured. The second group of
Type la and Type 3 inclusions froze at -36°C, and behaved exactly as the first group
described, the only difference being that these fluid inclusions underwent final melting
at -1.5 DC.
The third group consists of Type 3 inclusions only, which froze to a clear solid at -40
DC.No intermediate melting events were observed, and the frozen solid merely shrank
away from the inclusiou walls as melting proceeded. Final melting occurred at -2.1 DC.
The fourth group of aqueous inclusions are the daughter-rich, Type 2 inclusions which
developed a brown solid on freezing (at -53°C). Eutectic melting occurred at -48 DC.
Intermediate melting events were observed at -44 °c when the mosaic appeared to
disintegrate, at -35°C when the mosaic became coarser, at-28 DCwhen the mosaic
merged, and at -10°C when round rafts developed. Final melting temperatures were
variable in this assemblage. Some inclusions underwent final meltiug at +16 "C while
others melted at -18°C or underwent sublimation between -1°C and 0 °C .
The CO2-rich inclusions occur as crosscutting secondary trails. On cooling, the C02
vapour bubble expanded and freezing occurred at ..97.7 DC.The liquid CO2 froze to an
irregular spiky shell around the gaseous C02, and started melting at -67°C. Final
melting of the liquid C02 took place between-57.4 °C and -57.S "C. Within individual
trails, homogenisation of the liquid and gaseous C02 occurred at different
temperatures, ranging from 22.5 DC to 27.8 DC.
136

~: Gr<lss Valley DEPOSlJ:' 'lrasl> V~.lley.:w1fLE : GVOl ~ : GVOl~ Field 2
~ / I I _L __,_ r.. ~~'\ Q\1artz 1 llacmatite...IJCI~ I ' ' , h l . ~., ' , Chplcedony I . '~ "'~", .. '-:-'\.»'~..:'. \ __~ Chalcedony veinlet
tilN\0
'"t1 t, '.~ "'oo'~y trail~t'll ".. • • " of CO2-rich flUld::r Haematite. . ~ ..... ,,: .. t ...... ;' .... inc l.Uf:3 ionso . / - " :~ " "~:'. .' Quartz~ - ~'1::ltf. V) '/ _I &IIA,_'\___f___'__, _' r.: Quax-tz 2
~til
g, I ~ \ Magnificatlon: X 40 I ~ \ Magnification: 1(40l:h
,_. t'll
~ ~,_.§ ,,/ " '. ~ _ Chalcedonyp.
S. /"': 'J ~. " Quartz~en' ~ '\ / I I : \ Secondary trails ofS .!. -" fluid inclusions'0<rQa_A
Ma~nifi~: X400Hagnit'ication: X 400
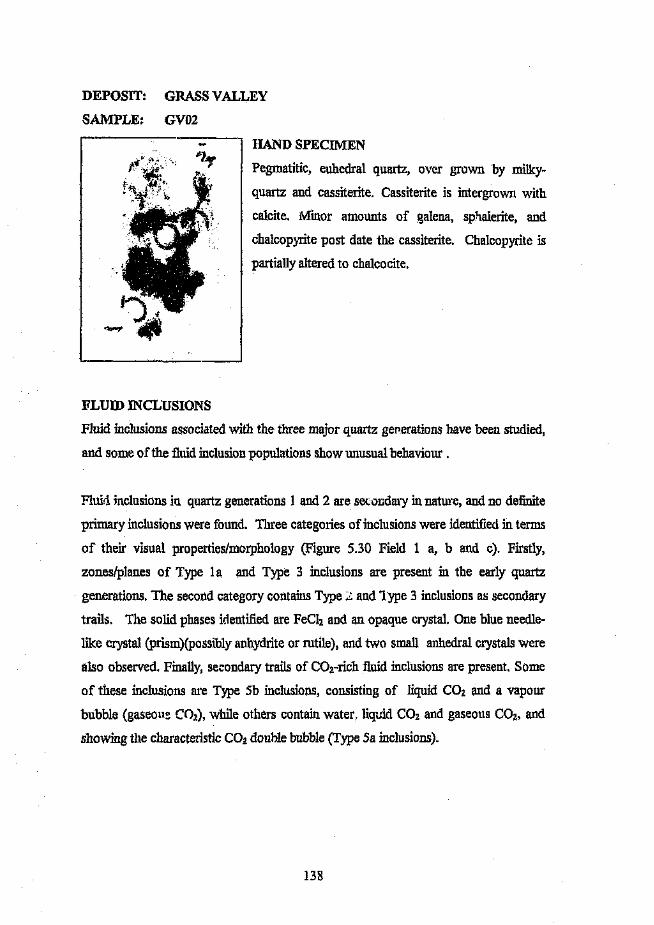
DEPOSIT: GRASS VALLEY
SAMPLE: GV02
HAND SPECIMEN
Pegmatitic, euhedral quartz, over grown by milky-
quartz and cassiterite. Cassiterite is intergrown with
calcite. Minor amounts of galena, sphalerite, and
chalcopyrite post date the cassiterite. Chalcopyrite is
partially altered to chalcocite.
FLUID INCLUSIONS
Fluid inclusions associated with the three major quartz generations have been studied,
and some of the fluid inclusionpopulations show unusual behaviour .
Fluid inclusions in quartz generations 1 and 2 are secondary in nature, and no definite
primary inclusionswere found. Three categories of inclusionswere identified in terms
of their visual properties/morphology (Figure 5.30 Field 1 a, b and c). Firstly,
zones/planes of Type 1a and Type 3 inclusions are present in the early quartz
generations. The second category contains Type :2 and Type 3 inclusions as secondary
trails. The solid phases identified are FeClz and an opaque crystal. One blue needle-
like crystal (prism)(possibly anhydrite or rutile), and two small anhedral crystalswere
also observed. Finally, secondary trails of CO2-rich fluid inclusions are present. Some
of these inclusions are Type 5b inclusions, consisting of liquid C02 and a vapour
bubble (gaseous CO2), while others contain water, liquid CO2 and gaseous CO2, and
showing the characteristic C02 double bubble (Type Sa inclusions).
138
Fluid inclusions in the third quartz generation are predominantly primary and are so
numerous that they cloud the quartz. The fluid inclusions show extremely variable
phase proportions and are Type 1a, Type 1b, Type 3 and Type 4 inclusions. CO2
double bubbles (Type Sa) are present, as well as Type 5b CO2 inclusions.
MICROTHERMOMETRY
The most convenient way to present the icrothermometric data for this sample is as
individual fluid inclusion trails, beginning with those presumed to be trapped first.
Fluid inclusion population 1: These inclusions froze to a colourless mosaic at -46 "C,
Possible eutectic melting occurred at -43°C and round rafts were fanned by -40 "C. On
heating, the rafts gradually shrank until they disappeared altogether at -0.4 "C.
Homogenisation temperatures ranged from 194°C to 201 "C.
Fluid inclusion populations: Freezing occurred at temperatures between -35 "C and -
40 "C, and a colourless mosaic was formed, Eutectic melting was not observed, and,
by -44 "C, round rafts were already visible. At -19 "C, these rafts merged to form
larger ones, and at -10 "C some of the rafts melted. Final melting occurred between -
4.4 "C and -3.1 °C. Homogenisation of the two phase inclusions occurred between 134
"C and 167 "C, with the mean Th at 143 "C.
Fluid inclusion population 3: Freezing occurred at -54 "C, and a brown mosaic
i,rmed, Eutectic melting may have occurred before -48 "C. An intermediate melting
event at -23 "'e was recorded. Final melting took place at ~16 "C and homogenisation
occurred between 149 "C and 160 "C,
Fluid inclusion population 4: This trail froze at -64 "C and developed a moderately
brown mosaic. Eutectic melting occurred at -50 "C. Intermediate melting events at -39
"C (coarsening of mosaic), at ~24 °C ( mosaic merged into round rafts), and at -23°C
(many rafts disappeared rapidly). Final melting temperatures and homogenisation of
the liquid and vapour phases were constant. at _14°(; and 134 "C, respectively.
13'1
Fluid inclusion population 5: This assemblage behaved in a similar manner to
populations 3 and 4, except that fmal melting occurred at -6.8 "C, A brown mosaic was
produced on freezing. Eutectic melting occurred at -50°C, and intermediate melting
events were observed at -37 DC, -27°C and -23 "C. Homogenisation took place
between 120DC and 130°C.
Fluid inclusion population 6:
The COrrich inclusions: The carbon dioxide froze between -92°C and -94 "C. Final
melting of the liquid C02 occurred at -57.4 "C. In the inclusions containing no visible
water, homogenisation of the liquid and gaseous CO2 occurred between 29 "C and 30
PC. In inclusions containing water as well as the CO2, final melting occurred at 7.5 "C.
Homogenisation of the gaseous CO2 into the aqueous phase occurred at temperatures
above 250 DC. The exact value is not known, because stretching of the inclusions
became visible and the heating run was abandoned.
The aqueous inclusions: The aqueous fluid inclusions, with no visible CO2 present,
froze to a colourless mosaic at unusually high temperatures (-29 DC to -34°C). Eutectic
melting and intermediate melting events were difficult to recognise. Final melting
occurred between -1.7 "C and 1.8 "C in most inclusion" but a few were melted by -4
"C. Simultaneous melting of large rafts and the appearance of a full-sized vapour
bubble occurred in several inclusions. Homogenisation of the liquid and vapour phase
occurred between 214 "C and 233°C.
140
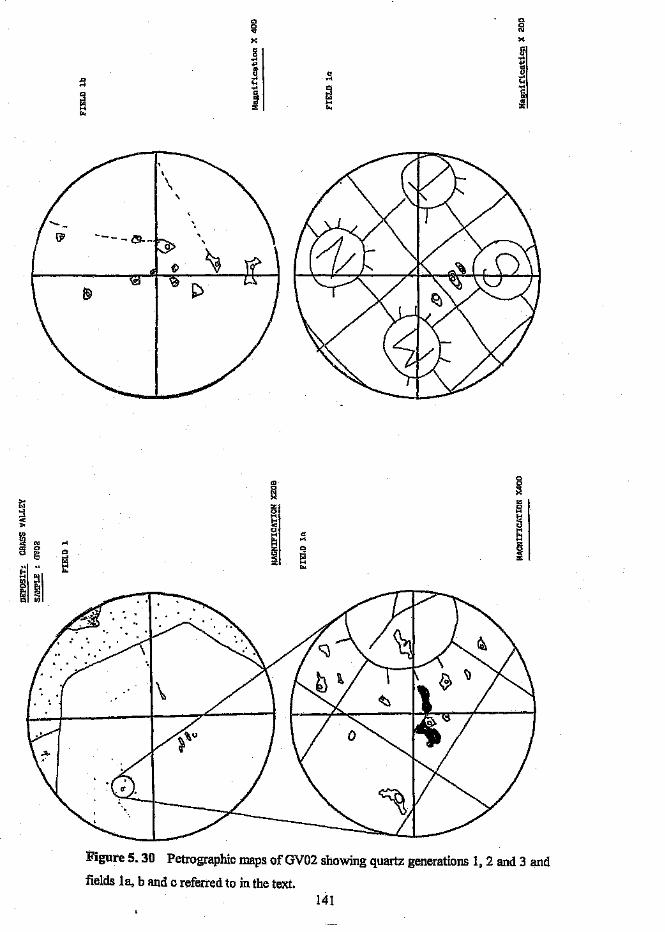
0 000 N"X X
e
~
s'" ~.. o .!:lu
J:> ... .., ........C;.... .... '"'" c _,
to ~l It!_,
III ....:E'" :E t..H
'"
\\\\
-- __ ~-o
00 00 ;1iNX
Z><2:1 01~
H..., ~I !<_,<C !< u>
~I Hd' ...tn ... Htil
Z"" N .... ~I 0 o'" 00 ~ ..:: ""<., Ei ..:. '" :E'" :;:1 H
61~lH ......
Ul ...1a! gt'" ~Q ttl I
Figure 5.30 Petrographic maps of GV02 showing quartz generations 1, 2 and 3 and
fields la, b and c referred to in the text.141

DEPOSIT: GRASS VALLEY
SAMPLE: GV04
HAND SPECIMENLate stage, massive, pegmatitic vein quartz as.ociated
with muscovite, chlorite, and pyrite.
FLUID INCLUSIONS
Only one fluid assemblage is preserved in this sample.
The fluid inclusions are Type 1a and Type 3 inclusions
which occur as trails and planes, as well as scattered
throughout the quartz. No solid phases occur in any of
the inclusions.
If1
NUCROTHERMOMETRY
The fluid inclusions froze at -35.2 "C and produced a colourless mosaic. Eutectic
melting could not be seen, and by -30°C, the mosaic had merged into a clear solid.
This solid raft receded from the inclusion walls as melting proceeded. Final melting
occurred in the range -2.8 "C to 0.6°C. Sublimation was observed in several inclusions.
Homogenisation of the vapour bubble into the liquid phase occurred between 83°C
and 128°C.
142
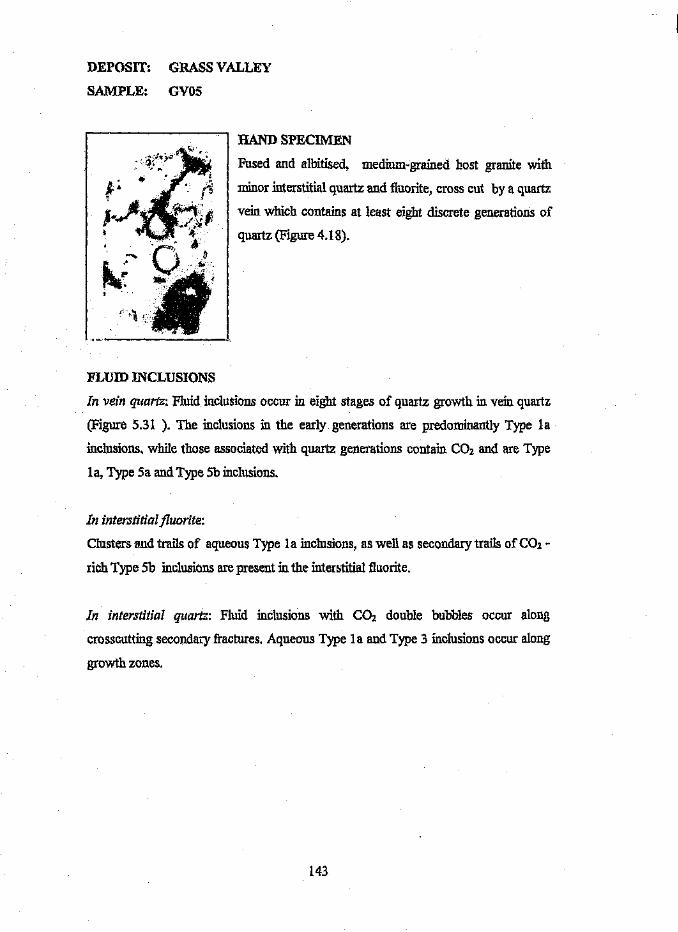
DEPOSIT: GRASS VALLEY
SAMPLE: GV05
HAND SPECIMENFused and albitised, medium-grained host granite with
minor interstitial quartz and fluorite, cross cut by a quartz
vein which contains at least eight discrete generations of
quartz (Figure 4.18).
FLUID INCLUSIONS
In vein quartz: Fluid inclusions Occur in eight stages of quartz growth in vein quartz
(Figure 5.31 ). The inclusions in the early generations are predominantly Type 1a
inclusions, while those associated with quartz generations contain CO2 and are Type
la, Type 5a and Type 5b inclusions.
In interstitial fluorite:
Clusters and trails of aqueous Type 1a inclusions, as well as secondary trails of C02 -
rich Type 5b inclusions are present in the interstitial fluorite.
In interstitial quartz: Fluid inclusions with CO2 double bubbles occur along
crosscutting secondary fractures. Aqueous Type 1a and Type 3 inclusions occur along
growth zones.
143

MICROTHERMOl'v1ETRY
Fluid inclusions in interstitial fluorite:
Primary inclusions along growth zones froze to a brown mosaic between -38°C and -
44°C. First melting was observed at -43°C. At -33 "C, many round rafts formed and at
-22.3 "c, rapid clearing of the rafts (hydrohalite) took place. Final melting occurred
between -14°C and -10°C.
The aqueous inclusions along annealed fractures froze between -49 "C and -55°C, and
developed a COl,) .. mosaic. Melting was first observed at -45°C when the mosaic
became coarser. At -36 °C, the mosaic merged into bigger rafts, some of which melted
at -16 "C. Final melting values between -8.9 "C and -4.4 "C were recorded.
The CO2 -rich inclusions contain no visible water, and are Type 5b inclusions. The CO;:
liquid froze at ~96 "C and underwent final melting at -57.4 "c. Homogenisation of the
liquid and gaseou. occurred at 27.1 "C in some trails and at 25.4 °C in others.
Fluid inclusions in interstitial quartz:
The secondary, CO2 -rich inclusions froze at -96°C. Final melting of the CO2 occurred
at -57.1 "C and final melting of the clathrate occurred at 7.3 "C. Homogenisation of the
liquid and vapour CO2 took place at 30 "C for the one trail and at 28.4 °C for a
crosscutting trail.
The aqueous fluid inclusions fall into two groups according to their final melting
temperatures. These inclusions are anomalous because they produced a colourless
mosaic on freezing (at -42°C), but underwent final melting at relatively low
temperatures. One group melted between -4 "C and _5°C, and the other group melted
at -17°C. In both groups, intermediate melting events were observed at -38 "C
(merging of the mosaic) and -24°C (some rafts melted).
144
Fluid inclusions in quartz vein:
Quartz generations were labelled from 1 to 8, with quartz 1 being the oldest generation
occurring against the vein walls, and quartz 8 being the youngest generation, occurring
in the central portions of the vein (Figure 5.31). Primary inclusions in each quartz
generation were sought for microthermometry, in order to trace the evolution of the
fluids with time. Quartz generations 1, 2, 3 and 5 contained no fluid inclusions suitable
for microthermometry,
Quartz generation 4 contained numerous Type la and Type 3 fluid inclusions which
froze to a dark brown mosaic between -49 QCand -52 DC.First melting was observed at
-45°C. Definite coarsening and rounding into rafts had taken place by -43 DC.
Intermediate melting events were observed at -21 DC and -16°C when several rafts
disappeared. Final melting temperatures fall in the range -8.7 DC to -6.8 DC.
Homogenisation of all the two phase inclusions occurred at 101 DC.
The fluids associated with quartz generations 6,7 and 8 are rich in carbon dioxide.
Only quartz 7 contains fluid inclusions which were undoubtedly primary in origin.
Type 5b COrrich inclusions and Type la aqueous inclusions coexist in quartz 7. The
COrrich inclusions froze at 95.3 DC and underwent final melting at -57 DC
Homogenisation of the liquid and vapour CO2 OCCUlTedat temperatures from 25.8 °C
to 29.8 DC.A few Th CO2 values of30.4 "C were recorded.
The aqueous inclusions developed a brown mosaic on freezing (at -44°C). First
melting had occurred by ~39°C. Final melting of most inclusions occurred between -6.5
°C and 7 QC. However, some Tfirol melting values of -1.5 °C were recorded.
Homogenisation temperatures between 146°C and 195 °C were measured.
145

~ !'!1o ~~ riS'r:n
ict
~Vi
-""'"0\
Quartz containingprimary and secondaryfluid inclusions
;....... / Quartz 4
!JIl.o)....>-tI(i)a~a:oir:n
o.....,<C1lS'
tN
~;:~::;:'>B'cr.g!n'o0-C1lr:no.....,.g~
~: CrasB Valley,'''' SAl~P~E: CVOS
/
&C
Field 2
// !
.I \
/,
D,
/
'",
I \'t F ..."....-
A .l?-(3:A1 E
I ,. "f ..,. 'rloC~_/ I Quartz I)
............ ,. ",,'"
...~ .~~. , . - -- - '-
DEPOSIT: Crass ValleySAMPLE: avosField 1
~iaematite
~nification: )(40
~Qual"tz7
Magnificat~on: X200
~ ~
l:,J' i ' I ---" llaemati te. .. . ::::::::=--\Haematite
~~ '. Quartz 7~~... \ Haematlte spheroids
-- -.: .:.: .. --•. ' co· 'l" ~ ' ..
I I'~'-:;,r ) Quartz 6
Quartz 7
I ~ / Quartz B, :7
..
r~agniflC!\tion: X40
Quartz 6
Magnification: X40
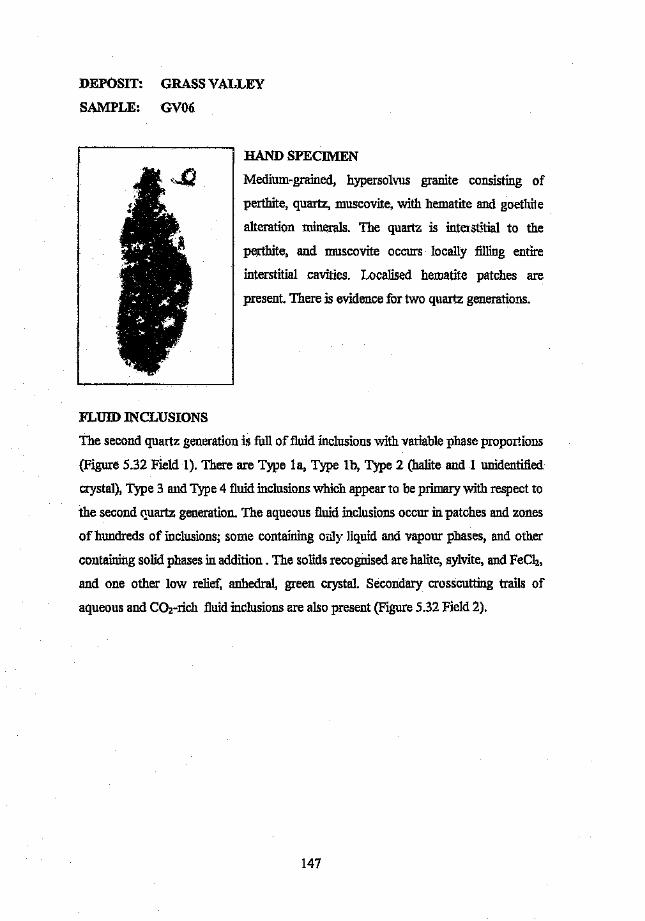
DEPOSIT: GRASS VALLEY
SAMPLE: GV06
HAND SPECIMEN
Medium-grained, hypersolvus granite consisting of
perthite, quartz, muscovite, with hematite and goethite
alteration minerals. The quartz is interstitial to the
perthite, and muscovite occurs locally :filling entire
interstitial cavities. Localised hematite patches are
present. There is evidence for two quartz generations.
FLUID INCLUSIONS
The second quartz generation is full of fluid inclusions with variable phase proportions
(Figure 5.32 Field 1). There are Type la, Type lb, Type 2 (halite and I unidentified
crystal), Type 3 and Type 4 fluid inclusions which appear to be primary with respect to
the second quartz generation. The aqueous fluid inclusions occur in patches and zones
of hundreds of inclusions; some containing only liquid and vapour phases, and other
containing solid phases in addition. The solids recognised are halite, sylvite, and FeClz,
and one other low relief, anhedral, green crystal. Secondary crosscutting trails of
aqueous and COrrich fluid inclusions are also present (Figure 5.32 Field 2).
147

DEPOSIT, Grass Valley~: GVOS~
""\~
\
\0(J
~/
...."""00
Quartz 6
\
\~,\
\\
.-----ii-------------:I--- Secondary trail wtthCO2-lC'ich fluid 1",,11.19io"o
Magnification, X200
Figure 5. 32 Left: Petrographic map of interstitial quartz with secondary CO2-rich
inclusions from sample avos. Right: Petrographic map of inclusions in two interstitial
quartz generations in sample OV06.
OEPOSIT: Grass Valley~:GI/06Fiel.d 1
•.••___. Perthi te.• &)
1'1 ,."t 1 '. 'I' ." . ~.-- ••~ , owoo! Quartz. .. . \ ~ . ",. (
J • .v----' ....f..;; , ., :.:':..:_,_~.:~_., I ChI or! te
MagnitLcation: X40
Trails of seL-cndaryfluid inclusions
Quartz
Perthite
Magnification, X200
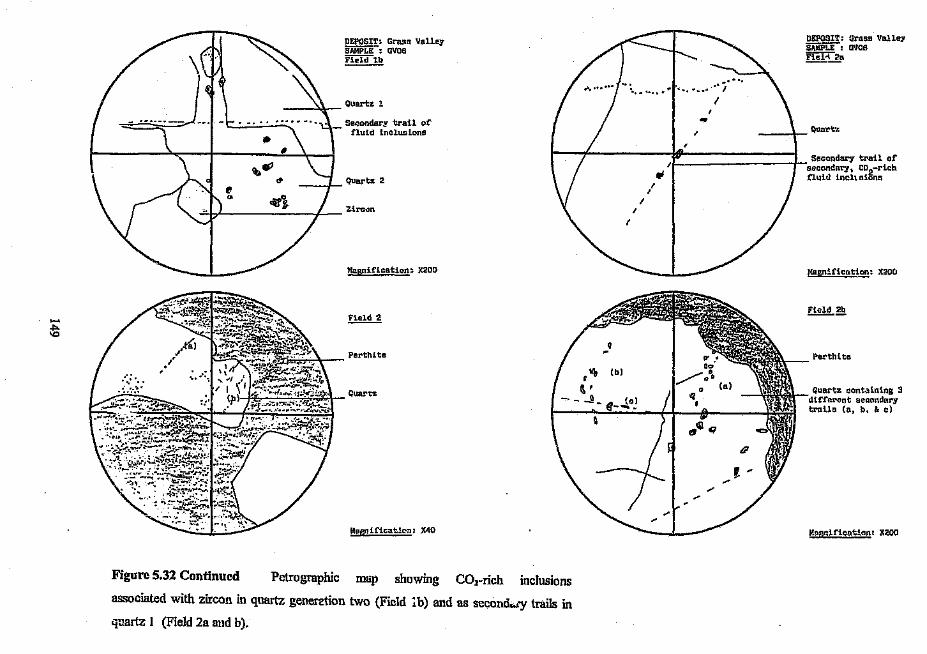
DEPOSIT, Grass ValleySAMPLE-, GVOSField lb
__ --",,~\-- Quart" 1
If,.01It
~l
Secondary trail offluid inclus Ions
DEPOSIT: Grass ValleySiiMPi:E: GV06TI-el-l 2a
___ +-_ QUart"
Secondary trail of~--------------------t--secondnry, CO2-rich
fluid incl' sionaQuaJ:'tz 2
~.b' / Zircan
......
.J:>.\0
Magnification. X200
~
Perthite
a"" (b)
l\ '....!l - €_J.c!-V!. "~";.'..;_:-::.-;r:'_:'.\ Quartz
Figure 5.32 Continued Petrographic
Mag"ificatic,,: X40
map showing inclusionsCOrrichassociated with zircon in quartz generation two (Field ib) and as secondary trails in
quartz I (Field 2a and b).
Nagn~f1cation: X20(l
~.?!!.
Perthite
Quartz containing 3differ~nt secondarytrnils (a, b. '" c)
M3gnificntlon' )(200
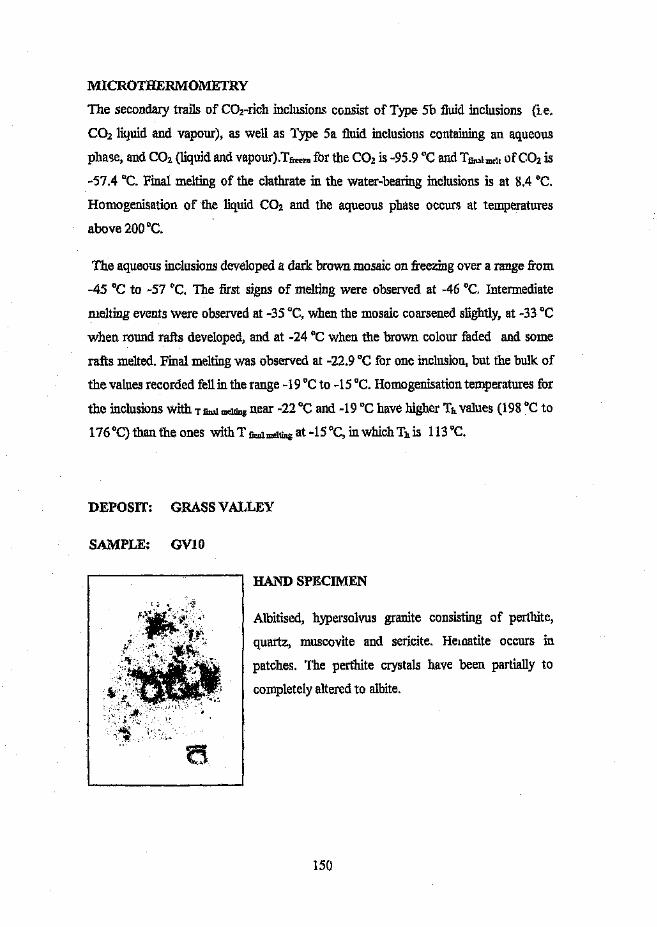
MICROTHERMOMETRY
'The secondary trails of CO2-rich inclusions consist of Type 5b fluid inclusions (i.e.
CO2 liquid and vapour), as well as Type 5a fluid inclusions containing an aqueous
phase, and CO2 (liquid and vapour).Tfreezefor the CO2 is -95.9 "C and Tfinalmcltof CO2 is
-57.4 "C. Final melting of the clathrate in the water-bearing inclusions is at 8.4 "C.
Homogenisation of the liquid C02 and the aqueous phase occur') at temperatures
above 200 "C.
The aqueous inclusions developed a dark brown mosaic on freezing over a range from
-45°C to -57 "C. The first signs of melting were observed at -46 "C, Intermediate
melting events were observed at -35°C, when the mosaic coarsened slightly, at -33 "C
when round rafts developed, and at -24°C when the brown colour faded and some
rafts melted. Final melting was observed at -22.9 "C for one inclusion, but the bulk of
the values recorded fell in the range -19°C to -15 "C. Homogenisation temperatures for
the inclusions with T finn1 melting near -22°C and -19 °C have higher Ts values (198 "C to
176°C) than the ones with T final melting at -15°C, in which Th is 113 °C.
DEPOSIT: CRASS VALLEY
SAMPIJE: GVI0
t__ a
HAND SPECIMEN
Albitised, hypersolvus granite consisting of perthite,
quartz, muscovite and sericite. Hematite occurs in
patches. The perthite crystals have been partially to
completely altered to albite.
150

FLUID INCLUSIONS
The fluid inclusion populations in this sample all belong to the same assemblage of
fluids associated with the alteration of the granite. The phase proportions are variable,
and fluid inclusions containing CO2 double bubbles (Type Sa inclusions) (Figure 5.33
Field 1) are found associated with Ty-pe l a, Type 2 and Type 3 inclusions (Figure 5.34
Field 2 and 3).
MICROTHERMOMETRY
Freezing occurred between -53°C and _5°C, and a brown mosaic developed. First
melting was observed at -49°C in some inclusions and at -46 "C in others. At -42 DC,
the mosaic coarsened considerably, and merged at -22°C. Final melting occurred
between -17 -c and -18 DC. A group of about 30 inclusions within this assemblage
underwent final melting at 13.3 DC. Homogenisation of the liquid and vapour phases
occurred between 157°C and 180 DC.Homogenisation of the liquid and vapour CO2
occurred at 25.3 DC.
Maip'!ttlell.tlonl X200
Figure 5. 33 Petrographic map showing C02-rich inclusions associated with Type
l a, Type 2 and Type 3 inclusions.
151
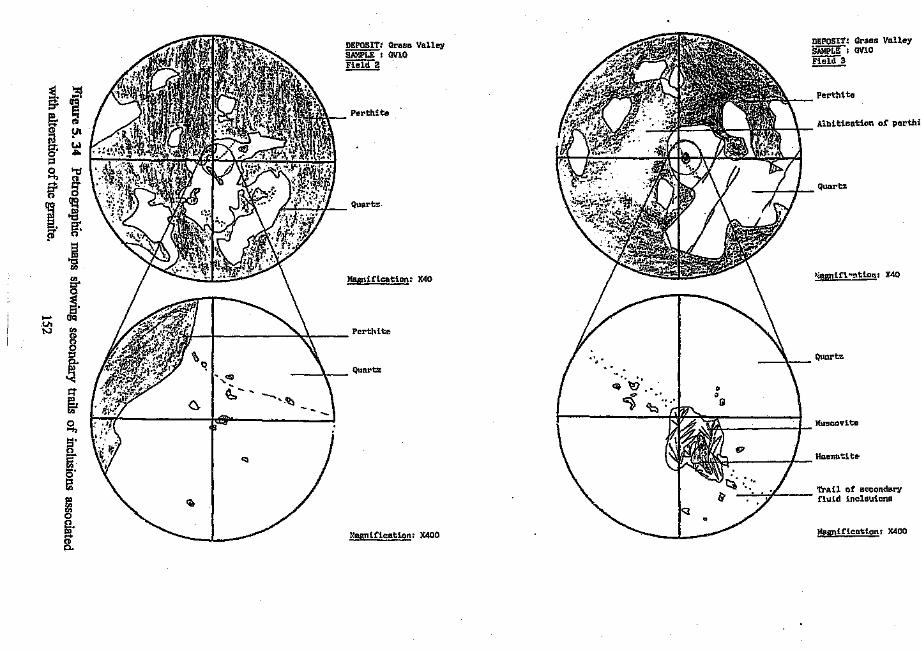
~"%'Ja'Q'=e. "1
...... !':>(l) !JI@...... w0' """p0 ""C....., (l)
~......al ~
.§e:..... q~
ieng~,,_. ()Q
.Ultv rJ)
Cll<10l:!Q.
Q..........II't:!:til
0.....,s·<1ErrJ)o·iil~rJ)
0<15'......CllQ.
c
<::j
',~(1;" .... , ~'"~
Q,
DEPOSIT: Grass ValleySAMPi:E: GV10Field2
Perthite
Quartz
~lagnification' )(40
Perthite
Qum·tz
l,lagnification: )(400
DEPOSIT: Grass ValleySAl>IPLE : GV10Field :3
Perthitc
Albitisation of perthi
Quartz
'.iagnif1"~~: J(4Q
Quartz
l~uscovite
Haemntlte
Trail of secondaryfluid inclauions
Magnification: )(400
HOUTENBEK
Systematic microthermometry of specifically chosen samples was not undertaken at the
Houtenbek deposit. A preliminary investigation of fluids associated with the
precipitation of quartz, purple fluorite and transparent sphalerite was undertaken and
the results are presented below. It should be noted that these minerals appear to post-
date molybdenite precipitation, and if this is indeed the case, shoulo contain no early
fluids associated with molybdenite precipitation.
Fluid inclusions in transparent sphalerite
Colour banding in the sphalerite indicates that precipitation occurred in several stages
and that slight fluctuations in the nature of the fluids occurred. The sphalerite contains
primary (Figure 5.35) and secondary (Figure 5.36) fluid inclusions which are
predominantly Type 1a inclusions. Primary fluid inclusions in growth zones demarcated
by colour banding in the sphalerite were studied. The sketch inFigure 5.37 shows the
relationships between sphalerite 1 and sphalerite 2. The primary fluid inclusions hosted
by sphalerite 1 are Type 1a inclusions in which the vapour bubble is easily visible. The
fluid inclusions in sphalerite 2 are also Type 1a inclusions, but it is very difficult to see
the vapour bubble due to the «ark discof ration of the inclusion walls. At first sight
these inclusions looked like Type 4 vapour inclusions, but on closer inspection it
appears that the inclusion walls have been partially altered to an opaque Fe-rich variety
of sphalerite,
153
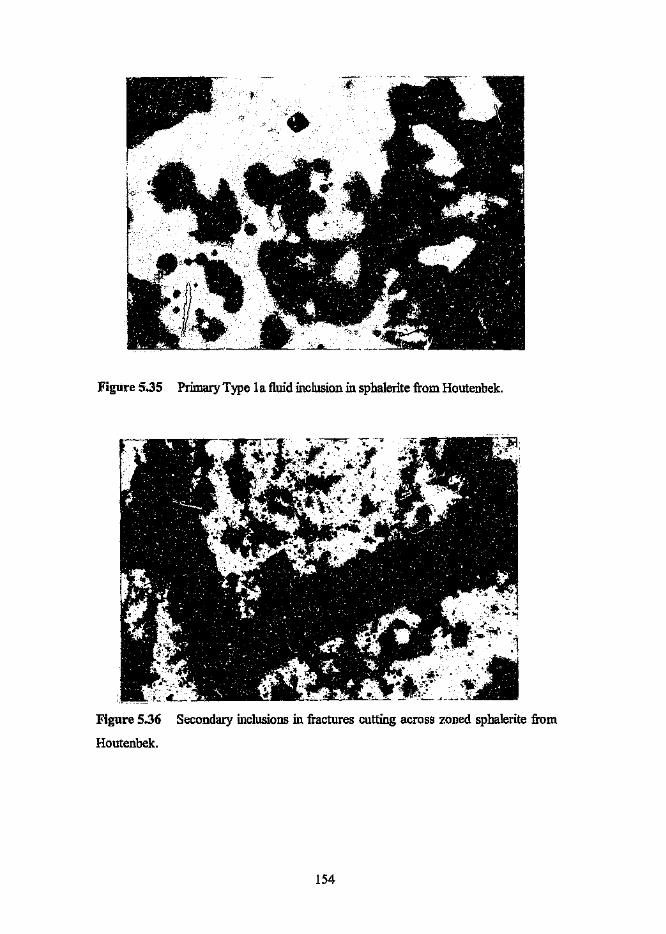
Figure 5.35 Primary Type la fluid inclusion in sphalerite from Houtenbek.
Figure 5.36 Secondary inclusions in fractures cutting across zoned sphalerite from
Houtenbek.
154
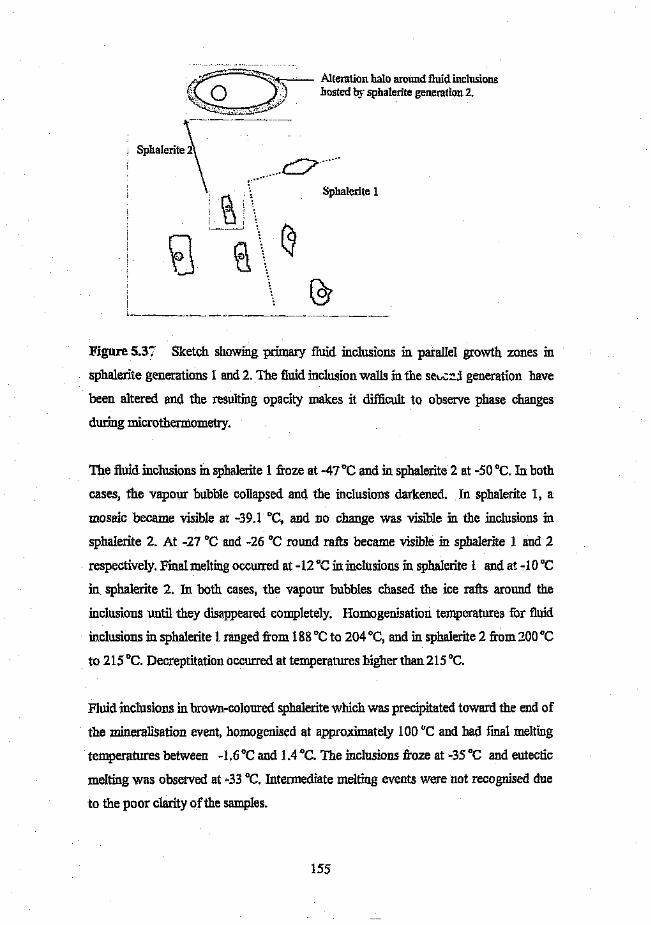
c:;;r ...........
Sphalerite 1
Figure 5.37 Sketch showing primary fluid inclusions in parallel growth zones in
sphalerite generations 1 and 2. The fluid inclusion walls in the se,,(;;:!,igeneration have
been altered and the resulting opacity makes it difficult to observe phase changes
during microthermometry,
The fluid inclusions in sphalerite 1 froze at -4rC and in sphalerite 2 at -50 "C, Inboth
cases, the vapour bubble collapsed and the inclusions darkened. In sphalerite I, a
mosaic became visible at -39.1 DC, and no change Was visible in the inclusions in
sphalerite 2. At -27°C and -26 °C round rafts became visible in sphalerite 1 and 2
respectively. Final melting occurred at -12°C in inclusions in sphalerite 1 and at -10°C
in sphalerite 2. In both cases, the vapour bubbles chased the ice rafts around the
inclusions until they disappeared completely. Homogenisation temperatures for fluid
inclusions in sphalerite 1 ranged from 188 "C to 204°C, and in sphalerite 2 from :WO "C
to 215°C. Decreptitation occurred at temperatures higher than 215°C.
Fluid inclusions in brown-coloured sphalerite which was precipitated toward the end of
the mineralisation event, homogenised at approximately 100°C and had final melting
temperatures between -1.6°C and 1.4 DC. The inclusions froze at ~35"C and eutectic
melting was observed at -33°C. Intermediate melting events were not recognised due
to the poor clarity of the samples.
155
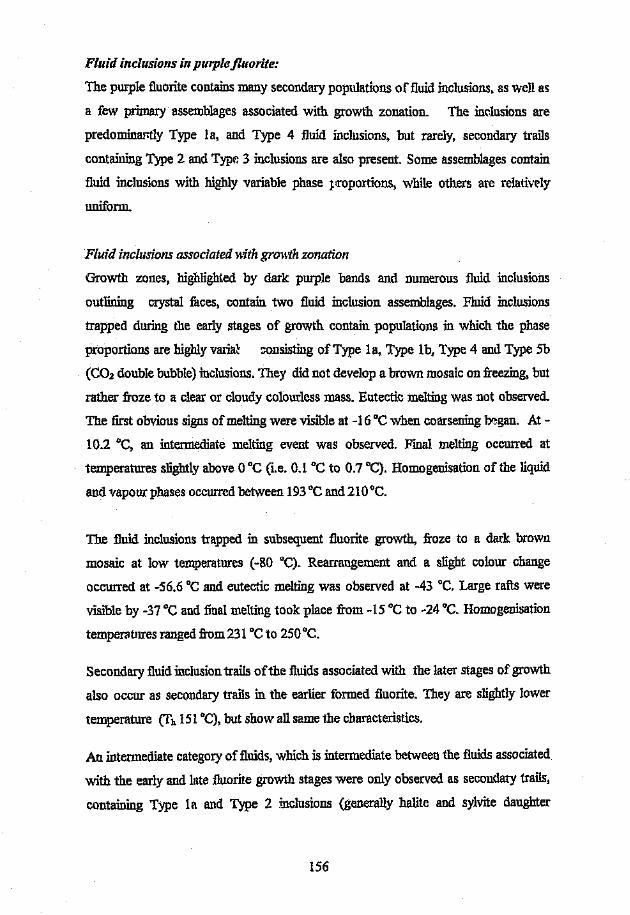
Fluid inclusions ill purple fluorite:
The purple fluorite contains many secondary populations of fluid inclusions. as well as
a few primary assemblages associated with growth zonation. The inclusions are
predominantly Type 1a, and Type 4 fluid inclusions, but rarely. secondary trails
containing Type 2 and Type 3 inclusions are also present. Some assemblages contain
fluid inclusions with highly variable phase j.roportions, while others are relatively
uniform.
Fluid inclusions associated with. growm zonation
Growth zones, highlighted by dark purple bands and numerous fluid inclusions
outlining crystal faces, contain two fluid inclusion assemblages. Fluid inclusions
trapped during the early stages of growth contain populations in which the phase
proportions are highly varial consisting of Type 1a, Type 1b, Type 4 and Type 5b
(C02 double bubble) inclusions. They did not develop a brown mosaic on freezing, but
rather froze to a clear or cloudy colourless mass. Eutectic melting was not observed.
The first obvious signs of melting were visible at -16°C when coarsening began. At-
10.2 DC, an intermediate melting event was observed. Final melting occurred at
temperatures slightly above O°C (i.e. 0.1 °C to 0.7°C). Homogenisation of the liquid
and vapour phases occurred between 193°C and210DC.
The fluid inclusions trapped in subsequent fluorite growth, froze to a dark brown
mosaic at low temperatures (-80°C). Rearrangement and a slight colour change
occurred at -56.6 DCand eutectic melting was observed at -43°C. Large rafts were
visible by -37 °C and final melting took place from -15 DCto -24 DC.Homogenisation
temperatures ranged from 231°C to 250 DC.
Secondary fluid inclusion trails of the fluids associated with the later stages of growth
also occur as secondary trails in the earlier formed fluorite. They are slightly lower
temperature (Th 151°C), but show all same the characteristics.
An intermediate category of fluids, which is intermediate between the fluids associated
with the early and late fluorite growth stages were only observed as secondary trails,
containing Type 1a and Type 2 inclusions (generally halite and sylvite daughter
156
crvstals). They froze to a brown mosaic at approximately -75 <>C.Eutectic melting was
observed at ··50"C when the brown coloration began to fade and the relief of the
n.ssaic increased. By -25°C the mosaic had merged into round rafts. which gradually
shrank in size until they were completely melted. The temperature of final melting for
this category of fluid inclusions ranges from _4°C to -7 DC. and homogenisation of the
liquid and vapour phases occurred between 150°C and 240 "C.
The lowest temperature fluids (Th >100 "C) occur as secondary trails of predominantly
Type 3 inclusions. These inclusions produce a colourless solid on freezing. Eutectic
melting and intermediate melting events were difficult to recognise before final melting
occurred. At -25°C areas of higher relief became 'visible, and may represent the
eutectic melting event. Inmany instances, the vapour bubble simply expanded and the
cloudiness inside the inclusion disappeared on final melting, and in other cases.
sublimation (i.e. the frozen solid melted and the vapour bubble sprang back
simultaneously) was noticed. This behaviour was observed at temperatures slightly
above ooe. In some inclusions clathrates could be seen, but in general they were not
visible.
Fluid inclusions influorite post-dating sphalerite
Primary fluid inclusions in fluorit, post-dating sphalerite and associated 'with green
chlorite, are predominantly Type la and Type 3 inclusions, with a few Type 2
inclusions containing chlorite as solid phases. The fluorite partially fills a vug formed
by sphalerite crystals. and an open cavity is present in the centre. Fluid inclusions occur
in growth zones, with the fluids trapped last occurring towards the central cavity, and
those trapped earlier are closer to the vug walls. On freezing (Tfr=e -45 "C), the vapour
bubble disappeared and a colourless mosaic developed. Eutectic melting was observed
at -35.8 "C. and intermediate melting events were observed at -29 "C (mosaic merged
into round rafts). at -20°C (the round rafts merged into bigger rafts) and at -12°C
(some rafts melted). Final melting occurred between -2.4 "C and -2.0 "C for the early
fluia inclusions. and at '1.8 "C for those fluid inclusions trap •. 1in the late stages of
fluorite deposition. Homogenisation temperatures range from 134 "C in the early fluid
inclusions to less than 100 "C in the late fluid inclusions, which corresponds with the
increase in Tfi.clmdtingtemperatures from -2.4 "C to -0.8 "c.
157
Fluid inclusions in quartz
The fluid inclusions hosted by the pegmatitic quartz at Houtenbek are predominantly
Type 1a inclusions, but several Type 1b, Type 2 and Type 3 inclusions do occur. Phase
proportions within assemblages are variable and any combination of the above
mentioned fluid inclusion types is possible.
The change in the nature of the fluids was studied in fluid inclusions in four
consecutive growth stages in a crystal. The earliest fluids were trapped at relatively
high temperatures (Th approx. 250DC), and the late stage fluids were trapped at
temperatures below 100°C. A change in the fluid character was also observed. The
early fluids underwent :finalmelting between -24°C and -20 DC. The fluids trapped in
the last quartz growth stage melted at -2°C and progressive decrease was observed
between the two extremes. A considerable number OfTfinalmeltingdata points fell in the
range -10 DC to -15°C. Freezing temperatures for the fluid inclusions trapped in the
early quartz growth stages are not as low as was observed in fluid inclusion
assemblages at the other deposits. At Houtenbek, freezing took place between -33°C
and -41 DC, despite indications that the solute content was considerable (i.e. T finalmelting
as low as -24°C). On freezing, a pale brown mosaic developed and eutectic melting
was observed between -38 DC and -34 DC. Intermediate melting events for those
inclusions melting below -20 DC were observed at -29 DC and -24°C.
158
SPOEDWEL
The samples selected for microthermometry from Spoedwel are listed in Table 5.4, and
the reasons for their selection are given. Hand specimen descriptions, fluid inclusion
petrography and micro thermometry for each sample are presented in the following
sections.
Table 5.4 List of samples selected for microthermometry from Spoedwel, and the
reasons for selection.
SAMPLE REASONS FOR SELECTING SAMPLE FOR MICROTHER1\WMETRY~--------------------SPI Sample contains fluid inclusions in interstitial quartz that are not necessarily
associated with mineralisation, as well as fluids introduced along fractures (quartz
veins) which are associated with chalcopyrite precipitation.
Sample contains fluids associated with the three major quartz generations present in
interstitial cavities, including the fluids associated with disseminated sulphide
precipitation.
Sample contains primary fluid inclusions which are associated with the precipitation
of fluorite.
Sample contains fluids associated with quartz vein containing sphalerite crystals.
Sample contain quartz vein with two quartz generations and is associated with
chalcopyrite
SP2
SP3
SP7
Ll
DEPOSIT: SPOEDWEL
SAMPLE: 8Pl
HAi'ID SPECIM.J!,,;
This is a fine-grained, pinkish-red granite. The grain size is less than lmm for the largest
quartz grains and O.lmm for the smallest grains. The rock consists of equal proportions of
secondary quartz and hematitised feldspar (perthite). No interstitial fluorite is present.
Fluorite and quartz occur as veins from 5mm to a few micrometers inwidth, The fluorite is
colourless to pale purple, the darker coloured fluorite occurring in fine veinlets. The wall
rock of the larger quartz veins has been hydrothermally altered. A zone extending
approximately 3cm inh tIle host consists of very fine-grained (O.Olmm) material, This
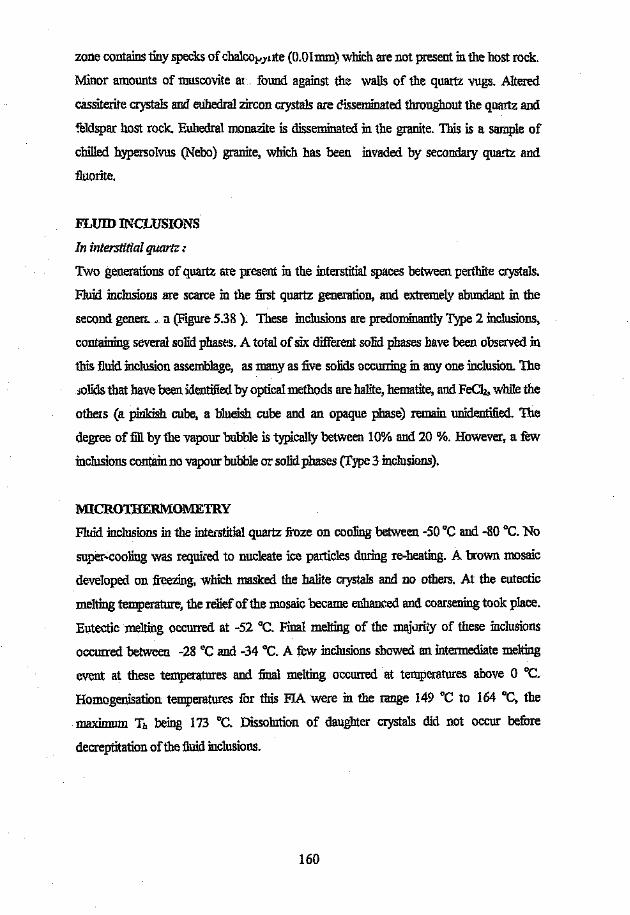
zone contains tiny specks of chalcopynte (O.Olmm) which are not present inthe host rock.
Minor amounts of muscovite ar found against the walls of the quartz vugs. Altered
cassiterite crystals and euhedral zircon crystals are cisseminated throughout the quartz and
feldspar host rock. Eubedral monazite is disseminated in the granite. This is a sample of
chilled hypersolvus (Nebo) granite, which has been invaded by secondary quartz and
fluorite.
FLUID INCLUSIONS
In interstitial quartz :
Two generations of quartz are present in the interstitial spaces between perthite crystals.
Fluid inclusions are scarce in the first quartz generation, and extremely abundant in the
second genen, "il (Figure 5.38). These inclusions are predominantly Type 2 inclusions,
containing several solid phases. A total of six different solid phases have been observed in
this fluid inclusion assemblage, as many as five solids occurring in anyone inclusion. The
solids that have been identified by optical methods are halite, hematite, and FeCh, while the
others (a pinkish cube, a blueish cube and an opaque phase) remain unidentified. The
degree of:fill by the vapour bubble is typically between 10% and 20 %. However, a few
inclusions contain no vapour bubble or solid phases (Type 3 inclusions).
MICRO'l'IIERMOl\1ETRY
Fluid inclusions in the interstitial quartz froze on cooling between -50°C and -80 "C. No
super-cooling was required to nucleate ice particles during re-heating. A brown mosaic
developed on freezing, which masked the halite crystals and no others. At the eutectic
melting temperature, the relief of the mosaic became enhanced and coarsening took place.
Eutectic melting occurred at -52 "C, Final melting of the majority of these inclusions
occurred between -28°C and -34 DC. A few inclusions showed an intermediate melting
event at these temperatures and final melting occurred at temperatures above 0 DC.
Homogenisation temperatures for this FIA were in the range 149°C to 164 GC, the
maximum Th being 173°C. Dissolution of daughter crystals did not occur before
decreptitation of the fluid inclusions.
160
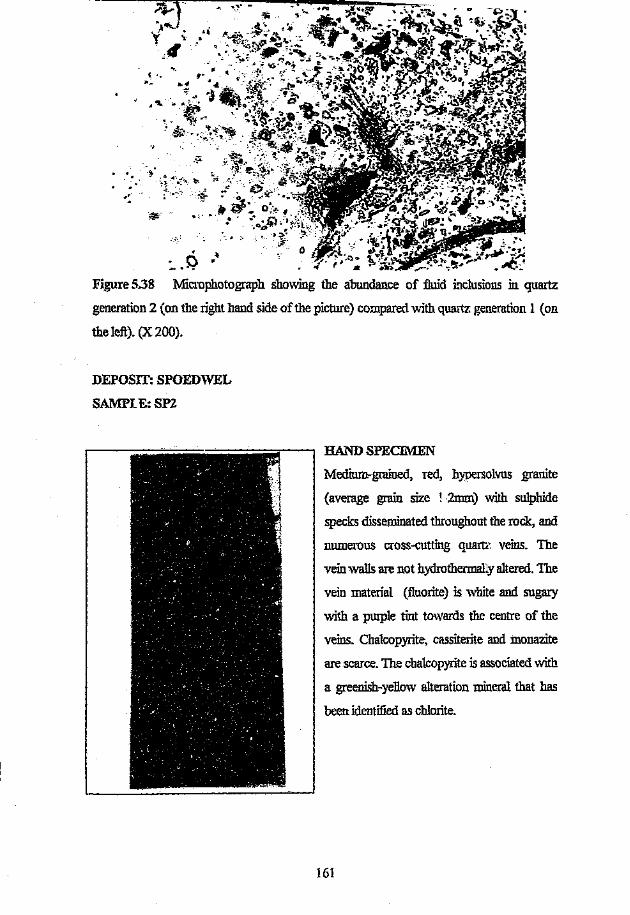
_,
<:..P .~Figure 5.38 Microphotograph showing the abundance of fluid inclusions in quartz
generation 2 (on the right hand side of the picture) compared with quartz generation 1 (on
the left). (X 200).
DEPOSIT: SPOEDWEL
SAMPLE: SP2
HAND SPECIMEN
Medium-grained, red, hypersolvus granite
(average grain size I 2rom) with sulphide
specks disseminated throughout the rock, and
numerous cross-cutting quartz veins. The
vein walls are not hydrothermally altered. The
vein material (fluorite) is white and sugary
"lith a purple tint towards the centre of the
veins. Chalcopyrite, cassiterite and monazite
are scarce. The chalcopyrite is associated with
a greenish-yellow alteration mineral that has
been identified as chlorite.
161

FLUID INCLUSIONS
Fluid inclusions hosted by three generations of quartz occur in the interstitial quartz in this
sample (Figure 5.39). The image shows that the early quartz (pale grey). is overgrown by a
second generation of quartz (intermediate grey), displaying internal growth
lamellaelzonation. A third generation of quartz occurs as secondary trails cutting across the
earlier generations. Quartz reneration 3 is associated with zircon formation, The zircon
crystals have alteration balos that are visible on Fi£,'llfe5.39, but that are invisible to the
naked eye. Fluids associated with each of these episodes of quartz deposition have been
recognised. The inclusions associated with Quartz 1 are Type I and Type 3 inclusions.
They contain no daughter crystals and have highly irregular liquid : vapour ratios. In
contrast, the f!' :!inclusions associated with Quartz 2 are Type 2 inclusions, consisting of
small vapour bubbles (10% vapour :fill), liquid and the occasional small halite daughter
crystal. The inclusions associated with Quartz 3 are also Type 2 inclusions, but halite
daughter crystals are present ill all inclusions, and the crystals are large!'. In addition,
hematite and several other small solid phases have also been observed in these inclusions.
Quartz generation 1 contains few inclusions and is relatively clear, while Quartz 2 is
speckled with abundant fluid inclusions (Figure 5.40).
Figure 5.39 Cathodo-luminescence image showing three generations of quartz ill
interstitial spaces between feldspar crystals.
162
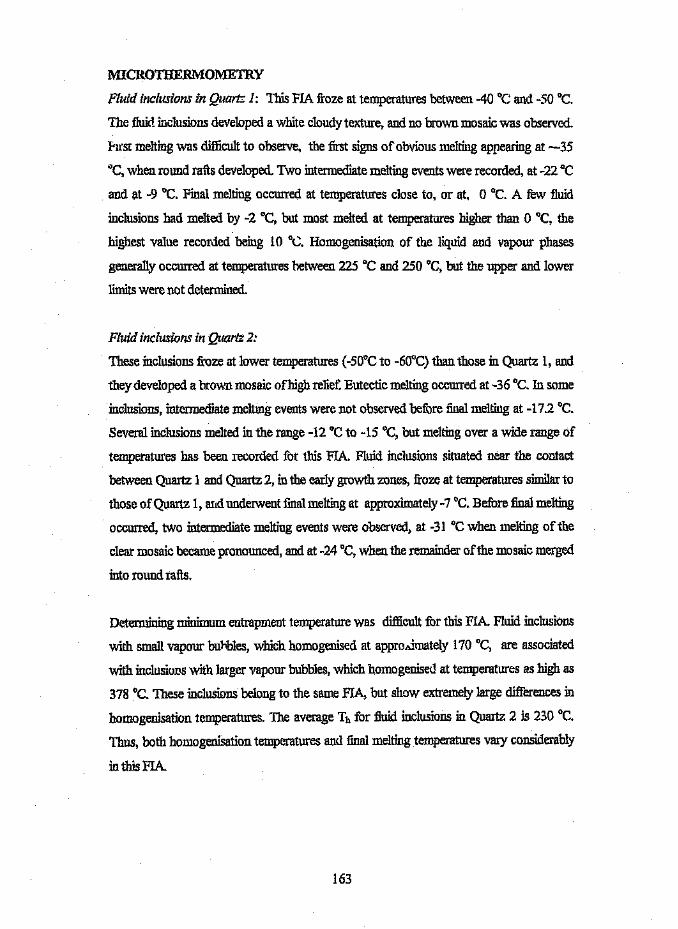
MICROTHERMOMETRY
Fluid inclusions in Quartz 1: This PIA froze at temperatures between -40 "C and -50°C.
The fluid inclusions developed a white cloudy texture, and no brown mosaic was observed.
Firsr melting was difficult to observe, the first signs of obvious melting appearing at -35
"C, when round rafts developed. Two intermediate melting events were recorded, at -22 "cand at -9°C. Final melting occurred at temperatures close to, or at, 0 "C, A few fluid
inclusions had melted by -2 DC, but most melted at temperatures higher than 0 "C, the
highest value recorded being 10 °C. Homogenisation of the liquid and vapour phases
generally occurred at temperatures between 225°C and 250 aC, but the upper and lower
limits were not determined.
Fluid inclusions in Quartz 2:
These inclusions froze at lower temperatures (-50°C to -60°C) than those in Quartz 1, and
they developed a brown mosaic of high relief. Eutectic melting occurred at -36 "C. In some
inclusions, intermediate melting events were not observed before final melting at -17.2 °C.
Several inclusions melted in the range -12 "C to -15 "C, but melting over a wide range of
temperatures has been recorded for this FlA. Fluid inclusions situated near the contact
between Quartz 1 and Quartz 2, in the early growth zones, froze at temperatures similar to
those of Quartz 1, and underwent final melting at approximately -7 "C, Before finalme1ting
occurred, two intermediate melting events were observed, at -31 "C when melting of the
clear mosaic became pronounced, and at -24 "C, when the remainder of the mosaic merged
into round rafts.
Determining minimum entrapment temperature was difficult for this FIA. Fluid inclusions
with small vapour bubbles, which homogenised at approximately 170°C, are associated
with inclusions with larger vapour bubbles, which homogenised at temperatures as high as
378 "C, These inclusions belong to the same FIA, but show extremely large differences in
homogenisation temperatures. The average Th for fluid inclusions in Quartz 2 is 230°C.
Thus, both homogenisation temperatures and final melting temperatures vary considerably
inthisHA
163

00 0... "l ~., X
'"
~
"0
~
eON"0.0.
L~ ttl ...N "~I~n 1: ... :;:
"... o... ('j '"..,
~a:~ " "..., o.
'" 0- o. "el~~ '" :>0. 0- '"~tn~ '"
00
0 ;;:... -eX'"
~
:.
~
."eOt'\!0.0.
'"rntn ..."
Niy"'l ... ...""
..., r..... o. '"~il~1s, <I ::;I
'" " a0. 0-
'"
Figure 5.40 ...etrographic maps showing fluid inclusions associated with quartz
generations1and 2. 164

Fluid inclusions in Quartz 3:
These inclusions froze at even lower temperatures (-80 "C) than those ill Quartz 2, and
developed a dark brown mosaic. Eutectic melting occurred between -50°C and -60 °C,
when the mosaic disintegrated and coarsened. Final melting occurred between -30°C and-
38 "C. Homogenisation of the vapour and liquid phases occurred between 93 "C to 107°C.
DEPOSIT: SPOEDWEL
SAMPLE: SP3
HAND SPECIMEN
A coarse-grained, brick red, hypersolvus granite with little interstitial quartz. The interstitial
spaces are generally :filledwith purple fluorite and dark green chlorite which is partially
replaced by hematite. Rosettes of hematite occur as overgrowths on cassiterite and zircon.
The hematite rosettes are pseudomorphs after chlorite. Perthite crystals are large (<7mm)
and the interstitial ~i.lartz and fluorite is minor. No veins or sulphides are present. Small
disseminated cassiterite grains are associated wit1i zircon crystals.
FLUID INCLUSIONS
In quartz:
At least two different fluid inclusion assemblages (PIA's) are recognised in this sample.
The one FIA is composed of Type 1 fluid inclusions with approximately 10 % vapour fill,
and is associated with monazite. The other consists ofpredomiuantly Type 3 (monophase
liquid inclusions) with few Type 1 fluid inclusions (less than 5 % vapour fill), and occurs as
primary inclusions in quartz overgrowing hematite crystals.
Influorite:
Several FINs with different characteristics have been trapped in the two fluorite
generations at Spoedwel. PIA's with uniform liquid to vapour ratios, as well as PIA's with
variable liquid to vapour ratios, have been observed. However, variability ill the degree of
vapour fill is more often the case. Primary inclusions occurring along growth zones, as well
as secondary trails offluid inclusions, display this variability (Figure 5.39). Solid phases are
165

extremely rare, and where present, are most likely to represent trapped solids rather than
true daughter crystals.
MICROTHERMOMETRY
Fluid inclusions ill quartz:
The fluid inclusions associated with hematite precipitation froze at temperatures between -
50°C and -60°C and developed a brown mosaic. Melting was first observed at -38 °C and
by -34°C the mosaic had disappeared, and only rafts remained. Intermediate melting
events were observed at -21°C and -14 DC.Final melting for t3is FIA occurred between-9
°C and -10°C. Homogenisation temperatures for the few two phase inclusions occurred
below 100°C.
Within the Type In fluid inclusions, two FIA's have been recognised with different
microthermometrlc behaviour. The assemblage with the nighest Tfinolruclting(-13 °C to -17
"C) also had the highest temperatures for homogenisation of the liquid and vapour phases
(average 190°Cj max. 259°C), and lowest freezing temperatures (-59 DC). The other
assemblage had very low Tfinolmclting (approximately OCC).Ibis assemblages did not develop
a dark brown mosaic on freezing (Tfr=.e between -42°C and -46'C). Homogenisation of
vapour into the liquid phase occurred at 158°C.
Fluid inclusions influorite:
At least four different categories of fluid inclusions have been measured in the fluorite, and
are discussed in order of increasing final melting temperatures.
The fluid inclusions with the lowest Tfim1 mclting (-13°C), and lowest freezing temperatures (-
60°C), developed a brown mosaic on freezing =nd appeared to be secondary in origin. First
melting was observed by -42°C when the relief of the mosaic became enhanced. By -27 DC,
the mosaic had merged into rafts which began rounding off. No other obvious intermediate
meting events were recorded for this assemblage. Homogenisation occurred 'between 128
°C and 150°C.
The FIA with the second lowest T1ln:U molting (_8°C to -9°C), showed very similar
microthermometric behaviour to the above mentioned assemblage. First melting occurred
166
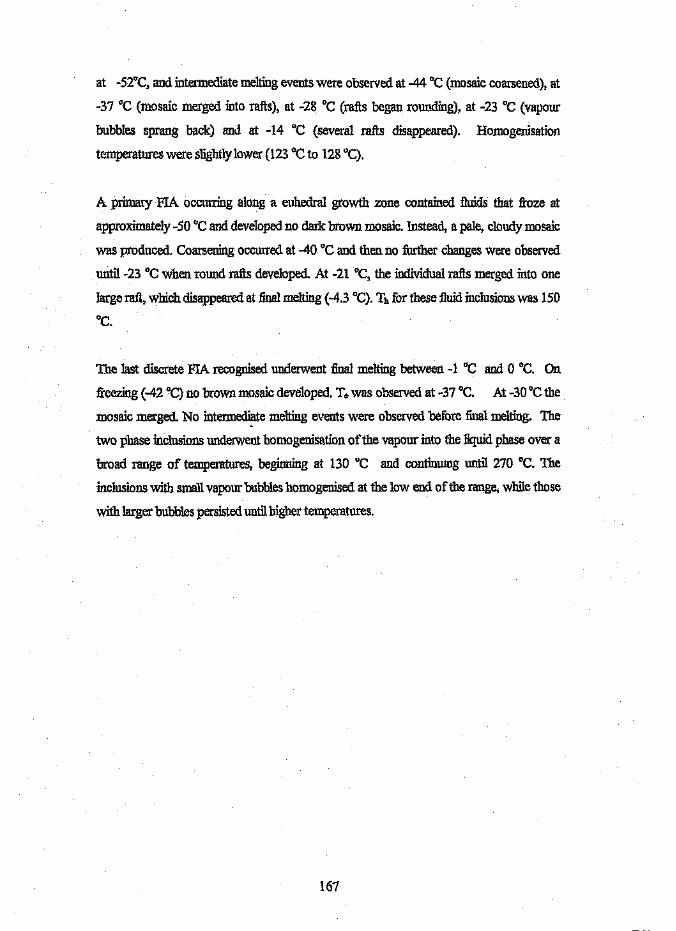
at -52°C, and intermediate melting events were observed at -44 "C (mosaic coarsened), at
-37 "C (mosaic merged into rafts), at -28°C (rafts began rounding), at -23 "C (vapour
bubbles sprang back) and at -14°C (several rafts disappeared). Homogenisation
temperatures were slightly lower (123°C to 128°C).
A primary FIA occurring along a euhedral growth zone contained fluids that froze at
approximately -50°C and developed no dark brown mosaic. Instead, a pale, cloudy mosaic
was produced. Coarsening occurred at -40 "C and then no further changes were observed
unti1-23 "C when round rafts developed. At -21°C, the individual rafts merged into one
large raft, which disappeared at final melting (-4.3 "C). Th for these fluid inclusions was 150
°c.
The last discrete FIA recognised underwent :final melting between _1°C and 0 "C. On
freezing (-42°C) no brown mosaic developed. Te was observed at -37°C. At -30 "C the
mosaic merged. No intermediate melting events were observed before :final melting. The
two phase inclusions underwent homogenisation of the vapour into the liquid phase over a
broad range of temperatures, beginning at 130°C and continumg until 270°C. The
inclusions with small vapour bubbles homogenised at the low end of the range, while those
with larger bubbles persisted until higher temperatures.
167
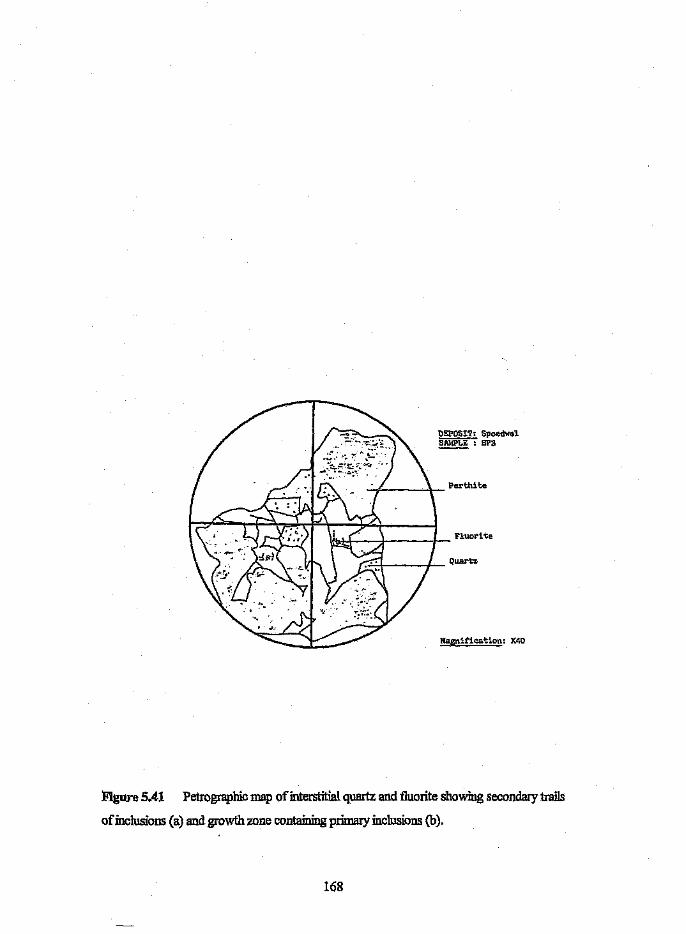
DEPOSIT, SpoedwelSAHPLE : SP3
Magnification, X40
Figure 5041 Petrographic map of interstitial quartz and fluorite showing secondary trails
of inclusions (a) and growth zone containing primary inclusions (b).
168
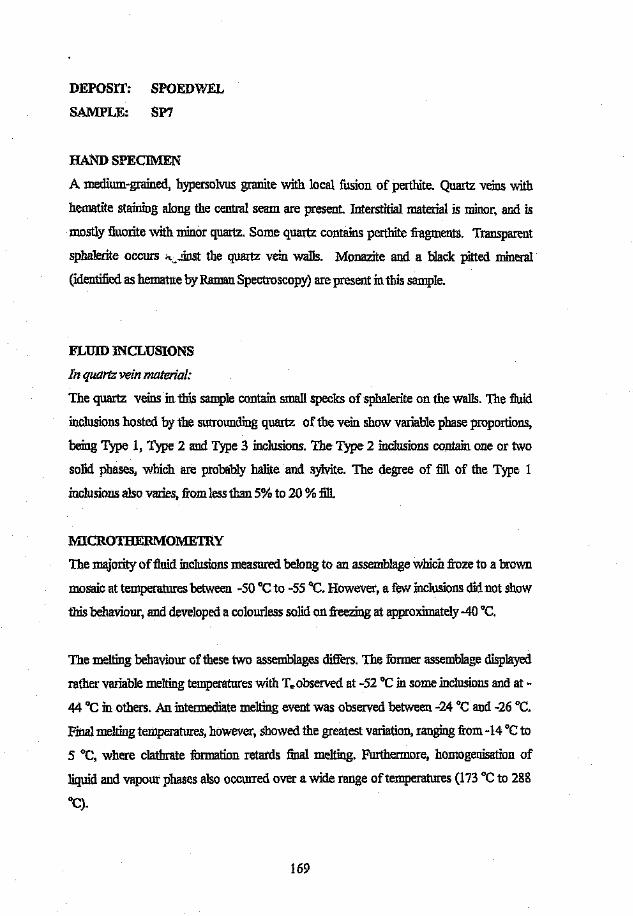
DEPOSIT:
SAMPLE:
SPOEDWEL
SP7
HAND SPECIMEN
A medium-grained, hypersolvus granite with local fusion of perthite, Quartz veins with
hematite staining along the central seam are present. Interstitial material is minor, and is
mostly fluorite with minor quartz. Some quartz contains perthite fragments. Transparent
sphalerite occurs "'_.iinst the quartz vein walls. Monazite and a black pitted mineral
(identified as hematite by Raman Spectroscopy) are present in this sample.
FLUID INCLUSIONS
In quartz vein material:
The quartz veins in this sample contain smaIl specks of sphalerite on the Walls. The fluid
inclusions hosted by the surrounding quartz of the vein show variable phase proportions,
being Type 1, Type 2 and Type 3 inclusions. The Type 2 inclusions contain one or two
solid phases, which are probably halite and sylvite. The degree of fill of the Type 1
inclusions also varies, from less than 5% to 20 % fill.
MICROTHERt"VIOMETRY
The majority oft1uid inclusions measured belong to an assemblage which froze to a brown
mosaic at temperatures between -50 "C to -55 "C. However, a few inclusions did not show
this behaviour, and developed a colourless solid on freezing at approximately -40 DC.
The melting behaviour of these two assemblages differs. The former assemblage displayed
rather variable melting temperatures with Teobserved at -52°C in some inclusions and at-
44 "C in others. An intermediate melting event was observed between -24°C and -26 "C,
Final melting temperatures, however, showed the greatest variation, ranging from -14°C to
5°C, where clathrate formation retards final melting. Furthermore, homogenisation of
liquid and vapour phases also occurred over a wide range of temperatures (173°C to 288
0c).
169
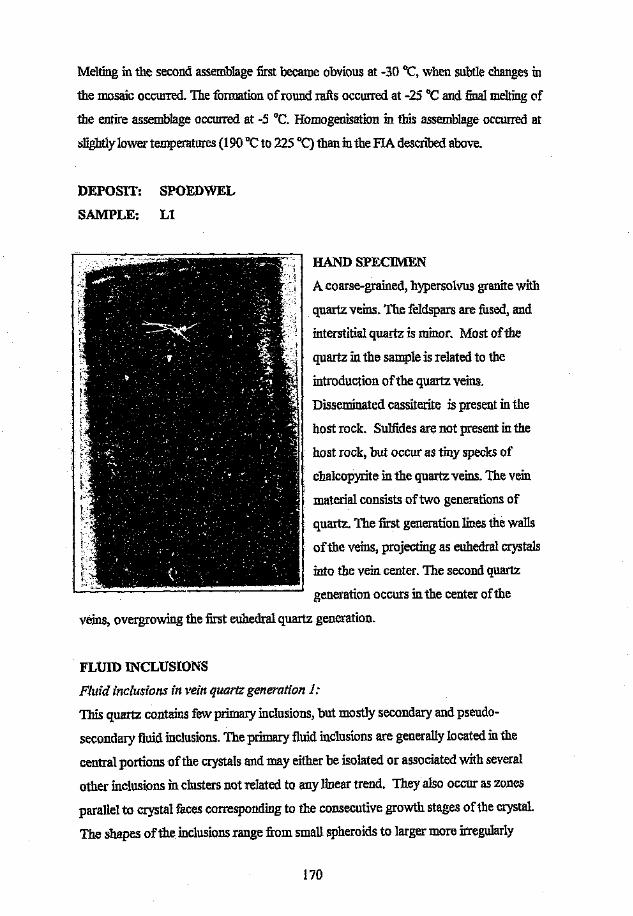
Melting in the second assemblage first became obvious at -30 "C, when subtle changes in
the mosaic occurred. The formation of round rafts occurred at -25 "C and final melting of
the entire assemblage occurred at -5°C. Homogenisation in this assemblage occurred at
slightly lower temperatures (190°C to 225 QC) than in the FIA described above.
DEPOSIT: SPOEDWEL
SAMPLE: Ll
HAND SPECIMEN
A coarse-grained, hypersolvus granite with
quartz veins. The feldspars are fused, and
interstitial quartz is minor. Most of the
quartz in the sample is related to the
introduction of the quartz veins.
Disseminated cassiterite is present in the
host rock. Sulfides are not present in the
host rock, but occur as tiny specks of
chalcopyrite in the quartz veins. The vein
material consists of two generations of
quartz. The first generation lines the walls
of the veins, projecting as euhedral crystals
into the vein center. The second quartz
generation occurs in the center of the
veins, overgrowing the first euhedral quartz generation.
FLUID INCLUSIONS
Fluid inclusions in vein quartz generation 1:
This quartz contains few primary inclusions, but mostly secondary and pseudo-
secondary fluid inclusions. The primary fluid inclusions are generally located in the
central portions of the crystals and may either be isolated or associated with several
other inclusions in clusters not related to any linear trend. They also occur as zones
parallel to crystal faces corresponding to the consecutive growth stages of the crystal.
The shapes of the inclusions range from small spheroids to larger more irregularly
170
shaped inclusions. The smaller inclusions tend to be monophase liquid (Type 3)
inclusions, while the larger inclusions generally contain up to 20% vapour fill. True
daughter crystals or trapped solids are rare. Isolated instances of halite and sylvite
crystals have been observed.
Fluid inclusions in vein quartz generation 2:
The fluid inclusions are highly irregular in shape and are generally necked and faceted.
The phase proportions are variable. Many of these inclusions contain a dark solid
phase which has been identified as hematite by Raman Spectroscopy. The number of
Type 3 inclusions present is greater than the number of Type 1 inclusions. There are
no solid phases.
MICROTHERMOMETRY
Fluid inclusions in vein quartz generation 1:
Freezing occurred between ~80 "C and -85°C, and a fine-grained mosaic of brown-
coloured solids developed. Rearrangement of the crystals was observed at -63°C, and
eutectic melting was recognized at approximately -52 DC. Several intermediate melting
events were recorded. At -44°C a change in the mosaic was observed. The mosaic
developed wavy edges at approximately -35 "C and the whole mosaic coarsened at -30
"C. The development of round rafts began, and by -15°C only a few large rafts
remained. Final melting of almost all fluid inclusions in this assemblage occurred
between -4 DCand -5 "C. Homogenisation temperatures range from 203 "C to 244°C.
Fluid inclusions in vein quartz generation 2:
Freezing occurred between -32 DCand -40 DC,and no brown discoloration of the
mosaic was observed. Eutectic melting could not be determined with certainty, but the
first obvious signs of melting were visible at -22 DC Two intermediate melting events
were observed before final melting. At -10°C the cloudiness of the mosaic faded,
leaving "l single clear raft, which then began to shrink at -5 DC.Final melting occurred
betwe=v> "C and 0.3 DC.Homogenisation occurred between 160°C anti 193 DC.
171
DRONl(FONTEIN
The samples trom Dronkfontein were selected from diamond drill core, and are listed
in Table 5.5 , along with the reasons for their selection.
Table 5.5 List of samples selected for microthermometry from Dronkfontein, and
the reasons for selection.
SAMPLE REASONSFOR SELECTINGSAMPLEFORMICROTHERl\lOMETRY
GC600 Sample contains fluids associated with three generations of interstitial quartz and
contains fluids responsible for precipitating disseminated low grade chalcopyrite.
GC406 Sample contains minor disseminated sulphides, and numerous zircon crystals.
DEPOSIT: DRONKFONTEIN
SAMPLE: GC406
HAND SPECIMEN
Medium- to coarse-grained, pink granite composed of quartz, pertbite and green
chlorite. Some sulpbide specks occur in the mafic specks. The average grain size is 3-
6mm.. Cathodo-luminescence images have shown the same number of quartz
generations as in GC600: i.e., there are at least three distinct generations of quartz
(Figure 5.42) The first generation consists of euhedral crystals with minor internal
growth zonation. 'The second quartz generation has overgrown the first and is
commonly marked by zircon crystals at the contact. The third quartz generation is
minor and occurs as secondary trails cutting across quartz 1 and 2. A fourth quartz
generation has been observed in some sections where the fractures in which quartz 3
was precipitated were re-utilized, and another (fourth) quartz generation was
deposited.
FLUID INCLUSIONS
The quartz in this sample is full of secondary fluid :inclusion trails. Two fluid inclusions
assemblages are recognized in this sample, both of which occur as secondary trails.
The first assemblage consists of Type 2 inclusions which contain halite daughter
172
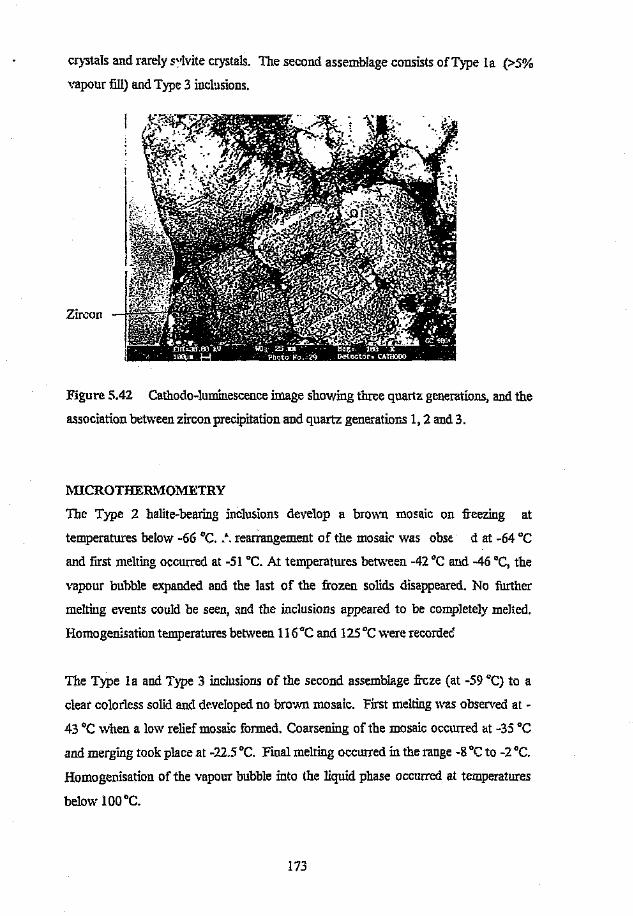
crystals and rarely svlvite crystals. The second assemblage consists of Type La (>5%
vapour fill) and Type 3 inclusions.
Zircon
Figure 5.42 Cathodo-luminescence image showing three quartz generations, and the
association between zircon precipitation and quartz generations 1, 2 and 3.
MICROTHER.1\10METRY
The Type 2 halite-bearing inclusions develop a brown mosaic on freezing at
temperatures below -66 "C. }, rearrangement of the mosaic' was obse d at -64°C
and first melting occurred at -51 QC.At temperatures between -42 "C and -46 "C, the
vapour bubble expanded and the last of the frozen solids disappeared. No further
melting events could be seen, and the inclusions appeared to be completely melted.
Hornogenisation temperatures between 116 "C and 125 "C were recorded
The Type 1a and Type 3 inclusions of the second assemblage frcze (at -59 QC)to a
clear colorless solid and developed no brown mosaic. First melting was observed at -
43 "C when a low relief mosaic formed. Coarsening of the mosaic occurred at -35°C
and merging took place at -22.5 QC. Final melting occurred in the range -8 "C to -2 QC.
Homogenisation of the vapour bubble into the liquid phase occurred at temperatures
below 100 "C.
173
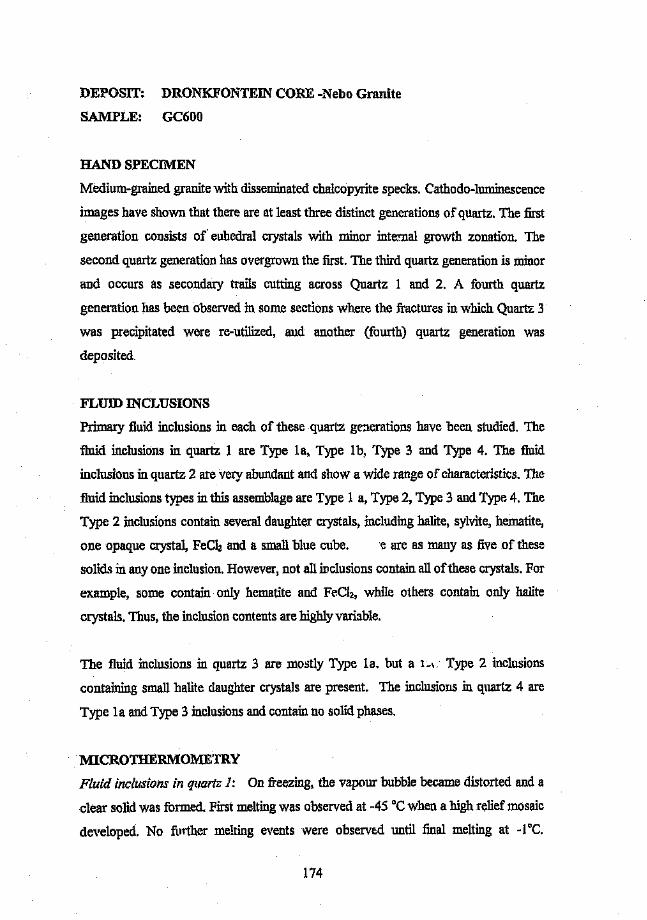
DEPOSIT:
SAMPLE:
DRONKFONTEIN CORE -Nebo Granite
GC600
HAND SPECIMEN
Medium-grained granite with disseminated chalcopyrite specks. Cathodo-luminescence
images have shown that there are at least three distinct generations of quartz. The first
generation consists of euhedral crystals with minor internal growth zonation. The
second quartz generation has overgrown the first. The third quartz generation is minor
and occurs as secondary trails cutting across Quartz 1 and 2. A fourth quartz
generation has been observed in some sections where the fractures in which Quartz 3
was precipitated were re-utilized, and another (fourth) quartz generation was
deposited.
FLUID INCLUSIONS
Primary fluid inclusions in each of these quartz generations have been studied. The
fluid inclusions in quartz 1 are Type la, Type lb, Type 3 and Type 4. The fluid
inclusions in quartz 2 are very abundant and show a wide range of characteristics. The
fluid inclusions types in this assemblage are Type 1 a, Type 2, Type 3 and Type 4. The
Type 2 inclusions contain several daughter crystals, including halite, sylvite, hematite,
one opaque crystal, FeCb and a small blue cube. e are as many as five of these
solids in anyone inclusion. However, not all inclusions contain all of these crystals. For
example, some contain only hematite and FeCh, while others contain only halite
crystals. Thus, the inclusion contents are highly variable.
The fluid inclusions in quartz 3 are mostly Type Ia. but a L, Type 2 inclusions
containing small halite daughter crystals are present. The inclusions in quartz 4 are
Type 1a and Type 3 inclusions and contain no solid phases.
MICROTHERMOMETRY
Fluid inclusions in quartz 1: On freezing, the vapour bubble became distorted and a
clear solid was formed. First melting was observed at -45°C when a high relief mosaic
developed. No further melting events were observed until final melting at -I'C.
174
Homo genisation of the vapour bubble into the liquid phase occurred between 231°C
and 296°C.
Fluid inclusions in quartz 2: This assemblage is extremely complex. Freezing occurred
between -60 and -70 "C and a brown mosaic was formed. Heating was required in
order to induce freezing in some inclusions. Eutectic melting generally occurred
between u48 °C and -52°C. Intermediate melting events were observed at -35 "C
(coarsening (If mosaic and brown colour fading), at -27°C (merging of mosaic into
round rafts), and at -24 "C (several rafts melted). Final melting occurred over a very
wide interval (from -25°C to 12°C), but three modes were evident between -25°C and
-22 "C, between -4 "C and _2°C, and at positive values between 1.7 "C and 12°C
Homogenisation of the vapour bubble into the liquid phase in Type 1 inclusions
occurred between 142°C and 200 DC,but the: bulk of the values recorded were in the
range 160°C to 170 °C.
Fluid inclusions in quartz 3: These inclusions froze at -72 °C and developed a clear
solid. At _68°C a brown mosaic developed. First melting was observed at -54 °C and
at -26°C the mosaic began rounding into large rafts. At -24 °C the vapour bubble
sprang back and several rafts melted. Final melting values of 0.1 °C were recorded for
most of the inclusions, but some fluid inclusions melted at -1.2 "C and 8 "C.
Homogenisation occurred between 126°C and 12rC.
Fluid inclusions in quartz 4: These inclusions froze on heating at -70°C and became
slightly discoloured. Since the inclusions were so small, no mosaic or melting
behaviour could be recorded with confidence. Values of melting events at -37 °C and
-40°C were recorded but their significance is uncertain. Homogenisation of the small
vapour bubbles occurred between 78 °C and 85°C.
175
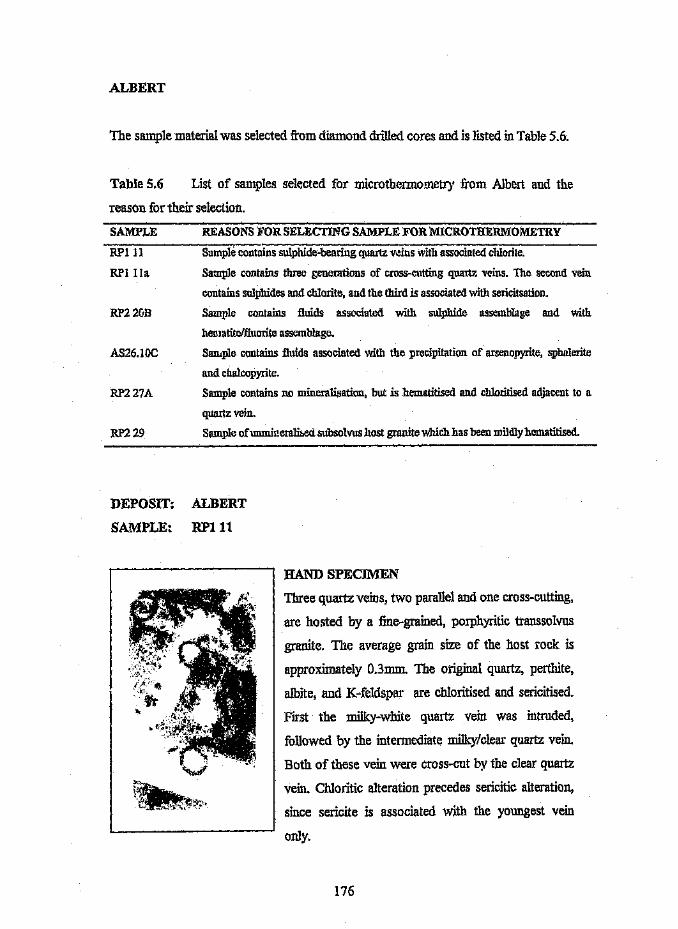
ALBERT
The sample material was selected from diamond drilled cores and is listed in Table 5.6.
Table 5.6 List of samples selected for microthermometry from Albert and the
reason for their selection.
SAMPLE REASONS FOR SELECTING SAMPLE FOR MICROTHER..l\10METRY
Sample contains sulphide-bearing quartz veins with associated chlorite.
Sample contains three generations of cross-cutting quartz veins. The second vein
contains sulphides and chlorite, and the third is associated with sericitsation.
Sample contains fluids associated with sulphide assemblage and with
hematite/fluorite assemblage.
AS26.l0C Sample contains fluids associated with the precipitation of arsenopyrite, sphalerite
and chalcopyrite.
RPlll
RPllla
RP22GB
RP227A Sample contains no mineralisation, but is hematitised and chloritised adjacent to a
quartz vein.
RP229 Sample of'unmineralised subsolvus host granite which has been mildly hematitised.
DEPOSIT: ALBERT
SAMPLE: RPll1
HAND SPECIMEN
Three quartz veins, two parallel and one cross-cutting,
are hosted by a fine-grained, porphyritic transsolvus
granite. The average grain size of the host rock is
approximately O.3mrn. The original quartz, perthite,
albite, and Kfeldspar are chloritised and sericitised.
First the milky-white quartz vein was intruded,
followed by the intermediate milky/clear quartz vein.
Both of these vein were cross-cut by the clear quartz
vein. Chloritic alteration precedes sericitic alteration,
since sericite is associated with the youngest vein
only.
176
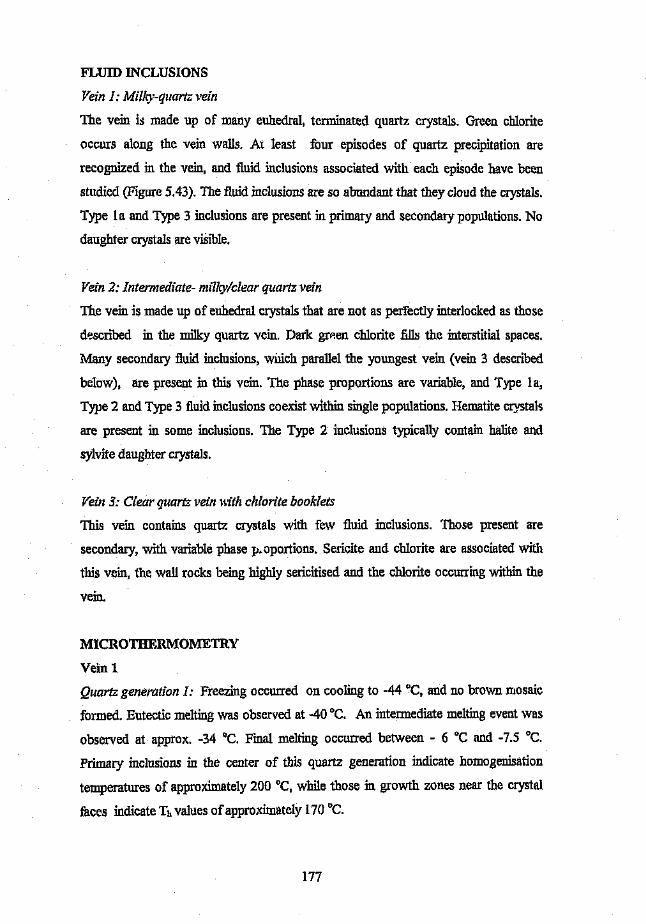
FLUID INCLUSIONS
Vein 1..Milky-quartz vein
The vein is made up of many euhedral, terminated quartz crystals. Green chlorite
occurs along the vein walls. Ai least four episodes of quartz precipitation are
recognized in the vein, and fluid inclusions associated with each episode have been
studied (Figure 5.43). The fluid inclusions are so abundant that they cloud the crystals.
Type 1a and Type 3 inclusions are present in primary and secondary populations. No
daughter crystals are visible.
Vein 2: Intermediate- milky/clear quartz vein
The vein is made up of euhedral crystals that are not as perfectly interlocked as those
described in the milky quartz vein. Dark green chlorite fills the interstitial spaces.
Many secondary fluid inclusions, wnich parallel the youngest vein (vein 3 described
below), are present in this vein. The phase proportions are variable, and Type 1a,
Type 2 and Type 3 fluid inclusions coexist within single populations. Hematite crystals
are present in some inclusions. The Type 2 inclusions typically contain halite and
sylvite daughter crystals.
Vein 3: Clear quartz vein l~ith chlorite booklets
This vein contains quartz crystals with few fluid inclusions. Those present are
secondary, with variable phase p.oportions. Sericite and chlorite are associated with
this vein, the wall rocks being highly sericitised and the chlorite occurring within the
vein.
MICROTHERMOMETRY
VeIn 1
Quartz generation 1: Freezing occurred on cooling to -44°C, and no brown mosaic
formed. Eutectic melting was observed at -40 DC. An intermediate melting event was
observed at approx. -34°C. Final melting occurred between - 6 DC and -7.5 DC.
Primary inclusions in the center of this quartz generation indicate homogenisation
temperatures of approximately 200 DC,while those in growth zones near the crystal
faces indicate Th values of approximately 170 DC.
177
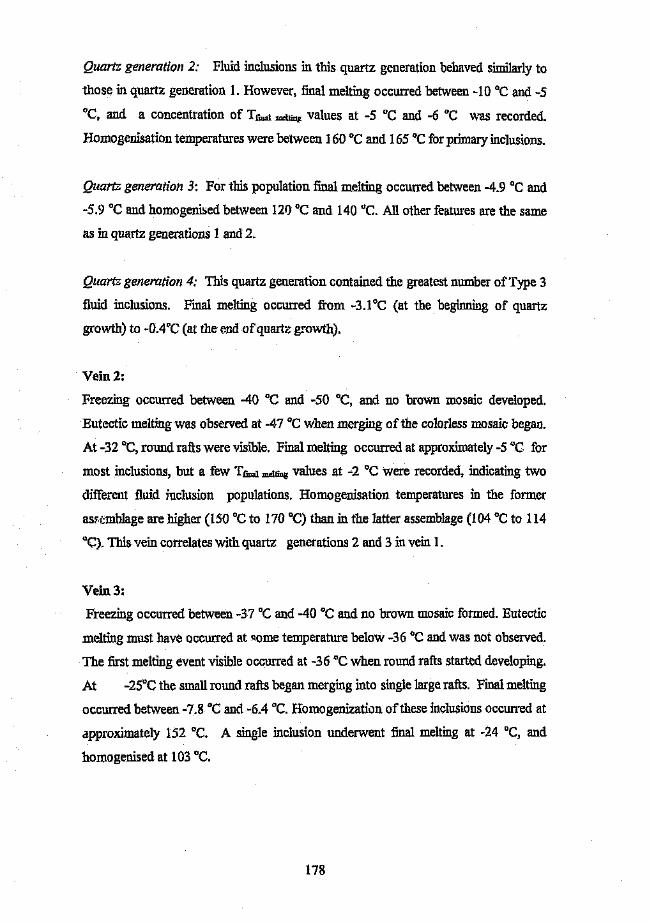
Quartz generation 2: Fluid inclusions in this quartz generation behaved similarly to
those in quartz generation 1. However, final melting occurred between -10°C and-5
"C, and. a concentration of Tfinalmelting values at _5°C and -6 °C was recorded.
Homogenisation temperatures were between 160°C and 165 "C for primary inclusions.
Quartz generation 3: For this population final melting occurred between -4.9 "C and
-5.9 "C and homogenised between 120°C and 140 °C. All other features are the same
as in quartz generations 1 and 2.
Quartz generation 4: This quartz generation contained the greatest number of Type 3
fluid inclusions. Final melting occurred from -3.1 °e (at the beginning of quartz
growth) to -O.4"C (at the end of'quartz growth).
Vein 2:
Freezing occurred between -40°C and -50 "C, and no brown mosaic developed.
Eutectic melting was observed at -47 "C When merging of the colorless mosaic began.
At -32°C, round rafts were visible. Final melting occurred at approximately -5 "C for
most inclusions, but a few Tfinal melting values at _2°C were recorded, indicating two
different fluid inclusion populations. Homogenisation temperatures in the former
assemblage are higher (150°C to 170°C) than in the latter assemblage (104 °C to 114
Qq. This vein correlates with quartz generations 2 and 3 in vein 1.
Vein 3:
Freezing occurred between -37°C and -40 "C and no brown mosaic formed. Eutectic
melting must have occurred at some temperature below -36°C and was not observed.
The first melting event visible occurred at -36 °C when round rafts started developing.
At -2SoC the small round rafts began merging into single large rafts. Final melting
occurred between -7.8 "C and -6.4 "C. Homogenization of these inclusions occurred at
approximately 152 "C. A single inclusion underwent final melting at -24 "C, and
homogenised at 103 DC.
178
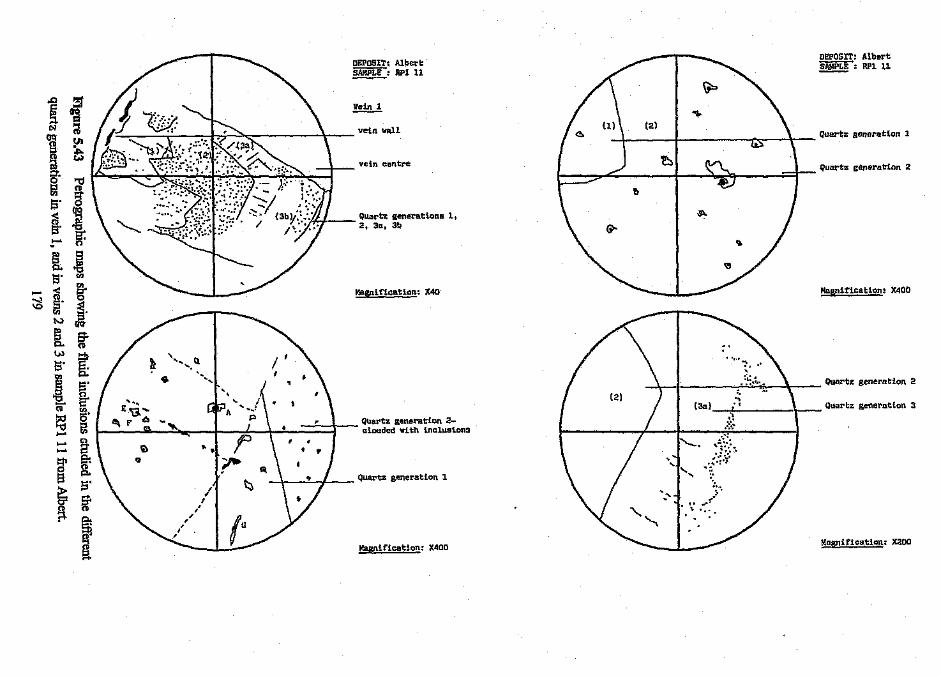
...0
~N
C§g~.0E:lS·<S·,_.&S·<
- Cl>~ ~.N
~0.0JS·r.n
ICl>
~.....
:!'J~~Ul
t;
DEPOSIT: Al"e~tSAMPLE: RPl 11
._ - ..._ \_ ...t-; ...."" ' vein wall. \
~
..........
>-t1(1)
3~"CIe:()
~enr.ng~s·!JQ
g-~ (: h ' <, ,0. . "r::> 4',~ ,o ,~ ' ..;!l. £~i'" J;Ag ~ F ~ ~ ...
C18" \ 10 ...~(1)0. \ ).S· ~g- ~
I,,0. ,.-~(1)....~
DEPOSIT: AlbertSAMPLE: RPI 11
vein centre
1 I . , Quart:< generation 1I loS \
Quartz generations 1;2. aa, 3b
Magnification! X40
Magnification: X400
Quartz generation 2
Magnif"icati<>n: X40a
".\ I ':'.':':"'i, \ Quartz generation 2
Quartz gene~ation 2-I e~. I I \ • I clouded with inclusions'" n-. i
(3n) ;"; l Quartz generation 3" r--.~."..:':,....
8's~?
_\ I ..Quartz generation 1
c-
.j.:D··.'.'.''." ....
" "-.
'.....
MORniflcatlon: X200

00 0N 0>< '"........ :K
.......
~I.,
i.0 ~I....a. .,<a: '".,"
.~ii'~l ... N >.. "" '"il.., '" M' ... ... ..."'-' ... E ~I d ., ...
~I! d " " ". "::1 e 0' ECY '" to: ~
.0
M
C00... 0 0.., ~ ~'".... .......... III
~ ~
" .... C.0 .,....... CO<g;:
" N.... "
IIII....
N .!!...
il e il N .., ..."
.., ... 0(3 .. " ....
" " s::> "" u(3
Figure 5.43 continued Petrographic maps showing the fluid inclusions studied
in the different quartz generations in vein 1, and in veins 2 and 3 in sample RPl 11
from Albert. 180
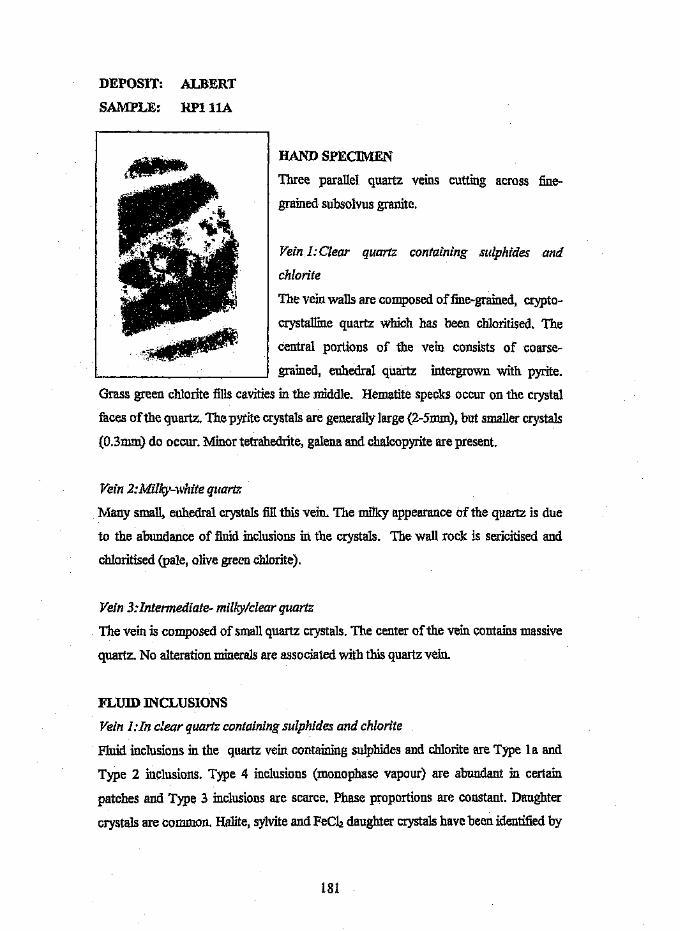
DEPOSIT: ALBERT
SAMPLE: RPI11A
HAND SPECIMEN
Three parallel quartz veins cutting across fine-
grained subsolvus granite.
Vein 1:Clear quartz containing sulphides and
chlorite
The vein walls are composed of fine-grained, crypto-
crystalline quartz which has been chloritised. The
central portions of the vein. consists of coarse-
grained, euhedral quartz intergrown with pyrite.
Grass green chlorite fills cavities in the middle. Hematite specks occur on the crystal
faces of the quartz. The pyrite crystals are generally large (2-5mm), but smaller crystals
(O.3mm) do occur. Minor tetrahedrite, galena and chalcopyrite are present.
Vein 2:Milky-,vhite quartz;
Many small, euhedral crystals fill this vein. The milky appearance of the quartz is due
to the abundance of fluid inclusions in the crystals. The wall rock is sericitised and
chloritised (pale, olive green chlorite).
Vein 3:Intemlediate- milky/clear quartz
The vein is composed of small quartz crystals. The center of the vein contains massive
quartz. No alteration minerals are associated with this quartz vein.
FLUID lNCLUSIONS
Vein 1:In clear quartz containing sulphides and chlorite
Fluid inclusions in the quartz vein containing sulphides and chlorite are Type 1a and
Type 2 inclusions. Type 4 inclusions (monophase vapour) are abundant in certain
patches and Type 3 inclusions are scarce. Phase proportions are constant. Daughter
crystals are common. Halite, sylvite and FeCh daughter crystals have been identified by
181

optical methods. Daughter crystals are rarely vary large, filling more than 50% of the
inclusion volume.
Vein 2:Milky-}}'hite quartz
Fluid inclusions are irregular and many dark solids (hematite'?) cloud the clarity of the
crystals. Most inclusions are Type 1a inclusions.
Vl?in3:Intermediate- milky/clear quartz
Type 1 and Type 3 fluid inclusions are present. Phase proportions are generally
variable. Secondary trails with constant phase proportions do occur.
MICROTHERMOMETRY
Vein 1:In clear quartz containing sulphides and chlorite
Fluid inclusions in this sample are extremely complex. Itwas not possible to categorize
them according to their microthermometric behavior and they have been grouped as
one assemblage with highly variable compositions. This variability may be the result of
fluids associated with veins 2 and 3 being trapped as secondary inclusions within
primary populations of inclusions associated with vein 1.
All fluid inclusions froze at temperatures between -50°C and -82 °C, and developed a
brown mosaic. Eutectic melting was observed at a number of different temperatures,
ranging from -52 "C to -44°C. The majority of values recorded were at approximately
-44°C, hut a group of values between -39 "C and _36°C were also recorded. This
temperature range corresponds to an intermediate melting event in inclusions in which
eutectic melting was observed from -52 "C to -44°C. Intermediate melting events were
observed at -36 "C and -23 "C ill both primary and secondary populations. At -36°C
coarsening of the mosaic was observed, whereas at -23°C rapid clearing of the mosaic
took place, and a few small round rafts remained. In some inclusions, final melting
occurred almost immediately (-22.3 "C) afterwards. Final melting of fluid inclusions
continued until 10 "C when the last inclusions underwent final melting. However,
within this continuum, many 1~1 melting values were recorded at -16°C, from -10°C
to -6°C, and from 9 "C to 13 "C, The average temperature for homogenisation of
liquid and vapour phases was 168°C, but values as low as 96°C and as high as 214°C
182
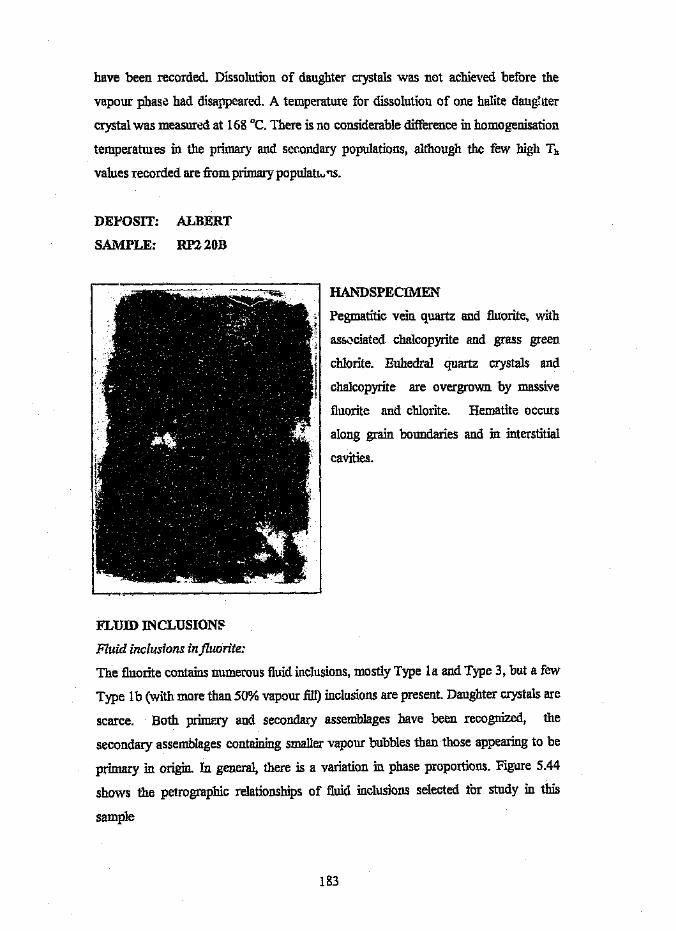
have been recorded. Dissolution of daughter crystals was not achieved before the
vapour phase had disappeared. A temperature for dissolution of one halite daughter
crystal was measured at 168 "C. There is no considerable difference in homogenisation
temperatures in the primary and secondary populations. although the few high Th
values recorded are from primary populatx.ns.
DEPOSIT: ALBERT
SAMPLE: RP220B
HANDSPECIMEN
Pegmatitic vein quartz and fluorite, with
associated chalcopyrite and grass green
chlorite. Euhedral quartz crystals and
chalcopyrite are overgrown by massive
fluorite and chlorite. Hematite occurs
along grain boundaries and in interstitial
cavities.
FLUID INCLUSION~
Fluid inclusions in fluorite:
The fluorite contains numerous fluid inclusions,mostly Type la and Type 3, but a few
Type 1b (with more than 50% vapour fill) inclusions are present. Daughter crystals are
scarce. Both prima)' and secondary assemblages have been recognized, the
secondary assemblages containing smaller vapour bubbles than those appearing to be
primary in origin. In general, there is a variation in phase proportions. Figure 5.44
shows the petrographic relationships of fluid inclusions selected tor study in this
sample
183
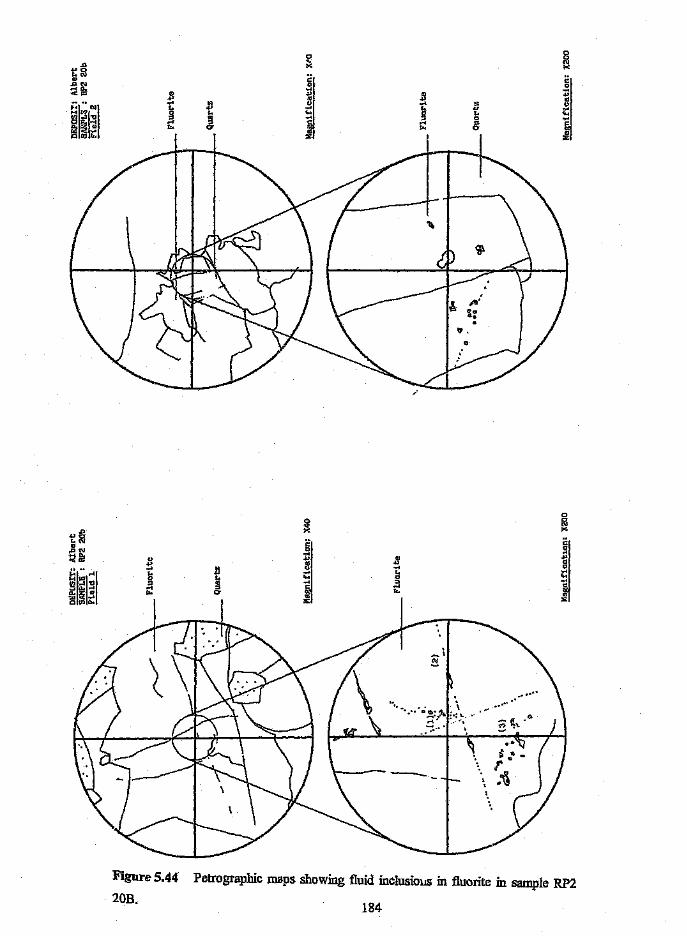
00 0
'"...x.0 ><
"'0
~I CtoN
" .!l..,N.... .,." .,"'''' " .... ......
j ... .lJ u~1~1~1... .tl t. ;;::" 0 t.0 to
~ " ...:;1 " :;1 C.... :;1". 0" eres~~ ... a
", z:,:un u.
0
".0 ><",,0
I:toN
" 0.oN .... e.... '" ..,... a: " " .......,'" !l ....
i!~I~1... .." .... :: 0a s,
":;1 e c .....-{ " '" t..... 0-"'"
..' ,;~:...,.:.\--::... \
Figure 5.44
20B.Petrographic maps showing fluid inclusious in fluorite in sample RP2
184
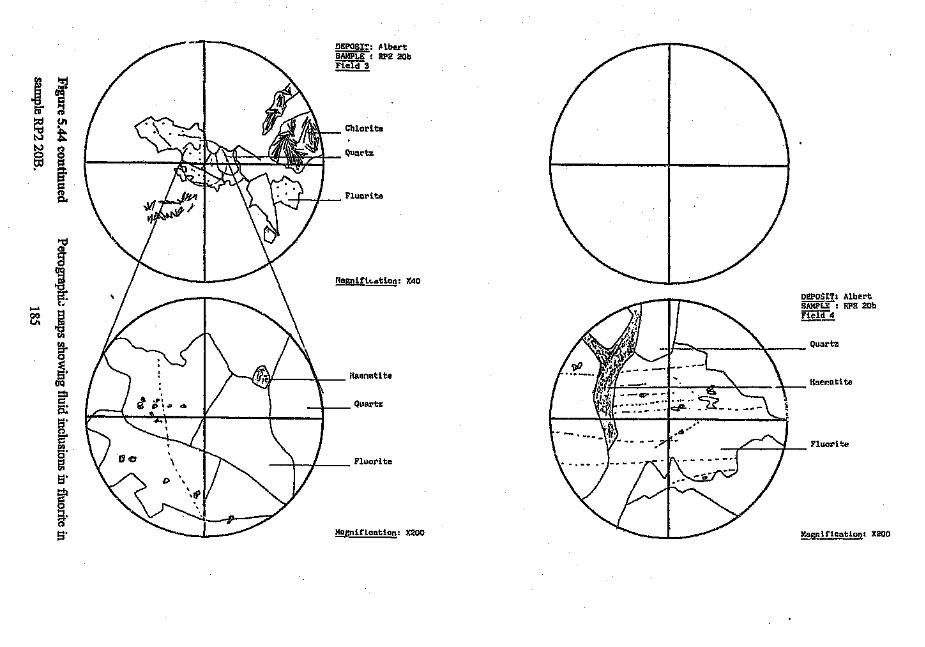
J ~crQ.
=~ "1~~
tilI ("\ ""'-;-./\J W r ':!'fJ rA~\~ Chlorite
tv ~tv t'.I I r=«. -;1';-/\:1\ :....., (II~\~""~I Quartz0 0FO =:to
==~ \ I IfrA 1 \\ \ .• t; I Fluorite~
."C1laO.!j
/~\ Hagnif~: X40.§s:~
DEPOSIT: Albertc. SiiMPi:E: RP2 20b,_.
00 ! Field 4Vt
til
til ir >: / 1\ rv. /'l.~~ ///id If--... '\. Quartz::r'0~S· I ") : I }'---{JW } Haenatite
I "..lijf __ . I'· -, \(JQ \: Haema t l te::::!l= I I rt;;;~ Q 1/ \ __I Quartza:S·o-e
\/ 00:--.zh -~-_/ \ IT'- - -_.7T- _"r- <s Fluod ~eeno·
i:l \ I FluoritetilS·::!l=0g.C1lS· ~ Magnification: X200 ~ ::!!'!W~t1on: X200
DEPOSI':: HbertSAMPLE: : RF2 20bField 3
MICROTHERMOMETRY
At least three different fluid inclusion assemblages are present in the fluorite in this
sample. At the one extreme, the assemblage with the lowest final melting temperature
range (between -16°C and -10°C) occur as primary and pseudo-secondary inclusions,
which froze between -57°C and -78 DC, and developed a brown mosaic. Eutectic
melting occurred at approximately -49°C, and the mosaic began to disintegrate. At -29
DC, the mosaic became coarser and rafts became visible. Some rafts melted at -23°C
and others at -16 DC. Final melting temperatures ranged from -16°C to -10 DC. Th for
this assemblage was between 171°C and 200 DC.
An intermediate category of fluid inclusions, which froze by -48 "C and developed a
colorless mosaic, has been observed. Eutectic melting occurred at or before -39°C.
One intermediate melting event at -30 "C was observed before final melting (at _6°C to
-8 DC). Entrapment of the fluids or' '-;d at temperatures below 200°C
(decrepitation occurred at temperatures higl.c, . 12.UO°C).
The bulk of the fluid inclusions measured belong in the category of inclusions which
underwent fmal melti';; between -4.8 "C and -3.2 DC. These fluid inclusions occ ur insecondary trails, and clearly belong to the same fluid inclusion assemblage. On
freezing, a colorless mosaic formed, which underwent eutectic melting at -33 "C, By-
27°C, the mosaic had merged to form rounded rafts, and, in general, only "ne large
round raft remained in each fluid inclusion. This raft became progressively smaller as
final melting temperatures were approached. The wide variation of final melting
temperatures within single fluid inclusions assemblages is mirrored in the measured
homogenisation temperatures, which range from 218°C and 273 DC.
At the other extreme is a fluid inclusion assemblage displaying the same characteristics
as the assemblage described immediately above, but in which final melting occurred
between -2.6 °C and -1.7 "C, and homogenisation of the liquid and vapour phases
occurred at low temperatures ( 93°C to 112 0c).
186
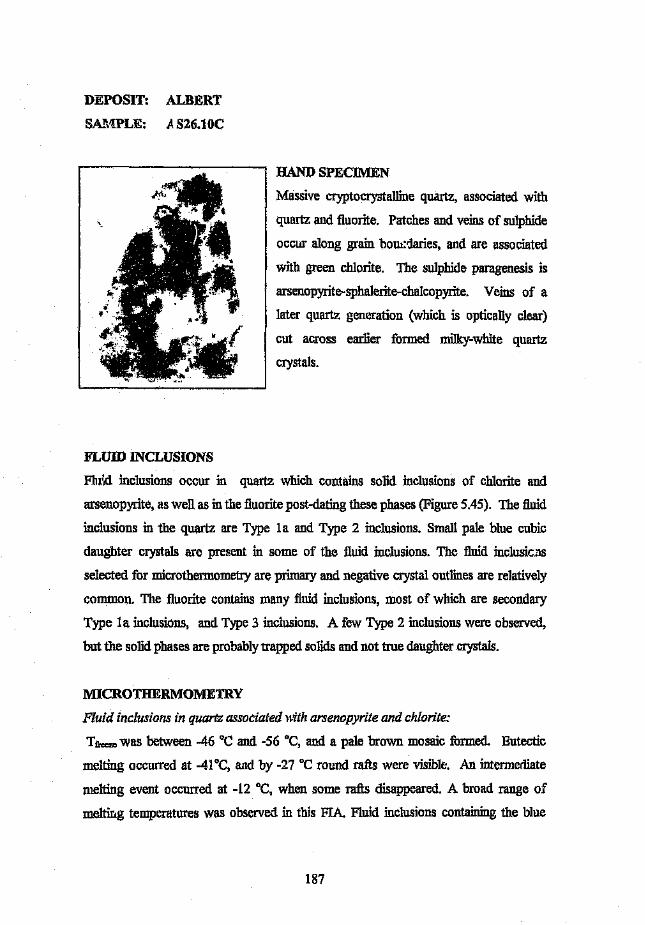
DEPOSIT: ALBERT
SA..1\'!PLE: A S26.10C
HAND SPECIMEN
Massive cryptocrystalline quartz, associated with
quartz and fluorite. Patches and veins of sulphide
occur along grain boucdaries, and are associated
with green chlorite. The sulphide paragenesis is
arsenopyrite-sphalerite-chalcopyrite. Veins of a
later quartz generation (which is optically clear)
cut across earlier formed milky-white quartz
crystals.
FLUID INCLUSIONS
Flll;,d inclusions occur in quartz which contains solid inclusions of chlorite and
arsenopyrite, as well as in the fluorite post-dating these phases (Figure 5.45). The fluid
inclusions in the quartz are Type 1a and Type 2 inclusions. Small pale blue cubic
daughter crystals are present in some of the fluid inclusions. The fluid inclusicns
selected for microthennometry are primary and negative crystal outlines are relatively
common. The fluorite contains many fluid inclusions, most of which are secondary
Type la inclusions, and Type 3 inclusions. A few Type 2 inclusionswere observed,
but the solid phases are probablytrapped solids and not true daughter crystals.
NllCROTHERMOMETRY
Fluid inclusions in quartz associated Yl-itharsenopyrite and chlorite:
Tfrcczewas between -46°C and -56 °c, and a pale brown mosaic formed. Eutectic
melting occurred at ~41°C, and by -27°C round rafts were visible. An intermediate
melting event occurred at -12°C, when some rafts disappeared. A broad range of
melting temperatures was observed in this FIA. Fluid inclusions containing the blue
187
cubes melted at ~8.8 DC, and those without daughters underwent final melting between
-4.2 "C and 0.2 DC. Homogenisation temperatures were not recorded.
Fluid inclusions in fluorite post-dating arsenopyrite and chlorite:
A population ofpossiblyprirnary Type la fluid inclusions froze to a colorless solid at
-37 DC, and underwent eutectic melting at -31°C. At -23 DC, the mosaic rapidly
disintegrated into rafts. Final melting of some inclusions began at -3.5 DC and
continued until-1.4 DC when all fluid inclusions were melted. The first inclusions to
homogenise did so at 123 DC, while the rest homogenised between 140 DC and 145 DC.
The highest temperature recorded for homogenisation in this assemblage was 243 DC.
A secondary trail of Type 3 inclusions with a few Type la (degree of vapour fill
approx, 2%) froze to a pale mosaic which darkened at _40DC (Te?). At -25 DC,
coarsening of the mosaic began, and by -/3DC, round rafts had developed. Final
melting occurred in the range -3.9 DC to 1.6 DC. Homogenisation temperatures for the
two phase inclusions were between 100 DC and 120 DC.
188
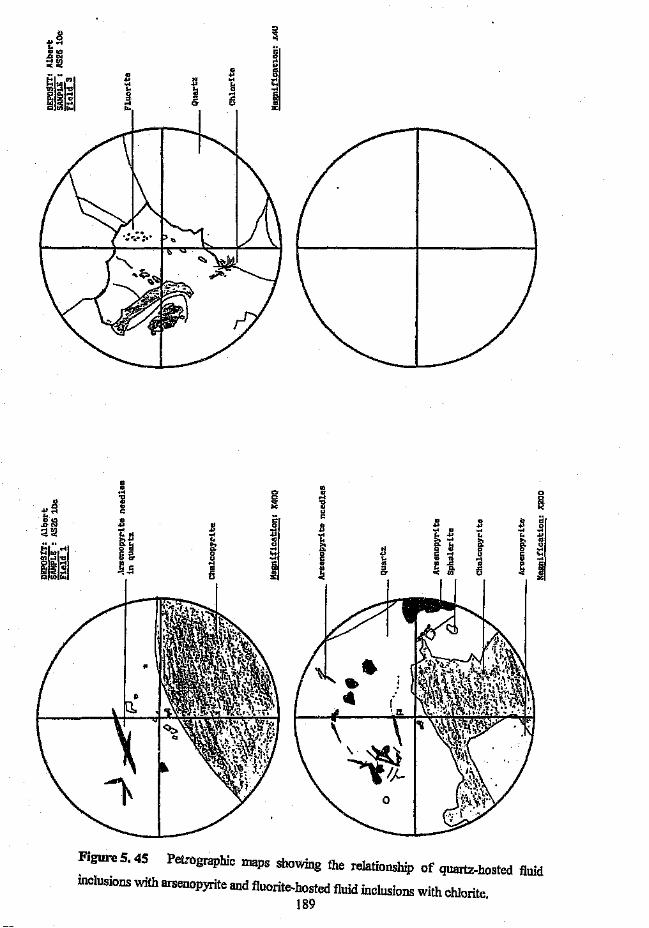
:::>
~~ :li...
j""'.oN~~ ..
" ..,
Ilil~1 N ....., .., ......... ... 0
" ....0::l .c" 0- U....
f,.,
IIIIII
00 " 0"
N
....'" ....
X
"0
~ "00 " "
~
.."
".p.~ C
~
C
" " ..,.... !!.... ..
" ... III ...."'" ..," .., ... .., ... "
.oN .... !! ...'" ... il: il:
.... '" ... " !:, Co "« "'..., !:,
" 0 " 0 0CoC .... U C""" a. ..,
"~1~1~1 o " 0
" III ....0C " II) s: III "
C"U
aI ..II> C' .... e:J <- o, .c
""II)
II)< rn u
;..: c:: es" 0-s:""
...-: ..,...u
Figure 5. 45Petrographic maps showing the relationship of quartz-hosted fluid
inclusions with arsenopyrite and fluorite-hosted fluid inclusions with chlorite.189
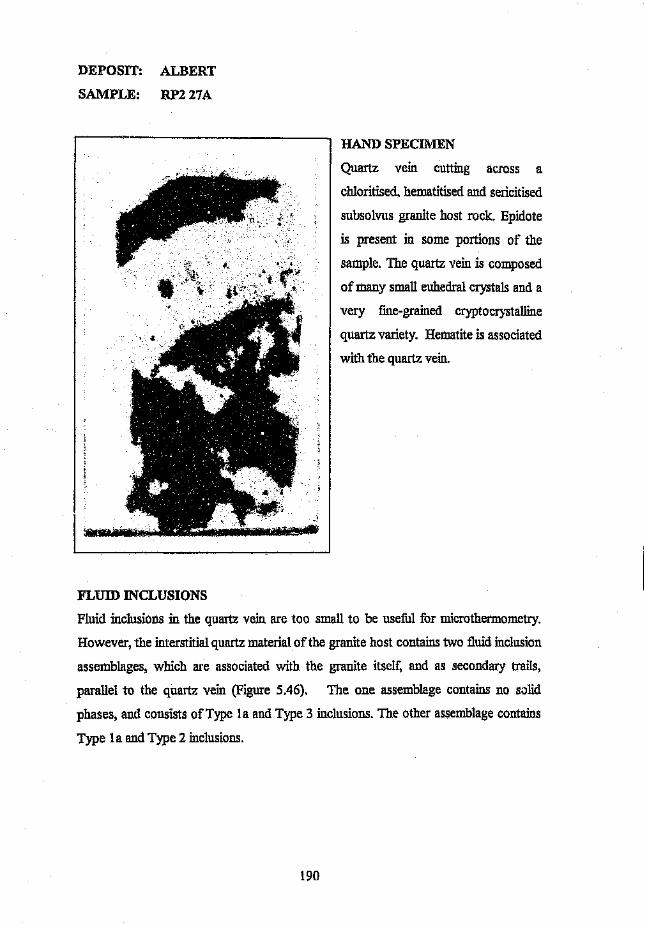
DEPOSIT: ALBERT
SAMPLE: RP227A
HAND SPECIMEN
Quartz vein cutting across a
chloritised, hematitised and sericitised
subsolvus granite host rock. Epidote
is present in some portions of the
sample. The quartz vein is composed
of many small euhedral crystals and a
very fine-grained cryptocrystalline
quartz variety. Hematite is associated
with the quartz vein.
FLUID lNCLUSIONS
Fluid inclusions in the quartz vein are too small to be useful for microthermometry,
However, the interstitial quartz material of the granite host contains two fluid inclusion
assemblages, which are associated with the granite itself, and as secondary trails,
paraliel to the quartz vein (Figure 5.46), The one assemblage contains no solid
phases, and consists of Type la and Type 3 inclusions. The other assemblage contains
Type 1a and Type 2 inclusions.
190

000 ~.., .. ~......
~ ~
.. '"D
.... '""'~ .. ..~I~
..,..,
i\......
" " j;j.., ..,d ., .. EE ... .. "" '" :::s '"r) :::s ::;: 0- :::: 0'
.c..,...ll<
0..0 @'"c. ;;: ><'" II!
+J.t--- '0
~
t"l ....
~
e..,'" ........ 0.. -e"'''' '" ....
!! ",,,, " ...~1~1;1 ...... ...,
N !:.., N 4' .., ...as ...,
o '"..., .... c::E ... '0 E '" ..
"~~!! " III ... ., Iii :;1 ~'" :;1 Coni ,:; 0-QUI'" :: 0' w,c ::
Figure 5. 46 Petrographic maps of interstitial quartz containing numerous cross-
cutting secondary trails of inclusions,191
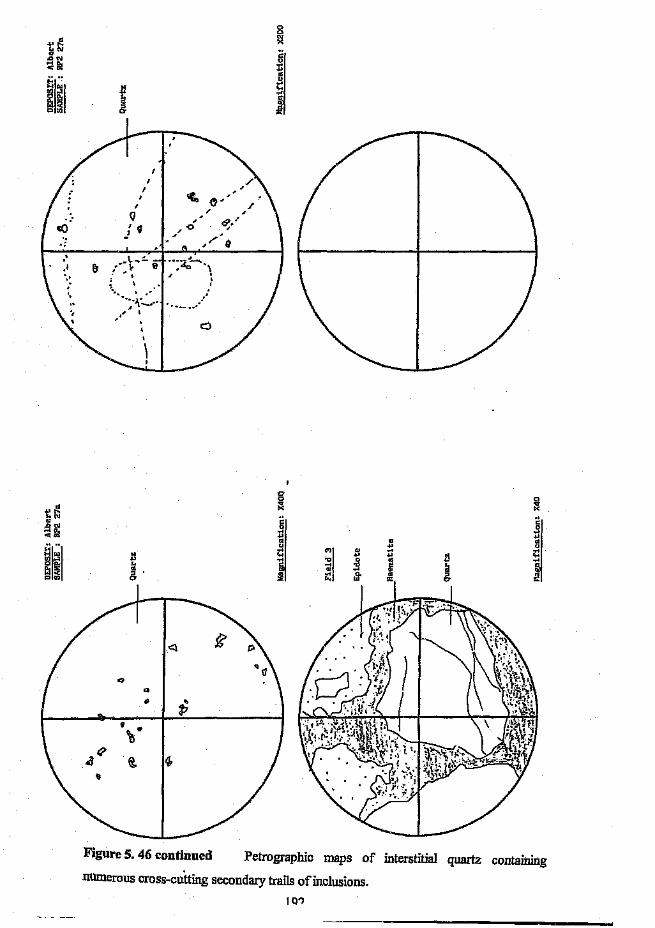
00
'"as x........!.o",
~
e.0'":iii!
ilil ......!.oQ:>0-
II
"t,I ~'I /Q .'-: , ~/I Q ,'0
.J .-/', (I
"
---\-~~.. -. .\
",.>J,'__" ..-..... _ ....."
~.:~.~~,I,
000'<T'<TXas X.......i:.. '" e" 0 0.0'" ........ '" ....+><0: +>
" '"'" .!:{Illlu
II> ;:..... .... ... " ...." ~ 0 II! ., ......,& 'C e r.. e" .... " " '"'" '" c. '" " '"" '" '" :t: <::; '"a
Q
<II
{} "P1/~ ..~ tJ.
'8
Figure 5.46 continued Petrographic maps of interstitial quartz containing
numerous cross-cutting secondary trails of inclusions.lQ")

MICRO THERMOMETRY
Two distinct fluid inclusion assemblages are recognizable in terms of their
microthermometric behavior. They are distinguished by the different ranges of freezing
temperatures and the presence or absence of a brown mosaic.
The assemblage that showed no brown discoloration of the mosaic on freezing
(between -44 DCand -48 DC), underwent eutectic melting at approximately -40 DC
and is present as primary and secondary inclusions. Intermediate melting events were
observed at -34"C when the coarsened mosaic merged to form larger rafts. At -21°C
and -16 °C several rafts in each inclusion melted. The ice melted over a broad
temperature range (-4.4 "C to 4.3°C). Eutectic and intermediate melting events were
not visible in some fluid inclusions. At fmal melting, the vapour bubble sprang back
and solids disappeared simultaneously. Th values were between 128 "C and 173 "C.
The second fluid inclusion assemblage contains several daughter crystals (FeCh, halite
and sylvite) and developed a very pronounced brown mosaic on freezing, which took
place at considerably lower temperatures (-66 DCto -75°C) than the first assemblage
described. Eutectic melting occurs between -50 °C and -52°C. Intermediate melting
events were observed at -40 °C when the mosaic became coarser, at -33°C, at -28 °C
when the mosaic merged to form rafts, and at -24 "C when several rafts melted. Final
melting occurred over a wide range of temperatures (-4.8 DC to 15°C). However, two
modes of vaiues are apparent, one between _4°C and -~ DC, and the other, at the
unusually high range from 8.6 DCto 15.3 "C. Homogenisation occurred between 76°C
and 160°C, but the majority of fluid inclusions homogenised at approximately 130°C.
Dissolution of daughter crystals did not occur before homogenisation of the vapour
bubble into the liquid phase.
193
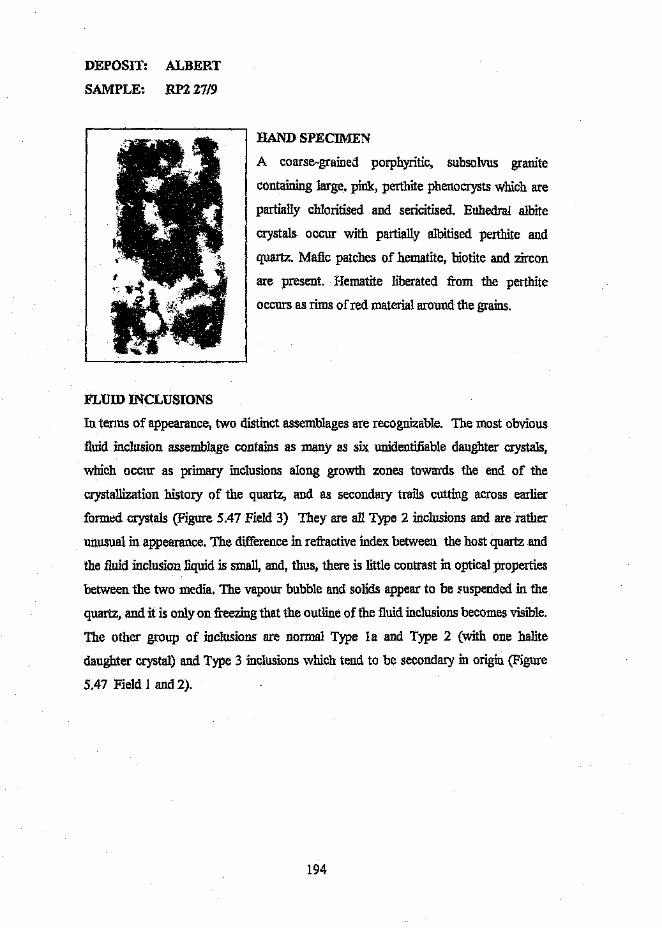
DEPOSIT: ALBERT
SAlVIPLE: RP227/9
FLUID INCLUSIONS
HAND SPECIMEN
A coarse-grained porphyritic, subsolvus granite
containing large. pink, perthite phenocrysts which are
partially chloritised and sericitised. Euhedral albite
crystals occur with partially albitised perthite and
quartz. Mafic patches of hematite, biotite and zircon
are present. Hematite liberated from the perthite
occurs as rims of red material around the grains.
In terms of appearance, two distinct assemblages are recognizable. The most obvious
fluid inclusion assemblage contains as many IlS six unidentifiable daughter crystals,
which occur as primary inclusions along growth zones towards the end of the
crystallization history of the quartz, and as secondary trails cutting across earlier
formed crystals (Figure 5.47 Field 3) They are all Type 2 inclusions and are rather
unusual in appearance. The difference in refractive index between the host quartz and
the fluid inclusion liquid is small, and, thus, there is little contrast in optical properties
between the two media. The vapour bubble and solids appear to be suspended in the
quartz, and it is only on freezing that the outline of the fluid inclusions becomes visible.
The other group of inclusions are normal Type la and Type 2 (with one halite
daughter crystal) and Type 3 inclusions which tend to be secondary in origin (Figure
5.47 Field 1 and 2).
194

MICROTHERMOl\1ETRY
Four FIA's have emerged from the micro thermometric data. Two groups exist within
the daughter-rich assemblage which are distinctly different from the Typel a fluid
inclusions in tenus of microthermometric behavior. The Type 1a inclusions are
separated into three categories depending on their final melting temperatures.
The daughter-rich assemblage froze at temperatures between -63 "C and -72 "C, and a
slight brown discoloration of the mosaic was visible. These inclusions are among the
few that require heating after super-cooling to induce freezing. At -66°C the brown
mosaic developed, and rearrangement took place at -59"C, after which the brown
began to fade. Eutectic melting was not recorded. Intermediate melting events were
observed at -40°C, when the mosaic started merging, and at -3 l "C when round rafts
developed. Final melting of some inclusions occurred at -24.5 "C and -18.1"C. These
inclusions are associated with another group that generally have final melting
tempers tures above 0 "C. In fact most of these Type 2 inclusions melted completely
between 3.7 "C and 9.2 "C. Homogenisation temperatures were relatively high ( >225
"c), and the solid phases tended to resist melting. Dissolution temperatures (180°C to
184°C) were recorded for an unidentifiable solid phase.
Microthermometric behavior in the Type 1a assemblage was relatively constant except
for the final melting temperatures. They all froze at -63 "C, developed no brown
mosaic and underwent eutectic melting between -46 "C and -48 "C. Intermediate
melting events occurred at -45 "C, when coarsening occurred, at -36°C when round
rafts developed, and at -30 "C and -24 "C when several rafts disappeared. Three
different secondary trails each with different fmal melting temperatures were measured.
One group melted between -15°C and -11 "C, another at approximately -10 "C, and the
last between -8 "C and _5°C. However, it is clear that these measurements form part of
a continuum from -5 "C to -15°C. The corresponding ranges of homogenisation
temperatures are 130°C to 147 "C, 155°C and 190 °C to 200°C.
195
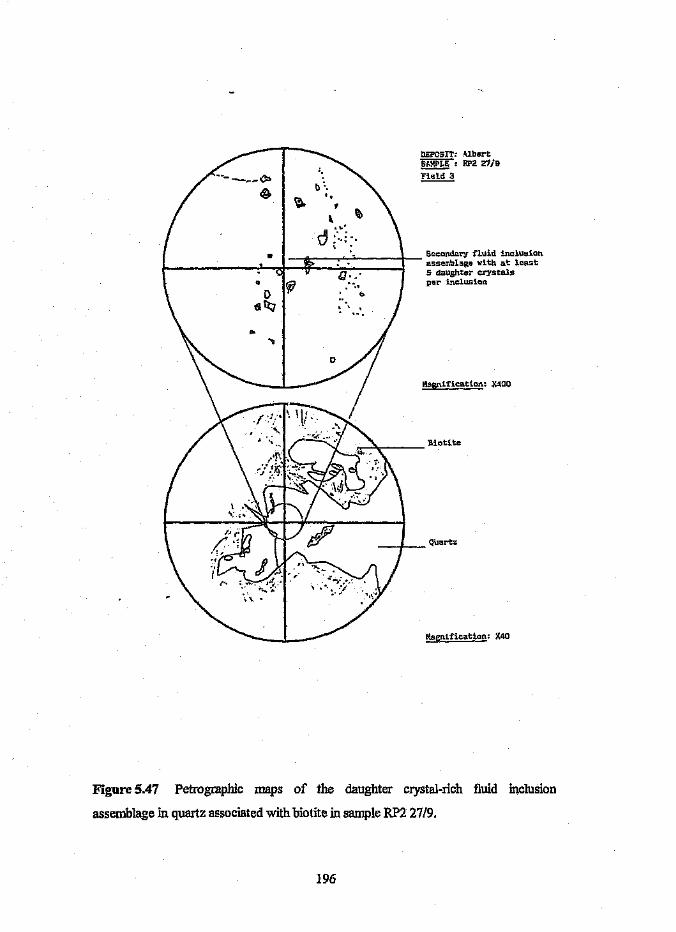
---- __ <l»
~
nEPOSIT: ~lbert§A.'!PLE : RP2 21/9
~
•
~!agnification: :)(400
Hagnification: X40
Figure 5.47 Petrographic maps of the daughter crystal-rich fluid inclusion
assemblage in quartz associated with biotite in sample RP2 27/9.
196
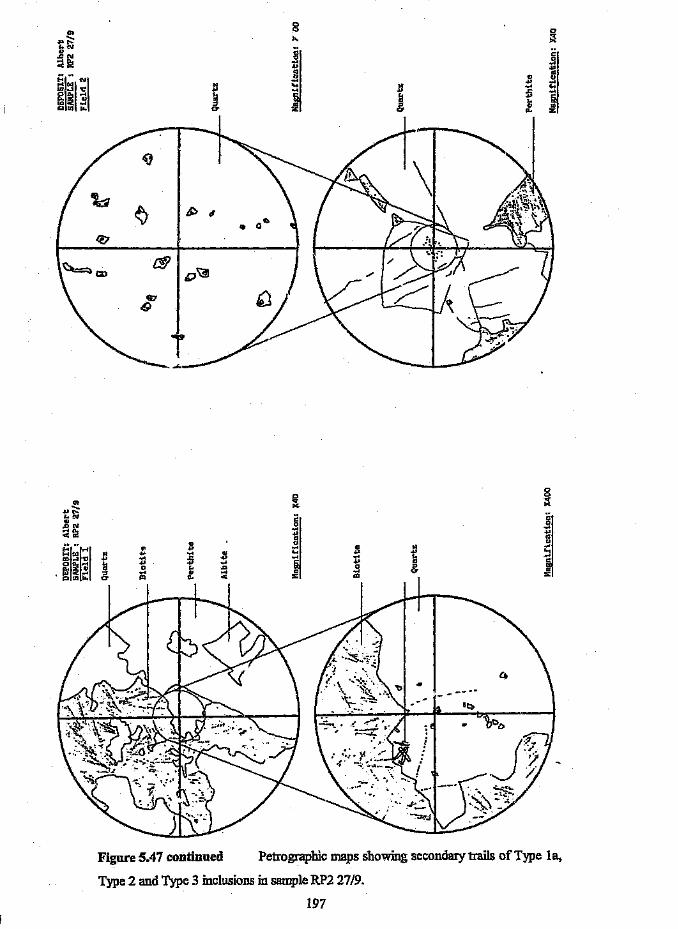
00...
N
~....~:lo-
~
\:;r~
If;> d .. Q""
Q7
tPQ'if!J
~61
o.~X
00 0
en ". ~--. X.......... '" i ~
e.oN....n...;'"
.;;.1
"
.~Iil~l .. II N !lN .... " ;: .... ........ ... ;: .. ...~ .... .... ., "0 .D 0 :>
":l ..... ... .... o-o- '" < ttl :E
Figure 5.47 continued Petrographic maps showing secondary trails of Type Ia,
Type 2 and Type 3 inclusions in sample RP2 27/9.
197
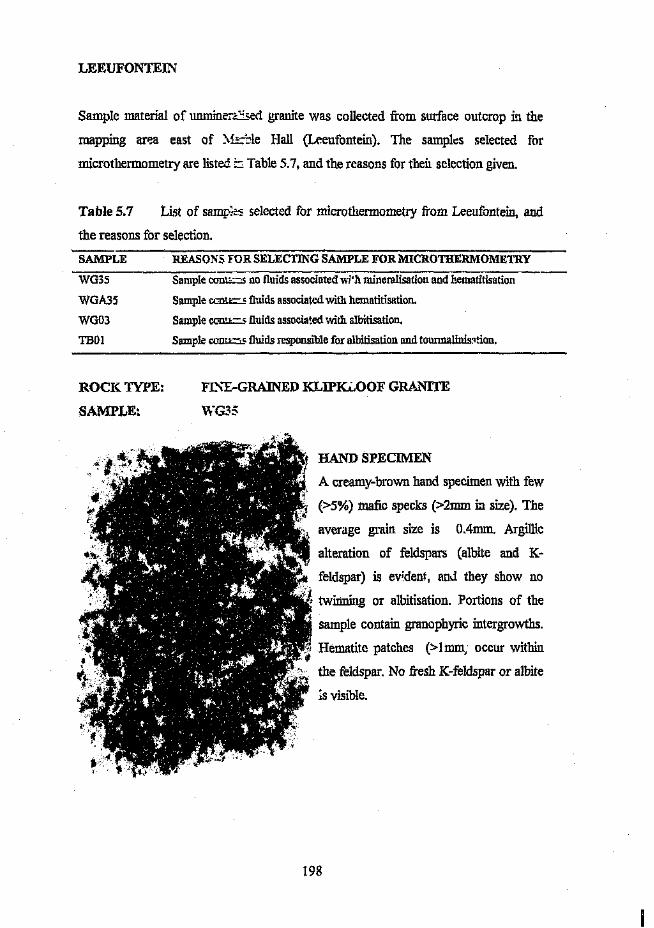
LEEUFONTEIN
Sample material of unmineraased granite was collected from surface outcrop L'1 themapping area east of :\f=:.-ble Hall (Leeufontein). The samples selected for
micro thermometry are listed t:. Table 5.7, and the reasons for then selection given.
Table 5.7 List of samples selected for micro thermometry from Leeufontein, and
the reasons for selection.
SAl\-:IPLE REASONSfOR SELECTING SAMPLE FOR MICROTHERMOMETRY
WG35 Sample ccmzzs no fluids associated wr'h mineralisation and hematitisation
WGA35 Sample ccnnz ..s fluids associated with hematitisation.
WG03 Sample conU:=s fluids associated with albitisation.
TBOI Sample com ,-, < fluids responsible for albitisation and tounnalinisstion,
ROCK TYPE: ~'-E-GRAlNED KLIPKl"QOF GlV..NITE
SAMPLE: WG3S
HAND SPECIMEN
A creamy-brown hand specimen with few
(>5%) mafic specks (>2mm in size). The
average grain size is O.4mm. Argillic
alteration of feldspars (albite and K-
feldspar) is evident, and they show no
twinning or albitisation. Portions of the
sample contain granophyric intergrowths.
Hematite patches (>1rom, occur within
the feldspar. No fresh K-feldspar or albite
is visible.
198
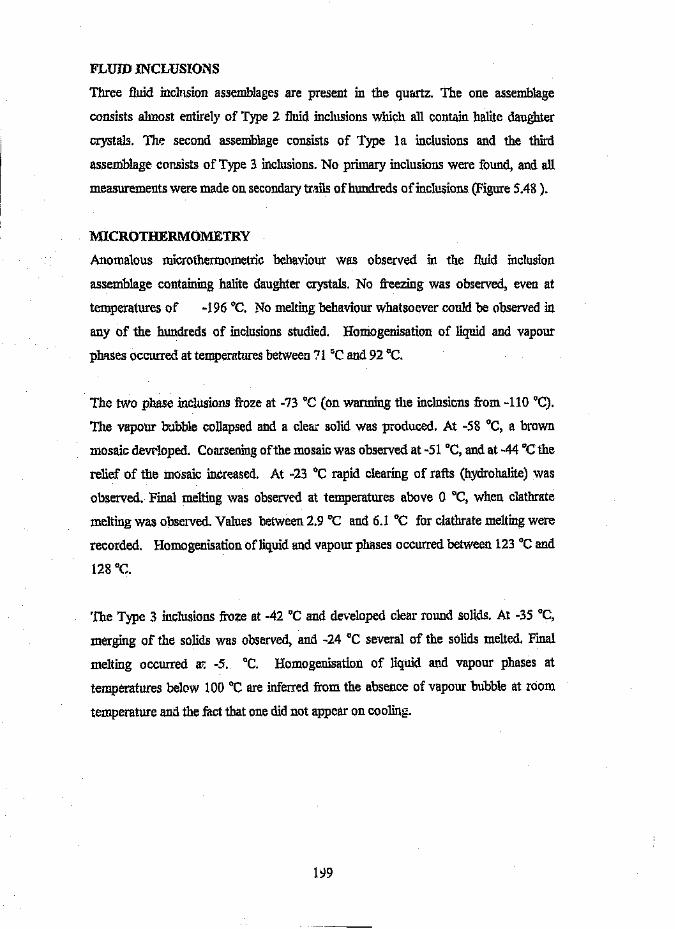
FLUID INCLUSIONS
Three fluid inclusion assemblages are present in the quartz. The one assemblage
consists almost entirely of Type 2 fluid inclusions which all contain halite daughter
crystals. The second assemblage consists of Type l a inclusions and the third
assemblage consists of Type 3 inclusions.NO'primary inclusions were found, and all
measurements were made on secondaryWillsof hundreds of inclusions (Figure 5.48 ).
MICROTIlERMOMETRY
Anomalous microthermometric behaviour was observed in the fluid inclusion
assemblage containing halite daughter crystals. No freezing was observed, even at
temperatures of -196 "C. No melting behaviour whatsoever could be observed in
any of the hundreds of inclusions studied. Homogenisation of liquid and vapour
phases occurred at temperatures between 71 ~Cand 92 "C.
The two phase inclusions froze at -73°C (on warming the inclusions from -110 DC).
The vapour bubble collapsed and a clear solid was produced. At -58°C, a brown
mosaic developed, Coarsening of the mosaic was observed at -51 "C, and at -44°C the
relief of the mosaic increased. At -23 DCrapid clearing of rafts (hydrohalite) was
observed. Final melting was observed at temperatures above 0 DC,when clathrate
melting was observed. Values between 2.9 "C and 6..1 "C for clathrate meltingwere
recorded. Homogenisation of liquid and vapour phases occurred between 123 "C and
128 aC.
The Type 3 inclusions froze at -42°C and developed clear round solids. At -35 DC,
merging of the solids was observed, and -24 "C several of the solids melted. Final
melting occurred at -5. DC. Homogenisation of liquid and vapour phases at
temperatures below 100 DCare inferred from the absence of vapour bubble at room
temperature and the fact that one did not appear on cooling.
1')9
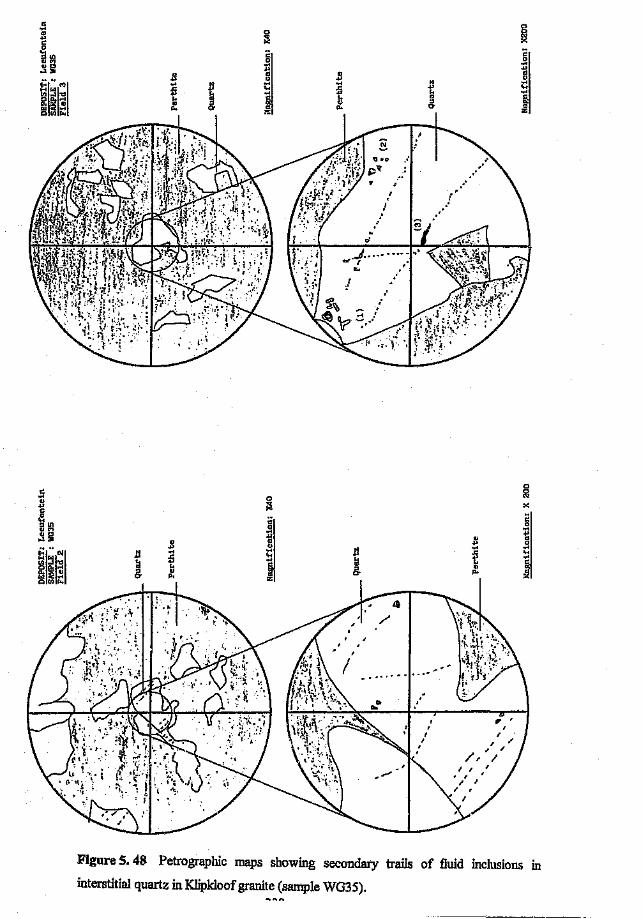
Ilil~1
00 0
N~ ><C ".s .!l..,....
" d" d ~.... ~ ..,".... " .... .., ...s: ..., :::: J: ... ......,..., ... ... '" e... ., c" '"" " m " 0 ea. 0 a.
'"
00eC\I... 0><" ~....c
1e
~
"Ill"M"""... ", " ...,...
il~ljl :!:: " .t:l:l .... .... .....t: ... ... cil ...'" "..." a. '"" " 0- A0 a. :;;:
Figure 5. 48 Petrographic maps showing secondary trails of fluid inclusions in
interstitial quartz inKlipkloof granite (sample WG35).
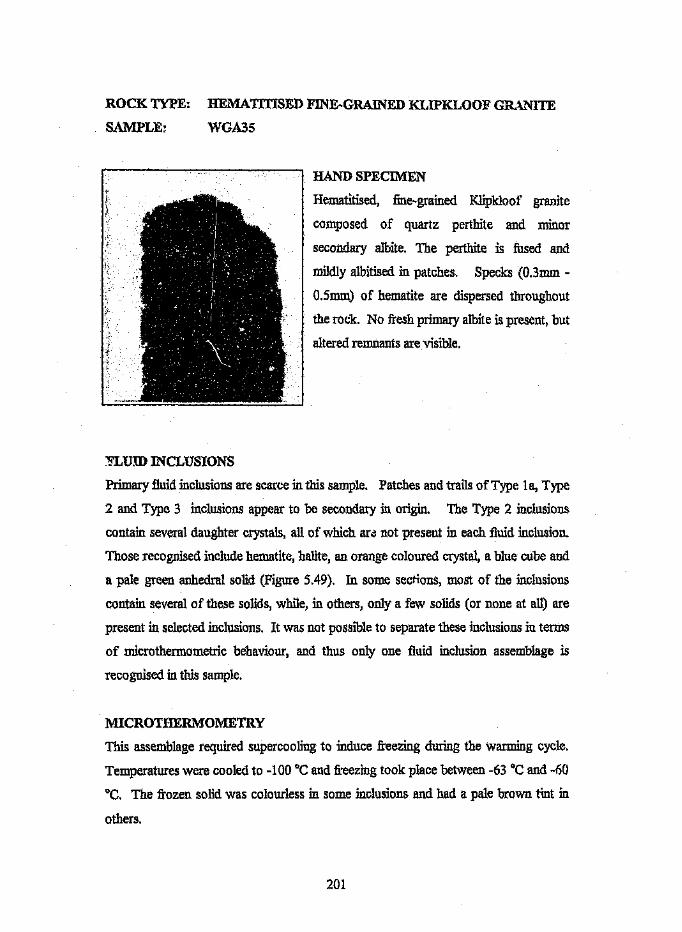
ROCK TYPE: HEMATITISEl) FINE-GRAINED KLIPKLOOF GR\..c~ITE
SAMPLE: WGA35
HAND SPECIMEN
Hematitised, fine-grained Klipkloof granite
composed of quartz pertbite and minor
secondary albite. The perthite is fused and
mildly albitised in patches. Specks (0.3mm -
O.5mm) of hematite are dispersed throughout
the rock. No fresh primary albite is present, but
altered remnants are visible.
FLUID INCLUSIONS
Primary fluid inclusions are scarce in this sample. Patches and trails of Type l a, Type
2 and Type 3 inclusions appear to be secondary in origin. The Type 2 inclusions
contain several daughter crystals, all of which are not present in each fluid inclusion.
Those recognised include hematite, halite, an orange coloured crystal, a blue cube and
a pale green anhedral solid (Figure 5.49). In some sections, most of the inclusions
contain several of these solids, while, in others, only a few solids (or none at all) are
present in selected inclusions. It was not possible to separate these inclusions in terms
of microthermometric behaviour, and thus only one fluid inclusion assemblage is
recognised in this sample.
MICROTHERMOMETRY
This assemblage required supercooling to induce freezing during the warming cycle.
Temperatures were cooled to -100°C and freezing took place between -63°C and -60
"C. The frozen solid was colourless in some inclusions and had a pale brown tint in
others.
201
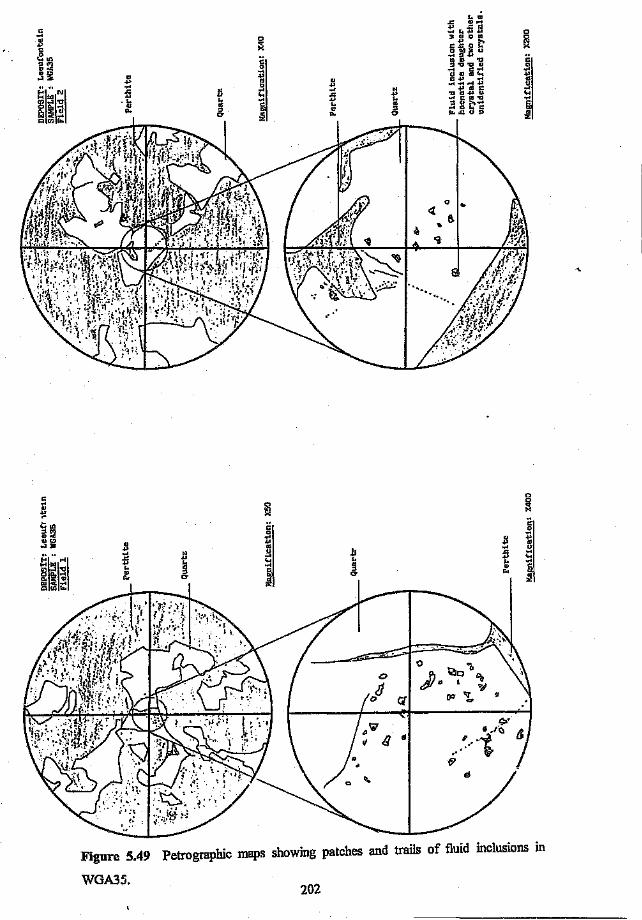
,5s: t. ""'''''...,
.s:: "
" 0..... ~..., .... 0
.., II IV 0 en
c ~a.., "., N
~'"c:.t: 0 s... Xo 00 3';; U
,,<')
~
... " ...
j01< " " 'tl.,,, ::I "0 '0 4J
...,'" " ';l tl"a~'" '"
i\fil~\... c..., .....t:!
U .., ..-4..-4 .... ~
'"... ... ..... C
.t. :::: s: "Ol'[J~a)
" C '" .... EtI)'t:l
'"t. :Ii 01 >, ......,
'" n, <::llb§:>:
s 0
.' 0
'l:! '"0er
>< ><
~tn j,,<'>c:
"'''''""0
,..,'" "., ....
"_,
...
~\~\~\.... "
I.
... '".., ~.c '"
.... .s::.., t. " '" '"" '" "
.. ,".. ::l ::l
., SrC4 a 0' '"
OIUl ~"::;:
Figure 5.49 Petrographic maps showing patches and trails of fluid inclusions in
WGA35.202
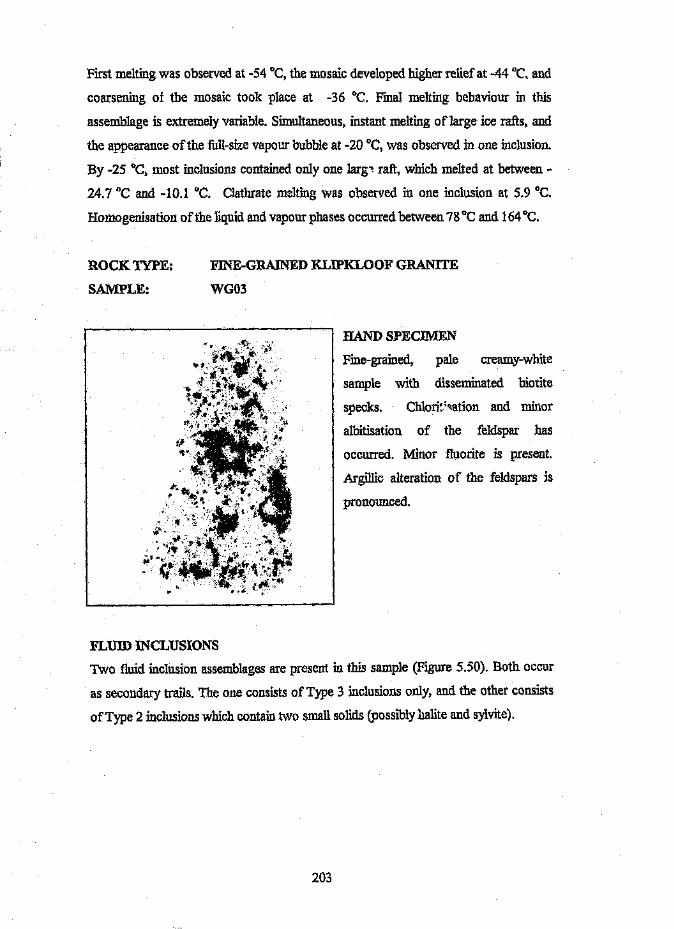
First melting was observed at -54 DC,the mosaic developed higher relief at -44°C. and
coarsening of the mosaic took place at -36 DC. Final melting behaviour in this
assemblage is extremely variable. Simultaneous, instant melting of large ice rafts, and
the appearance of the full-size vapour bubble at -20°C, was observed in one inclusion.
By -25 "C, most inclusions contained only one larg- raft, which melted at between -
24.7°C and -10.1 "C. Clathrate melting was observed in one inclusion at 5.9 DC.
Homogenisation of the liquid and vapour phases occurred between 78 "C and 164°C.
ROCK TYPE:
SAMPLE:
FINE-GRAINED KLIPKLOOF GRANITE
WG03
HAND SPECIMEN
Fine-grained, pale creamy-white
sample with disseminated biotite
specks. Chlori: ;sation and minor
albitisation of the feldspar has
occurred. Minor fluorite is present.
Argillic alteration of the feldspars is
pronounced.
FLUID lNCLUSIONS
Two fluid inclusion assemblages are present in this sample (Figure 5.50). Both occur
as secondary trails. The one consists of Type 3 inclusions only, and the other consists
of Type 2 inclusions which contain two small solids (possibly halite and sylvite).
203
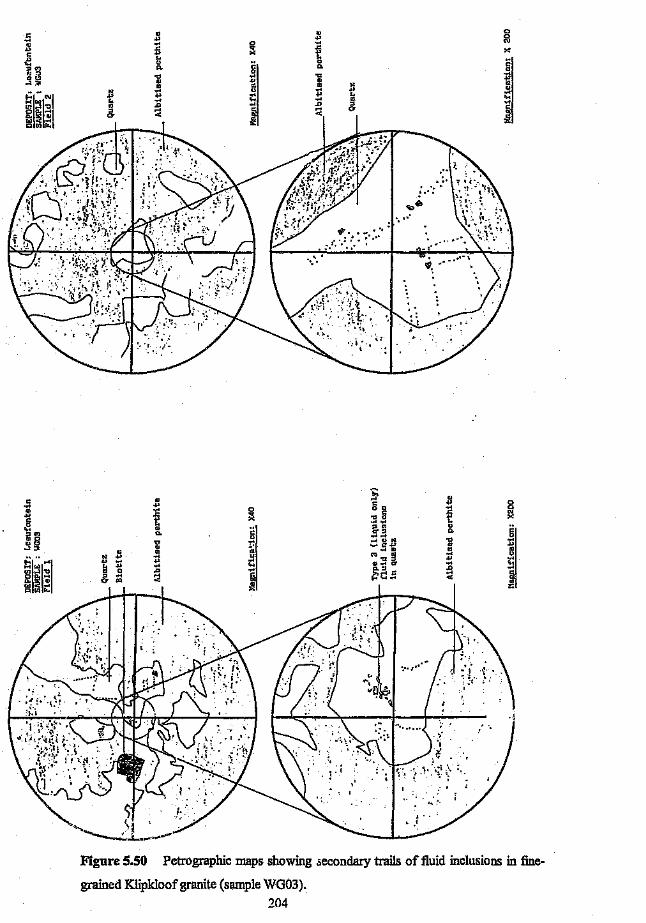
oS " " 00
'" !! 0 !! '"..., .!! s .!! XC
.., ..,e ... ..
~
"
~
":>M Il. Co
:;;3 -e 'tl
...J~ " " "" .!:1 .!:1 ...~I~\:! ..., ..., ..., ... 'H... .... .... " ...." D :e :> c
~~]l :> ....""
0-cr -c
.~
Cl '" ~.I
>;OJ
C " ....0c !!.... !! ° oil 0
" .!! .. .!! N.... :g .~ .., XC
.., x ....e ... :> m " a" C 0':> C.:>'" c. ........ ~"0 't1 .~ ....0" ."
'"" .. ,.. ~C"" " ...."":. " '" .... " ~ "!l M III !:
Iljl~1 " !! !: "':> ......, .... " .... 0' .... :::.. ..., .... ..." .s D .... c.:> ,0
» ....C .... So" .... C ......... ""o- '" "" ec,,<gIII
""
Figure 5.50 Petrographic maps showing secondary trails of fluid inclusions in fine-
grained Klipldoof granite (sample WG03).204
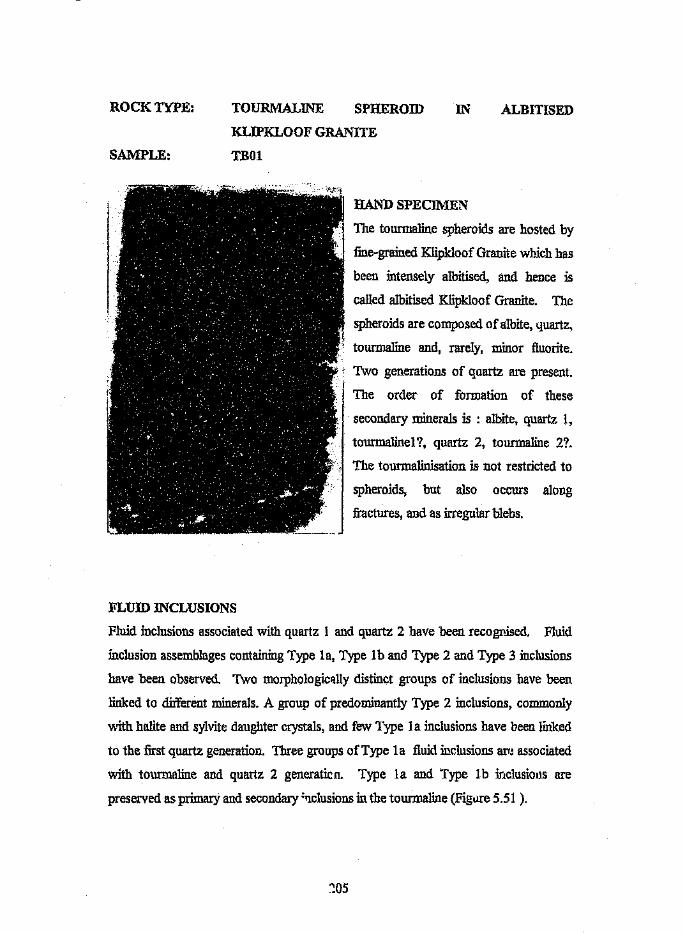
ROCK TYPE: TOURMALlNE
KLIPKLOOF GRAl~ITE
SAMPLE: TBOl
SPHEROID IN ALBITISED
HAND SPECTh'IEN
The tourmaline spheroids are hosted by
fine-grained Klipkloof Granite which has
been intensely albitised, and hence is
called albitised Klipkloof Granite. The
spheroids are composed of albite, quartz,
tourmaline and, rarely, minor fluorite.
Two generations of quartz are present.
The order of formation of these
secondary minerals is : albite, quartz 1,
tourmaline! '1, quartz 2, tourmaline 2?
The tourmalinisation is not restricted to
spheroids, but also occurs along
fractures, and as irregular blebs.
FLUID INCLUSIONS
Fluid inclusions associated with quartz 1 and quartz 2 have been recognised. Fluid
inclusion assemblages containing Type 1a, Type 1b and Type 2 and Type 3 inclusions
have been observed. Two morphologically distinct groups of inclusions have been
linked to different minerals. A group of predominantly Type 2 inclusions, commonly
with halite and sylvite daughter crystals, and few Type 1a inclusions have been linked
to the first quartz generation. Three groups of Type la fluid inclusions are associated
with tourmaline and quartz 2 generaticn. Type! a and Type 1b inclusions are
preserved as primary and secondary ;'!lc1usionsin the tourmaline (Figure 5.51 ).
~05
MICROTHERMOMETRY
Fluid inclusions in quartz 1: The primary fluid inclusions in quartz 1 are
predominantly Type 2 with a few Type 1a inclusions. They froze to a clear solid at -66
DC,and the mosaic developed at -36 "C. Merging of the mosaic occurred at -22 "C and
final melting took place between -15 DCand -16 DC. Clathrate melting at 6 °C and 16
DCwas observed in a few inclusions. Homogenisation of the liquid and vapour phases
occurred between 140 "C and 187°C.
Fluid inclusions in quartz 2: Primary inclusions in quartz 2 contain very few solid
phases, and are predominantly Type Ia and Type 3 inclusions. They froze between -47
"C and -50°C, and developed a colourless mosaic. Eutectic melting was observed -51
DCand coarsening of the mosaic took place at ~47 "C. At -22 DC!some rafts melted and
the vapour bubble enlarged. Final melting occurred at -10 DCand homogenisation of
liquid and vapour between 122 DCand 149 QC.
Fluid inclusions in tourmaline: One assemblage of primary fluid inclusions has been
found in the tourmaline. The assemblage freezes at temperatures below -85 DC.No
intermediate melting events were observed before -13 DCwhen the vapour bubble
reappeared and final melting occurred between -9.7 DCand -12.7 DC.Homogenisation
of the vapour bubble into the liquid phase occurred between 80 "C and 90 QC.Thisassemblage is also preserved as secondary trails in the quartz. Instantaneous melting of
large rafts and appearance of a vapour bubble is common in the quartz-hosted
inclusions of this assemblage.
206
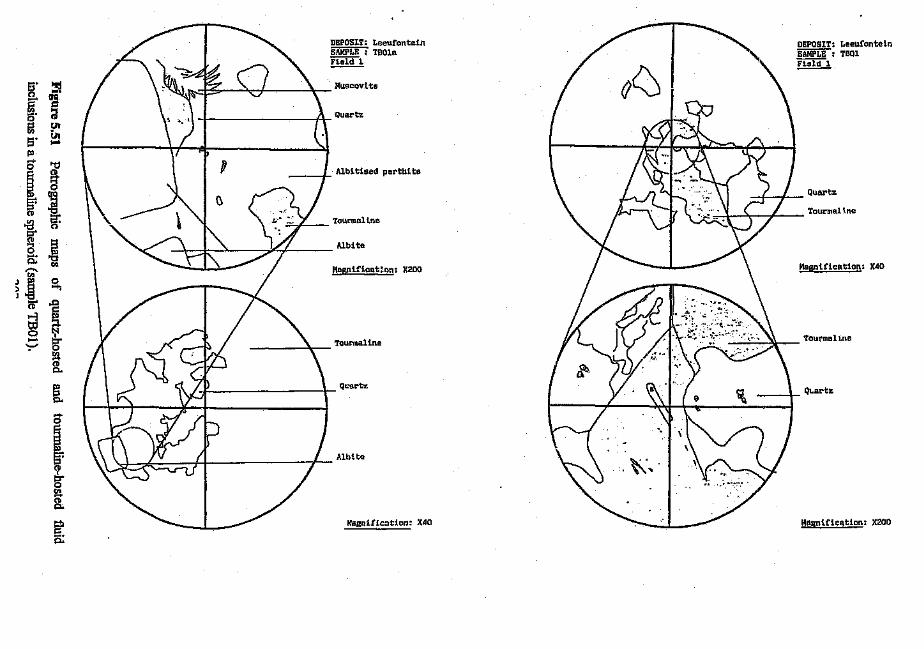
DEPOSIT: Leeufontein
/n~ , <, DEPOSIT: LeeufontelnSiiMPi:El THOla SAMPLE: TOOlField 1 \. iheld 1
S· ~ r \~~F~ I '\ Huscovite0 .... I v \ I (/~ ~Cfl "'I QuartzO· Q
1il UtlJJS· .....
III0 '"d
~~
v oJ M"",,' w"",~
(1).....(3
\ ~ .. :,~.~ ~ Quartz§f C!:l ()(1)
.§ Tourmalf.ne
l e: Tourmaline0
.... i \ '<:tt~ Alblte0s.: Cfl I ~ \ f_lagnifiention: )(40,....., Magnificat~on: )(200Cfl
~0H-)
5" ..0c::>-3 ~tI:10
~ y ~ t / \. // ( 1\ ,/ /-I'''-''-~'-':;•... . " . '\.\ Tourmaltne....... Tourmaline':-"Cfl...(1)0-
8- L \~ ~v6l \ Qcartz
t y' ,,*J ,~ ~, Qt.artz
\ 7 IS.....0
i. \~/I l Albite ~\ . ~',(1) II
§"S!;.(1)
0-
~ "--- I .:»: f!agnific"tion: )(40 ~I~ r~(lgnt fi ea tion: X200
a;

DISCUSSION
The petrography and microthermometry of quartz-hosted and fluorite-hosted fluid
inclusions, in interstitial spaces and in veins, has revealed some very interesting
information concerning the evolution and character of fluids associated mineralisation
in the granites of the eastern lobe of the Bushveld complex. The salient points shall be
discussed according to the scheme are (Figure 5.52).
_---- __ At"
) 1I Interstitial quartZ!L ~J
L Vein quartz I
-. ~!, --". _ Fluorite
! Hydro.the:mal-li cassiterite Il-1 ~
[Fluorite/hematite\ assemblage
! Sulphide assemblage
! l i, i'---------
Figure 5. 52 Schematic representation of fluid categories discussed in terms of their
micro thermometric behaviour and significance.
208
The micro thermometric data presented in the preceding sections highliglat certain
characteristics that are significant. In the paragraphs that follow, these characteristics
will be discussed and their relevance in determining the composition, entrapment
temperaiare, pressure and density of the fluids associated with the different stages in
the psragenetic sequence, considered.
Composition
The temperature of freezing and the characteristics of the frozen solid are not ~opects
which are usually used to distinguish between different fluid inclusion assemblages.
However, these characteristics were particularly useful as first order tools in
estimating the composition of the fluid inclusions in this study.
It has been found that the fluid inclusions associated with quartz generations 2 and 3 in
the interstitial quartz from each study area freeze at low temperatures, develop a
brown ice mosaic on freezing, and commonly contain several solid phases. In contrast,
the fluids associated with quartz generation 1 and the very late stage fi,' ds post-dating
quartz 2 and 3, freeze at moderate temperatures, produce a colourless solid on
freezing, and seldom, if ever, contain daughter crystals. The brown mosaic 15 also
observed in certain fluid inclusion assemblages in vein quartz. Thus, withe ',' recording
any microthermometric data, the origin of the fluids and position within the
evolutionary history of the granite may be deduced, simply by observing the freezing
behaviour of the fluid inclusions.
In addition, a number of inferences can be made about the composition of the fluid
inclusions in which the brown ice mosaic develops. The brown discoloration indicates
the presence of the divalent ions Ca* and Mg++(Goldstein and Reynolds, 1994), and
the low freezing point suggests a relatively high solute content of the fluid.
Furthermore, the presence of daughter crystals implies that the fluids were saturated
with respect to one or more elements. Fluid inclusion assemblages containing solid
phases fitting the criteria for being true daughter r rystals t nd which were positively
identified through optical methods, i.e, halite (NaCl), sylvite (KCl), hematite (Fe203),
iron chloride (FeClz), muscovite (K2A4(SiQAh)020(OH)4), and calcite (CaC03),
209
suggest that the fluids contained Na+, K\ Fe+tl+-H,Ca-+, and cr at saturation levels.
Salinity estimates are usually based on the assumption that fluid compositions cau be
represented in terms oftwo or three component systems, such as NaCI-HzO or NaCl-
KCl-HzO or NaCI-HzO-C02. The presence of additional ions in olution hampers the
determination of salinity of the fluids by lowering the liquidus and eutectic
temperatures below those for pure NaCI-HzO inclusions. The amount of lowering of
the NaCI-H:zO liquidus is much greater when divalent chlorides are added than when
KCl is added (Roedder, 19t.4). However, the density and thermal coefficient of
expansion of multi-component fluids can be estimated to within 1% from that of a
simple NaC! solation having the same freezing point (Clynne and Potter, 1977).
The problem of estimating salinity is amplified by the presence of gases such as CO2,
C~ and Na. Murphy and Roberts (1996) have shown that the occurrence of clathrates
(solid gas hydrates) complicates the use of microthermometry in the estimation of
composition and density of aqueo-carbonic fluids. Murphy and Roberts (1996)
suggest that there is a problem with the use of predictive thermodynamic models based
on final clathrate melting temperatures and the assumption of equilibrium within
aqueo-carbonic inclusions. Numerous clathrate melting temperatures were recorded
for fluid inclusions in this study, and values above IO'C were not uncommon, In fluid
inclusions with CO2 double bubbles, freezing temperatures were suppressed by as
much a 1°C, and this is indicative of the presence of gases such as Nz and CRt in
solution.
The dissolution temperature of daughter crystals is often used in order to determine the
salinity of saturated solutions. According to Sheppard (1985) knowledge of the
solubility of each salt in the mixed system is required, and it is rarely possible to
express the composition of the fluid phase in terms of more than two or three simple
salts. Attempts to dissolve daughter crystals were made, but no instances were
recorded where dissolution of the daughter crystals occurred before homogenisation of
the liquid and vapour phase, or before the inclusion decrepitated. Reasons for the
non-dissolution of the solid phases may include the fact that the solids were not true
daughter crystals but merely trapped solids, or that changes in the fluid inclusion has
occurred, such as necking down, and Hz leakage. Some minerals require several hours
210
of heating for dissolution to occur, and it is possible that equilibrium was not achieved
in the short time the samples were heated before decrepitation took place.
Decrepitation data were obtained during thermal decrepitation of fluid inclusions for
quadrupole mass spectrometry, and the reader is referred to Chapter 6 for more
details.
Intermediate melting temperatures were recorded in great detail in this study, and
provide some insights into the fluid phase composition. At the eutectic temperature for
experimentally determined chemical systems, rapid melting of one phase takes place,
and which is often observed as an intermediate melting event in the fluid inclusions.
The temperatures of these events can be correlated to eutectic temperatures of known
systems listed below (refer to Table 5.1). Intermediate melting events, corresponding
to several eutectic melting temperatures for the chemical systems, were recorded, The
intermediate melting events suggest the presence of a combination ofNaCl, KCl, and
FeClz in the fluids. Melting of phases in the ranges for the eutectic melting
temperatures for the HzO-NaHC03, H20-Na2,C03-K2C03, and H20-NaCI-Na2S04
systems alludes to the presence of some of these components, but, in the absence of
supporting evidence, no emphasis has been placed on them. The intermediate melting
events are plotted in histograms in the following sections which compare the fluids in
minerals at the different deposits, and with the host granites.
Temperature, pressure and density
Determination of the entrapment temperature (Ttrue) and pressure is problematic.
According to Reynolds and Goldstein (1994), a prerequisite for the determination of
pressures of entrapment is the presence of FIA's that produce consistent reproducible
data and that contain 110 other gases, such as methane and carbon dioxide. The only
gas present in the bubble must be water vapour. The chemical system and salinity of
the fluids must be accurately determined, and homogenisation temperatures recorded.
Isochores (lines of equal density) are then plotted on a graph of pressure versus
temperature, and the point of intersection of the measured homogenisation temperature
with the isochore yields the unique pressure of entrapment. Clearly, this method of
determining entrapment pressure is inappropriate for the fluid inclusions measured in
this study, since complex gas mixtures are present in most PIA's, the
211
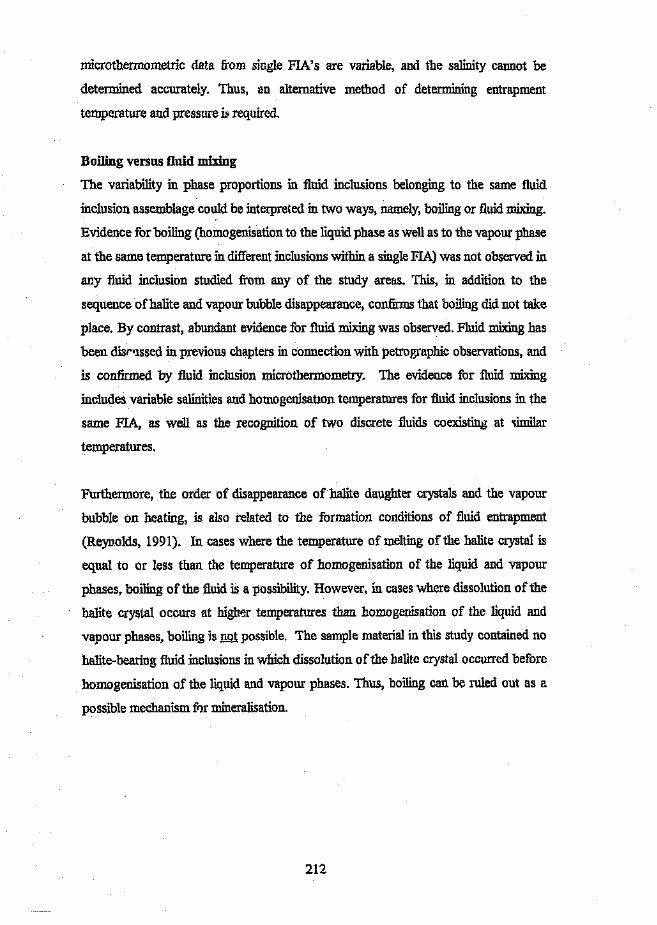
microthermometric data from single FIA's are variable, and the salinity cannot be
determined accurately. Thus, an alternative method of determining entrapment
temperature and pressure is required.
Boiling versus fluid mixing
The variability in phase proportions in fluid inclusions belonging to the same fluid
inclusion assemblage could be interpreted in two ways, namely,boiling or fluidmixing.
Evidence for boiling (homogenisationto the liquid phase aswell as to the vapour phase
at the same temperature in different inclusionswithin a singleFIA) was not observed in
any fluid inclusion studied :from any of the study areas. This, in addition to the
sequence of halite and vapour bubble disappearance, confirmsthat boiling did not take
place. By contrast, abundant evidence for fluid mixing was observed. Fluid mixing has
been discussed in previous chapters in connection with petrographic observations, and
is confirmed by fluid inclusion microthermometry, The evidence for fluid mixing
includes variable salinities and homogenisation temperatures for fluid inclusions in the
same FlA, as well as the recognition of two discrete fluids coexisting at similar
temperatures.
Furthermore, the order of disappearance of halite daughter crystals and the vapour
bubble on heating, is also related to the formation conditions of fluid entrapment
(Reynolds, 1991). In cases where the temperature of melting of the halite crystal is
equal to or less than the temperature of homogenisation of the liquid and vapour
phases. boiling of the fluid is a possibility. However, in cases where dissolution of the
halite crystal occurs at higher temperatures than homogenisation of the liquid and
vapour phases, boiling is not possible. The sample material in this study contained no
halite-bearing fluid inclusions inwhich dissolution of the halite crystal occurred before
homogenisation of the liquid and vapour phases. Thus, boiling can be ruled out as a
possible mechanism for mineralisation.
212
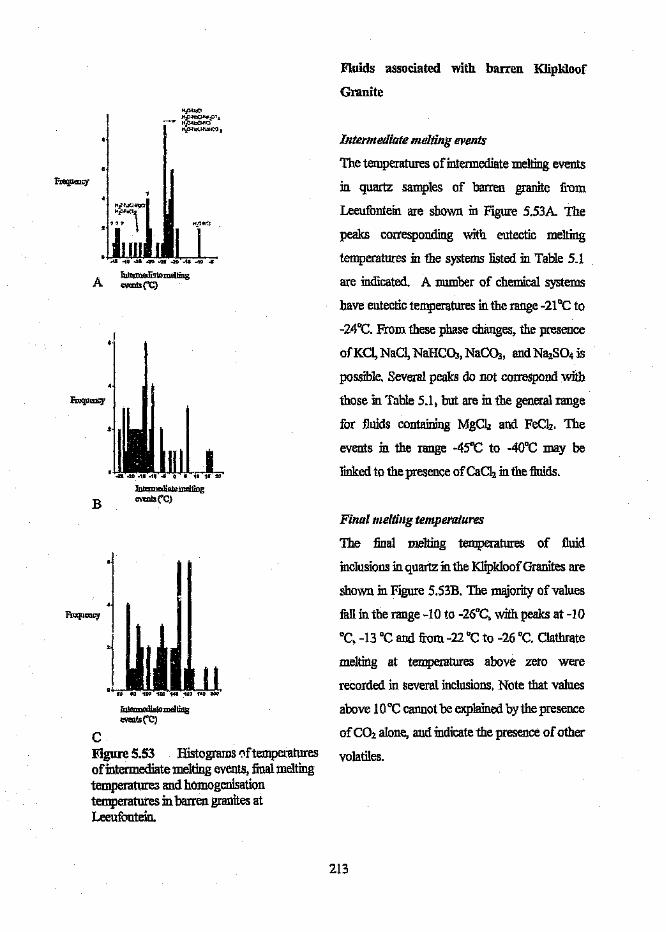
I
f
·tI
e
fij:-t.$';lM~CJ
:~~<1LI.45 ~ ..35 030 .25 ~.lO .15 .10 ..s
AInt=edi'lemeltingevcnts("C)
BIntamauatemeltingevents ("C)
FIT:q\IOOCY
Intcnnediatcmeltingevents ("C)
CFigure 5.53 Histograms of'temperaturesof intermediate melting events, finalmeltingtemperatures and homogenisationtemperatures in. barren granites atLeeufontein.
Fluids associated with barren Klipkloof
Granite
Intermediate melting events
The temperatures of intermediate melting events
in quartz samples of barren granite from
Leeufontein are shown in Figure 5.53A. The
peaks corresponding with eutectic melting
temperatures in the systems listed in Table 5.1
are indicated. A number of chemical systems
have eutectic temperatures in. the range -21°C to
-24°C. From these phase changes, the presence
ofKCl, NaCI, NaHC03, NaCO" and Na2S04 is
possible. Several peaks do not correspond with
those in Table 5.1, but are in the general range
for fluids containing MgCh and FeCh. The
events in the range -45"C to -40°C may be
linked to the presence of CaCh in the fluids.
Final melting temperatures
The final melting temperatures of fluid
inclusions in quartz in the KIipkloof Granites are
shown in Figure 5.53B. The majority of values
fall in the range -10 to -26°C, with peaks at -10
"C, -13 °C and from -22°C to -26 DC.Clathrate
melting at temperatures above zero were
recorded in several inclusions. Note that values
above 10°C cannot be explained by the presence
of COl alone, and indicate the presence of other
volatiles.
213
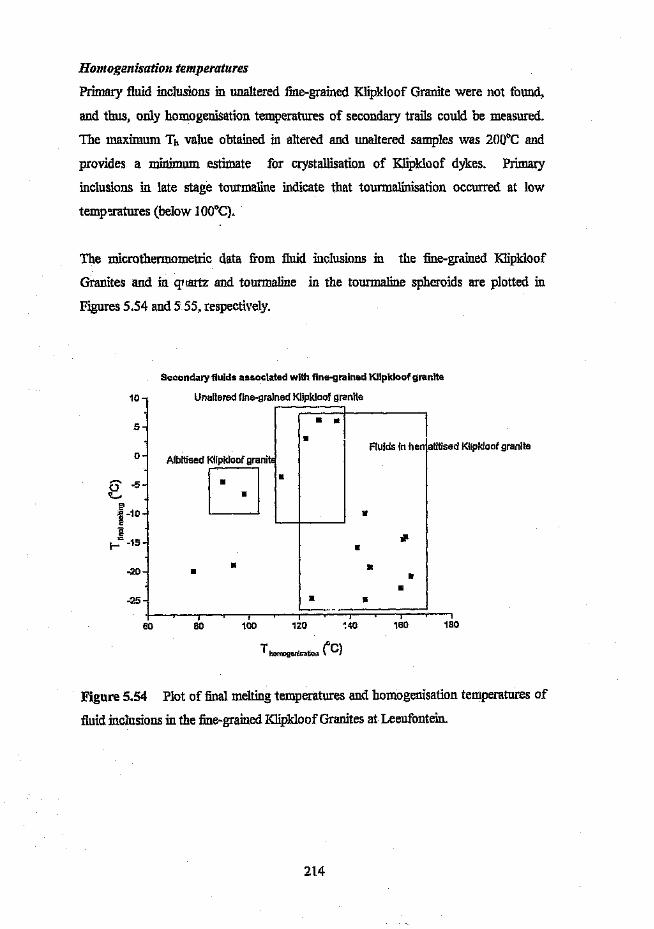
Homogenisation temperatures
Primary fluid inclusions in unaltered fine-grained Klipkloof Granite were not found.
and thus, only homogenisation temperatures of secondary trails could be measured.
The maximum T, value obtained in altered and unaltered samples was 20Qoe and
provides a minimum estimate for crystallisation of Klipkloof dykes. Primary
inclusions in late stage tourmaline indicate that tourmalinisation occurred at low
temperatures (below 1QQ0C).
The microthermometric data from fluid inclusions in the fine-grained Klipkloof
Granites and in quartz and tourmaline in the tourmaline spheroids are plotted in
Figures 5.54 and 5 55, respectively.
Secondary fluids associated with fine-grained Klipkloof granite
10 Unaltered flne-grained Klipkloof granite
o Afbitiseci Klipkloof granit
D-20 II
II
II II
IIFluids in hen
E
II
II
L_'*II
IIII
II
II
--r----
atitised Klipkloof granite
5
6' -5'I.,...
1-10~g
1-'= -15-
-25
60 80 100 120--,
160 180
Figure 5.54 Plot of final melting temperatures and homogenisation temperatures of
fluid inclusions in the fine-grainedKlipkloof Granites at Leeufontein,
214

Fknds assoicated with tourmaline spheroids20
II IIII
10II
........ ap'-''"c~~ ..10 II II II.. IIl- II II II ..II II II
-20 • ..-30
60 80 100 120 140 160 180 200 220
Thcmcgenisaticn ('C)
Figure 5.55 Plot of final melting temperatures and homogenisation temperatures of
fluid inclusions in tourmaline spheroids in Albitised Klipkloof Granite at Leeufontein.
The hematitised Klipkloof Granites contain a highly saline assemblage of inclusions
which homogenise between approximately 120°C and 165°C, and have final melting
temperatures ranging from -lOoC to -26 DC(14 to >21.2 wt. % eNaCl). The unaltered
granites and the hematitised granites share a common fluid inclusion assemblage which
is moderately saline and contains C02. Clathrates which melted between 2 end 6.5 °C
suggest salinities of 14 to 8 wt, % eNaCl. The fluids associated with the Albitised
Klipkloof Granites are moderately saline (8 to 11.5 wt. % NaCl), and were trapped at
lower temperatures. Thus, hematitisation is considered to be a higher temperature
alteration phenomenon than albitisation. This deduction is supported by textural
evidence. where hematite liberated from the feldspar lattice during subsequent
albitisation, occurs as rims around individual grains and along fractures within the
grains.
215
The fluids in the tourmaline spheroids hosted by Albitised KIipkloof Granite contain
fluids with salinity equivalents of between 14.5 to 22.6 wt, % eNaCt ~he temperature
range for these fluids ranges from 200°C to n"c. Two generations of quartz and
tourmaline were recognised in the spheroids, the early generation of quartz has salinity
of 18.5 wt. % eNaCl while the youngest low temperature fluids trapped in the second
generation oftounnaline have salinities of 13 to 16 wt.% eNaCl.
Fluids in Irypera: lvus and subsolvus granites associated with mineralisation
The fluid inclusions in interstitial quartz from the hypersolvus granites at Spoedwel and
Dronkfontein, and the subsolvus granites at Albert, were studied. At Spoedwel and
Dronkfontein, three generations of quartz were recognised by means of cathode-
luminescence imagery. The cr' cteristics of fluids associated with these three
interstitial quartz generations in the altered hypersolvus granites containing minor
disseminated mineralisation at Spoedwel, and the implications of the observed
phenomena are tabulated below (Table 5.8)
216

'hM.;5.8 Table summarisingthe characteristic features of the fluids associated
with ""'lartz generations 1,2 and 3 at Spoedwel,
OBSERVATION IMPLiCATION
QUARTZ GENERATION 1
No brown mosaic
'r, -35°C
Intermediate melting events:
-22°C_9°C
r final melring _2°C to DoCand up to IDoC
T.>250·CQUARTZ GENERATION 2
Brown mosaic
Low freezing temperature (-50°C to-60°C)
r,-36°CDaughter crystals:
halite
sylvite
hematite
Iron chloride
Intermediate melting events:
-31°C
-24°C
T f",.1 melting -20 "C to -17°Cr,170°C-378°C average Th 230°C
QUARTZ GENERATION 3
Very low Tm:elC -80°C
Dark brown mosaic
T. _50°C to -60°C
T fin31""Icing -30 "C to -38°C
No Ca in solution
H;,O-NaCl-MgCl:!eutectic and H!O-FeCl! eutectic
NaC! eutectic (-22.3 DC?)
KCl eutectic (-10.7°C)
Almost pure water. Low concentration of dissolved
constituents. Clathrate melting at temperatures above DOC
indicates the presence of C02. Salinity up to 3 wt % e
NaC!.
Moderate temperature of entrapment
Capresent
-significant amounts of dissolved constituents.
-possibly Nz and/or CRt
H20-NaCl-MgC12 eutectic and H20-FeClz eutectic
Saturation with respect to components.
NaCl
KCI
?MgCl:!?melting of hydrohalite (NaCl.H20)
Salinity 22.5 to 20 wt, % eNaCl.
-significant amounts of dissolved constituents.
-possibly N, and/or CRt
Ca in solutionCaCh Eutectic (melting of anta=cticite)
Extremely low. Abundant ,,",",solved solutes. Salinity
cannot be determined using H20-NaCl system.
217

The characteristics of the fluids associated with the subsolvus Verena Granite. which
hosts the quartz veins associated with mineralisation at Albert, are shown in Table 5.9.
Two distinct fluids are recognised by their microthermometric 1 ehaviour,
Table 5.9 Tabulation of fluid characteristics associated with the subsolvus Verena
Granite hosting mineralisation at Albert silver deposit.
OBSERVATION Th1PLICATION
FLUID 1
Colourless mosaicTf -44 0(; to -48 °C
Te-40·C
Intermediate melting events_34°;::
-21 -c-16°C
Final melting -4.4 DC to 4.3 °C
NoCa
?
HzO-FeCh (-35°C)
H:p-NaCl
Clathrates indicate presence of Cal. Salinity 6.6 to
10.5 wt % eNaCL
Th 128°C -173"C
FLUID 2
Brown mosaic Ca Present
Tf -60°C to-75°C
Te -50·C to -52·C
Intermediate melting events
-40°C
-33°C-28 DC
-24"C
Daughter crystals
FeCh
Halite
HzO-MgC{zeutectic
HzO-NaCl-KCl eutectic -23.soC
Sylvite
T fill:.] mcltin8 -4.8 DCto 15°C(average ~50c)
Clathrate melting above lODe indicates volatiles
other than CO2 are present. Salinity 7.6 wt. %
eNaCl.
218
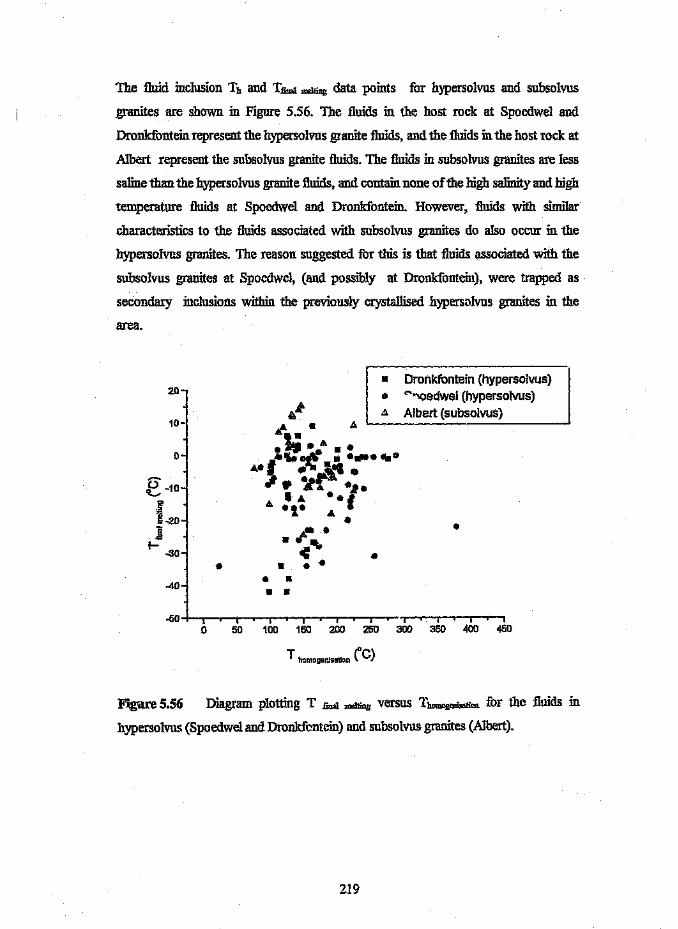
The fluid inclusion Th and Tfucl mzlliDg data points for hypersolvus and subsolvus
granites are shown in Figure 5.56. The fluids in the host rock at Spoedwel and
Dronkfontein represent the hypersolvus granite fluids, and the fluids in the host rock at
Albert represent the subsolvus granite fluids. The fluids in subsolvus granites are less
saline than the hypersolvus granite fluids, and contain none of the high salinity and high
temperature fluids at Spoedwel and Dronkfontein. However, fluids with similar
characteristics to the fluids associated with subsolvus granites do also occur in the
hypersolvus granites. The reason suggested for this is that fluids associated with the
subsolvus granites at Spoedwel, (and possibly at Dronkfontein), were trapped as
secondary inclusions within the previously crystallised hypersalvus granites in the
area.
20
10
0
6' -10~""~~ -20@""I--30
•-40
·50
• Dronkfontein (hypersolvus)8 "'"Ioedwel (hypersolvus)A Albert (subsolvus)
A- •....C• • •• •• •
••
o 50 100 150 200 250 300 350 400 450
T homogenisation ("C)
Ftgure 5.56 Diagram plotting T fucl melting versus ThomogcnisaliO!l for the fluids in
hypersolvus (Spoedwel and Dronkfontein) and subsolvus granites (Albert).
219
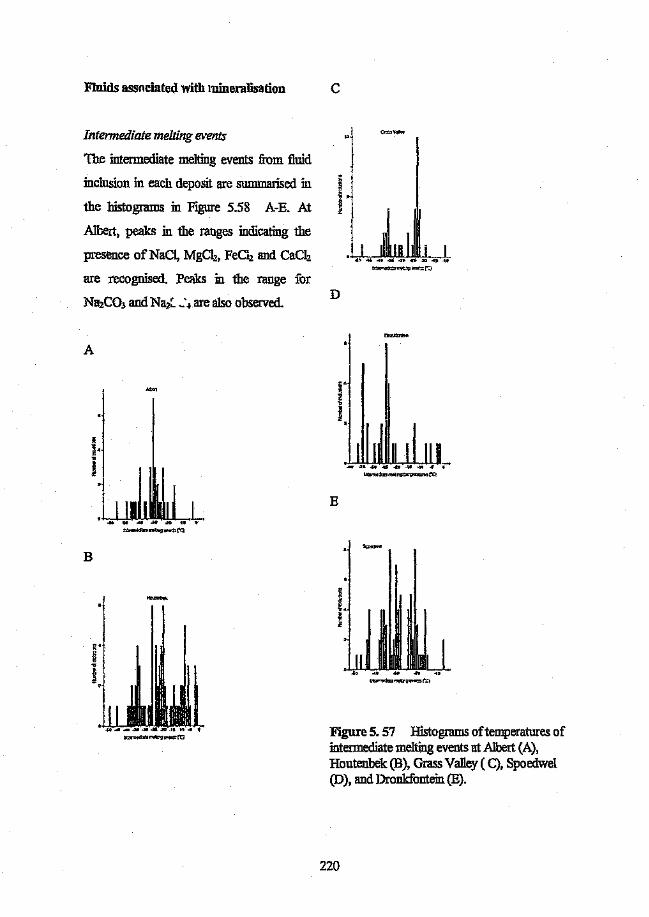
Fluids associated with mineralisation
Intermediate melting events
The intermediate melting events from fluid
inclusion in each deposit are summarised in
the histograms in Figure 5.58 A-E. At
Albert, peaks in the ranges indicating the
presence ofNaCI, MgClz, FeCh and eachare recognised. Peaks in the range for
Na2COJ and Nal::' -'-I are also observed.
A
B
C
D
E
."
~=-:Sl!.O""':t;':II"'er::nr,)
Figure 5. 57 Histograms of temperatures ofintermediate melting events at Albert (A),Houtenbek (B), Grass Valley ( C), Spoedwel(D), and Dronkfontein (E).
220
At Houtenbek, the presence of MgCh. FeClz, NaCl, KCl, C:.Ch, Na2C03 aud Na2S04
is suggested by the temperatures at which melting of intermediate phases occurred.
However, as mentioned above, without supporting evidence, the presence of NaiC03
and NazSO.,. is dubious. At Spoecwel, Dronkfontein, Grass Valley and Albert, the
intermediate melting events suggest t.hat the fluids are essentially the same, only having
better pronounced peaks in the eutectic ranges of FeCh-HzO and MgC}z-HzO.
Homogenisation and final melting temperatures
The homogenisation temperatures and final melting temperatures of fluids associated
with mineralisation at '1rass Valley, Houtenbek, Spoedwel, Dronkfontein and Albert
are plotted inFigure 5.58.
The most saline fluids are associated with the hypersolvus granites hosting
mineralisation at Spoedwel and Dronkfontein. It is not possible to determine the
percentage eNaCl for these fluids because their final melting temperatures are too low
to be interpreted in terms of the H20-NaCl chemical system. The bulk of the fluids
directly associated with mineralisation from all deposits plot fairlv closely together.
The fluids associated with late stage hematite-fluorite at Albert tend to be lower
temperature and salinity fluids, and contain volatiles in addition to CO2 (indicated by
high temperature clathrate melting). Although there is some scatter ill the data points,
the fluids at each of the deposits appears to plot in particular fields in Figure 5.58.
The fluids identified as being associated with the precipitation of certain minerals in
the sulphide paragenesis, with hydrothermal cassiterite and with the hematite-fluorite
assemblage are tabulated in Table 5.10. The data in Table 5.10 are from primary
inclusions in vein quartz associated with each of the minerals listed. These fluids are
plotted in Figure 5.59, which clearly shows the differences in the fluids in the various
stages of the paragenetic sequence.
221
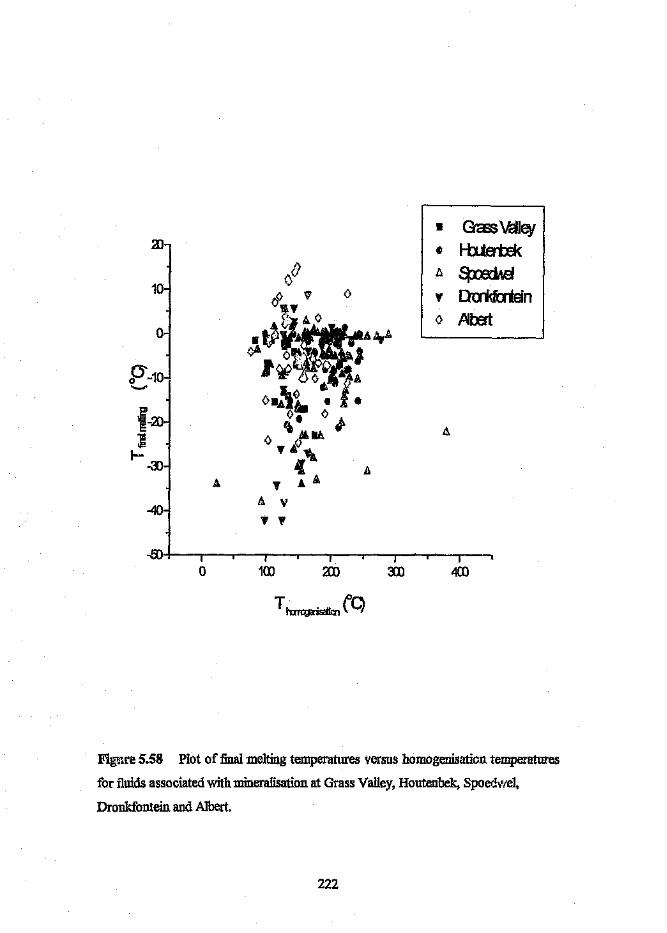
10
0
P'-10_.
E'r=~l-
-3JIi
-40
• GemVc:Iley~ Hl.terb3k:b. ~
'f DtriOCrtein(> PR:at
Figm.·~ 5.58 Plot of final melting temperatures versus homogenisation temperatures
for fluids associated with mineralisation at Grass Valley, Houtenbek, Spoedwel,
Dronkfontein and Albert.
222

Table S.10 Table comparing the fluids associated with deposition of minerals in each
of the mineral assemblages, as determined from fluid inclusions in synchronous quartz.,-ASSEMBLAGE MINERAL T flnalmelting Th
(DEPOSIT) (oq
Sn-W Hydrothermal cassiterite -0.4 194 -201
(Grass Yaney)
(-4.4; -3.1) 134 -167
Arsenopyrite -8.8 '?168-214
(Albert)
Sphalerite -16 149 -160
(Grass Valley)
Galena -14 134
(Grass Valley)
Chalcopyrite -5 203 - 244
(Spoedwel)
Chalcopyrite -4.2 ?
(Albert)
Chalcopyrite ? -4.4 ? 143
(Grass Valley)
Fluorite/hematite Quartz -10 >100
(Spoedwel)
Fluorite -16 to-6 200 to 150
(Albert) -2.6 to ·1.7 112 to 93
223
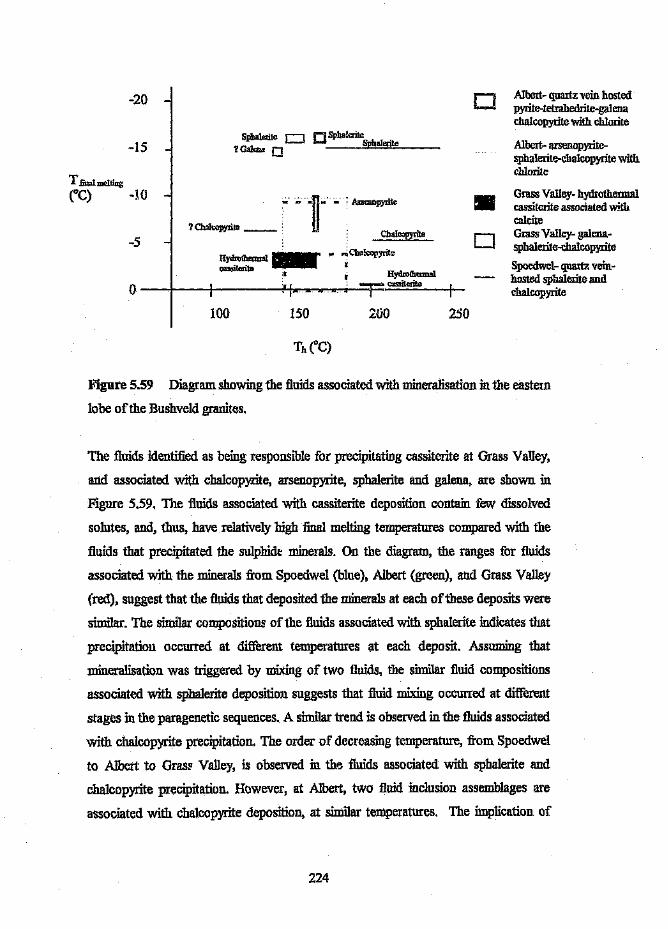
-20 o Albert- quartz vein hostedpyrite-tetrahedrite-galenachalcopyrite with chlorite
-15Sphalerite r-l lF1! Sphalerite
L-J lk.J Sphalerite?Galcoa 0 Albert- arsenopyrite-
sphalerite-chalcopyrite withchlorite
T final mdtlag
eC) -10 ~~.:.~=n. a A.-senopyrite
? Chalcopyrite U-- Chalccpyrite
• Grass VaIley- hydrothennalcassiterite associated withcalciteGrass Valley- galena-sphalerite-chalcopyrite
Spoedwel- quartz vein-hasted sphalerite andchalcopyrite
_. .. "Chalcopyrit"Hydrothermal __
cassiterite I Hydrothermalcassiteriteo ----I---i------:.4,.......,.....,..,..,.."...-,1-=F-==;;:__--I-
o-5
100 150 200 250
Figure 5.59 Diagram showing the fluids associated with mineralisation in the eastern
lobe of the Bushveld granites.
The fluids identified as being responsible for precipitating cassiterite at Grass Valley,
and associated with chalcopyrite, arsenopyrite, sphalerite and galena, are shown in
Figure 5.59, The fluids associated with cassiterite deposition contain few dissolved
solutes, and, thus, have relatively high final melting temperatures compared with the
fluids that precipitated the sulphide minerals. On the diagram, the ranges for fluids
associated with the minerals from Spoedwel (blue), Albert (green), and Grass Valley
(red), suggest that the fluids that deposited the minerals at each of these deposits were
similar. The similar compositions of the fluids associated with sphalerite indicates that
precipitation occurred at different temperatures at each deposit. Assuming that
mineralisation was triggered by mixing of two fluids, the similar fluid compositions
associated with sphalerite deposition suggests that fluid mixing occurred at different
stages in the paragenetic sequences. A similar trend is observed in the fluids associated
with chalcopyrite precipitation. The order of decreasing temperature, from Spoedwel
to Albert to Grass Valley, is observed in the fluids associated with sphalerite and
chalcopyrite precipitation. However, at Albert, two fluid inclusion assemblages are
associated with chalcopyrite deposition, at similar temperatures. The implication of
224
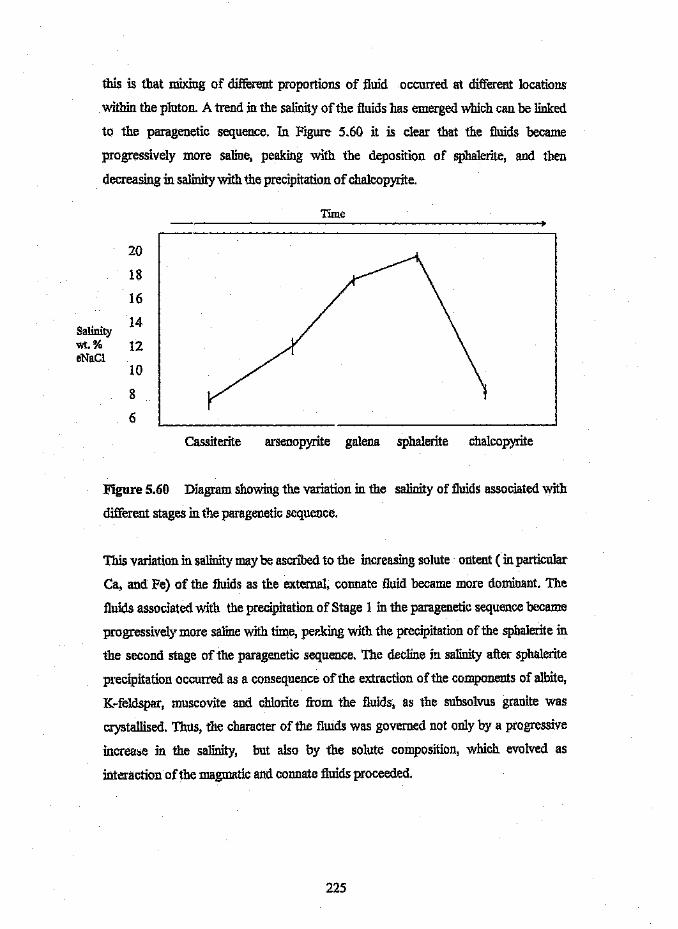
this is that mixing of different proportions of fluid occurred at different locations
within the pluton. A trend in the salinityof the fluids has emerged which can be linked
to the paragenetic sequence. In Figure 5.60 it is clear that the fluids became
progressively more saline, peaking with the deposition of sphalerite, and then
decreasing in salinitywith the precipitation of chalcopyrite.
20
18
16
Salinity14
wt.% 12eNaCl
10
8
6
Time
Cassiterite arsenopyrite galena sphalerite chalcopyrite
Figure 5.60 Diagram showing the variation in the salinity of fluids associated with
different stages inthe paragenetic sequence.
This variation in salinitymaybe ascribed to the increasing solute ontent ( in particular
Ca, and Fe) of the fluids as the external, connate fluid became more dominant. The
fluids associated with the precipitation of Stage 1 in the paragenetic sequence became
progressively more salinewith time, peeking with the precipitation of the sphalerite in
the second stage of the paragenetic sequence. The decline in salinity after sphalerite
precipitation occurred as a consequence of the extraction of the components of albite,
K-feldspar, muscovite and chlorite from the fluids, as the subsolvus granite was
crystallised. Thus, the character of the fluids was governed not only by a progressive
increase in the salinity, but also by the solute composition, which evolved as
interaction of the magmatic and connate fluids proceeded.
225
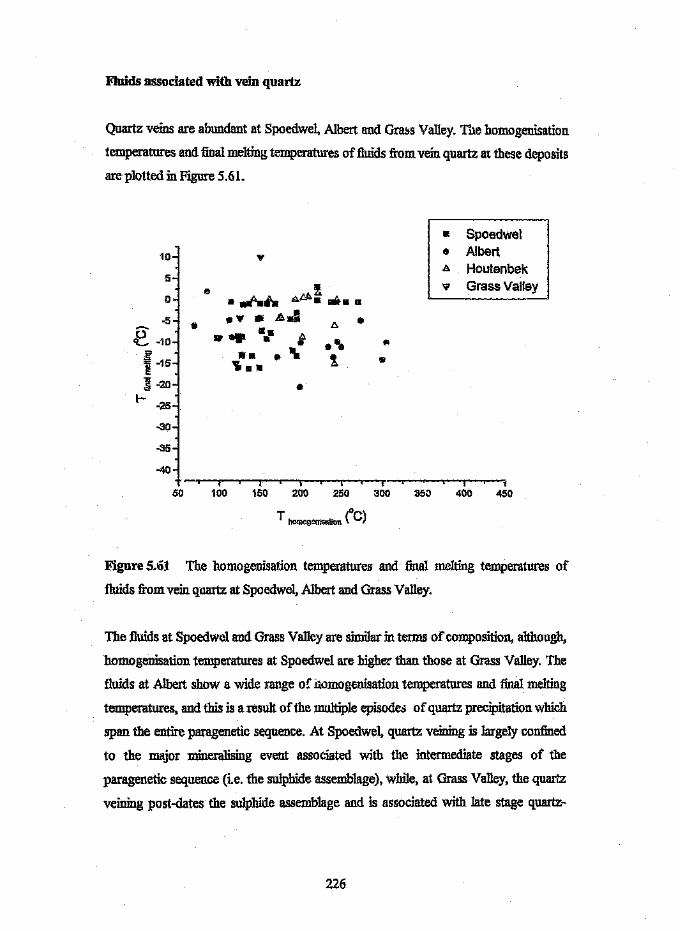
Fluids associated with vein quartz
Quartz veins are abundant at Spoedwel, Albert and Grass Valley. Tile homogenisation
temperatures and final melting temperatures of fluids from vein quartz at these deposits
are plotted in Figure 5.61.
10
5e
0
-5 ..o~ -10
~ -15~~ -20I- -25
-30
-35
-40
50
• Spoedwelo!!l AlbertA Houtenbek7 Grass Vallev
l.____ -
•
I
100 150 200 250 300 350 400t
450
T ncmonemseuon (C)
Figure 5.~1 The homogenisation temperatures and final melting temperatures of
fluids from vein quartz at Spoedwel, Albert and Grass Valley.
The fluids at Spoedwel and Grass Valley are similar in terms of composition, although,
homogenisation temperatures at Spoedwel are higher than those at Grass Valley. The
fluids at Albert show a wide range of nomogenisation temperatures and final melting
temperatures, and this is a result of the multiple episodes of quartz precipitation which
span the entire paragenetic sequence. At Spoedwel, quartz veining is largely confined
to the major mineralising event associated with the intermediate stages of the
paragenetic sequence (i.e. the sulphide assemblage), while, at Grass Valley, the quartz
veining post-dates the sulphide assemblage and is associated with late stage quartz-
226
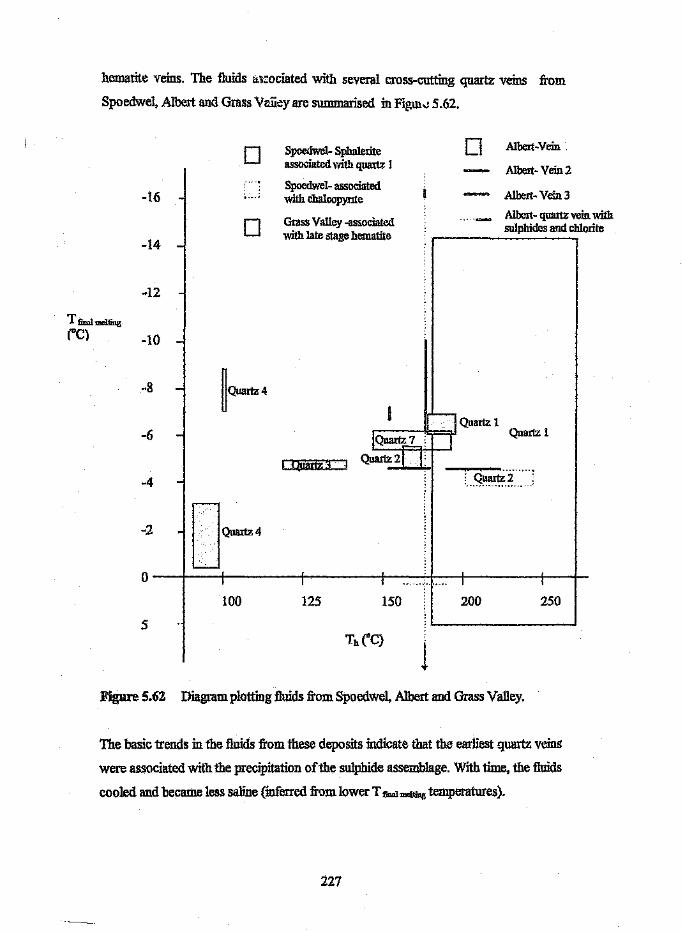
hematite veins. The fluids associated with several cross-cutting quartz veins from
Spoedwel, Albert and Grass Vaiiey are summarised in Figure 5.62.
-16
-14
~12
T Iim1 melting(OC)
-10
~8
-6
-4
-2
0
5
o o Albert -Vein .
Albert - Vein 2
Spoedwel- Sphaleriteassociated with quartz I
Spoedwel- associatedwith cha1copynte
Grass Valley -associatedwith late stage hematiteo
Albert- Vein 3
Albert- quartz vein withsulphides and chlorite
250
Quartz 1
LQilartzO: Quartt"i"'"~........ - ....~.... '
100 150125 200
Figure 5.62 Diagram plotting fluids from Spoedwel, Albert and Grass Valley.
The basic trends in the fluids from these deposits indicate that the earliest quartz veins
were associated with the precipitation of the sulphide assemblage. With time, the fluids
cooled and became less saline (inferred from lower T finalmelling temperatures).
227
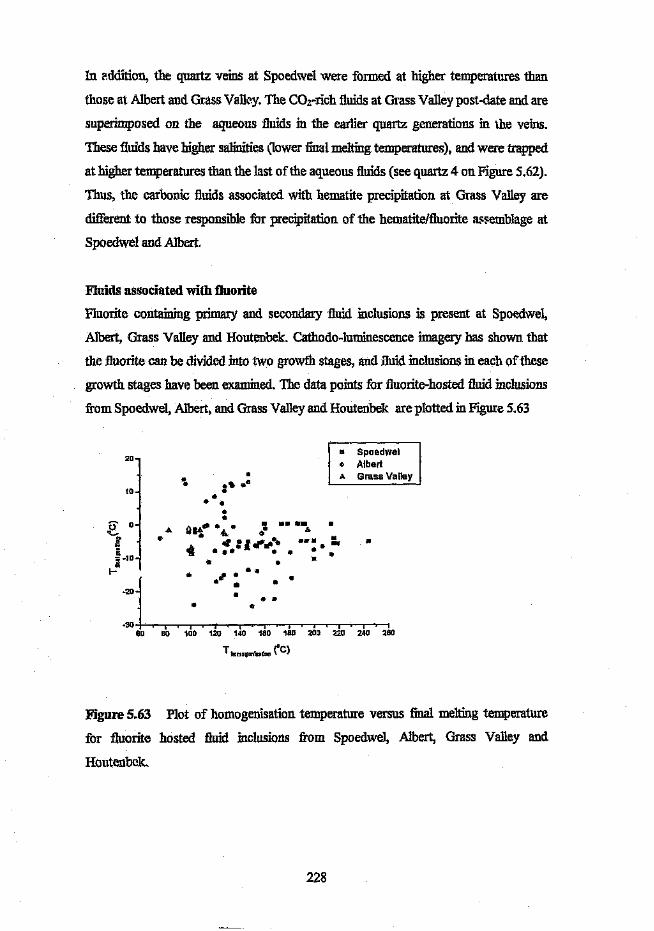
In addition, the quartz veins at Spoedwel were formed at higher temperatures than
those at Albert and Grass Valley. The CO2-rich fluids at Grass Valley post-date and are
superimposed on the aqueous fluids in the earlier quartz generations in the veins.
These fluids have higher salinities (lower final melting temperatures), and were trapped
at higher temperatures than the last of the aqueous fluids (see quartz 4 on Figure 5.62).
Thus, the carbonic fluids associated with hematite precipitation at Grass Valley are
different to those responsible for precipitation of the hematite/fluorite assemblage at
Spoedwel and Albert.
Fluids associated with fluorite
Fluorite containing primary and secondary fluid inclusions is present at Spoedwel,
Albert, Grass Valley and Houtenbek. Cathodo-luminescence imagery has shown that
the fluorite can be divided into two growth stages, and fluid inclusions in each of these
growth stages have been examined. The data points for fluorite-hosted fluid inclusions
from Spoedwel, Albert, and Grass Valley and Houtenbek are plotted inFigure 5.63
to•
... ~fI•
B spcedwet.. AlbertA Grass Valley
20
•• •••tJj II II... QI
A l}1I~ • 4. .~. A.. .A ., : ,.,,,..,, II... . :.
'1l e .... It. • •••
wj-30 -+eo"""""-'sb"-'--10T"",o~'-1,..io-·.-1.,.40-T""' -'1J-o-s- -18"O""T'-2T"~O~'r-2"'~O~'2-r~-0-e- ""2~0
T homooon1<2t1on (DC)
.. ..,. .' .. ... •• e.. .. ..• ..
Figure 5.63 Plot of homogenisation temperature versus final melting temperature
for fluorite hosted fluid inclusions from Spoedwel, Albert, Grass Valley and
Houtenbek.
228

Primary fluid inclusions along growth zones in two generations of fluorite have been
recognised at Spoedwel. The first generation of fluorite contains fluids that are not
particularly saline (between 0 and 6.5 wt. % eNaCl») and trapped at relatively high
temperatures (above 200°C). The highest temperature for minimum entrapment is
270°C, but the majority of data points fall within the range l30De to 150DC.The fluid
inclusions with the lower final melting temperatures (i.e. -4°C) have higher
homogenisation temperatures. These fluids are also present in the fluorite at
Houtenbek. .~ -;most saline fluids (17 wt. % eNaCl; T final melting -l3°C; Th 128°C to
200 "C) occur in the second generation of fluorite at Spoedwel. These fluids contain
Ca (producing a brown mosaic on freezing and with Te -52°C). A higher-temperature
fluid inclusion assemblage with similar salinites is present at Houtenbek. Houtenbek
fluorite does not contain any of the lower-temperature fluid inclusion assemblages
recognised at Albert, and Grass Valley.
The fluids have been categorised and are represented in Figure 6.64 which plots the
different fluids in fluorite-hosted fluid inclusions from Spoedwel, Albert and Grass
Valley. Note the overlap of temperature ranges. of the saline fluids and the non-saline
fluids, implying that both fluids were circulating at the same time and that interaction
between them probably took place. Supporting evidence for the interaction between
magmatic and connate fluids in similar temperature ranges which are associated with
two generations of fluorite was also recognised by Plumlee et 'II. (1995) in the genesis
of the Illinois-Kentucky fluorite deposits.
At the Albert silver deposit, three main fluid populations have been recognised in the
fluorite. The fluids associated with the first fluorite generation are high temperature (T,
218°C to 273 0C), and contain little or no Ca (no brown mosaic was produced and T" -
33°C). Eutectic melting temperatures suggest that MgClz may be present in the fluids.
Final melting temperatures (-4.8 °C to -3.2 "C) and salinities (7.2 to 5 wt, % eNaCl) fall
in the range of values recorded for the fluids associated with fluorite 1 at Spoedwel.
The fluids associated with the second generation of fluorite correlate with those in the
second generations of fluorite at Spoedwel.
229
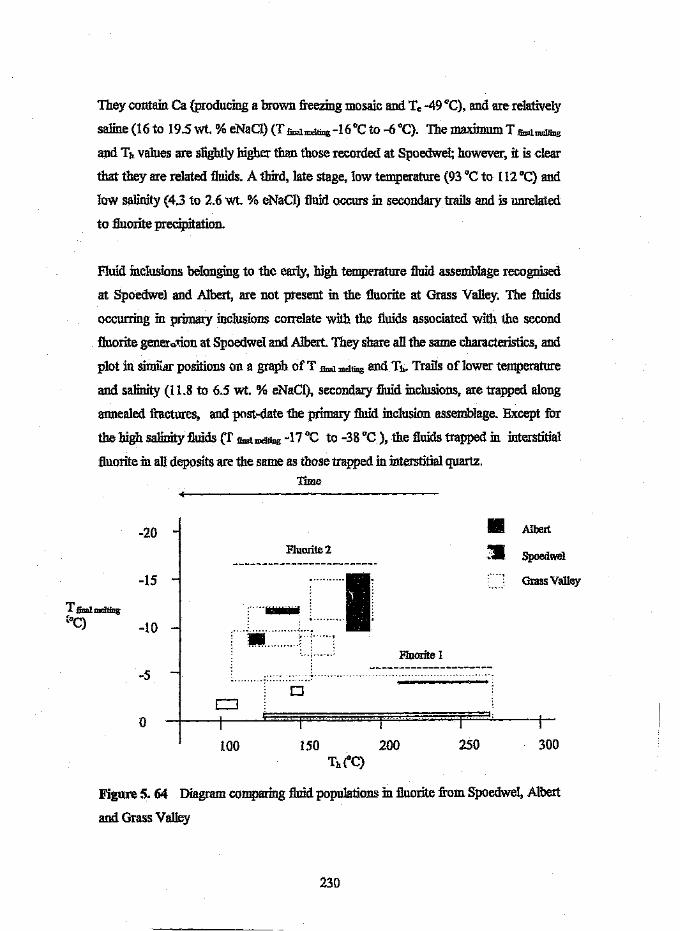
They contain Ca (producing a brown freezing mosaic and T" -49 "c), and are relatively
saline (16 to 19.5 wt. % eNaCl) (T finalmelting -16°C to -6 QC). The maximum T Jinalmelting
and Tit values are slightly higher than those recorded at Spoedwel; however, it is clear
that they are related fluids. A third, late stage, low temperature (93°C to 112 "C) and
low salinity (4.3 to 2.6 wt. % eNaCl) fluid occurs in secondary trails and is unrelated
to fluorite precipitation.
Fluid inclusions belonging to the early, high temperature fluid assemblage recognised
at Spoedwel and Albert, are not present in the fluorite at Grass Valley. The fluids
occurring in primary inclusions correlate with the fluids associated with the second
fluorite genersxion at Spoedwel and Albert. They share all the same characteristics, and
plot in similar positions on a graph of T Jinal melting and Th. Trails of lower temperature
and salinity (11.8 to 6.5 wt. % eNaCI), secondary fluid inclusions, are trapped along
annealed fractures, and post-date the primary fluid inclusion assemblage. Except for
the high salinity fluids (T Jlual melting -17°C to -38 "C ), the fluids trapped in interstitial
fluorite in all deposits are the same as those trapped in interstitial quartz.Time
-20Fluorite 2
• Albert
:11 Spoedwel
Grass Valley-15
-10 .............Fluorite 1
-5
o100 150 200 250 300
Figure 5. 64 Diagram comparing fluid populations in fluorite from Spoedwel, Albert
and Grass ValIey
230
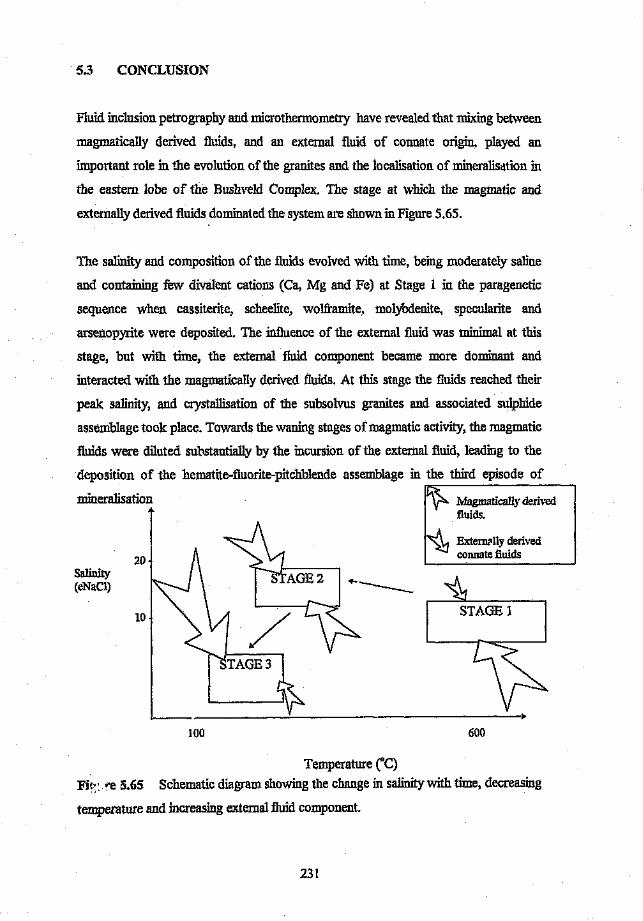
5.3 CONCLUSION
Fluid inclusion petrography and microthermometry have revealed that mixing between
magmatically derived fluids, and an external fluid of connate origin, played an
important role in the evolution of the granites and the localisation of mineralisation in
the eastern lobe of the Bushveld Complex. The stage at which the magmatic and
externally derived fluids dominated the system are shown in Figure 5.65.
The salinity and composition of the fluids evolved with time, being moderately saline
and containing few divalent cations (Ca, Mg and Fe) at Stage 1 in the paragenetic
sequence when cassiterite, scheelite, wolframite, molybdenite, specularite and
arsenopyrite were deposited. The influence of the external fluid was minimal at this
stage, but with time, the external fluid component became more dominant and
interacted with the magmatic ally derived fluids. At this stage the fluids reached their
peak salinity, and crystallisation of the subsolvus granites and associated sulphide
assemblage took place. Towards the waning stages of magmatic activity, the magmatic
fluids were diluted substantially by the incursion of the external fluid, leading to the
deposition of the hematite-fluorite-pitchblende assemblage in the third eplsode of
mineralisation Magmatically derivedfluids.
20Externally derivedconnate fluids
Salinity(eNaCl)
STAGE 1
100 600
Temperature eC)Fi«: "e 5.65 Schematic diagram showing the change in salinity with time, decreasing
temperature and increasing external fluid component.
231
CHAPTER 6
QUANTITAmTE FLUID 1NCLUSION ANALYSIS
Fluid inclusion microthermometry does not provide conclusive quantitative data
regarding the composition of the fluids associated with mineralisation. It is possible
only to presume the presence of certain elements on the basis of the eutectic melting
temperatures and the intermediate and final melting temperatures. This technique does
not adequately solve the question of exactly which metals/elements are present in the
fluids, and in what concentrations. For this reason, PIXE analysis, Raman
Spectroscopy and Quadrupole Mass Spectrometry were undertaken. The results of
these analytical techniques are presented within the paragenetic framework established
in Chapter 4, and linked to the major fluids recognized during microthermometry
(Chapter 5).
6.1 PIXE .A..~ALYSIS
PIXE analysis of selected fluid inclusions was carried out at the National Accelerator
Center in Faure, South Africa. At present, this technique provides an accurate
assessment of most of the elements present in the fluid inclusions (see following
paragraphs).
OVERVIEW
Proton-Induced X-Ray Emission (PIXE) analysis on individual fluid :inclusions was first
attempted by Hom (1983) and Hom and Traxe1 (1985, 1987). This method of
spectroscopic analysis enables in situ analysis of unopened fluid inclusions, being non-
destructive, and provides qualitative and semi-quantitative data on the fluid inclusion
contents.
The application of this method to fluid inclusions has been investigated by Anderson et al..
(1989), Ryan et at. (1991), Heinrich et al. (1992), Ryan et al. (1993), Ryan et at. (1995)
and others.
232
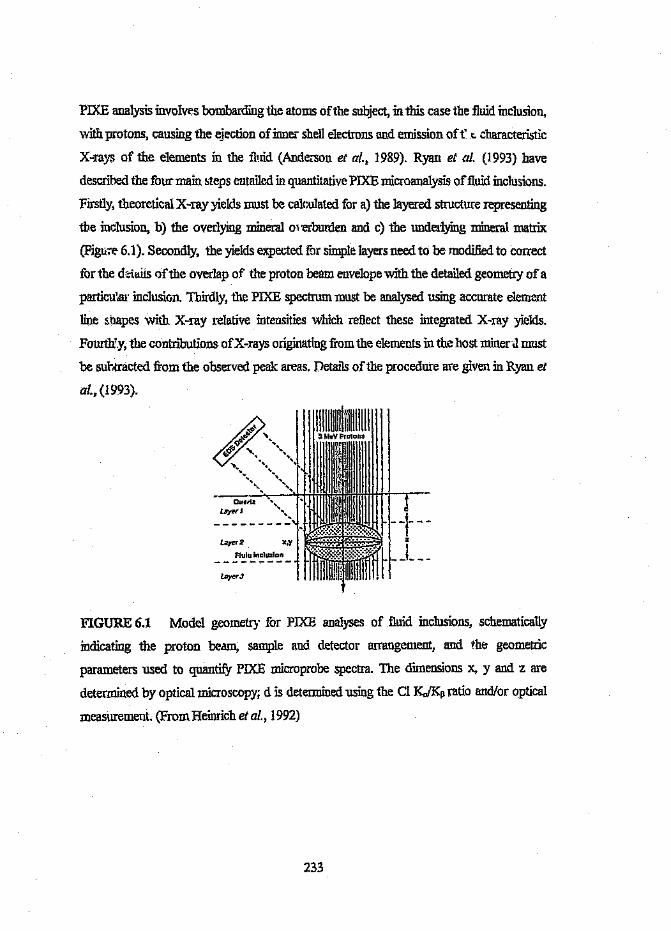
PIXE analysis involves bombarding the atoms of the subject, inthis case the fluid inclusion,
with protons, causing the ejection of inner shell electrons and emission of t' t. characteristic
X-rays of the elements in the fluid (Anderson et al., 1989). Ryan et at. (1993) have
described the four main steps entailed in quantitative PIXE microanalysis of fluid inclusions.
Firstly, theoretical X -ray yields must be calculated for a) the layered structure representing
the inclusion, b) the overlying mineral overburden and c) the underlying mineral matrix
(FigU7(, 6.1). Secondly, the yields expected for simple layers need to be modified to correct
for the details of the overlap of the proton beam envelope with the detailed geometry of a
particu'ar inclusion. Thirdly, the PIXE spectrum must be analysed using accurate element
line shapes with X-ray relative intensities which reflect these integrated X-ray yields.
Fourth'y, the contributions of X-rays originating from the elements in the host minerJ must
be subtracted :from the observed peak areas. Details of the procedure are given in Ryan et
al., (1993).
FIGURE 6.1 Model geometry for PIXE analyses of fluid inclusions, schematically
indicating the proton beam, sample and detector arrangement, and the geometric
parameters used to quantify PIXE microprobe spectra. The dimensions x, y and z are
determined by optical microscopy; d is determined using the Cl Ka.t:Kp ratio andlor optical
measurement. (From Heinrich et al., 1992)
233
All elements heavier than Si (Anderson et al., 1989) or where the atomic number (Z) >16
(Ryan et al., 1991) are detected using this method. The lighter elements of interest to
geologists, such as Li and Na, are not detected even though their concentration may be
significant. The heavier elements are detected at concentrations as low as a few ppm. The
detection and quantification of sulphur is difficult and unreliable (Heinrich et al., 1992).
There are several limitations or restrictions to PIXE analysis. The energy loss of the protons
penetrating the mineral host affects the yield of the X-rays fi:om the fluid inclusion. The
absorption of the induced X-rays by the host mineral also influences the sensitivity of the
method. The degree of absorption is a function of the depth of the inclusion below the
mineral surface, the take-off angle, the composition and density of the host mineral and the
energy of the emitted X-rays (Anderson et al., 1989). Thus, the depth below surface is a
critical consideration when selecting suitable inclusions for PIXE analysis, since the quality
ofthe results deteriorates with increasing depth.
The size and shape of the inclusions also influences the sensitivity of the method. Large
euhedral inclusions (>10microns in diameter) at depths between 5 and 15 microns are the
most suitable for optimal PIXE sensitivity (Ryan et al., 1991).
The fluid inclusion geometry and the depth below surface are critical factors when it comes
to quantification of PIXE yields. Deviations from the model's ideal conditions are not
accounted for. Since fluid inclusions are rarely perfectly euhedr "\d errors in the
estimation of geometrical parameters are unavoidable, a degree of uncertainty in the
extracted elemental concentrations is introduced. In addition, the nature of fluid inclusion
(vapour bubble and solid phases) further compounds the degree of uncertainty in the
quantitative analysis of the inclusion contents.
EQUIPMENT
A preliminary investigation of selected fluid inclusion using the PIXE technique was
undertaken at the National Accelerator Centre (NAC), Faure, South Africa. A focused
raster-scanned proton beam of 3 micron diameter spot size was applied to the individual
inclusions bathing tte entire inclusion in an even dose of protons. In cases where the
inclusions are smaller than the spot size, the surrounding quartz matrix is also excited.
234
Using a beam of3 MeV protons, each part of the inclusion was exposed to a uniform dose
of protons, thus improving the accuracy and reproducibility of the results. The beam
currenr was set between 250 and 700 pA The beam incidence was normal to the sample
surface and the detector take-off angle was 45<>.
SAMPLE IltJATERIAL
Fluid inclusions were specifically selected from Grass Valley, Spoedwel, Albert and
Leeufontein in order to obtain information on th fluids associated with each of the major
stages in the paragenetic sequence. The fluid inclusions selected from Grass Valley are
associated with quartz growth in two generations of quartz preceding cassiterite
precipitation. The fluids associated with the second generation of interstitial quartz material
at Spoedwel, which contains highly saline fluids and numerous solid phases, as well as
fluids associated with quartz vein-hosted sulphides at Albert, were selected as
representatives of later fluids associated with the sulphide assemblage. The fluids
associated with albitisation and tourma1inisation, which post-date the sulphide assemblage,
were selected from Leeufontein. i....lore detailed accounts of the fluid inclusions are given
below, Sketches of the inclusions ?J1dtheir characteristics are shown inTable 6.1.
GrJSS Valley
Fluid inclusions hosted by the two quartz generations preceding cassiterite precipitation
have been probed. They are secondary inclusions and microthermometry suggests that they
are not particularly saline, melting between _2°C and -4°C. They were trapped at low
temperatures (homogenisation between 130°C and 160°C). These fluids are not the same as
the high temperature (600°C) fluids at Zaaiplaats. Rather, these fluids rna)' be associated
with tin remo bilization, thus accounting for the low temperature ranges measured.
SpoedwelThe inclusions probed are hosted by the second generation of interstitial quartz and belong
to the population of inclusions containing hematite daughter crystals. Microthermometry of
this fluid population suggests the presence of CaCh, NaC~ KC~ and H~O.The phase
relationships in the simple CaC}z-NaCI-H20 system, which does not take into account all
known solutes, suggest salinities of between 18 and 24 wt. %.
235

At least six daughter crystals from eleven possible solid phases have been observed in any
one inclusion in this population, including hematite, two opaque phases, FeCh, halite,
sylvite, and smaller unidentified crystals.
Albert
These inclusions are primary, occurring in vein quartz which contains euhedral pyrite
crystals and minor sphalerite. During microthermometry, these inclusions freeze at
moderate temperatures and do not suggest the presence of CaCho However, eutectic
melting is in the range -40°C to -50°C, suggesting the presence of divalent cations in
solution. Final melting temperature for this inclusion is -17°C, but the other fluid inclusions
in the assemblage sbowwide ranges of melting temperatures. Homogenisation of1iquid and
vapour occurs between 128°C and 214°C.
Leeufontein
These are quartz-hosted fluid inclusions in a tourmaline spheroid. The fluid is moderately
saline, which is indicated by final melting temperatures between -10°C and -20°C. Daughter
crystals commonly include halite and sylvite. Homogenisation occurs at relatively low
temperatures (85 to 11S°C). Two categories of fluid inclusions have been recognised,
those with liquid and vapour, and those with ,: .J.uid,vapour and solid phases.
Synthetic fluid inclusions
Synthetic quartz-hosted fluid inclusions containing NaCl and KCl solutions of eutectic
compositions (23.2 wt % l'i'aCl and 19.6 wt % KCl) were used for comparison in the
quantification of PIXE yields. Sketches of the inclusions are shown in the following
table and in the appendix.
236

Table 6.1 Table of sample material selected for PIXE analysis from Spoedwel,
Albert, Grass Valley and Leeufontein.
DEPOSIT SAMPLENO.
COMMENTS
Spoedwel SP2
Spoedwel OF
Albert RPIIA
Grass Valley GV02
Leeufontein TBOI
Synthetic fluid inclusionsTBOIANaCI
KCl
SKETCH
A~
B/OFA@J
OFBoo
A&B ~TBOIBI
VTBOIBl3
"'<&.::§J
c=::D:J
Fluid inclusions in interstitial quartz of medium- tofine-grained hypersolvus granite. The fluid inclusionassemblage is associated with the second episode ofquartz precipitation at Spoedwel, as well as thesulphide assemblage.As above.
Fluid inclusion in pyrite- and sphalerite-bearingquartz vein hosted by fine-grained granite.Aqueous inch.sions in pegmatitic quartz precedingcassiterite precipitation. Fluid inclusions A and B arefrom consecutive growth stages in the crystal.Fluid inclusions in quartz intergrown withtourmaline in late stage spheroids hosted by fine-grained Klipkloof granite.
Primary fluid inclusion in tourmaline .
Fluid inclusions hosted by synthetic quartz producedby FLUID INC., and used for calibration purposes,The composition of these inclusions is known to be23.2wt % NaCI and 19.6 wt % KCl.
·METHODS
Doubly polished rock wafers (150 microns in thickness) were surveyed for large inclusions
(10-20 microns) located at shallow depths (less than 20 microns) beneath the sample
surface. The relationship between fluid inclusions were carefully mapped in three
dimensions to allow easy relocation ofthe inclusion of interest when in the sample chamber
of the microprobe.
Alphabetically marked copper and nickel Maxtaform Finder Grids (200 mesh, 127 microns
pitch) were glued on to the sample with UHU-stic® or Pritt® to assist in easy relocation of
the appropriate field of view and the selected inclusions (Figure 6.2).The sample was then
mounted onto metal (Al) sample holders by evaporating de-ionised water from the 0.4
237
micron Formvar® film on the sample holder. The depth below surface, as well as the
vertical dimensions of the inclusion, were measured using a graduated ocular.
The sample holder was then mounted on to an X-Y mobile stage at an angle normal to the
beam path. The location of inclusions using a transmitted light petrographic microscope
with a 45° take-off angle proved unreliable. Instead, :finder grids were mounted onto the
sample surface and the co-ordinates of inclusions with reference to the grids were first
measured off-line using a transmitted light petrographic microscope. During microprobe
measurements, a preliminary, short raster scan (about 30s) was necessary to obtain a total
X-ray map with dominant signal coming from the :finder grid. This allowed selection of the
longer raster scan in the right area above a selected fluid inclusion, using true elemental
imaging (Ryan et al.,1995; Ryan and Jamieson, 1993). Ideally, the inclusions were
positioned in the middle of grid holes in order to minimise the signal from the grid from
interfering with the PIXE spectrum from the sample. Such ideal positioning was usually
difficult to achieve. The presence of these peaks in the PIXE spectrum from fluid inclusion
was the only drawback of this procedure, which was otherwise rather fast and reliable.
The data were collected during two separate visits to NAC. On the first occasion, copper
:finder grids were pasted on with Uhu-stic®, and the samples were not carbon coated. On
the second visit, nickel grids were used instead of copper grids, because Cu is known to be
present in the mineralising system Thus, contamination of the Cu values obtained from the
fluid inclusions by an external source was avoided. Carbon coating was necessary to
prevent charging ~fthe nickel grid, a situation not encountered with the copper grid.
'The calculation of PIXE yields was done in generic form using the GeoPIXE software
package (Ryan et al., 1990). 'The yields of eacl. x-rayline for each major and trace element
were integrated to include contributions along the slowing down path of the proton beam
including secondary X-ray fluorescence and absorption effects iu the fluid and surrounding
mmeral along the X-ray path +0 the detector (Heinrich et al., 1992). The PIXE spectra
were analysed using element line shapes constructed using X-ray relative intensities
deduced directly from the individual X-ray yields for a particular inclusion geometry and
corrected for the efficiency of the EDS detector and the attenuation caused by X-ray
absorbers used to reduce the intensity of Si X-ray lines from the quartz matrix and to stop
238
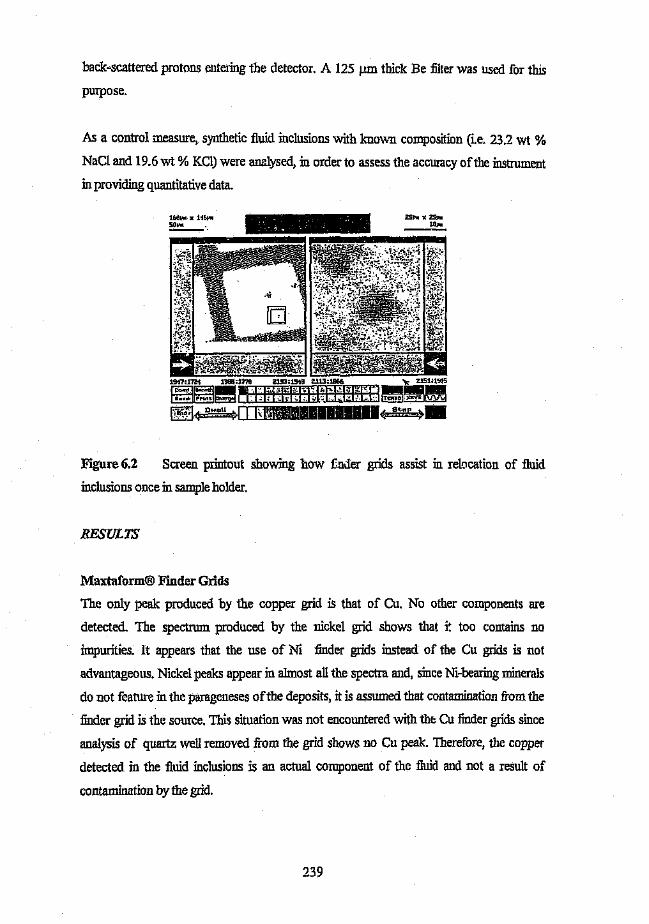
back-scattered protons entering the detector. A 125 urn thick Be filter was used for this
purpose.
As a control measure, synthetic fluid inclusions with known composition (i.e. 23.2 wt %
NaCl and 19.6 wt % KCl) were analysed, ill order to assess the accuracy of the instrument
illproviding quantitative data.
160J.I!II x 1i&.,.so ....
Figure 6.2 Screen printout showing how Ender grids assist ill relocation of fluid
inclusions once illsample holder.
RESULTS
Maxtaform® Finder Grids
The only peak produced by the copper grid is that of Cu. No other components are
detected. The spectrum produced by the nickel grid shows that i~ too contains no
impurities. It appears that the use of Ni finder grids instead of the Cu grids is not
advantageous. Nickel peaks appear ill almost all the spectra and, since Ni-bearing minerals
do not feature ill the parageneses Ofthe deposits, it is assumed that contamination from the
finder grid is the source. This situation was not encountered with the Cu finder grids since
analysis of quartz well removed from the grid shows no Cu peak. Therefore, the copper
detected ill the fluid inclusions is an actual component of the fluid and not a result of
contamination by the grid.
239
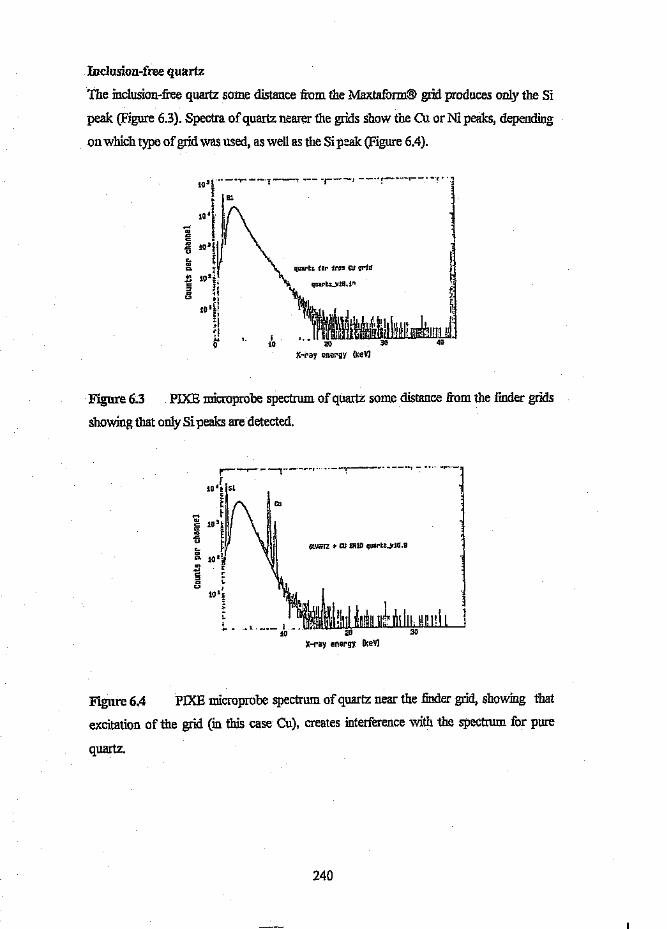
Inclusion-free quartz
The inclusion-free quartz some distance from the Ma.xtaform® grid produces only the Si
peak. (Figure 6.3). Spectra of quartz nearer the grids show the Cu or Ni peaks, depending
on which type of grid was used, as well as the Si peak (Figure 6.4).
Figure 6.3 PIXE microprobe spectrum of quartz some distance from the finder grids
showing that only Si peaks are detected.
'"....c:su I
10 '=>LI....... .·L
Figure 6.4 PIXE microprobe spectrum of quartz near the finder grid, showing that
excitation of the grid (in this case Cu), creates interference with the spectrum for pure
quartz.
240
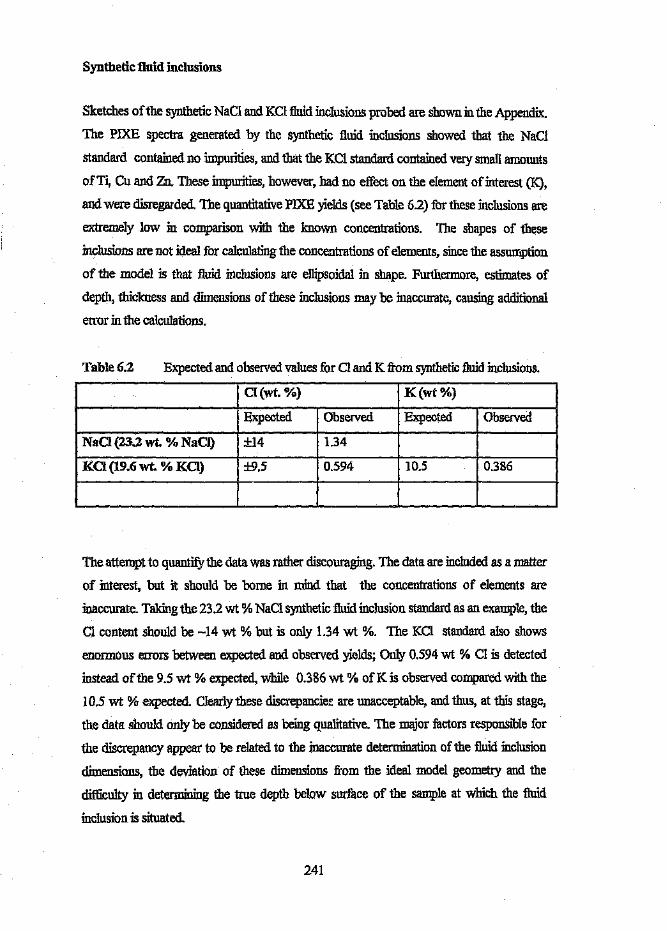
Synthetic fluid inclusions
Sketches ofthe synthetic NaCI and KCI fluid inclusions probed are shown in the Appendix.
The PJXE spectra generated by the synthetic fluid inclusions showed that the NaCl
standard contained no impurities, and that the KCl standard contained very small amounts
of Ti, Cu and Zn. These impurities, however, had no effect on the element of interest (K),
and were disregarded. The quantitative PIXE yields (see Table 6.2) for these inclusions are
extremely low in comparison with the known concentrations. The shapes of these
inclusions are not ideal for calculating the concentrations of elements, since the assumption
of the model is that fluid inclusions are ellipsoidal in shape. Furthermore, estimates of
depth, thickness and dimensions of these inclusions may be inaccurate, causing additional
error in the calculations.
Table 6.2 Expected and observed values for Cl and K from synthetic fluid inclusions.
Cl(wt. %) K(wt%)
Expected Observed Expected Observed
NaCl (23.2wt. % NaCl) ±14 1.34
KCI (19.6 wt. % KG) ±9.5 0.594 10.5 0.386
The attempt to quantify the data was rather discouraging. The data are included as a matter
of interest, but it should be borne in mind that the concentrations of elements are
inaccurate, Taking the 23.2 wt % NaCl synthetic fluid inclusion standard as an example, the
Cl content should be -14 wt % but is only 1.34 wt %. The KCl standard also shows
enormous errors between expected and observed yields; Only 0.594 wt % Cl is detected
instead of the 9.5 wt % expected, while 0.386 wt % ofK is observed compared with the
10.5 wt % expected. Clearly these discrepancies are unacceptable, and thus, at this stage,
the data should only be considered as being qualitative. The major factors responsible for
the discrepancy appear to be related to the inaccurate determination of the fluid inclusion
dimensions, the deviation of these dimensions from the ideal model geometry and the
difficulty in determining the true depth below surface of the sample at which the fluid
inclusion is situated.
241

Fluid inclusions
Petrographic maps and PIXE spectra for each of the inclusions probed are shown in the
Figures 6.5 to 6.10. In each of these figures, a petrographic map indicating fluid inclusion
relationships and microthermometry, as well as the PIXE spectrum produced by probing
the selected inclusion(s), is shown. The quantitative results are shown in Table 6.3. The
table indicates the concentration (in parts per million) of elements present in each sample.
The samples are arranged in deposits, starting from the earliest fluids in the Grass Valley
samples, through to the latest fluids associated with albitisation and tourmalinisation at
Leeufontein.
The concentrations of'K, Ca and CI are shown in the bar chart in Figure 6.11. The fluids at
Grass Valley are depleted in these elements in comparison with Spoedwel, Albert and
Leeufontein, The Spoedwel fluids contain the highest concentration ofK and Ca. At Albert
K is more abundant than Ca, while the opposite is observed at Spoedwel, The fluids in tile
tourmaline ball are enriched in Ca. The elements associated with the sulphide asseml. 'age
are shown in Figure 6.12. As with Cl, Ca and K, the Grass Valley fluids do not contain
significant amounts of these elements. However, the Spoedwel fluids contain significant
amounts of these components. The abundance of the elements progressively decreases at
Albert and Leeufontein. A similar pattern is abserved in the Fe content of the fluids (Figure
6.13). Spoedwel fluids contain the greatest amount of dissolved Fe, and lesser amounts are
present at Albert and Leeufontein, The early fluids at Grass Valley contain virtually no Fe.
S was not easily detected, with Grass Valley fluids containing the only significant amounts
(Figure 6.14), The concentration ofREE's (Ga, Br and Rb) are plotted with Sand Cl in
Figure 6.15. The abundance of these elements at Spoedwel is noteworthy, compared to the
total absence at Albeit and Grass Valley. The tourmaline spheroids contain small amounts
of Br and Rb. Manganese and titanium were also detected in the fluids, but at lower
concentrations than Fe (Figure 6. I 6). The Fe, K and Ca content of the fluids are plotted on
a ternary diagram (Figure 6.1 7), which shows VNO clusters of data points. The data points
at the Fe apex are :from Spoedwel, Albert, and Leeufontein tourmaline, while the points in
the centre of the diagram are from Grass Valley and Spoedwel.
242
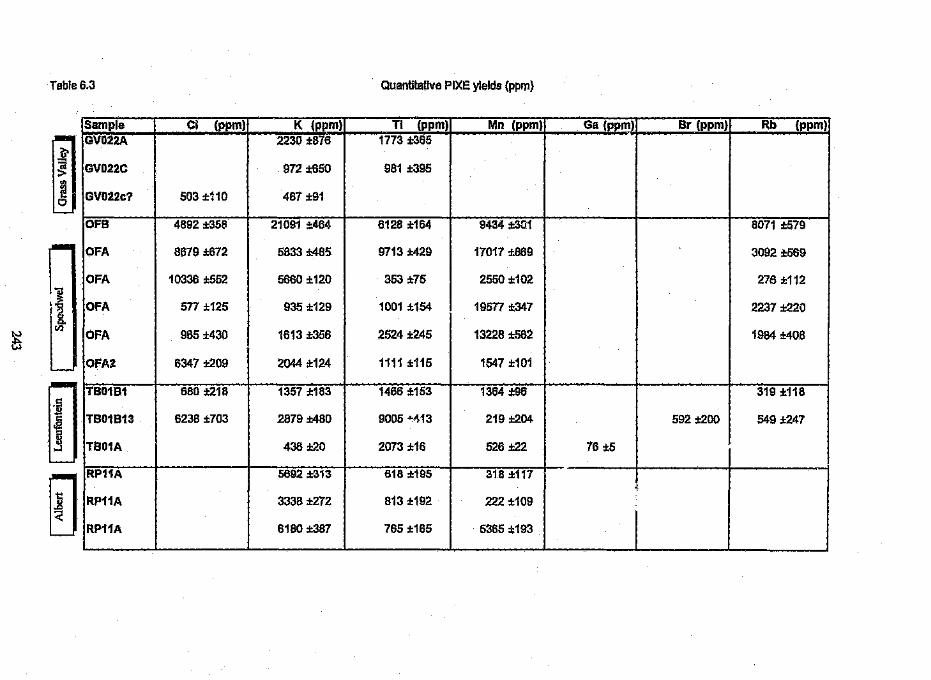
Table 6.3 Quantitative PIXE yields (ppm)
N~
Sample CI (ppm) K (ppm) Ti (ppm) Mn (ppm) Ga (ppm) Br (ppm) Rb (ppm)
IGV022A 2230 :1:876 1773 :1:365
GV022C 972 ;t650 981 ±395
GV022c? 503 ±~10 467 ±91
OFB 4892 ±3SS 21091 :l:464 6128 ±164 9434 :1:301 8071 ±579
OFA 8679 ±672 5833 ±485 9713 ±429 17017 ±869 3092 ±569
OFA 10336 ±552 5660 ±120 353 :1:75 2550 ±102 275 ±112C3,.g OFA 577 ±125 935 ±129 1001 ±154 19577 :1:347 2237 ±220to
1$OFA 965 ±430 1613 ±356 2524 ±245 13228 ±562 1984 ±408
OFA2 6347 ±209 2044 :1:124 1111 ±115 1547 ±10i
T80181 680 ±218 1357 ±183 1466 :1:153 1364 :1:96 319 ±118.§
TB01813 6238 ±703 2879 ±480 9005 "'113 219 ±204 592 ±200c: 549 ±247.s::l..,..,
TBOiA 436 ±20 2073 ±16 526 ±22 76 :1:5.....l
-]
RP11A 5692 :1:313 618 ±195
"a.,,7LRP11A 3338 :1:272 813 ±192 222 ±109 .
5365 ±193 _j_~________RP11A 6180 ±387 765 ±165L____~_
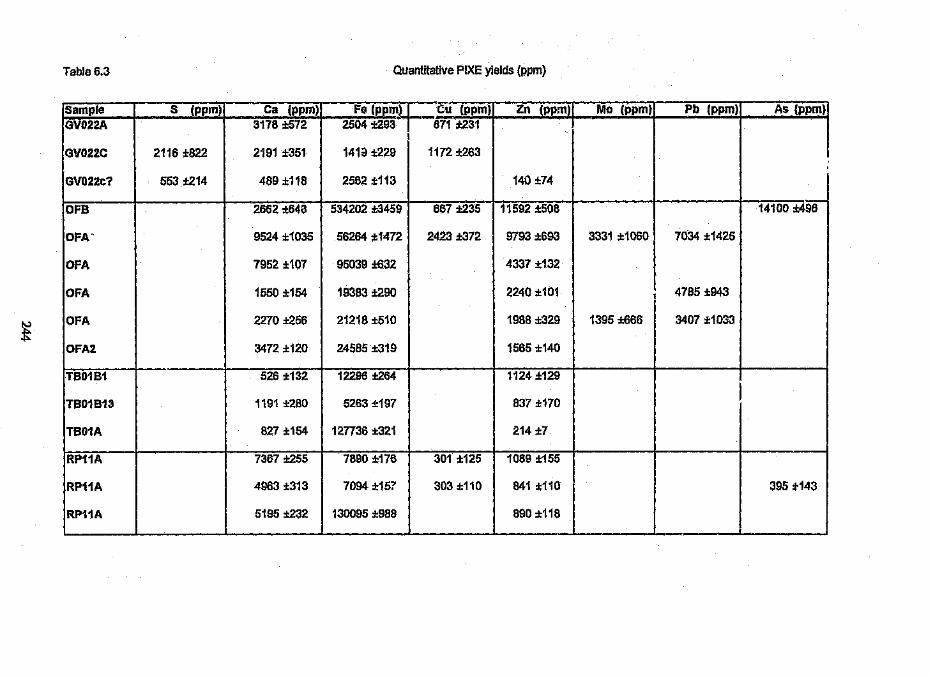
Table 6.3 Quantitative PIXE yields (ppm)
~
Sample S (ppm) Ca (ppm) Fe (PPn;')t- Cll (ppm) Zn (ppm)1 Mo (ppm) Pb (ppm) As (ppm)!GV022A 3178 ±572 2504 ±l93 871 :1:231 J I
I I
GV022C 2116 ±822 2'191 ±351 1413 ±229 1172 ±263 I
GV022c? 553 ±214 489 ±118 2562 :1:113 140 ±74 III
~. 2662 ;1:643 534202 :1:3459 667 ±235 11592 :1:508 14100 :1:496 iI
OFA 9524 ±1035 56264 :1:1472 2423 ±372 9793 :1:693 3331 :1:1060 7034 :1:1425 !I
OFA 7952 :1:107 95039 ±632 4337 ±132 I
OFA 1550 :1;154 19383 ±290 2240 :1:101 1 4785 ±943
OFA 2270 ±256 21218 :1:510 1988 ±329 1395 ±666 3407 :1:1033
OFA2 3472 ±120 24585 :1:319 1565 :1:140
TB01B1 526 ±132 12296 :1:264 1'124 :1:129
ITB01813 1191 ±280 5263 :1:197 837 ±170 ITB01A 827 ±154 127736 :1:321 214 ±7
RP11A 7367 :1:255 7890 :1:176 301 :1:125 1089 :1:155
RP11A 4963 :1:313 7094 ±157 303 :1:110 841 ±110 395 :1'143
RP11A 5195 :1:232 130095 :1:988 890 ±118~..--.-

A ~ (iJ
~
~.~ GV02C
~
~~., e
r ----~-----.-..-.--.-------,-.
[Secondary trail offluidinclusions with Tfin.t melting
_2DC to ~4°C and Th 130DC to 160 DC.
/
Figure 6.5 A) Petrographic map of quartz-hosted fluid inclusionsfrom the Grass Valley Sn deposit. The inclusions occur along theborder between quartz generations I and 2, both ofwbich precedecassiterite precipitation.B) PIXE microprobe spectrum (Q = 115 nC, 1:= 250
pA) of inclusion C (depth O.571J.m, thickness2.28!lm, dimensions 16!lmX 12!lm)insketch A), indicating the presence ofCa, Fe andCu.
C) Enlargement of portion of B) in which S, K andCa peaks become more obvious.
B
1500
\.....OJc::c::lt1s:l..>
.\I:.w0.
~
I/).f-'
SC:J
8
f ~f spectrumGV0?2CJI49.17 enla~ged par.
6._~
42X-ray energy (keV)C
Ni
Hi
.....a,'c::c::It)
-5 102
'-OJ0.
I/)oWc;;;;)
cw
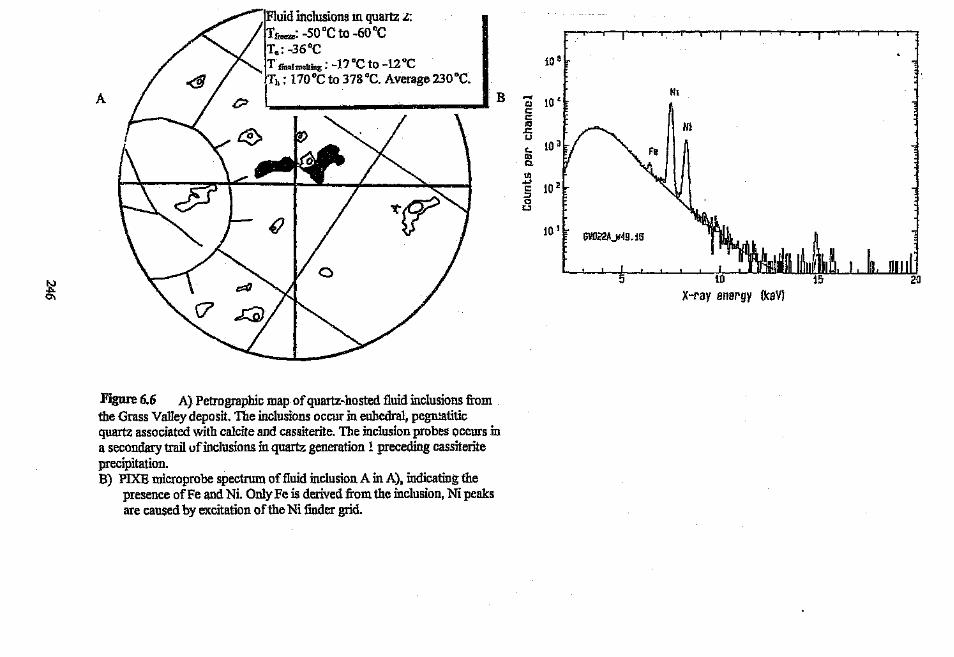
A
inclusions in quartz z:. -50 DC to -60 "C
'm.lmolting: _17°C to -12°Ch : 170 DCto 378°C. Average 230 DC.
IV8;
Flgura 6.6 A) Petrographic map of quartz-hosted fluid inclusions fromthe Grass Valley deposit. The inclusions occur in euhedral, pegmatiticquartz associated with calcite and cassiterite. The inclusion probes occurs ina secondary trail uf inclusions in quartz generation 1 preceding cassiteriteprecipitation.B) PIXE microprobe spectrum of fluid inclusion A in A), indicating the
presence of Fe and Ni. Only Fe is derived from the inclusion, Ni peaksare caused by excitation of the Ni finder grid.
B ....,C'Jc:c:Itls:uc,OJC.
til.....c:::J0U
105
I'll10 '
Ni
102
10 I GV022A_w49_ i6
5(keV)
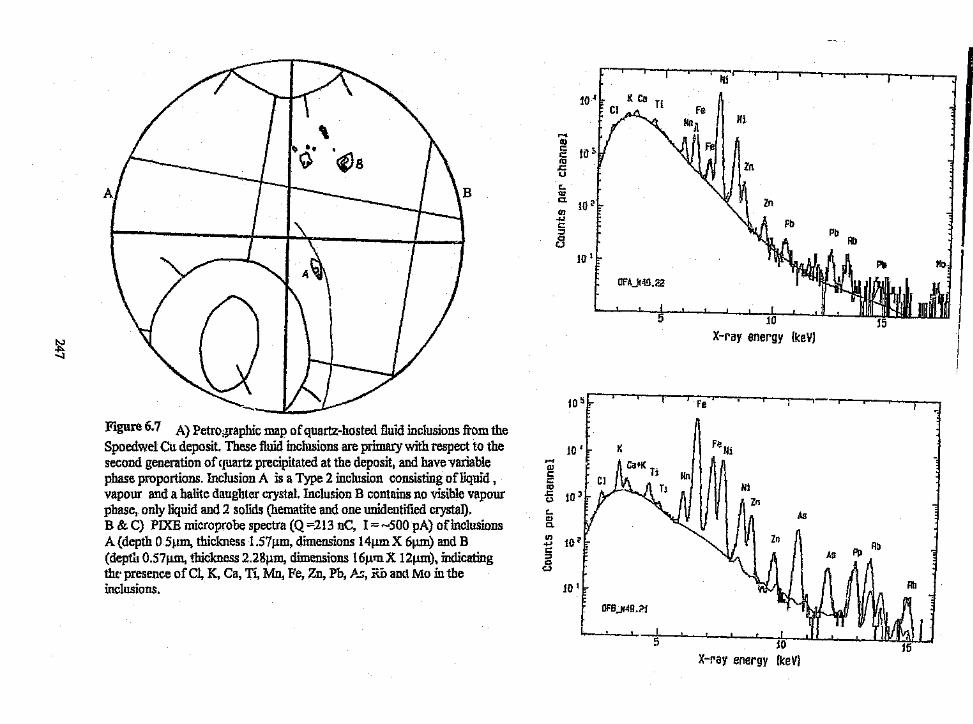
tv-l'>--.J
'1i-.r---r---r-r--r--,,......--r--.-r--r----.
Hi
104-,\
~
.....OJ. c:
~Bc:ros:uc..QlCl. 102(IJ_,_,C::J0U
1{}'~
Of'AJ'I49_22
-L_
s
Figure 6.7 A) Petrographic map of quartz-hosted fluid inclusions from theSpoedwel Cu deposit. These fluid inclusions are primary with respect to thesecond generation of quartz precipitated at the deposit, and have variablephase proportions. Inclusion A is a Type 2 inclusion consisting of liquid ,vapour and a halite daughter crystal. Inclusion B contains no visible vapourphase, only liquid and 2 solids (hematite and one unidentified crystal).B & C) PIXE microprobe spectra (Q =213 nC, r = ~500 pA) of inclusionsA (depth 0 SIlID, thickness 1.S7J.lID,dimensions 14J.lmX 61lm) and B(depth 0.571lUl, thickness 2.281lUl, dimensions 16J.ltUX 12J.lm), indicatingthe presence of CI, K, Ca, Ti, Mn, Fe, Zn, Ph, A:;, KD and Mo in theinclusions.
Zn
,oj I." I 111111!lNllt ""~1I11l I
i 10 15 IX-ray energy (keV) I
II
.-<aJc:c:It)s::.o
As~0-
Ul....C:;lo<:.J
10'OFB_1I49.21,.
"'_-..l_--1--g I , • r ,~ d I I I /Ill{ !IVA} I J
X-ray energy

~00
Figure 6.8 A)Petrographic map of quartz-hosted primary fluid inclusionsoccurring ill tourmaline spheroids from Leeufontein.B) PIXE microprobe spectrum (Q =487 nC, 1=500 pA) of inclusion A
(depth 0.57,.un, thickness 2.28J.lm, dimensions 18JlmX 16Jlm),indicating the presence of Ca, Ti, Mn, Fe, Zn, As? And Rb in the fluids.
C) PIXE microprobe spectrum (Q =283 ne, I;:: 500 pA) of inclusion C(depth 2.14Jlm, thickness 1.71urn, dimensions 20Jlm X Sum), indicatingthe presence of Cl, K, Ti, Fe, Zn, Pb, Br and Rb in the fluids.
Bf I I Ni
104" Ca Ti
..."!?
l!oJ
.u:I.
(!J+'c:;:;,oc»
Zn
to 1
IB01BUt49.27
5.X-ray enernv (keV)
Cr--'--' -- r--.--------.-------,--------- I I I ~
~K NiTi
....OJc:c:ro.c(.)
c,iUP-
m iO 24.Jc::J0(.)
10 I
Ni
PoBr Po AU
TBDl B 13_1149.28
_,__-~--7,-_J--_-L-_,~ ( (Ill' f! hliij>.f!\Wt! llll I- 5 .n
X-ray energy (kevl
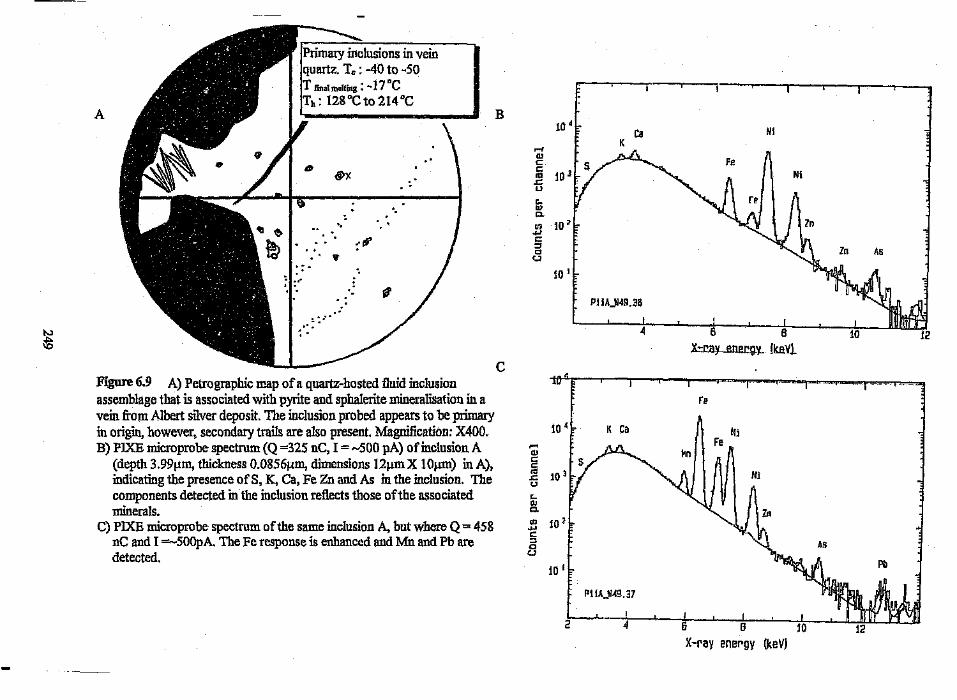
flnal melting I -17 DC
: 128°C to 214 DC
A
"
@)(
"'.
,,6''It
" ,~. :~...
".
~
Figure 6.9 A) Petrographic map ofa quartz-hosted fluid inclusionassemblage that is associated with pyrite and sphalerite mineralisation in avein from Albert silver deposit. The inclusion probed appears to be primaryin origin, however, secondary trails are also present. Magnification: X400,B) FIXE microprobe spectrum (Q =325 nC, I = ~500 pA) of inclusion A
(depth 3.99Jlm, thickness O.0856Jlm, dimensions 12!lmX l Oum) inA),indicating the presence of S, K, Ca, Fe Zn and As in the inclusion. Thecomponents detected in the inclusion reflects those of'the associatedminerals.
C) PIXE microprobe spectrum of the same inclusion A, but where Q = 458nC and I =--500pA. The Fe response is enhanced and Mn and Pb aredetected.
I ~
B104
.....OJc:c:III.cuc,Q.7C.
U"j 10 ?+'c:::J0u
10 t
Ca NlK
10
PIIAJ'I49.36
---l4
Ci;
lOl K Ca.....OJc:crc.c.uc,III0.to 10 ?....C:::l0u
10 J ~
fl1!AJi49.37
I2---4
6 8X=:ca)t_ .•energ:y_ Ike.Vl
re
X-ray energy (keV)
As
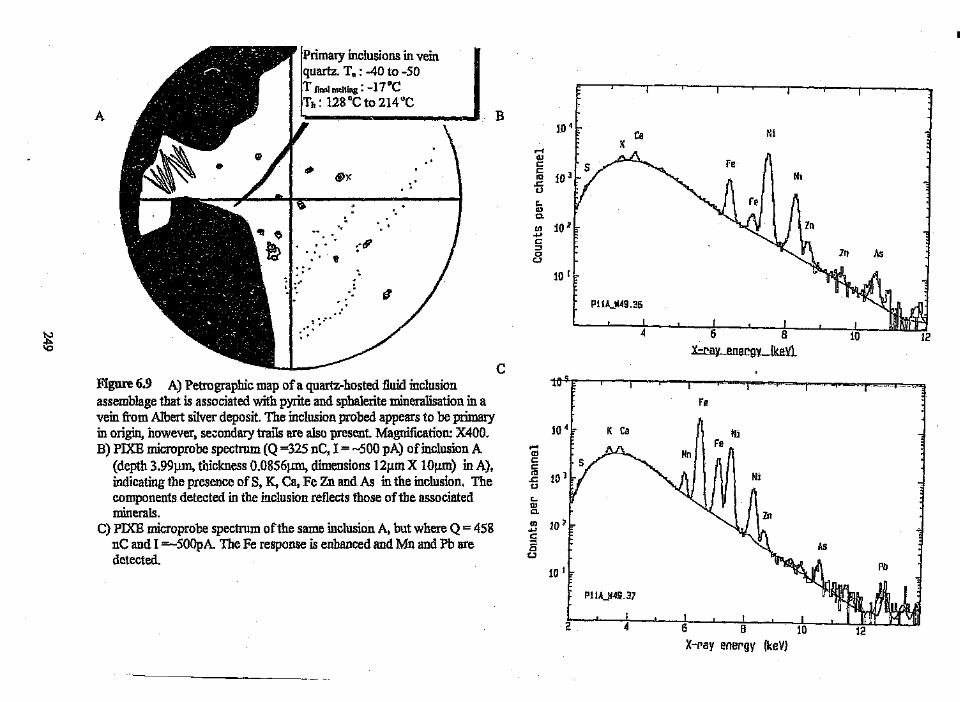
A
Primary inclusions in veinquartz. Tc: -40 to -50
~
@x
-,
"
:-6'It
-.:I;.-
r1" -_: ...'.
Figure 6.9 A) Petrographic map ofa quartz-hosted fluid inclusionassemblage that is associated with pyrite and sphalerite mineralisation in avein from Albert silver deposit. The inclusion probed appears to be primaryin origin, however, secondary trails are also present. Magnification: X400.B) PIXE microprobe spectrum (Q =325 nC, I = ~500 pA) of inclusion A
(depth 3.99~lm,thickness O.0856Ilm, dimensions 121lmX IOum) inA),indicating the presence of S, K, Ca, Fe Zn and As in the inclusion. Thecomponents detected in the inclusion reflects those of the associatedminerals.
C) PIXE microprobe spectrum ofthe same inclusion A, but where Q = 458ne and I =-500pA The Fe response is enhanced and Mn and Pb aredetected.
B IOJ--~ " HIK.....
OJC
~ 103[5uI:.11)
0..e 10 2c::::loCJ
10 I
Nl
As
PlIA~I'149 .35
cFe
....C1lct:r!l.c(..l
C-O)Cl.
.e lO:OC:::IoU
101._ Po
P1lA_!149.37
2
X-ray energy (keV}
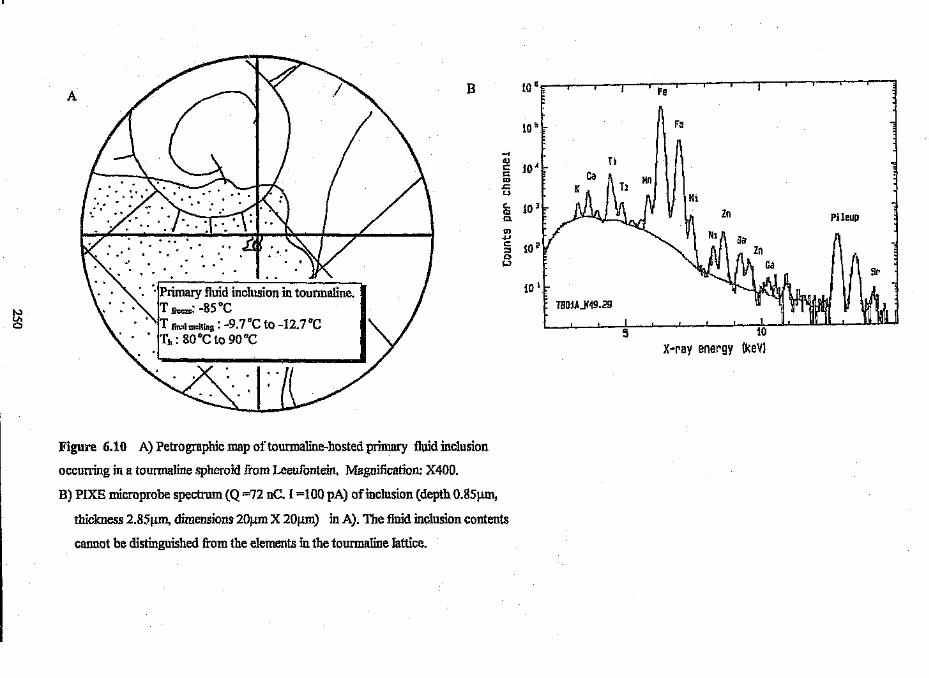
A
NVlo
B LOfif . . I • Fe
to'lL ,I F~
-<OJ
jO~ .-c:c:<Ds:uC. 103 t J~llI\ 11 11 I.UJ Znc.(J)...,c::::J0U
101I:
TBDUdM9.29_ _,___j_
5
Pileup
X-ray energy
Figure 6.10 A) Petrographic map oftourmaline-hosted primary fluid inclusion
occurring in a tourmaline spheroid from Leeufontein, Magnification: X400.
B) PIXE microprobe spectrum (Q =72 nCo 1=100 pA) of inclusion (depth O.85J.1.lll,
thickness 2.85J.1.tn,dimensions 20/J.mX 20J.l.m) in A). The fluid inclusion contents
cannot be distinguished from the elements in the tourmaline lattice.
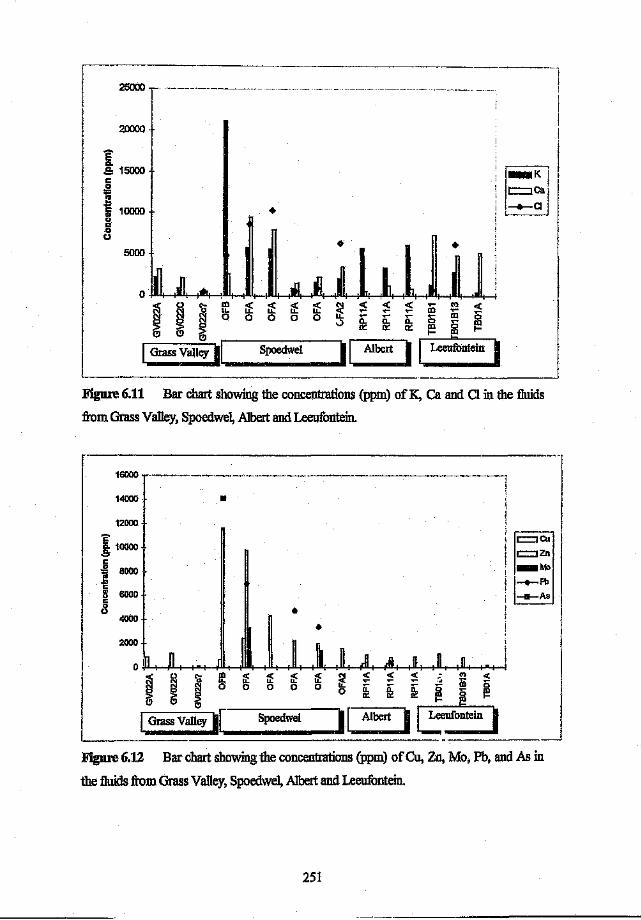
i ,~III,],.:~ ~ t ~ ~ ~ ~ ~ ~ $ $ $~ ~ ~ 0 0 0 0 0 j ~ ~ ~
(!) (!) (!) ,-----------,. ,.----""-->I Grass valley)i.. Spoedwel I[Albert II
25000 T
I_KIit=:lCll i!~a!
20000 -
5000
o
•
Figure 6.11 Bar chart showing the concentrations (ppm) of K, Ca and CI in the fluids
from Grass Valley, Spoedwel, Albert and Leeufontein.
Leeufontein I
it it it it000 0
Spoedwel
~~I~CJ CJ CJ
L_. I Grass Valley I[
I~:_M>__ f'b
__ As
JFigure 6.12 Bar chart showing the concentrations (ppm) of Cu, Zn, Mo, Pb, and As in
the fluids from Grass Valley, Spoedwel, Albert and Leeufontein.
251

~ ~ 'b fE(\l (\l ~ 0~ ~ ~(!) C> C>LGrassValley II
,0, I-I '-I
~<{ <{e- .-'e-- .,...
0 Q.. Q..0:: 0::
II Albert I
<{'e-oIl)I-
.,...MIl) ....
'0 cotIl ;;I- tIl
if Lt Lt000
Spoedwel
Figure 6.13 Bar chart showing the concentration (ppm) of Fe in the fluids from Grass
Valley, Spoedwel, Albert and Leeufontein.
~+-+-~--rIMlrl~I~I-+I-rI~f-+I-+I~f~I-+.-r~+-+-r;-+-+~+-+-+~~ ~ ~ ~ ~ ~ ~ $ $ $ m ~ ~~ 0 0 000 0 ~ ~ ~ ~ i~ I
L~~_:.l~G~ras~S~Va~l1~ey~I~1~_~~~s~poem~Ii~.el~~J [ Albert ] [~Iuon~emJ_j
II 2500 "•• --.. •..•.~_...,...~ __ ~~.,..".. __ c•. _._ ..... ~~.~" .••·. ~,~_., __~_ . ~._..,..._._ ••• _ ·;-o ,_ .• w_ ..•·~~."._·_~~_._.~_~ ........ ,...~_,._'_ ",_,_.~,- __••• _ ~._!
1
E 2000c..S:c 1500
tucoo
1000
Figure 6.14 Bar chart showing the concentration (ppm) of S in the fluids from Grass
Valley, Spoedwel, Albert and Leeufontein.
252

r~I Ic:::::J1k I
II ,...~IL: ~ j
10000 iii
E iiic. 8000.!:;c0 6000;;
~c'" 4000oc00
2000
I f f I I I I I
i£ i£ i£ i£ ~4: ~ ~..-
0 0 0 0 0 0:: 0:: 0::0:: 0:: 0::
Spoedwel J[Albert .JFigure 6.15 Bat chart showing the concentrations (ppm) of Ga, Dr, Rb, S and Cl in the
fluids from Grass Valley, Spoedwel, Albert and Leeufontein.
500000
I 400000,s,c~ 300000oS~2(j(JOOOceU
1, l,
1#1 '·1 III , 1'0)1 I'" 1'1 !'f'1
it it it it ~ ~ ~ ~ iIi C? «0 0 0 0 it c:: c:: E iIi ;;
__ J0 a: c: a: m 0 ~
f:: IB
Spoedwel IL Albert I I Leeufontein ]
100000
Figure 6.16 Bar chart showing the concentrations (ppm) of Fe, Ti and Mn in the fluids
from Grass Valley, Spoedwel, Albert and Leeufontein.
253
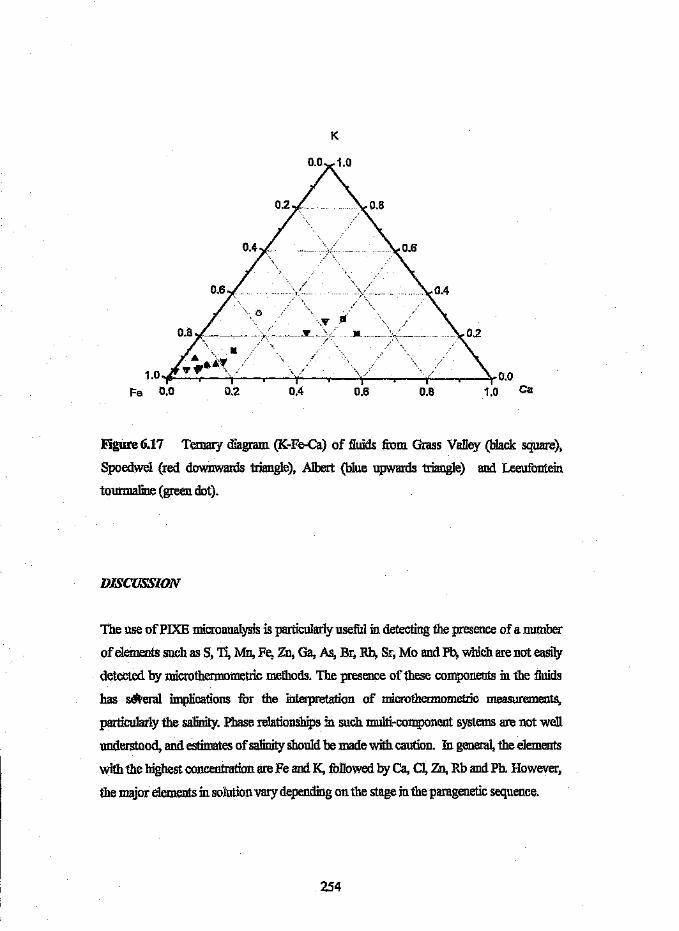
K
1.0...,..._-.-_+_--.-_+_-.-_+_-.-_--"!'-_--.-_-:y0.0Fe 0.0 0.2 0.4 0.6 0.8 1.0 Ca
Figure 6.17 Ternary diagram. (K-Fe-Ca) of fluids from Grass Valley (black square),
Spoedwel (red downwards triangle), Albert (blue upwards triangle) and Leeufontein
tourmaline (green dot).
DISCllSSION
The use of PIXE microanalysis is particularly useful indetecting the presence of a number
of elements such as S, T~ MD, Fe, Zn, Ga, As, Br, Rb, Sr, Mo and Pb, which are not easilydetected by microthermometric methods. The presence of these components in the fluids
has s~eral implications for the interpretation of microthennometric measurements,
particularly the salinity. Phase relationships m such multi-component systems are not well
understood, and estimates of salinity should be made with caution. Ingeneral, the elements
with the highest concentration are Fe and K, followed by Ca, CI, Zn, Rb and Ph. However,
the major elements in solution vary depending on the stage in the paragenetic sequence.
254
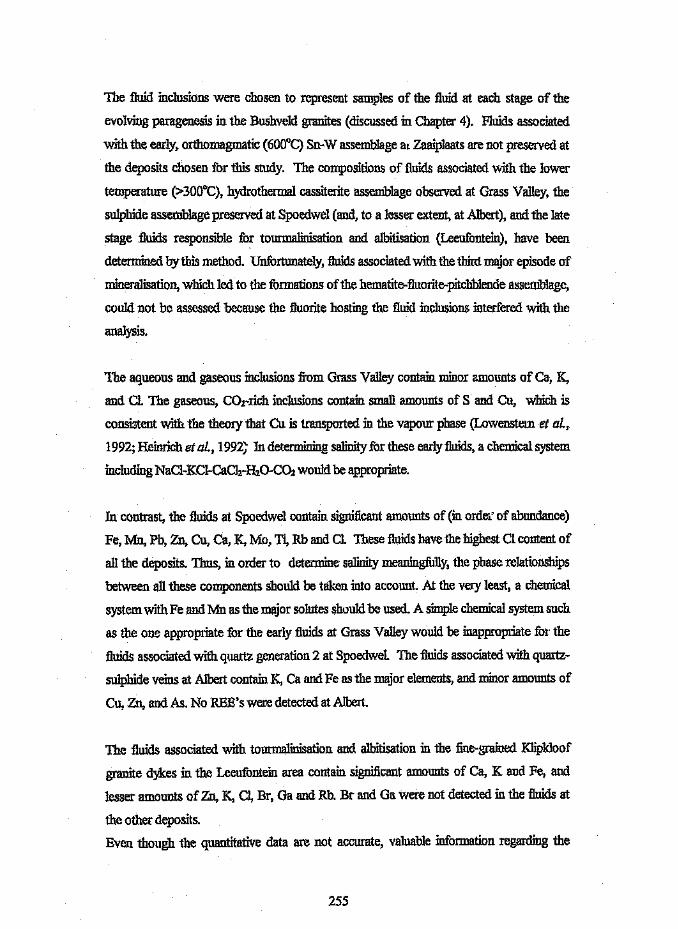
The fluid inclusions were chosen to represent samples of the fluid at each stage of the
evolving paragenesis in the Bushveld granites (discussed in Chapter 4). Fluids associated
with the early. orthomagmatic (600°C) Sn~W assemblage at Zaaiplaats are not preserved at
the deposits chosen for this study. The compositions of fluids associated with the lower
temperature (>300°C), hydrothermal cassiterite assemblage observed at Grass Valley, the
sulphide assemblage preserved at Spoedwel (and, to a lesser extent, at Albert), and the late
stage fluids responsible for tourmalinisation and albitisation (Leeufontein), have been
determined by this method. Unfortunately, fluids associated with the third major episode of
mineralisation, which led to the formations of the hematite-fluorite-pitchblende assemblage,
could not be assessed because the fluorite hosting the fluid inclusions interfered with the
analysis.
The aqueous and gaseous inclusions :from Grass Valley contain minor amounts of Ca, K,
and Cl. The gaseous, COrrich inclusions contain small amounts of S and Cu, which is
consistent with the theory that (,U is transported in the vapour phase (Lowenstein et al.,1992; Heinrich et al., 1992~ In determining salinity for these early fluids, a chemical system
including NaCI-KCI-CaClz-H20-C02 would be appropriate.
In contrast, the fluids at Spoedwel contain significant amounts of (in order of abundance)
Fe, Mn, Pb, Zn, Cu, Ca, K,Mo, T~ Rb and Cl. These fluids have the highest CI content of
all the deposits. Thus, in order to determine salinity meaningfully, the phase relationships
between all these components should be taken into account. At the very least, a chemical
system with Fe and Mn as the major solutes should be used. A simple chemical system such
as the one appropriate for the early fluids at Grass Valley would be inappropriate for the
fluids associated with quartz generation 2 at Spoedwel, The fluids associated with quartz-
sulphide veins at Albert contain K, Ca and Fe as the major elements, and minor amounts of
Cu, Zn, and As. No REE's were detected at Albert.
The fluids associated with tourmalinisation and albitisation in the fine-grained Klipkloof
granite dykes in the Leeufontein area contain significant amounts of Ca, K and Fe, and
lesser amounts of Zn, K, C~ Br, Ga and Rb. Br and Ga were not detected in the fluids at
the other deposits.
Even though the quantitative data are not accurate, valuable information regarding the
255
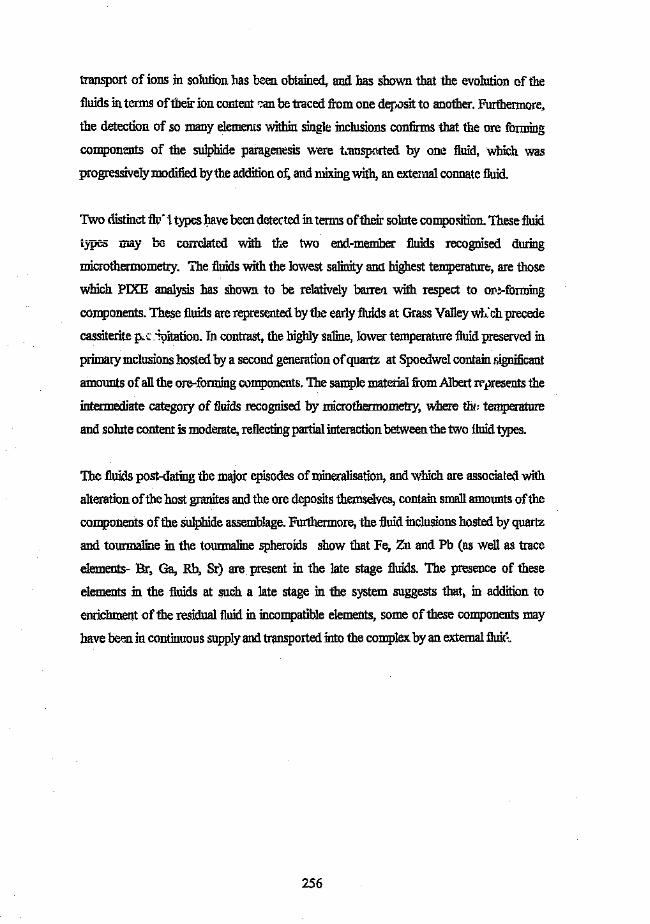
transport of ions in solution has been obtained, and has shown that the evolution of the
fluids in terms of their ion content can be traced from one deposit to another. Furthermore.
the detection of so many elements within single inclusions confirms that the ore forming
components of the sulpbide paragenesis were t.ansported by one fluid, which was
progressively modified by the addition of, and mixing with, an external connate fluid.
Two distinct fllJ'l types have been detected in terms of their solute composition. These fluid
types may be correlated with the two end-member fluids recognised during
microthermometry, The fluids with the lowest salinity and bighest temperature, are those
which PIXE analysis has shown. to be relatively barren with respect to ore-forming
components. These fluids are represented by the early fluids at Grass Valley W4 ch precede
cassiterite p,c "1Jitation. In contrast, the bighly saline, lower temperature fluid preserved in
primarymclusions hosted by a second generation of quartz at Spoedwel contain significant
amounts of all the ore-forming components. The sample material from Albert represents the
intermediate category of fluids recognised by microthermometry, where thl: temperature
and solute content is moderate, reflecting partial interaction between the two Iluid types.
The fluids post-dating the major episodes of mineralisation, and which are associated with
alteration of the host granites and the ore deposits themselves, contain small amounts of the
components of the sulphide assemblage. Furthermore, the fluid inclusions hosted by quartz
and tourmaline in the tourmaline spheroids show that Fe, Zn and Pb (as well as trace
elements- Br, Ga, Rb, Sr) are present in the late stage fluids. The presence of these
elements in the fluids at such a late stage in the system suggests that, in addition to
enrichment of the residual fluid in incompatible elements, some of these components may
have berm. in continuous supply and transported into the complex by an external flui(:.
256
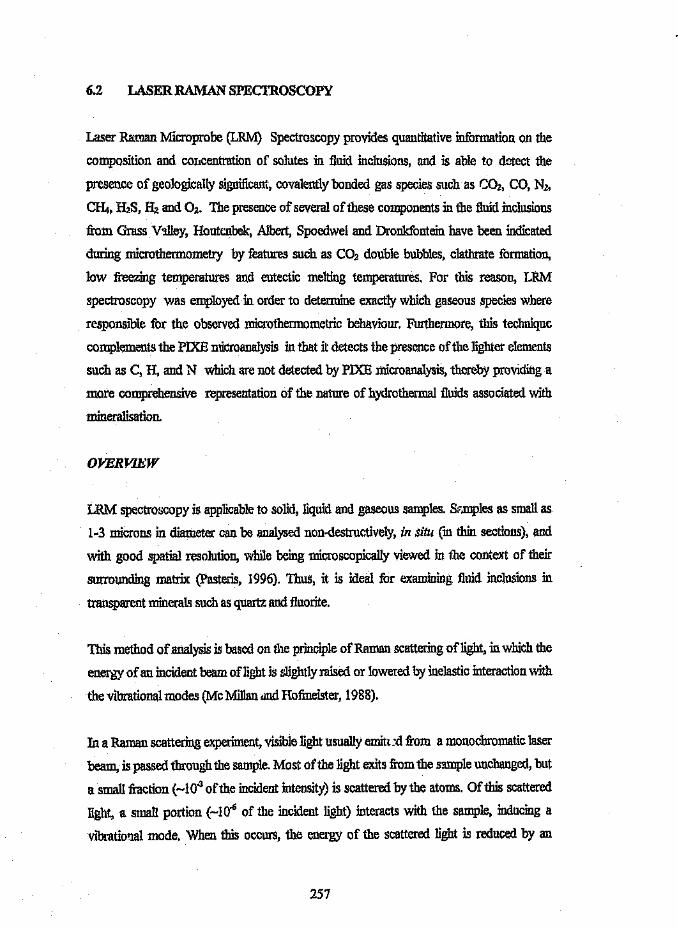
6.2 LASER RAMAN SPECTROSCOPY
Laser Raman Microprobe (LRM) Spectroscopy provides quantitative information on the
composition and concentration of solutes in fluid inclusions, and is able to detect the
presence of geologically significant, covalently bonded gas species such as CO2, CO, N2,
CH4, HzS, Hz and Oz. The presence of several of these components in the fluid inclusions
from Grass Valley, Houtenbek, Albert, Spoedwel and Dronkfontein have been indicated
during micro thermometry by features such as C02 double bubbles, clathrate formation,
low freezing temperatures and eutectic melting temperatures. For this reason, LRM
spectroscopy was employed in order to determine exactly which gaseous species where
responsible for the observed microthermometric behaviour. Furthermore, this technique
complements the PIXE microanalysis in that it detects the presence of the lighter elements
such as C, H, and N which are not detected by PIXE microanalysis, thereby providing a
more comprehensive representation of the nature of hydrothermal fluids associated with
mineralisation.
OVERViEW
LRM spectroscopy is applicable to solid, liquid and gaseous samples. Ssmples as small as
1~3 microns in diameter can be analysed non-destructively, in situ (in thin sections), and
with good spatial resolution, while being microscopically viewed in the context of their
surrounding matrix (Pasteris, 1996). Thus, it is ideal for examining fluid inclusions in
transparent minerals such as quartz and fluorite.
This method of analysis is based on the principle of Raman scattering of light. in which the
energy of an incident beam of light is ~mghtlyraised or lowered by inelastic interaction with
the vibrational modes (Mc Millan and Hofmeister, 1988).
Ina Raman scattering experiment, visible light usually emin .d from a monochromatic laser
beam, is passed through the sample. Most of the light exits from the sample unchanged, but
a small fraction (~1O.3of the incident intensity) is scattered by the atoms. Of this scattered
light, a small portion (~lO-6 of the incident light) interacts with the sample, inducing a
vibrational. mode. When this occurs, the energy of the scattered light is reduced by an
257

amount corresponding to the vibrational transition. This type of inelastic scattering is
referred to as Raman scattering. in contrast with the elastic (Rayleigh) scattering of light
with no energy change.
Inaddition to the Raman and Rayleigh scattered radiation produced when an intense beam.
of light of given wavelength is passed through an optically transparent substance, a third
type of scatter is often encountered, which is 1 .rred to as fluorescence. When the incident
radiation is absorbed by the substance and emitted as a new radiation of longer wavelength,
the substance is displaying fluorescence. The wavelength of the emitted radiation is
characteristic and does not shift if the exciting radiation is shifted (Roedder,1984).
The most common application of LRM spectroscopy to fluid inclusion analysis is in the
identification and quantification of covalently bonded gases such as CO2, CO, CRt, IlzS,
N2, O2 and H2• Once an LRM machine has been calibrated against gas standards,
quantitative compositional analyses of the molar proportions of gas species in muIti-
component inclusions can be accomplished to an accuracy of ~lmoIc%. Moreover, the
specific positions anc shapes of the Raman bands are functions of the bulk composition of
the gas and the gas pressure (Pasteris, 1996).
One limitation oftbis method is that simple ionic electrolytes (e.g, Na+, x', cr, Br') cannot
be detected from their own vibrational signatures. These components may be detected by
freezing the inclusions to approximately -180"C, and taking Raman spectra of the various
hydrated solids that form, e.g. chloride hydrates which can be distinguished from each other
(Dubessy et al., 1982, 1992).
For dissolved species that are Ram, -active (e.g, complex ions consisting of covalently
bonded groups, such as sot and HCOl), LRM calibration on solutions of known
concentration enables the quantitative analysis of those solutes. Furthermore, LRM also
provides information on speciation e.g.S2., H2S, (S04l of Raman-active solutes (Dubessy
et al., 1983).
258
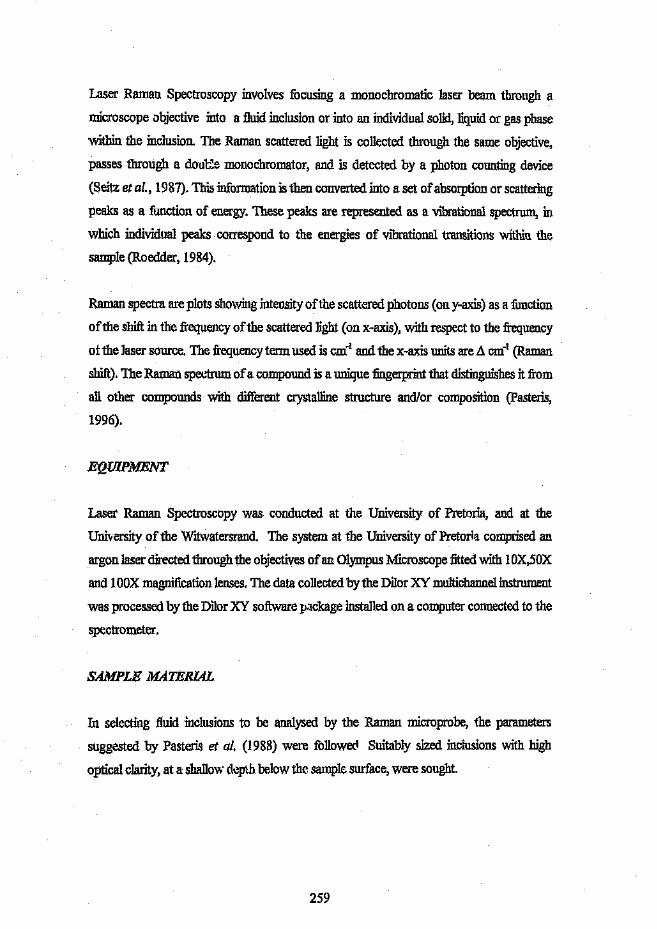
Laser Raman Spectroscopy involves focusing a monochromatic laser beam through a
microscope objective into a fluid inclusion or into an individual solid, liquid or gas phase
within the inclusion. The Raman scattered light is collected through the same objective,
passes through a doub'e monochromator, and is detected by a photon counting device
(Seitz et al., 1987). This information is then converted into a set of absorption or scattering
peaks as a function of energy. These peaks are represented as a vibrational spectrum, in
which individual peaks correspond to toe energies of VIbrational transitions within the
sample (Roedder, 1984).
Raman spectra are plots showing intensity of the scattered photons (on y-axis) as a function
of the shift in the frequency of the scattered light (on x-axis), with respect to the frequency
of the laser source. The frequency term used is em" and the x-axis units are fJ. em" (Raman
shift). The RaIIJaL1. spectrum of a compound is a unigue fingerprint that distinguishes it from
aU other compounds with different crystalline structure andlor composition (Pasteris,
1996).
EQUIPMENT
Laser Raman Spectroscopy was conducted at the University of Pretoria, and at the
University of the Witwatersrand. The system at the University of Pretoria comprised an
argon laser directed through the objectives of an Olympus Microscope fitted with 10X,50X
and 100X magnification lenses. The data collected by the Dilor XY multichannel instrument
was processed by the Dilor XY software package installed on a computer connected to the
spectrometer.
SAMPLE MATERIAL
In selecting fluid inclusions to be analysed by the Raman microprobe, the parameters
suggested by Pasteris et al. (1988) were followed Suitably sized inclusions with high
optical clarity, at a shallow depth below the sample surface, were sought.
259

Polished thin sections and .oublypolished rock wafers were made at the University of the
Witwatersrand using Superglue as a mounting medium. The doubly polished rock wafers
were cut thick enough to be removed. from the supporting glass slide by immersion in the
solvent acetone. Fluid inclusions in the polished thin sections were analysed in situ, and
hence some Raman response from the Superglue is to be expected.
Samples from Spoedwel, Grass Valley and Houtenbek selected for Raman analysis are
tabulated in Table 6.4. Three of the samples (SF02, SD52, SD35) from Spoedwel were
polished thin sections which had been mounted with epoxy glue. The others were doubly
polished thin sections on which microthermometry was to be carried out.
Table 6. 4
Houtenbek.
Samples selected for Raman analysis from Spoedwel, Grass Valley and
DEPOSIT SAMPLE COMMENTS--~----~------~~~~~~--~~--~Spoedwel SF02 Fluid inclusions hosted by interstitial quartz in intensely chloritised
granite,
SD52 Fluid inclusions hosted by interstitial quartz in hematitised
hypersol Vl.JS granite with disseminated chalcopyrite mineralisation.
SD35 Fluid inclusions hosted by interstitial quartz in intensely cbIoritised
granite.
L2 Fluid inclusions in a quartz vein in medium-grained hypersolvus
granite.SP3 Fluid inclusions hosted by interstitial fluorite in coarse-grained
hypersolvus granite withminor quartz.
Houtenbek
Grass Valley
SP6
HB2
GV02
Fluid inclusions hosted by interstitial fluorite in graphic granite.
Fluid inclusions hosted by sphalerite.
Vapour-rich fluid inclusions in quartz preceding cassiterite
precipitation.
METHODS
All Raman scans taken at the University of Pretoria were conducted at room temperature
and at atmospheric pressure with the following analysis parameters: 100 seconds
integration time (counting time per step), excitation by a 514.50nm continuous wave argon
260
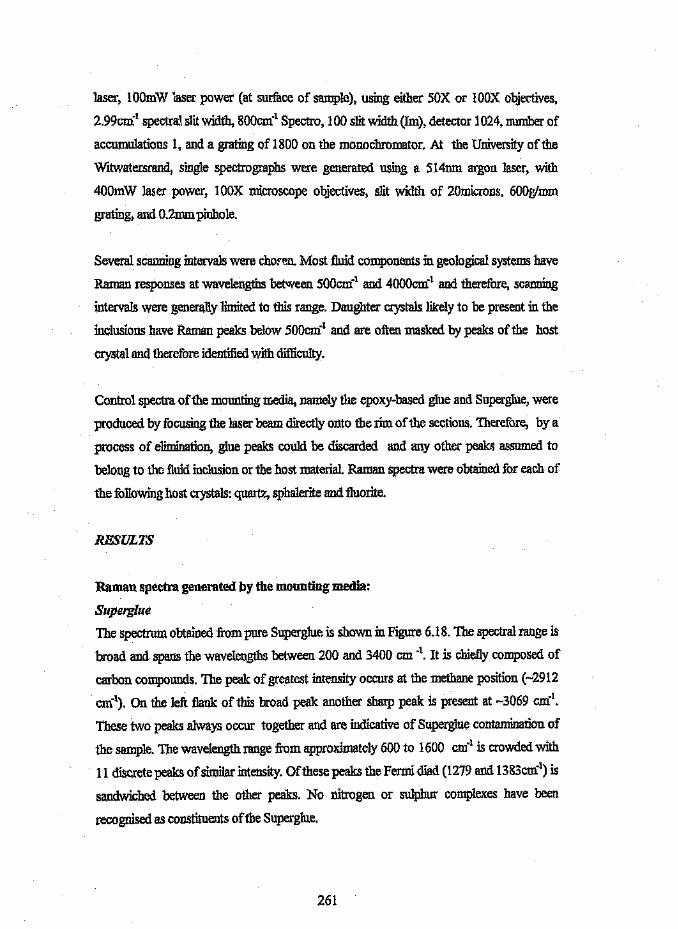
laser, lOOmW laser power (at surface of sample), using either 50X or lOOX objectives,
2.99cml spectral slit width, 800cm-1Spectre, lOO slit width (!m), detector l024. number of
accumulations 1, and a grating of 1800 on the monochromator. At the University of the
Witwatersrand, single spectrographs were generated using a 514nm argon laser, with
400mW laser power, lOOX microscope objectives, slit width of 20microns, 600glmm
grating, and O.2mmpinhole.
Several scanning intervals were chosen, Most fluid components in geological systems have
Raman responses at wavelengths between 500cm1 and 4000cm-1 and therefore, scanning
intervals were generally limited to this range. Daughter crystals likely to be present :in the
inclusions have Raman peaks below 500cm-1 and are often masked by peaks of the host
crystal and therefore identified with difficulty.
Control spectra of the mounting media, namely the epoxy-based glue and Superglue, were
produced by focusing the laser beam directly onto the rim of the sections. Therefore, by a
process of elimination, glue peaks could be discarded and any other peaks assumed to
belong to the fluid inclusion or the host material. Raman spectra were obtained for each of
the following host crystals: quartz, sphalerite and fluorite.
RESULTS
Raman spectra generated by the mounting media:
SuperglueThe spectrum obtained from pure Superglue is shown inFigure 6.18. The spectral range is
broad and spans the wavelengths between 200 and 3400 em -1. It is chiefly composed of
carbon compounds. The peak of greatest intensity occurs at the methane position (~2912
em"), On the left flank of this broad peak another sharp peak is present at ~3069 em-i.
These two peaks always occur together and are indicative of Superglue contamination of
the sample. The wavelength range from approximately 600 to 1600 em" is crowded with
11 discrete peaks of similar intensity. Of these peaks the Fermi diad (1279 and 1383em-1) is
sandwiched between the other peaks. No nitrogen or sulphur complexes have been
recognised as constituents of the Superglue.
261
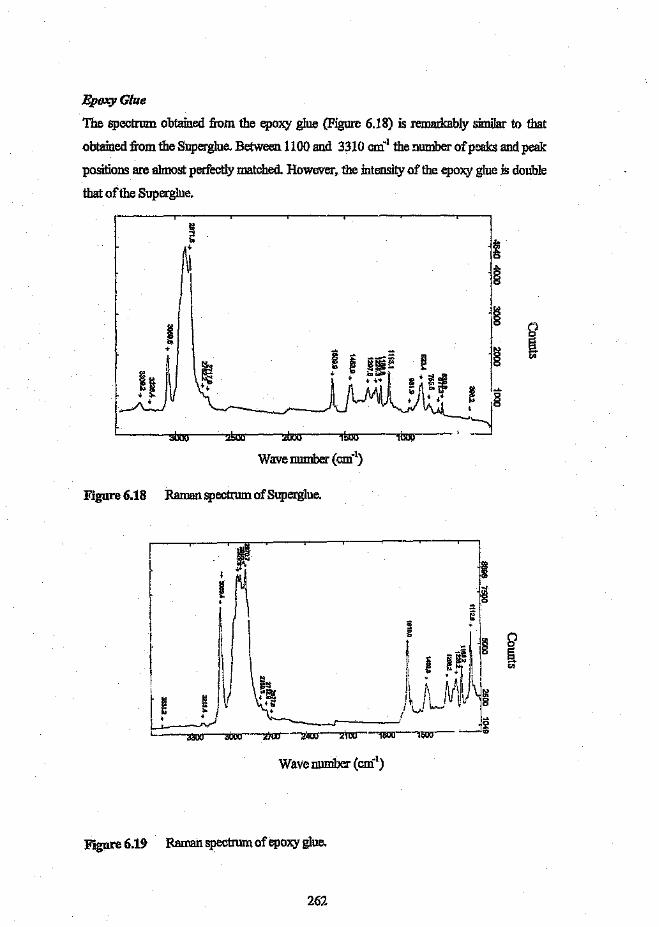
EpoxyG/ue
The spectrum obtained from the epoxy glue (Figure 6.18) is remarkably similar to that
obtained from the Superglue. Between 1100 and 3310 em" the number of peaks and peak:
positions are almost perfectly matched. However, the intensity of the epoxy glue is double
that of the Superglue,
Figure 6.18 Raman spectrum of Superglue.
Wave number (em")
Figure 6.19 Raman spectrum of epoxy glue.
262

Raman Spectra generated by the host minerals
Sphalerite (Figure 6.20)
Peaks are confined to the lower wavelengths below 700 em", The spectrum consists of
several low intensity peaks, the highest peak intensity occurring at 349,8 em". No peaks are
found above 800 em" and hence any peaks observed in this region when focusing on
inclusions cannot be contribute .o the host crystal.
Quartz (Figure 6.21)
Pure quartz has a strong _;_uunan response of 10 discrete peaks in the range 205 to 1161
em", the peak with the highest intensity occurring at 464 em". These peaks cause no
overlap with the N2, CH4 or Fermi diad (CCh) peak positions. However, the response of
HC03- and the monatomic ions Na+, K+, ea2+and Mg2+are masked or even obliterated by
the strong quartz peaks.
Fluorite (Figure 6.22)
The fluorite spectrum is Vu.lltlledto those wavelengths below ·-1586 em" and consists ofa
broad based peak which stretcbes from ~800 to~1500 em". Superimposed on this are
several other sharp peaks and bell-shaped curves. The peak of greatest intensity occurs at
808crri', and 3 minor undulations 646, 547 and 321 em" are found in the lower spectral
region.
f
[!
~
Ii 1§
Ii ~i§~ ...sl:" :;:;>~; g~g 1\ !~~l~\JU_.r V~p~§----------.--------------~L--..'n_---.;:mrr---,-~tAAl 4bo .!
Wave number (COil)
F::.;wre 6.:W Raman spectrum of sphalerite fi:omHoutenbek.
263
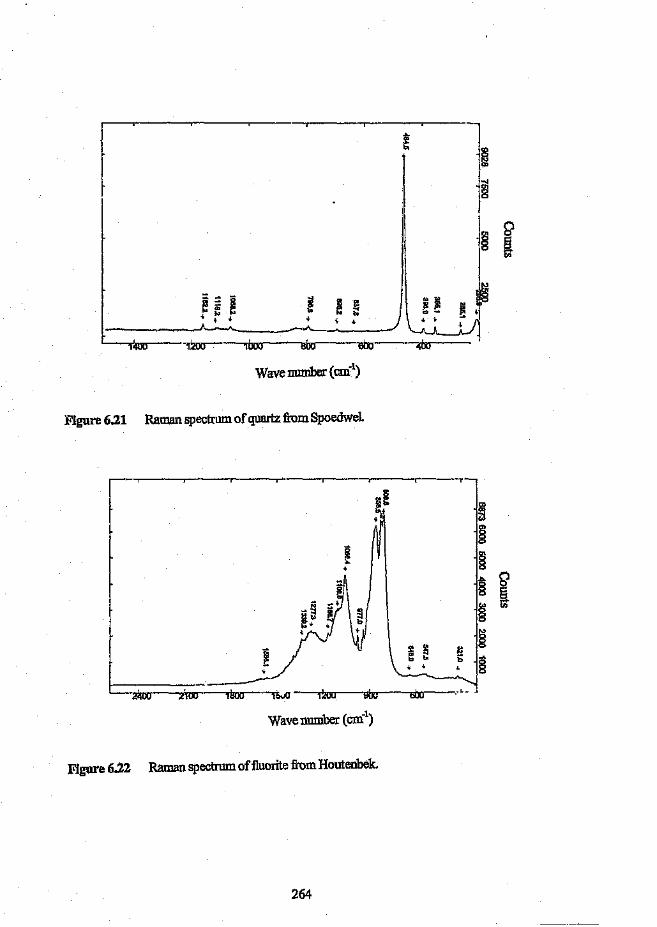
ft l~0.
Ir Ii 18II
,
tQ
I ~en
13:; i ~ 8 l!J .8 ~ '"'" ;:; ;., " ~.'" ) '" - ~. . ~ .. ~ oj.·1.........____._
1~OO ,boo abo 6bo
Figure 6.21 Raman spectrum of quartz from Spoedwel.
~~-.~ 2100
Figure 6.22 Raman spectrum of fluorite from Houtenbek.
264

Raman Spectra generated by fluid inclusions
'The components detected in the fluid inclusions are shown in Table 6.5. The Raman
responses from the polished thin sections were masked by the strong peaks generated by
the epoxy glue. The spectra from the doubly polished thin sections indicated the presence
of N2, c~, CO2 and H20 in the fluids. Of the fluid inclusions examined, only those in
which the components undoubtedly originate from the fluid inclusions, and not from the air
or surficial contamination, are presented.
Table 6.5 Table showing components of each fluid inclusion analysed.
SAMPLE NO.
SF02 quartz
HOST MINERAL COMPONENTS CO:MMENTS
Epoxy masked Raman response-
no data obtained.
Hematite daughter crystal
Epoxypeaks mask all other peaks.
Unidentified peak at 1600.9cm-l•
Nz and CO2 peaks very small.
Sphalerite fluorescence interferes
with peaks from fluid inclusion
components.
Sharp, high intensity peak. No
other components (see Figure
6.23).
H20, (C~), N2 Large peaks for all three
SD52
SD35
HB2
quartz
quartz
sphalerite
L2 quartz
SP3 fluorite
SP6 fluorite
GV02 (MM2-c) quartz
GV02(MMI-a)
GV02 (MM3-a2)
COl. CH4
CO2,N2 (C~)
quartz
quartz
components. C~ is not from the
fluid inclusion but from the
surface (see Figure 6.24).
Broad, high intensity peak for
methane (see Figure 6.25).
Large CO2 peaks, minor N2, C~
peaks (see Figure 6.26a).
No N2 detected (see Figure 6.26b).
C~ carne from the surface of the
sample (see Figure 6.26c).
265

Figure 6.23 Raman spectrum showing nitrogen peak in sample of vein quartz from
Spoedwel.
Figure 6.24 Raman spectrum showing nitrogen and methane peaks, as well as a broad
bell-shaped water curve influorite from Spoedwel,
Wavenumbcr(cnil)JtW 2&() 2£W
Figure 6.25 Raman spectrum showing nitrogen and methane peaks in late stage quartz
associated with hematite precipitation at Spoedwel,
266
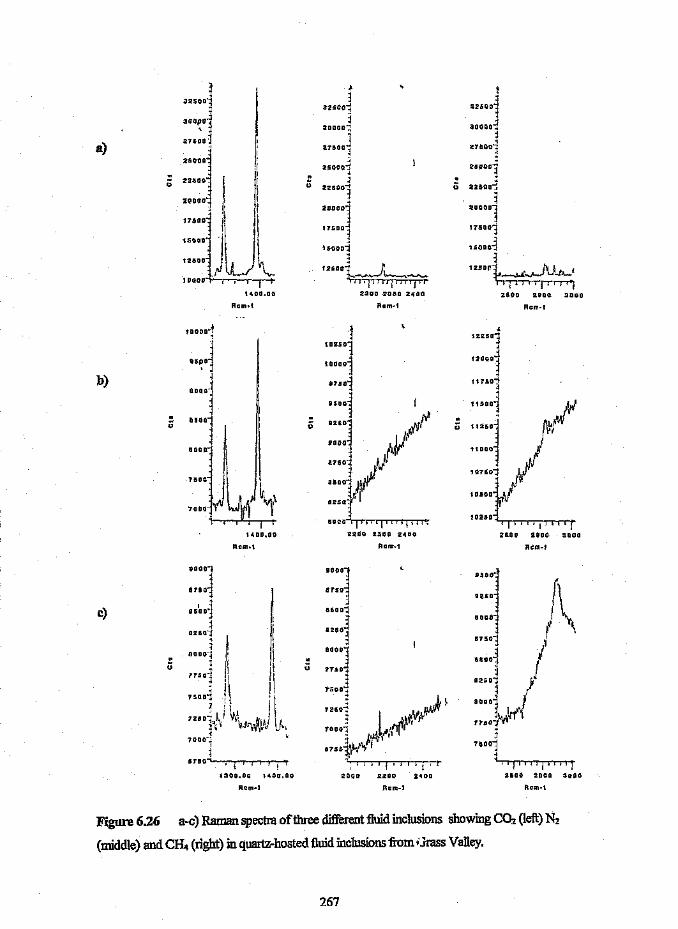
a)
b)
c)
Figure 6.26
~,J2500~
30opo1, .27500,j
3:nsoa-=i
~30000:
121500"'1
.u
2500a-j,.225001
2000°1~TSOO-:::'
j
~:l
325QO-j
j30000-:;
:.!7S0D1
ZGCCCi
225QO~
200001
j17500-j
15000~
1250r-t /" I ,-;':'_ ...J.Jt~ 1.J'-!.•_:
·i~J'il;T""'JTj2800 2900 3000
g em-t
=r=2"00
7$0°14
1 ! i J i 1 ill I I , j !2800 2900 3000
Rem-t
1400.00
Rcm~t
o
150001 .1zsoa-1 j:
1....",~~"" __ t,...~~ .....
"rTT7TT"-n~,.2300 2:150 2,.00
Acm~t
2200 2.JOO 2<40Q
E:l'c m .. 1
90001~875°1J
05DO'J.;:I
825°1Boool,77S0.o;:t
2000 2200Rcm·1
a-c) Raman spectra of three different fluid inclusions showing CO2 (left) N2
267
(middle) and C~ (right) inquartz-hosted fluid inclusions from iJrass Valley.
M
o
-t
67 50~-r-r-r-r~
1300.00 l~OO.QO
Rtm·l
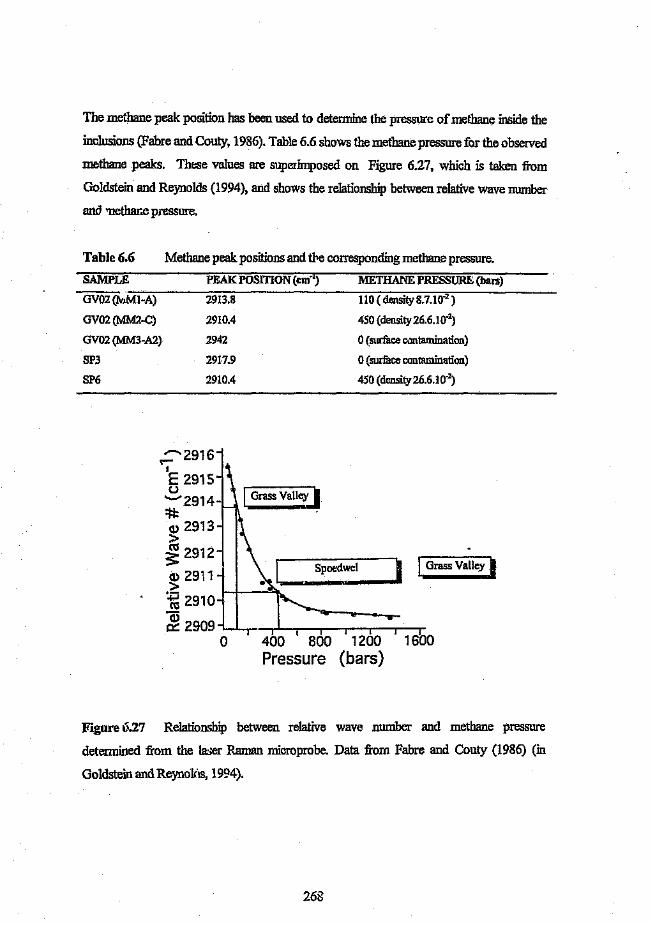
The methane peak position has been used to determine the pressure of methane inside the
inclusions (Fabre and Couty, 1986). Table 6.6 shows the methane pressure for the observed
methane peaks. These values are superimposed on Figure 6.27, which is taken from
Goldstein and Reynolds (1994), and shows the relationship between relative wave number
ana -nethane pressure.
Table 6.6 Methane peak.positions and the corresponding methane pressure.
SAMPLE
GV02 (lvJMI-A)
GV02 (MM7.-C)
GV02 (MM3-A2)
SP3
SP6
PEAK POSITION (em-I) METIIANE PRESSURE (bars)
2913.8 110 (density 8.7.10.2 )
2910.4 450 (density 26.6.10.2)
29422917.9
2910.4
o (surface contamination)
o (surface contamination)
450 (density 26.6.10-2)
~2916I
E 2915o"_"2914:t:t:Q) 2913>~ 2912Q) 2911>.~ 2910
~ 2909 'L-L-r--r'.l...-.r--r'--.....-..-....,-._-...,--,-
o
, ..1 I Grass Valley I
400 800 1200 1600Pressure (bars)
Figure (;..27 Relationship between relative wave number and methane pressure
determined from the laser Raman microprobe. Data from Fabre and Couty (1986) (in
Goldstein and Reynolas, 1994).
268