law & policy associates mecklenburg county detention operations master plan report kimme &...
TRANSCRIPT

K A&Law & Policy Associates
MECKLENBURG COUNTYMECKLENBURG COUNTYDetention Operations Master PlanDetention Operations Master Plan
MECKLENBURG COUNTYMECKLENBURG COUNTYDetention Operations Master PlanDetention Operations Master Plan
REPORTREPORTKIMME & Associates, Inc./Law & Policy Associates KIMME & Associates, Inc./Law & Policy Associates
with assistance from American Universitywith assistance from American UniversityApril 15, 2008April 15, 2008

K A&Law & Policy Associates
Adult Jail PopulationAdult Jail PopulationAdult Jail PopulationAdult Jail Population

3 K A&Law & Policy Associates
Adult Jail Population HistoryAdult Jail Population HistoryAdult Jail Population HistoryAdult Jail Population History 2,6682,668 beds available beds available
North (614), Central (1904), WRRC (150)North (614), Central (1904), WRRC (150) 2,776 with Youthful Offender Addition2,776 with Youthful Offender Addition excludes temporary “Sprung” structureexcludes temporary “Sprung” structure
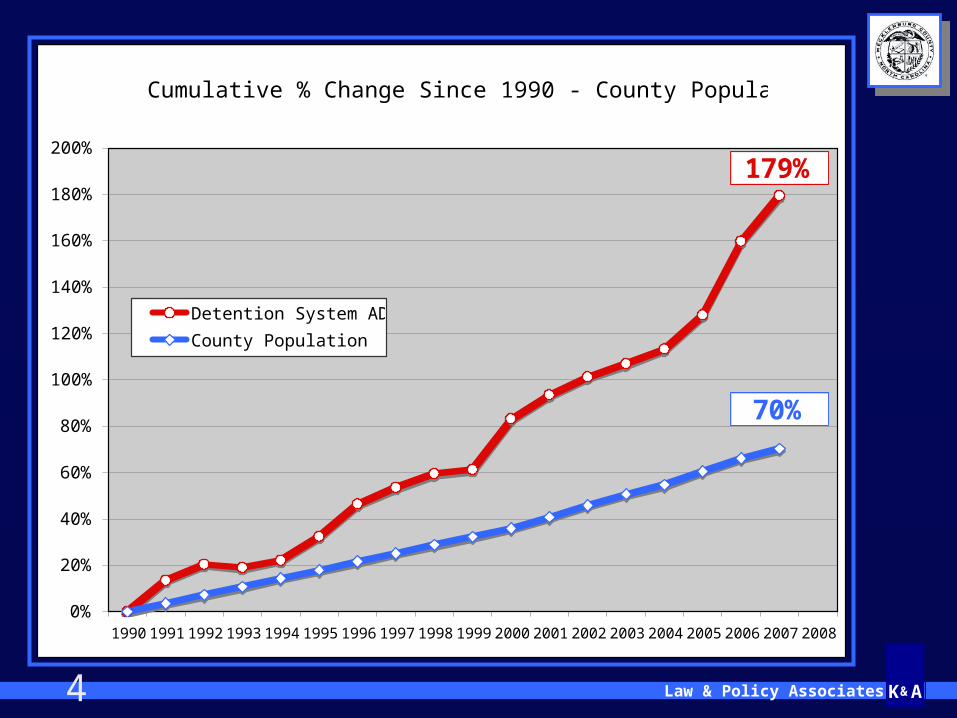
2,6712,671 Average Daily Population CY 2007 Average Daily Population CY 2007 956 in Calendar Year 1990956 in Calendar Year 1990 179% increase while County grew 70%179% increase while County grew 70%
2,8672,867 = Peak Day in 2007 (+7.5%) = Peak Day in 2007 (+7.5%)
4 K A&Law & Policy Associates
Cumulative % Change Since 1990 - County Population & ADP
0%
20%
40%
60%
80%
100%
120%
140%
160%
180%
200%
1990 1991 1992 1993 1994 1995 1996 1997 1998 1999 2000 2001 2002 2003 2004 2005 2006 2007 2008
Detention System ADP
County Population
179%
70%

5 K A&Law & Policy Associates
National Jail Incarceration Rate per 10,000 Population
0.0
5.0
10.0
15.0
20.0
25.0
30.0
35.0
1985 1990 1995 2000 2005 2010
Incarceration Rate
Trend25.6
10.8
Mid 1970's
Mecklenburg 2007: 30.7
Mecklenburg
1990: 18.7
Mecklenburg Rate in 1983 = 6.8

6 K A&Law & Policy Associates
OvercrowdingOvercrowdingOvercrowdingOvercrowding Partly function of Peaks & ClassificationPartly function of Peaks & Classification High security and special needs areas High security and special needs areas
not used for other classificationsnot used for other classifications Overcrowding in minimum-medium podsOvercrowding in minimum-medium pods
14, 56 bed pods; each has 75-85 inmates14, 56 bed pods; each has 75-85 inmates Averaged Averaged 399399 inmates “on the floor” daily inmates “on the floor” daily
in 2007 in 2007 (Calendar year calculation)(Calendar year calculation) Peak of Peak of 586586 (September 25) (September 25)
400-500 Bed Shortfall today400-500 Bed Shortfall today

7 K A&Law & Policy Associates
Inmates “On-the-Floor”Inmates “On-the-Floor”Inmates “On-the-Floor”Inmates “On-the-Floor”

K A&Law & Policy Associates
BASE ADP, Facility, Cost BASE ADP, Facility, Cost ProjectionsProjections
BASE ADP, Facility, Cost BASE ADP, Facility, Cost ProjectionsProjections

9 K A&Law & Policy Associates
““BASE” ADP ProjectionsBASE” ADP Projections(total system: North, Central, WRRC)(total system: North, Central, WRRC)““BASE” ADP ProjectionsBASE” ADP Projections(total system: North, Central, WRRC)(total system: North, Central, WRRC)
System processes System processes as they areas they are Linked to county growthLinked to county growth
695,000 in 2000695,000 in 2000 1,600,000 by 2027 (+130%)1,600,000 by 2027 (+130%)
PROJECTION SUMMARY:2020 2030
ADP 2020BED NEED
2020BED
SHORTFALL ADP 2030BED NEED
2030BED
SHORTFALL
BASE Projection 4,543 5,111 2,335 6,625 7,287 4,511
Change from 2000: 159% 278%
10 K A&Law & Policy Associates
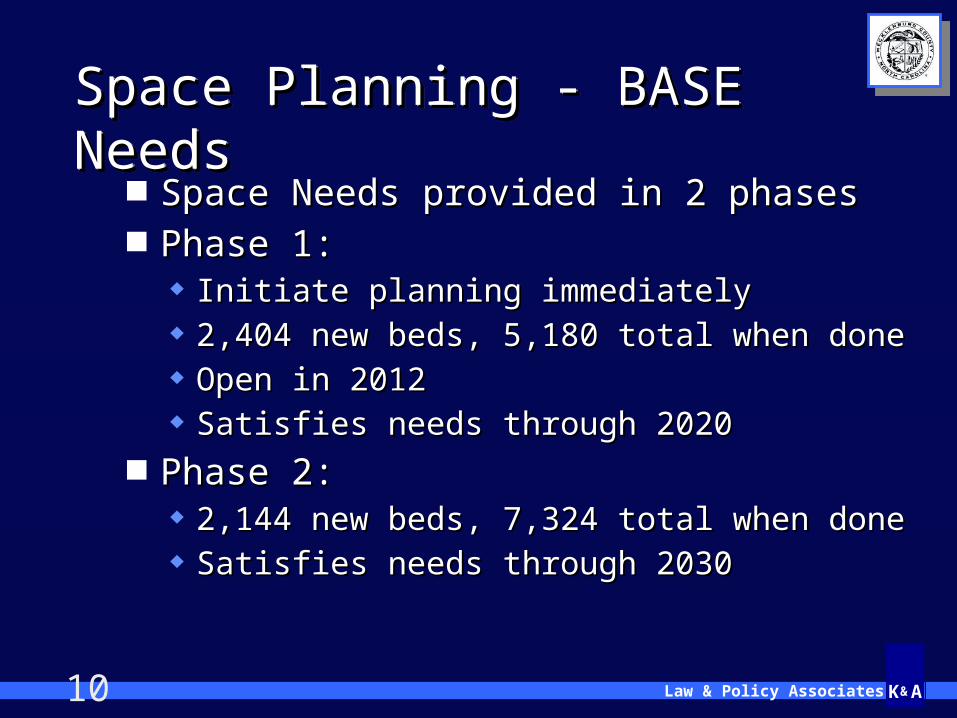
Space Planning - BASE NeedsSpace Planning - BASE NeedsSpace Planning - BASE NeedsSpace Planning - BASE Needs Space Needs provided in 2 phasesSpace Needs provided in 2 phases Phase 1:Phase 1:
Initiate planning immediatelyInitiate planning immediately 2,404 new beds, 5,180 total when done2,404 new beds, 5,180 total when done Open in 2012Open in 2012 Satisfies needs through 2020Satisfies needs through 2020
Phase 2:Phase 2: 2,144 new beds, 7,324 total when done2,144 new beds, 7,324 total when done Satisfies needs through 2030Satisfies needs through 2030

11 K A&Law & Policy Associates
Preliminary Schedule - BASEPreliminary Schedule - BASEPreliminary Schedule - BASEPreliminary Schedule - BASE
825 Bed Shortfall by 20121,000 by 2013
PRELIMINARY FACILITY DEVELOPMENT SCHEDULE Generic ProjectMecklenburg County, NC Detention
2008 2009 2010 2011 2012J F M A M J J A S O N D J F M A M J J A S O N D J F M A M J J A S O N D J F M A M J J A S O N D J F M A M J J A S O N D
MASTER PLAN
PHASE 1:
PROGRAM 6
DESIGN 1 0
BID & NEGOTIATE 2 2
CONSTRUCT ADDITION(S) 2 4 4
TRANSITION PLANNING
OCCUPY ADDITION 1 2
12 K A&Law & Policy Associates
Phase 1 Space Needs 2020Phase 1 Space Needs 2020Phase 1 Space Needs 2020Phase 1 Space Needs 2020
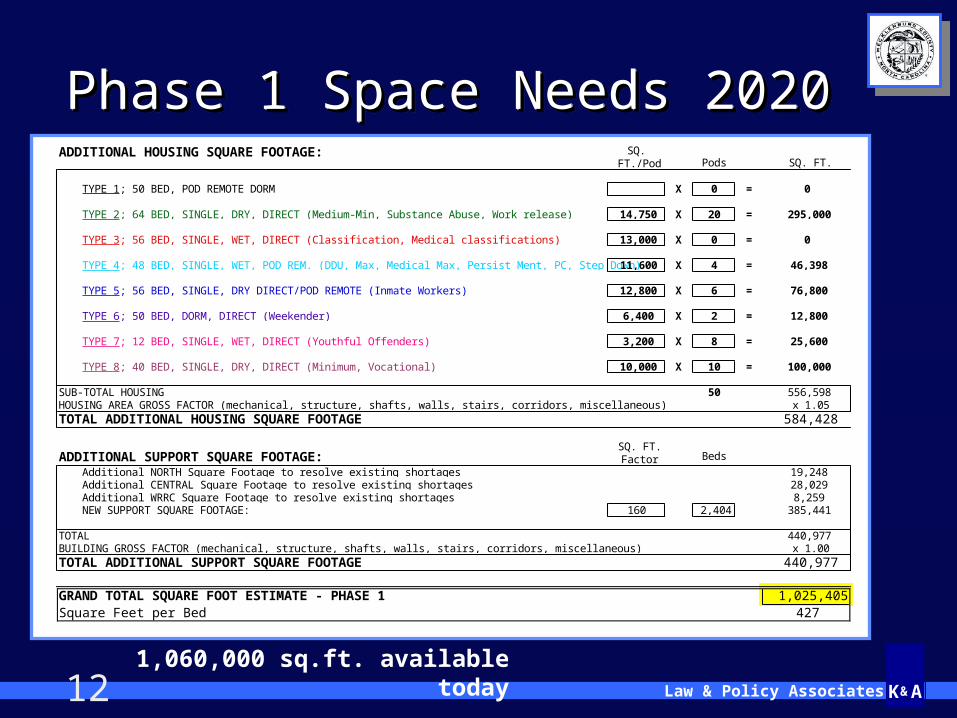
1,060,000 sq.ft. available today
ADDITIONAL HOUSING SQUARE FOOTAGE: SQ. FT./Pod Pods SQ. FT.
TYPE 1; 50 BED, POD REMOTE DORM X 0 = 0
TYPE 2; 64 BED, SINGLE, DRY, DIRECT (Medium-Min, Substance Abuse, Work release) 14,750 X 20 = 295,000
TYPE 3; 56 BED, SINGLE, WET, DIRECT (Classification, Medical classifications) 13,000 X 0 = 0
TYPE 4; 48 BED, SINGLE, WET, POD REM. (DDU, Max, Medical Max, Persist Ment, PC, Step Down) 11,600 X 4 = 46,398
TYPE 5; 56 BED, SINGLE, DRY DIRECT/POD REMOTE (Inmate Workers) 12,800 X 6 = 76,800
TYPE 6; 50 BED, DORM, DIRECT (Weekender) 6,400 X 2 = 12,800
TYPE 7; 12 BED, SINGLE, WET, DIRECT (Youthful Offenders) 3,200 X 8 = 25,600
TYPE 8; 40 BED, SINGLE, DRY, DIRECT (Minimum, Vocational) 10,000 X 10 = 100,000
SUB-TOTAL HOUSING 50 556,598HOUSING AREA GROSS FACTOR (mechanical, structure, shafts, walls, stairs, corridors, miscellaneous) x 1.05TOTAL ADDITIONAL HOUSING SQUARE FOOTAGE 584,428
ADDITIONAL SUPPORT SQUARE FOOTAGE:SQ. FT. Factor Beds
Additional NORTH Square Footage to resolve existing shortages 19,248Additional CENTRAL Square Footage to resolve existing shortages 28,029Additional WRRC Square Footage to resolve existing shortages 8,259NEW SUPPORT SQUARE FOOTAGE: 160 2,404 385,441
TOTAL 440,977BUILDING GROSS FACTOR (mechanical, structure, shafts, walls, stairs, corridors, miscellaneous) x 1.00TOTAL ADDITIONAL SUPPORT SQUARE FOOTAGE 440,977
GRAND TOTAL SQUARE FOOT ESTIMATE - PHASE 1 1,025,405Square Feet per Bed 427

13 K A&Law & Policy Associates
Phase 2 Space Needs 2030Phase 2 Space Needs 2030Phase 2 Space Needs 2030Phase 2 Space Needs 2030ADDITIONAL HOUSING SQUARE FOOTAGE: SQ.
FT./Pod Pods SQ. FT.
TYPE 1; 50 BED, POD REMOTE DORM X = 0
TYPE 2; 64 BED, SINGLE, DRY, DIRECT (Medium-Min, Substance Abuse, Work release) 14,750 X 16 = 236,000
TYPE 3; 56 BED, SINGLE, WET, DIRECT (Classification, Medical classifications) 13,000 X 2 = 26,000
TYPE 4; 48 BED, SINGLE, WET, POD REM. (DDU, Max, Medical Max, Persist Ment, PC, Step Down) 12,000 X 6 = 72,000
TYPE 5; 56 BED, SINGLE, DRY DIRECT/POD REMOTE (Inmate Workers) 12,800 X 4 = 51,200
TYPE 6; 50 BED, DORM, DIRECT (Weekender) 6,400 X = 0
TYPE 7; 12 BED, SINGLE, WET, DIRECT (Youthful Offenders) 3,200 X 8 = 25,600
TYPE 8; 40 BED, SINGLE, DRY, DIRECT (Minimum, Vocational) 10,000 X 10 = 100,000
SUB-TOTAL HOUSING 510,800HOUSING AREA GROSS FACTOR (mechanical, structure, shafts, walls, stairs, corridors, miscellaneous) x 1.05TOTAL ADDITIONAL HOUSING SQUARE FOOTAGE 536,340
ADDITIONAL SUPPORT SQUARE FOOTAGE:SQ. FT. Factor Beds
Additional NORTH Square Footage to resolve existing shortages 0Additional CENTRAL Square Footage to resolve existing shortages 0Additional WRRC Square Footage to resolve existing shortages 0NEW SUPPORT SQUARE FOOTAGE: 150 2,144 321,600
TOTAL 321,600BUILDING GROSS FACTOR (mechanical, structure, shafts, walls, stairs, corridors, miscellaneous) x 1.00TOTAL ADDITIONAL SUPPORT SQUARE FOOTAGE 321,600
GRAND TOTAL SQUARE FOOT ESTIMATE - PHASE 1 857,940Square Feet per Bed 400

14 K A&Law & Policy Associates
Construction Costs - BASE Construction Costs - BASE Needs Needs (in 2008 dollars)(in 2008 dollars)
Construction Costs - BASE Construction Costs - BASE Needs Needs (in 2008 dollars)(in 2008 dollars)
Phase 1: $290-$355 millionPhase 1: $290-$355 million Annual payment at 5%, 20 yearsAnnual payment at 5%, 20 years Based on average construction costBased on average construction cost $26.0 million annually$26.0 million annually
Construction Inflation = 7% annually Construction Inflation = 7% annually Phase 2: $240-$300 millionPhase 2: $240-$300 million
Annual payment at 5%, 20 years Annual payment at 5%, 20 years $21.8 million annually $21.8 million annually

15 K A&Law & Policy Associates
Annual Operational Costs - Annual Operational Costs - BASE Needs BASE Needs (in 2007 dollars)(in 2007 dollars)
Annual Operational Costs - Annual Operational Costs - BASE Needs BASE Needs (in 2007 dollars)(in 2007 dollars)
Operations/Staffing/UtilitiesOperations/Staffing/Utilities Current Costs: $80 millionCurrent Costs: $80 million Future costs above 2007 costs:Future costs above 2007 costs:
Phase 1 in opening year (2012): +$12.6 Phase 1 in opening year (2012): +$12.6 million million (16%)(16%)
Phase 1 in 2020: +$47 million Phase 1 in 2020: +$47 million (59%)(59%) Phase 2 in 2030: +$97 million Phase 2 in 2030: +$97 million (122%)(122%)

16 K A&Law & Policy Associates
Combined Annual Cost Combined Annual Cost Increases- BASEIncreases- BASECombined Annual Cost Combined Annual Cost Increases- BASEIncreases- BASE
Phase 1 in opening year (2012): $39 Phase 1 in opening year (2012): $39 million above 2007 costsmillion above 2007 costs
Phase 1 in 2020: $73 millionPhase 1 in 2020: $73 million Phase 2 in 2030: $145 millionPhase 2 in 2030: $145 million
Includes overlapping building payments on Includes overlapping building payments on phases 1 & 2 ($26.0M plus $21.8M)phases 1 & 2 ($26.0M plus $21.8M)

K A&Law & Policy Associates
Recommended Approaches to Recommended Approaches to Managing Jail Population SizeManaging Jail Population SizeRecommended Approaches to Recommended Approaches to Managing Jail Population SizeManaging Jail Population Size

18 K A&Law & Policy Associates
Reducing ALOSReducing ALOSReducing ALOSReducing ALOS2005-06 Median Age Disposed Felonies (in days)
201189
154
257
292
205
140
231
0
50
100
150
200
250
300
350
State
wide
MECKLE
NBURG
Gui
lford
Wak
e*
Cumbe
rland
Durha
m
Forsy
th*
Bunco
mbe

19 K A&Law & Policy Associates
Consensus Consensus Plan Policy Plan Policy Elements, Elements, CostsCosts($2.6 million*), ($2.6 million*), & ADP & ADP SavingsSavings
Consensus Consensus Plan Policy Plan Policy Elements, Elements, CostsCosts($2.6 million*), ($2.6 million*), & ADP & ADP SavingsSavings*Excludes cost of space
Mecklenburg Work Group Consensus Plan Cost Benefit Analysis Summary
Policy Change Estimated Annual Cost by Mecklenburg Work Group,
4-08
Estimated State Inmate ADP or Jail Bookings Reduction
Expedited Court Processing of Jailed Cases
Case Management Plan with H&I Felony Cases in District Court
$1,540,592
11.9%
Misdemeanors -Early Intervention, Expedited Processing
$294,731
6.8%
VOPs disposed within 45 days
No Additional 0.7%
Murder cases disposed within 2 years
No Additional 0.4%
Enhance capacity of problem-solving courts (drug, mental health)
$235,629 Unknown
Reducing Volume of Jail Admissions/Bookings
Revised Bond / PTR Policy
$364,662 Unknown reduction in jail bookings
Pre-warrant screening of citizen complaints
$157,615
Unknown reduction in jail admissions
(43%% of total misdemeanor warrants in 2006-07 were civilian-
issued, representing 16% of all OFAs and warrants)
TOTALS $2,593,229 19.8% reduction in state inmate ADP

20 K A&Law & Policy Associates
Total estimated annual cost of $2.6 million to:Total estimated annual cost of $2.6 million to:
Implement revised bond / pretrial release policy
Implement pre-warrant screening of citizen complaints
Expedite resolution of jailed misdemeanor cases
21 K A&Law & Policy Associates
Total estimated annual cost of $2.6 million to (continued):Total estimated annual cost of $2.6 million to (continued):
Expedite disposition of jailed non-homicide felony cases (45% of total)
Expedite resolution of jailed homicide cases
Prompt resolution of jailed probation violation cases
Enhance capacity of problem-solving courts

K A&Law & Policy Associates
MODIFIED ADP, Facility, Cost MODIFIED ADP, Facility, Cost ProjectionsProjections
MODIFIED ADP, Facility, Cost MODIFIED ADP, Facility, Cost ProjectionsProjections

23 K A&Law & Policy Associates
BASE & MODIFIED ADP BASE & MODIFIED ADP Projection SummaryProjection Summary
BASE & MODIFIED ADP BASE & MODIFIED ADP Projection SummaryProjection Summary
PROJECTION SUMMARY:2020 2030
ADP 2020TARGET BED NEED 2020
BED SHORTFALL ADP 2030
TARGET BED NEED 2030
BED SHORTFALL
BASE Projection 4,543 5,111 2,335 6,625 7,287 4,511
MODIFIED Projection 3,877 4,401 1,625 5,654 6,276 3,500
SAVINGS -666 -710 -971 -1,011

24 K A&Law & Policy Associates
Space Planning - MODIFIEDSpace Planning - MODIFIEDSpace Planning - MODIFIEDSpace Planning - MODIFIED Phase 1:Phase 1:
Initiate planning immediately Initiate planning immediately Similar 400 bed shortfall as today by 2012Similar 400 bed shortfall as today by 2012
1,644 new beds, 4,420 total when done1,644 new beds, 4,420 total when done 760 beds less760 beds less than BASE needs than BASE needs Satisfies needs through 2020Satisfies needs through 2020
Phase 2:Phase 2: 1,848 new beds, 6,268 total when done1,848 new beds, 6,268 total when done 1,056 total beds less1,056 total beds less than BASE than BASE Satisfies needs through 2030Satisfies needs through 2030

25 K A&Law & Policy Associates
Construction Costs - MODIFIED Construction Costs - MODIFIED Needs Needs (2008 dollars)(2008 dollars)
Construction Costs - MODIFIED Construction Costs - MODIFIED Needs Needs (2008 dollars)(2008 dollars)
Phase 1: $205-250 millionPhase 1: $205-250 million Annual payment at 5%, 20 yearsAnnual payment at 5%, 20 years $18.2 million $18.2 million (based on average project cost)(based on average project cost)
Phase 2: $210-255 millionPhase 2: $210-255 million Annual payment at 5%, 20 years Annual payment at 5%, 20 years $18.7 million$18.7 million

26 K A&Law & Policy Associates
Annual Operational Costs - Annual Operational Costs - MODIFIED Needs MODIFIED Needs (2007 dollars)(2007 dollars)
Annual Operational Costs - Annual Operational Costs - MODIFIED Needs MODIFIED Needs (2007 dollars)(2007 dollars)
Operations/Staffing/UtilitiesOperations/Staffing/Utilities::
Current Costs: $80 millionCurrent Costs: $80 million Future costs above current costs:Future costs above current costs:
Phase 1 in opening year (2012): +$3.1 Phase 1 in opening year (2012): +$3.1 million million (3.9%)(3.9%)
Phase 1 in 2020: +$32 million Phase 1 in 2020: +$32 million (40%)(40%) Phase 2 in 2030: +$70 million Phase 2 in 2030: +$70 million (89%)(89%)

27 K A&Law & Policy Associates
Combined Annual Cost Combined Annual Cost Increases- MODIFIEDIncreases- MODIFIEDCombined Annual Cost Combined Annual Cost Increases- MODIFIEDIncreases- MODIFIED
Phase 1 in opening year (2012): $21 Phase 1 in opening year (2012): $21 million million
Phase 1 in 2020: $50 million Phase 1 in 2020: $50 million Phase 2 in 2030: $107 million Phase 2 in 2030: $107 million
Includes overlapping building payments on Includes overlapping building payments on phases 1 & 2 ($18.2M & $18.7M)phases 1 & 2 ($18.2M & $18.7M)

K A&Law & Policy Associates
Estimated SAVINGS from Estimated SAVINGS from Implementing Consensus ChangesImplementing Consensus Changes
Estimated SAVINGS from Estimated SAVINGS from Implementing Consensus ChangesImplementing Consensus Changes

29 K A&Law & Policy Associates
COMBINED ANNUAL SAVINGSCOMBINED ANNUAL SAVINGS(Base minus Modified Costs)(Base minus Modified Costs)COMBINED ANNUAL SAVINGSCOMBINED ANNUAL SAVINGS(Base minus Modified Costs)(Base minus Modified Costs)
Phase 1 in opening year (2012): $17.3 Phase 1 in opening year (2012): $17.3 million million grossgross savings savings GrossGross System Change Cost = $2.6 million System Change Cost = $2.6 million NetNet savings = $14.7 million annual savings = $14.7 million annual More than More than 5 to 15 to 1 return on investment return on investment

30 K A&Law & Policy Associates
GrossGross Cost Estimate Summary Cost Estimate Summary(annual project and operational costs (annual project and operational costs in $millions)in $millions)
GrossGross Cost Estimate Summary Cost Estimate Summary(annual project and operational costs (annual project and operational costs in $millions)in $millions)
Calculated In Current Dollars
Year BASE Costs
MODIFIED
Costs
ANNUAL
SAVINGS
2012 $38.6 $21.3 $17.3
2020 $72.7 $50.2 $22.5
2030 $145.1 $107.4 $37.7

31 K A&Law & Policy Associates
GrossGross Life Cycle Cost Savings Life Cycle Cost SavingsGrossGross Life Cycle Cost Savings Life Cycle Cost Savings
Includes Building FinancingIncludes Building Financing 20 years, 5% average rate20 years, 5% average rate 7% inflation for Ph. 17% inflation for Ph. 1 4.5% inflation for Ph. 24.5% inflation for Ph. 2
Includes Inflation:Includes Inflation: CPI last 3 years = 2.7%CPI last 3 years = 2.7% 3% assumed 3% assumed
Over 19 year life cycle:Over 19 year life cycle: $780 million saved$780 million saved
0.0%
2.0%
4.0%
6.0%
8.0%
10.0%
12.0%
14.0%
16.0%
19
71
19
72
19
73
19
74
19
75
19
76
19
77
19
78
19
79
19
80
19
81
19
82
19
83
19
84
19
85
19
86
19
87
19
88
19
89
19
90
19
91
19
92
19
93
19
94
19
95
19
96
19
97
19
98
19
99
20
00
20
01
20
02
20
03
20
04
20
05
20
06
20
07
20
08
20
09
20
10
Inflation Rates
MECKLENBURG CO, NC MODIFIED Generic NeedsMODIFIED TOTAL LIFE CYCLE COSTS SUMMARY 4/10/08
Inflation Factor: 1.03Interest IMPACT OF IMPACT OF IMPACT OF5.00% SYSTEM SYSTEM SYSTEM
CONSTRUCTION/ MODIFICATIONS MODIFICATIONS MODIFICATIONS
OPERATIONS LOST CO. TAX PROJECT T O T A L T O T A L T O T A L T O T A L
Total Rev. with Net Savings from Annual Payment A N N U A L A N N U A L A N N U A L A N N U A L
YEAR Annual Cost Inflation Per Diems 2 Phases-Inflated E X P E N S E G R O S S S A V I N G S G R O S S C O S T S N E T S A V I N G SH + I - J + K = O P Q P
2008 2,593,229 ($2,593,229)2009 $0 $0 ($0) 2,767,183 ($2,767,183)2010 $0 $0 ($0) 2,952,806 ($2,952,806)2011 $0 $0 ($0) 3,150,880 ($3,150,880)2012 $95,710,708 $0 ($0) $22,308,394 $118,019,102 $20,601,661 3,362,241 $17,239,4202013 $103,684,268 $0 ($0) $22,308,394 $125,992,662 $21,837,305 3,587,781 $18,249,5242014 $111,726,277 $0 ($0) $22,308,394 $134,034,671 $23,087,127 3,828,450 $19,258,6772015 $119,846,113 $0 ($0) $22,308,394 $142,154,507 $24,351,522 4,085,262 $20,266,2602016 $128,053,607 $0 ($0) $22,308,394 $150,362,000 $25,622,993 4,359,299 $21,263,6942017 $136,327,008 $0 ($0) $22,308,394 $158,635,401 $26,917,567 4,627,031 $22,290,5362018 $144,675,557 $0 ($0) $22,308,394 $166,983,950 $28,211,590 4,906,905 $23,304,6862019 $153,100,671 $0 ($0) $22,308,394 $175,409,065 $29,529,449 5,199,406 $24,330,0432020 $163,686,617 $0 ($0) $52,677,139 $216,363,756 $36,160,437 5,505,042 $30,655,3952021 $176,601,363 $0 ($0) $52,677,139 $229,278,502 $41,535,426 5,824,336 $35,711,0912022 $189,580,832 $0 ($0) $52,677,139 $242,257,971 $44,356,726 6,157,833 $38,198,8932023 $202,642,918 $0 ($0) $52,677,139 $255,320,057 $47,180,111 6,506,098 $40,674,0142024 $215,770,884 $0 ($0) $52,677,139 $268,448,022 $50,022,960 6,869,717 $43,153,2432025 $228,973,888 $0 ($0) $52,677,139 $281,651,026 $52,876,615 7,249,297 $45,627,3182026 $242,234,077 $0 ($0) $52,677,139 $294,911,216 $55,759,282 7,645,470 $48,113,8132027 $255,569,466 $0 ($0) $52,677,139 $308,246,605 $58,643,888 8,058,888 $50,585,0002028 $268,961,419 $0 ($0) $52,677,139 $321,638,558 $61,548,715 8,490,231 $53,058,4852029 $282,418,636 $0 ($0) $52,677,139 $335,095,775 $64,455,034 8,940,201 $55,514,8332030 $295,930,905 $0 ($0) $52,677,139 $348,608,044 $67,381,561 9,409,529 $57,972,032
Totals $3,515,495,214 + $0 ($0) + $757,915,675 = $4,273,410,889 $780,079,971 $126,077,112 $654,002,85982.3% 0.00% (0.0%) 17.7%

32 K A&Law & Policy Associates
GrossGross Life Cycle Costs of Life Cycle Costs of Consensus Change & Consensus Change & NetNet Savings SavingsGrossGross Life Cycle Costs of Life Cycle Costs of Consensus Change & Consensus Change & NetNet Savings Savings
Life Cycle Costs of Consensus ChangesLife Cycle Costs of Consensus Changes $2.6 million in current dollars$2.6 million in current dollars 3% inflation annually, grow w/population3% inflation annually, grow w/population Costs begin in FY 2008-09Costs begin in FY 2008-09
GGROSS Life Cycle CostsROSS Life Cycle Costs = = $125 Million$125 Million NET Life Cycle Savings =NET Life Cycle Savings =
$655 Million$655 Million

33 K A&Law & Policy Associates
Maintaining the SavingsMaintaining the SavingsMaintaining the SavingsMaintaining the Savings
Continue to monitor/assess progressContinue to monitor/assess progress Develop monitoring tools and processesDevelop monitoring tools and processes Re-assess need for additional Re-assess need for additional
supporting assets regularly (staff, supporting assets regularly (staff, space, technology)space, technology)

K A&Law & Policy Associates
MECKLENBURG COUNTYMECKLENBURG COUNTYDetention Operations Master PlanDetention Operations Master Plan
MECKLENBURG COUNTYMECKLENBURG COUNTYDetention Operations Master PlanDetention Operations Master Plan
REPORTREPORTKIMME & Associates, Inc./Law & Policy Associates KIMME & Associates, Inc./Law & Policy Associates
with assistance from American Universitywith assistance from American UniversityApril 15, 2008April 15, 2008