layout 1 (page 1) - fisheries and oceans canada | … transportation chs’s exceptional nautical...
TRANSCRIPT

• www.chs-shc.gc.ca •

MARITIMETRANSPORTATION
CHS’s exceptional nauticalcharts and navigational
products help ensure thesafe navigation of
Canada's waterways.
COASTAL NATURALHAZARDS
CHS monitors tides and waterlevels — essential information
for detecting and predicting climate change and variability,
and natural hazards.
OCEAN AND FRESHWATER MAPPING
CHS uses the latest technology to collect high-
resolution data on the depth, shape and structure
of Canada's oceans,lakes and rivers.
SOVEREIGNTYCHS plays a vital
role in determiningCanada's maritime
boundaries and sovereignty.
THE CANADIANHYDROGRAPHICSERVICE (CHS)THE PILLARS OF OUR BUSINESS

Canada has the longest coastline of any country in the world.More than a third of its territory is under water. Its lakes,
rivers and ocean waters are used by millions of craft every year—for recreation and tourism, fishing and industry, international shipping
and national defence.
Since 1883, the Canadian Hydrographic Service has studiedthose waters to ensure their safe, sustainable and navigable use.
Today, taking advantage of technological advancements and more than a century of expertise, CHS is a recognized world leader
in hydrography.
We drive innovation. We share information. We work constantlyto deepen public knowledge of Canada’s waters.
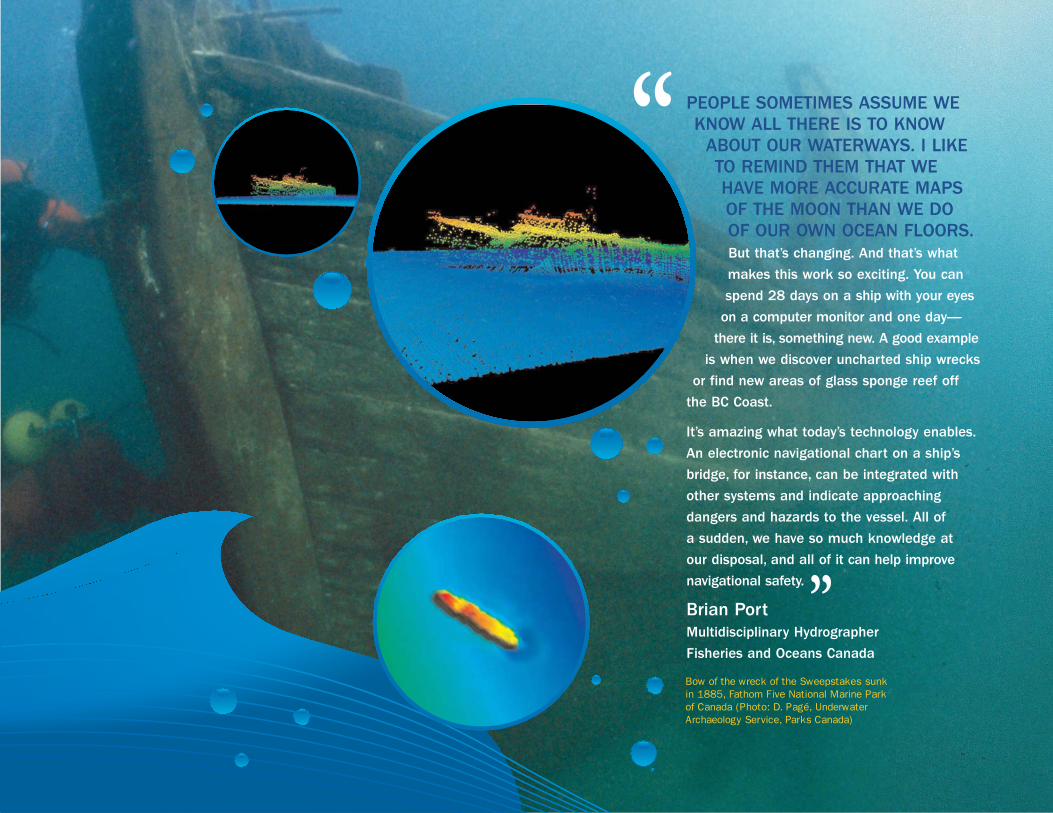
PEOPLE SOMETIMES ASSUME WEKNOW ALL THERE IS TO KNOW
ABOUT OUR WATERWAYS. I LIKETO REMIND THEM THAT WEHAVE MORE ACCURATE MAPSOF THE MOON THAN WE DO OF OUR OWN OCEAN FLOORS.But that’s changing. And that’s what
makes this work so exciting. You can
spend 28 days on a ship with your eyes
on a computer monitor and one day—
there it is, something new. A good example
is when we discover uncharted ship wrecks
or find new areas of glass sponge reef off
the BC Coast.
It’s amazing what today’s technology enables.
An electronic navigational chart on a ship’s
bridge, for instance, can be integrated with
other systems and indicate approaching
dangers and hazards to the vessel. All of
a sudden, we have so much knowledge at
our disposal, and all of it can help improve
navigational safety.
Brian PortMultidisciplinary Hydrographer
Fisheries and Oceans Canada
“
”Bow of the wreck of the Sweepstakes sunk in 1885, Fathom Five National Marine Park of Canada (Photo: D. Pagé, Underwater Archaeology Service, Parks Canada)

A DEEP COMMITMENT TO MARINE SAFETYIt was a tragedy on Georgian Bay that set inmotion the process that led to the creation of the Canadian Hydrographic Service. Onehundred and fifty people lost their lives whenthe steamship Asia went down in those darkOntario waters in 1883, and calls went outalmost immediately for a hydrographic surveyof the Great Lakes to make navigation safer.
Six years later, the surveying organizationthat would eventually become the CHS wasborn. Its mission soon expanded beyond theGreat Lakes to include all Canadian waterways.
In the more than 120 years since then, theCHS has channeled its in-depth knowledge andextensive expertise into the development ofnew technologies and scientific procedures—today offering everything from three-dimensionalviews of Canada’s seabeds to real-time updateson water levels in the St. Lawrence River.
WHAT WE DOHydrography is the scienceof measuring and describing
the features of seas andcoastal areas for the primary
purpose of navigation.A thousand chartsProducing trusted and authoritative informationof unparalleled accuracy, CHS answers theneeds of individual boaters and internationalshippers, fishers, industry, government andnon-governmental organizations that use,interact with and study this country’s rivers,lakes and oceans. We publish and maintainnearly a thousand nautical charts. The qualityof our work has been assessed and certifiedas meeting the requirements of the ISO9001:2000 standard—the international goldstandard for quality management systems.
• In 2007-08, CHS distributed more than124,000 charts and 73,000 publicationsvia some 800 authorized dealers aroundthe world.
• In 2007, CHS began distributing electronicnavigational charts in S57 format as wellas raster (BSB) navigational charts.
• CHS now licenses access to its intellectualproperty (IP) to more than 500 private-and public-sector clients, and is a partnerin the development of ocean technologyand applications. Our IP includes a host of information on waterways and theirenvirons, and is used to design newmarine infrastructures, plot shippingroutes and much more.

How do we gather nautical information? With about 300 employees and access to the Canadian Coast Guard ships, our relativelysmall organization is distributed across fourregions: Atlantic, Quebec, Central and Arctic,and Pacific. We conduct regular field surveys—especially for higher-risk, higher-priority areas—with both shore parties and marine vesselsincluding specialized hydrographic craft.
We get it all done in part through collaboration,which helps us get the maximum research value for our efforts. By sharing ship time thatis often costly with other groups conductingmarine research—such as Parks Canada, theGeological Survey of Canada and other partsof DFO as well as the Canadian Coast Guard—we take advantage of every opportunity to take hydrographic and oceanographicmeasurements.
Science that goes beneath the surfaceToday’s CHS is a division of the Science Branchof the Department of Fisheries and OceansCanada. As such, the work of CHS supports
the overarching mandate of the ScienceBranch to:
• Ensure safe and accessible waterwaysby producing exceptional navigational products and services, and by supportingmaritime safety and security.
• Maintain sustainable fisheries and aquaculture operations by monitoring and assessing resources, helping protectspecies at risk and more. Contributingactively to science management withinFisheries and Oceans Canada and otherdepartments of the federal governmentand studying interactions between aquaculture and the environment andapplying genomics and biotechnology to aquatic ecosystems is all part of this process.
• Support healthy and productive aquatic ecosystems by keeping an eye on the impact of human developments,assessing the vitality of aquatic ecosystems, and keeping watch over changes in ocean climates.
TAKING THE MEASUREMENTS OFCANADA’S WATERWAYS
Canada on the water: A SNAPSHOT
Length of Canada's coastline: nearly 250,000 kms
Highest tides in the world: Canada’s Bay of Fundy
Number of pleasure craft in Canada: 2 million
Number of commercial vessels using Canadian waters:
22,000
photo: Paul Galipeau
photo: Paul Galipeau
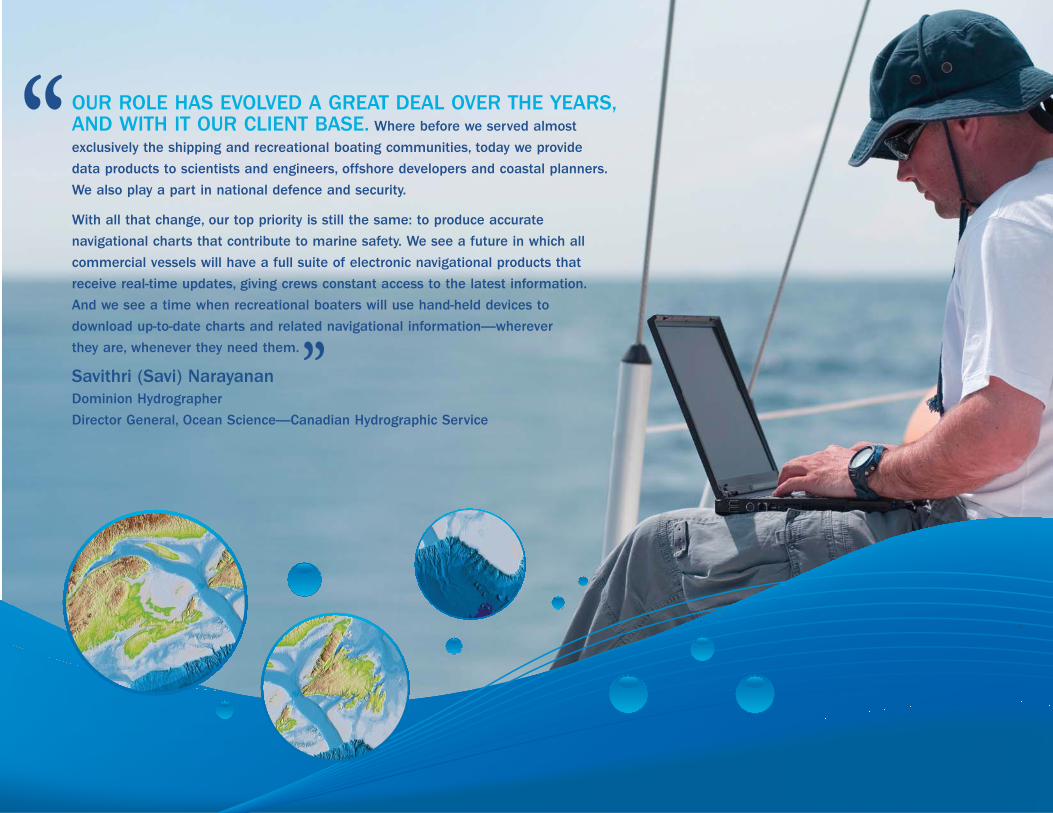
OUR ROLE HAS EVOLVED A GREAT DEAL OVER THE YEARS,AND WITH IT OUR CLIENT BASE. Where before we served almost
exclusively the shipping and recreational boating communities, today we provide
data products to scientists and engineers, offshore developers and coastal planners.
We also play a part in national defence and security.
With all that change, our top priority is still the same: to produce accurate
navigational charts that contribute to marine safety. We see a future in which all
commercial vessels will have a full suite of electronic navigational products that
receive real-time updates, giving crews constant access to the latest information.
And we see a time when recreational boaters will use hand-held devices to
download up-to-date charts and related navigational information—wherever
they are, whenever they need them.
Savithri (Savi) NarayananDominion Hydrographer
Director General, Ocean Science—Canadian Hydrographic Service
“
”

Since 1951, Canada has been an active member of the International HydrographicOrganization (IHO), working with countriesaround the world to develop internationalcharting standards as well as new technologiesfor surveying and mapping the sea floor.
Marine transportation is a global activity andconsistency among products and servicesfrom one region to another contributes greatlyto better comprehension of information
ACTIVE AROUND THE WORLD
important to safe navigation. In addition, uniform standards allow for integration ofhydrographic information across scientific and international boundaries which contributeto better overall understanding of the coastal and offshore environment. CHS’ close association with IHO ensures thatCanadian navigational products and hydrographic data adhere well to international standards.

The critical importance of hydrography is summed up in the motto of CHS: “Nauticalcharts protect lives, property and the marine environment.”
As Canada’s hydrographic authority, CHS surveys the country’s navigableinland and marine waters—to the edge of the continental shelf and beyond.Our charts are the ‘road maps’ that guide mariners safely from port to port. They provide an incredible wealth of detail: depths, buoys, lighthouses, hazards and more.
Hydrography has changed, of course, over the past 120 years.Traditional leadlines and triangulation methods are used only infrequently:innovations such as multibeam sounders and the satellite-based GlobalPositioning Systems (GPS) make the work done today more comprehensiveand accurate than ever before.
DEEP EXPERTISE IN HYDROGRAPHY
NOWThese have been displaced by:
• multibeam sounding, which uses highly advanced SONAR technology to provide high-resolution digital views of the ocean environment.
Techniques and technologies: from then to now
THENTraditional approaches to hydrography include:
• the use of lead lines, which are weighted lines lowered into the water to measure depth; and
• triangulation, which uses mathematics based on the points of a triangle to establish coordinates and the distances between points.

AN UNYIELDINGCOMMITMENT TO QUALITYThe charts of Canadian waters produced by CHS are the most authoritative and completeavailable—renowned the world over for their quality. Every time we receive notice that a buoyhas moved, a wharf has been built or an undersea cable laid, we update our charts promptly.These corrections were once made exclusively by hand, but with the help of on-demand printingtechnology, we’re able to add changes via computer and generate fresh copies with all the latest updates included. In 2007, CHS received more than 55,000 print-on-demand orders.
Navigation in the digital eraWith the addition of Electronic Navigational Charts (ENCs) and
raster electronic charts to its library, CHS has tripled the size of itstraditional product line. Burned to CD-ROMs, these ENCs run on
onboard computers and allow for onscreen navigation. A pioneerin this area, Canada has one of the largest ENC portfolios inthe world.
Electronic charts have the potential to provide more information than their paper cousins. For example, they canreveal multi-dimensional views of waterways, showing theshape and the depth of the lake or sea floor and revealing
alternative points of view. They can even capture relativelysmall-scale attributes such as the height, length, age and
ownership of a specific wharf—at the click of a computer mouse.Electronic data are available in two forms: the full navigational chart
with all the details and a simpler ‘raster’ version popular on pleasurecraft. (Raster graphics are also called ‘bitmaps’, and basically use grids ofpixels to render images onscreen.)Sailing directions are the indispensable
companions to charts, offering descriptions(including photographs) of the best
approaches to harbours, harbour facilities,anchorages, local history, rules, regulations
and tables of distances.

Navigational aid: Charts andpublications from CHSCHS receives orders by phone, e-mail and faxevery year from some 800 chart dealers inCanada, the United States and as far away as Japan. CHS distributes a total of nearly300,000 charts, tide tables, and other nauticalpublications every year including:
• Sailing directions featuring brief descriptions of main port and harbour facilities, diagrams showing marinas, fishing harbours and more.
• Digital charts on CD—with free technical support and easy access to updates.
• Paper charts—946 in all, covering all three of the country’s coastlines plus major inland waterways.
• Chart catalogues—collections of nautical charts for planning and reference.
• Canadian tide and current tables—giving the predicted times and heights of high and low waters associated with the vertical movement of tides, slack water and current velocities, hourly tidal current atlases and more.
• Tidal current atlases—indicating the directionand velocity of surface currents at different periods of time.
• Online water level bulletins for the Great Lakes and Montreal, continually updated at www.waterlevels.gc.ca.
Keeping pace with change
A further challenge for CHS is to keep up with changes to Canada's
waterscape. High-traffic areas such as theGreat Lakes shipping lanes and popularrecreational areas like the Trent-Severn
Waterway are high priorities for resurveying.In the western Arctic, artificial islands nolonger used for oil and gas development are changing shape due to ice scouring and currents—presenting a navigational
hazard and earning a place on the priority list as well.
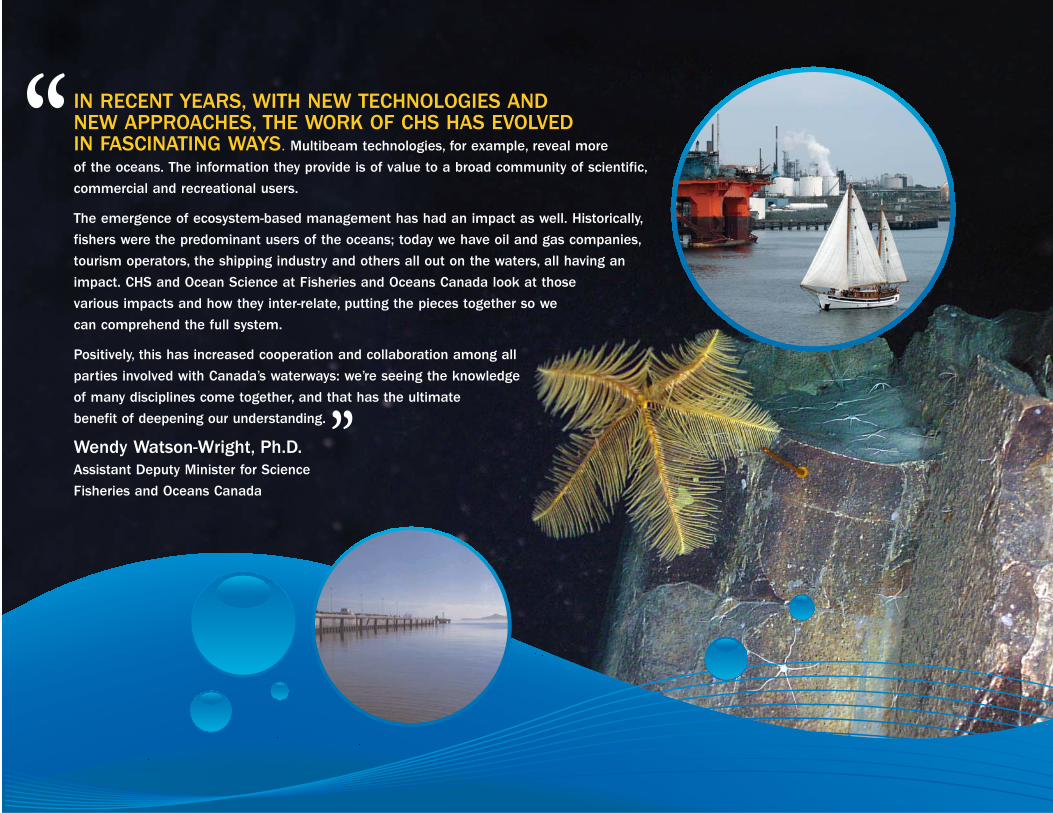
IN RECENT YEARS, WITH NEW TECHNOLOGIES AND NEW APPROACHES, THE WORK OF CHS HAS EVOLVED IN FASCINATING WAYS. Multibeam technologies, for example, reveal more
of the oceans. The information they provide is of value to a broad community of scientific,
commercial and recreational users.
The emergence of ecosystem-based management has had an impact as well. Historically,
fishers were the predominant users of the oceans; today we have oil and gas companies,
tourism operators, the shipping industry and others all out on the waters, all having an
impact. CHS and Ocean Science at Fisheries and Oceans Canada look at those
various impacts and how they inter-relate, putting the pieces together so we
can comprehend the full system.
Positively, this has increased cooperation and collaboration among all
parties involved with Canada’s waterways: we’re seeing the knowledge
of many disciplines come together, and that has the ultimate
benefit of deepening our understanding.
Wendy Watson-Wright, Ph.D.Assistant Deputy Minister for Science
Fisheries and Oceans Canada
“
”

GOING EVEN DEEPEROcean science expands the view of Canada’s waterways to include all of what’s known as the ‘water column’—the entire extent of water between the surface and the floor. A whole range of important factors are measured and tracked—from climate and temperature to plankton densities (which are important both to ocean food chains and also to the seas’ ability to process carbon).
‘Seeing’ into the oceansCanada is a world-renowned leader in multibeam systems modelingtechnologies. Oceans modeling and remote sensing provide multidi-mensional, real-time information about water, sea floor, coastal and
bank conditions in waterways such as the St. Lawrence River.
Multibeam imagery allows fishers to view the seabed and target specific species. This is important for environmental
reasons—for example, scallop fishers can reduce the area of seabedthey disturb with their rakes since they know which seabeds are
most likely to contain scallops.
The ability of multibeam systems to produce an aerial photograph-like image of the seabed has led to a demand
for multibeam mapping to support other applications such as mapping pipeline and cable routes, proposed marine protected
areas, and fishing grounds.

The role of Integrated Science Data Management (ISDM) is to collect, record and share data from ocean areas adjacent to Canada—on everything from tide and water levels to contaminants affecting marine life and their habitats. ISDMsupports the development of databases and other toolsused by CHS nationally to deliver products and services;
contributes to national and international standards;and works with other programs to provide expert
advice in designing and developing customapplications.
INTEGRATED SCIENCEDATA MANAGEMENT
Across the oceansISDM is a member of the InternationalOceanographic Data and Information Exchange (IODE).IODE strives to enhance marine research and development by facilitating the exchange of oceanographic data and information among participatingcountries to meet user needs for data and information products.
One of ISDM’s roles through IODE is to serve as the Responsible NationalOceanographic Data Centre (RNODC), archiving data collected by drifting buoys—
like those used in the Argo project—all over the globe. Canada, through ISDM,has been the world’s RNODC since 1986.
photo: Paul Galipeau

Bobbing for data: ArgoISDM is instrumental in managing the datacollected through Canada’s participation inArgo, an exceptional international projectthat measures ocean conditions literally allover the globe and shares the information inreal-time via satellite technology. Over twentycountries participate in the project—cooper-ating to deploy, monitor and maintain a ‘fleet’of some 3,000 sophisticated profiling floats(i.e., buoys). These drift around the world’soceans, sinking to pre-programmed depths of2,000 metres for specific lengths of time,then rise to the surface, taking a variety ofimportant measurements as they ascend.
Today, Argo data is used for weather forecasting, fishery planning and a wholerange of other applications. Anyone with a computer can access Canadian Argo information at www.meds-sdmm.dfo-mpo.gc.ca.Argo data from around the globe can beaccessed at www.coriolis.eu.org/cdc/ orwww.usgodae.org/cgi-bin/argo_select.pl.
Information Canadians count onAmong its many services and responsibilities,ISDM is looked to most often for its:
• Tide and water-level data—tracked, analyzedand distributed monthly based on input fromremote stations, and stored in an extensive database that today contains over 30 millionrecords going back more than 100 years. This information—the most popular offered by CHS—is crucial for marine safety and effective planning by commercial shippers, and is also used regularly by recreationalboaters.
• Wave data—surface gravity observations (basically, wave height and frequency) gathered and recorded hourly from more than 500 locations around Canada. ISDM’s databases contain information on more thansix million wave spectra (spectra represent the distribution of wave energy as a functionof frequency). This information is used increasingly to support new ventures such as wave-powered electricity-generation operations.
• Atlantic zone monitoring data—biological, chemical and physical information on the northwesternAtlantic Ocean gathered through the Atlantic Zone Monitoring Program (AZMP). AZMP provides an ever-expanding perspective on seasonal, annual and longer-term changes in ocean conditions including sea levels, climate and weather.
• Contaminants information—collected in the National Contaminants Information System (NCIS), a database on toxic chemicals found in fish, other aquatic life and marine habitats.

DEEPEN YOUR KNOWLEDGEVisit CHS online today or stop in at one of our reseller locations across Canada and access the charts and information you need for your use of the country’s waterways.
Canadian Hydrographic Service615 BoothOttawa, ONK1A 0E6Ph: (613) 998-4931Fax: (613) 998-1217E-mail: [email protected]
Published by:
Communications Branch Fisheries and Oceans Canada Ottawa, Ontario K1A 0E6
DFO/2008-1461
©Her Majesty the Queen in Right of Canada 2008 Cat. No. Fs72-41/2008 ISBN 978-0-662-05846-5 paper ISBN 978-1-100-10178-1 PDF English ISBN 978-0-662-04424-6 PDF French
Printed on recycled paper