layout design ii. - encsandrea/indu421/presentation 9 (lay… · layout design ii. chapter 6 layout...
TRANSCRIPT

Layout design II. Chapter 6
Layout generation
Pairwise exchange method
Graph-based method
CRAFT

Methods for layout design
Layout evaluation
◦ Distance-based scoring
◦ Adjacency-based scoring
Layout generation
◦ Construction algorithms
Building a block layout by iteratively adding departments
◦ Improvement algorithms
Incrementally improving an initial block layout

Construction algorithms
SELECT an activity to be placed
PLACE the selected activity in the layout
Selection rules ◦ Choose the departments based on the importance
scores (first place all A, then all E, all I, etc.)
◦ Choose the departments having the largest number of A (E, I, etc.) relationships with the departments already in the layout.
◦ Supplement the methods with a procedure for choosing first department and breaking ties.
◦ Consider costs and user specified placement priorities.

Construction algorithms
Placement rules
◦ Contiguity Rule
If an activity is represented by more than one unit area square, every unit area square representing the activity must share at least one edge with at least one other unit area square representing the activity.
◦ Connectedness Rule
The perimeter of an activity must be a single closed loop that is always in contact with some edge of some unit area square representing the activity.
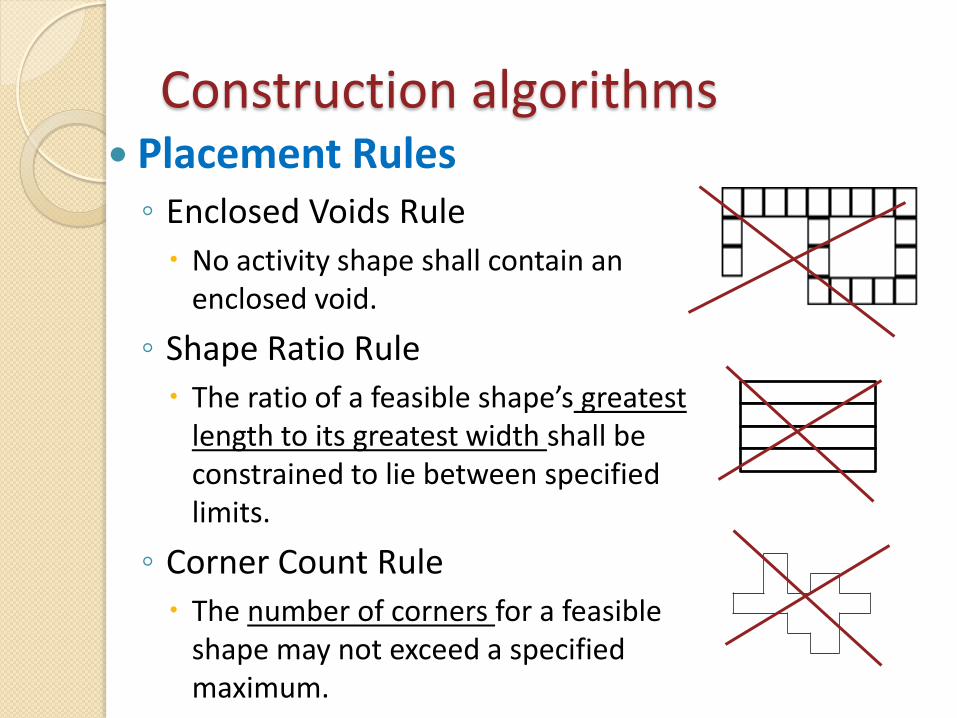
Construction algorithms Placement Rules ◦ Enclosed Voids Rule
No activity shape shall contain an enclosed void.
◦ Shape Ratio Rule
The ratio of a feasible shape’s greatest length to its greatest width shall be constrained to lie between specified limits.
◦ Corner Count Rule
The number of corners for a feasible shape may not exceed a specified maximum.
6
Improvement algorithms
“Move” departments around within the block plan.
If the shapes of the departments are not fixed ◦ Too many degrees of freedom to devise a good method for
modifying the block plan.
◦ Most of improvement algorithms limit the kinds of changes that are permitted.
◦ Basic procedure
CHOOSE a pair (or triple) of activities
ESTIMATE the effect of exchanging them
EXCHANGE them
CHECK to be sure the new layout is better
REPEAT until no more improvements are possible

Algorithm classification
Construction algorithms Improvement algorithms
Graph-based method ALDEP
CORELAP PLANET
Pairwise exchange method CRAFT
MCCRAFT MULTIPLE
BLOCPLAN LOGIC
Mixed integer programming

Distance Calculations
Centroid is a center of mass

Distance Calculations If (xi,yi) and (xj,yj) represent the coordinates of two
locations i and j then the distance model measures can be:
◦ Rectilinear: distance between i and j is
D = |xi-xj| + |yi-yj|
◦ Euclidean: distance between i and j is
A
B
A
B
22
jiji yyxxD

Distance Calculations
Rectilinear distance from
centroid to centroid
Euclidean distance from centroid to centroid
y
x x1 x2
y1
y2
y
x x1 x2
y1
y2

Rectilinear distance from A to B: D (AB) = 1.5 + 1 = 2.5
Rectilinear distance from B to C: D (BC) = (5-1.5) + (1+1.5) = 3.5 + 2.5 = 6
Distance Calculations

Pairwise exchange method
For layout improvement
Distance-based objective
The objective is to minimize the total cost of transporting materials among all departments in a facility ◦ Based on rectilinear distance from centroid to
centroid
Since the final outcome is based on the initial layout, we might not converge to the optimal solution

Pairwise exchange method Procedure Calculate total cost for the existing layout For each iteration evaluate all feasible
exchanges in the locations of department pairs
Select the pair that results in the largest reduction in total cost
Recompute the distance matrix each time an exchange is performed
If the lowest total cost for your next iteration is worse than the total cost for the previous iteration, the procedure is terminated
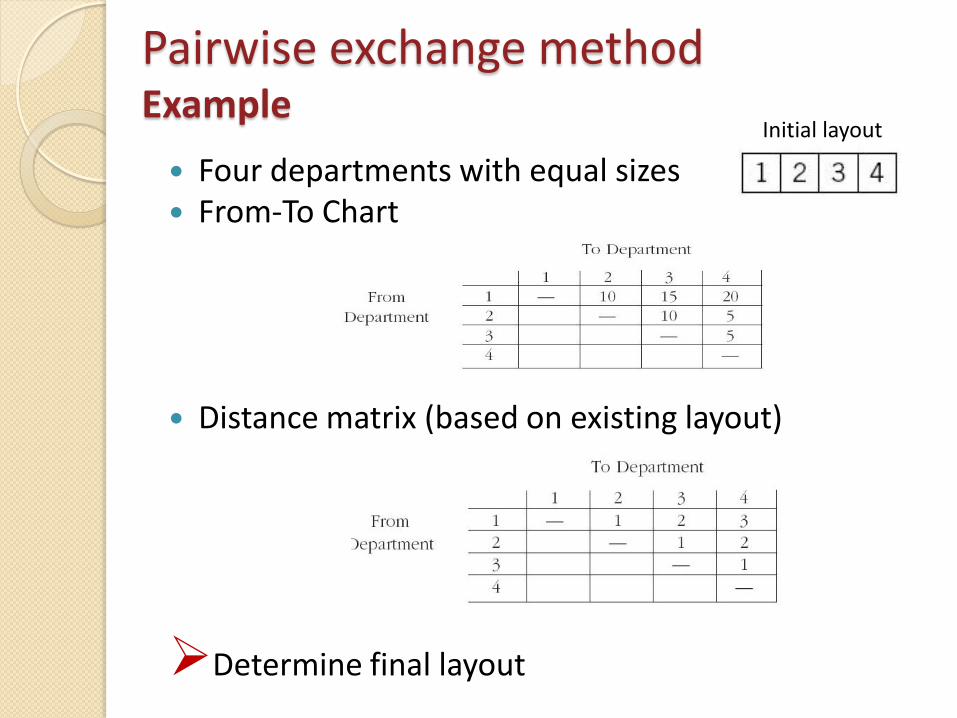
Four departments with equal sizes From-To Chart
Distance matrix (based on existing layout) Determine final layout
Pairwise exchange method Example
Initial layout

Pairwise exchange method Example
From-To Chart
Distance matrix - initial layout
The lowest cost => next iteration
TC1234=10*1 + 15*2 + 20*3 + 10*1 + 5 *2 + 5*1 = 125
Evaluate all feasible pairwise exchanges:
Total cost for the existing layout:
Switch departments 1-2, 1-3, 1-4, 2-3, 2-4, and 3-4
m
i
m
j
ijijij dcfz1 1
2 1 3 4
3 2 1 4
4 2 3 1
1 3 2 4
1 4 3 2
1 2 4 3
Switching: 1-2
1-3
1-4
2-3
2-4
3-4

Pairwise exchange method Example
Repeat the switching between departments 1-2, 1-3, 1-4, 2-3, 2-4, and 3-4. ◦ Sequence 2314 with total score of 90 is the best
option
The process is repeated until the lowest total score cannot be reduced anymore.
In this particular case the best option is 2314.
TC2314=10*2 + 15*1 + 20*1 + 10*1 + 5 *3 + 5*2 = 90

Pairwise exchange method
The method does not guarantee the optimality, only local optimum
The procedure may cycle back to one alternative
Symmetric layout may occur
Pairwise exchange can be easily accomplished only if the departments are of the same size

Graph-based method
For layout construction
Adjacency-based objective
Adjacency graphs for block layouts:
1
1 1
m
i
m
ij
ijij xfz

Graph-based method
• Relationships are given by weights, rather than the alphabetic closeness ratings
• The score is very sensitive to the assignment of weights
• Relationship can have a positive value only when departments are adjacent. Other relationships are ignored
• The adjacency score does not account for:
• The distance
• All he relationships (except those between adjacent departments)
• Dimensional specifications
• The length of common boundaries between adjacent departments
The arcs do not intersect (planarity)

Graph-based method Procedure 1. Select the department pair with the
largest weight ◦ Ties are broken arbitrarily
2. Select the third department to enter based on the largest sum of the weights with the first two departments
3. Pick the fourth department to enter on a face of the graph (a bounded region of a graph)
4. Determine an adjacency graph 5. Construct a corresponding block layout

Graph-based method Example
• Step 1: Select the department pair which has the highest weight (3-4)
• Step 2: Select the third department based on the sum of the relationship with both selected two departments in step 1 (2)

Total 9
• Step 4: Finally, for the fifth department we look inside of all the formed triangles. The sum of their weights which gets the highest value is chosen as the location (1-2-4)
• Step 3: Select the next department and place it on a face - inside the triangle (1)
Graph-based method Example

• Step 5: Based on the final adjacency graph a corresponding block design is constructed (based on the required and available dimensions)
Graph-based method Example
Connected departments are adjacent Each wall should cross only one adjacency line

CRAFT Computerized Relative Allocation of Facilities Technique
For improvement of an existing facility Attempts to minimize transportation cost, where
Transportation cost = flow * unit cost * distance
Assumptions ◦ Moving costs are not dependent on the equipment utilization.
◦ Moving costs are linearly related to the length of the move.
Distance metric used is the rectilinear distance between department centroids.
• Input is FT Chart (From-To chart)
• Department shapes are not restricted to the rectangular ones
m
i
m
j
ijijij dcfzMin1 1

CRAFT Procedure
1. Determine department centroids. 2. Calculate rectilinear distance between centroids. 3. Calculate transportation cost for the layout. 4. Consider department exchanges of either equal area
departments or departments sharing a common border.
5. Determine the estimated change in transportation cost of each possible exchange.
6. Select and implement the departmental exchange that offers the greatest reduction in transportation cost.
7. Repeat the procedure for the new layout until no interchange is able to reduce the transportation cost.

CRAFT Example • A facility with 7 departments
• Cost of carrying any material cij = 1 for all i and j pairs.
• Each grid size is 20 X 20, total 72,000 m2 is available
• Total requirement is 70,000 m2
• Location of receiving (A) and shipping (G) departments are fixed
Improve the layout
• Total available space > total required space:
therefore we use a dummy department (H) with the size of 2,000 m2
1 2 3 4 5 6 7 8 9 10 11 12 13 14 15 16 17 18
1 A A A A A A A A A A G G G G G G G G
2 A A G G Shipping
3 A A A A A A A A A A G G G G Department
4 B B B B B C C C C C E E G G G G G G
5 B B C C E E E E E E E E
6 B B C C C C C E E E E E E E E
7 B B B B B D D D D F F F F F F F E E
8 D D D D D D D F F F
9 D D F F F F F F
10 D D D D D D D D H H H H H F F F F F
Dummy Department
Receiving D. Shipping D.

Distance between A and B is 6 units (illustrated by the red line above)
1. Determine department centroids. 2. Calculate rectilinear distance
between centroids. 3. Calculate transportation cost for
the layout.
CRAFT Example
m
i
m
j
ijijij dcfz1 1

CRAFT Example
1 2 3 4 5 6 7 8 9 10 11 12 13 14 15 16 17 18
1 A A A A A A A A A A G G G G G G G G
2 A A G G Shipping
3 A A A A A A A A A A G G G G Department
4 B B B B B C C C C C E E G G G G G G
5 B B C C E E E E E E E E
6 B B C C C C C E E E E E E E E
7 B B B B B D D D D F F F F F F F E E
8 D D D D D D D F F F
9 D D F F F F F F
10 D D D D D D D D H H H H H F F F F F
Dummy Department
Receiving D. Shipping D.
1. Bringing the departments E and D closer might help to reduce total material flow
2. Bringing the departments F and G closer might help to reduce total material flow
Which departments to exchange?
Exchange E and F
Departments E and F can be reorganized only if they have the same areas OR they have common border

CRAFT Selection Criterion for Exchange
Estimated change in the transportation cost:
◦ Consider two departments i and j:
Let the centroids of each location be Li and Lj
Assume that after the exchange, the new centroid of i becomes Lj and the centroid of j becomes Li.
Compute the change in the total transportation cost by using the new estimated centroids Centroids of the two departments are temporarily swapped
The actual size of cost reduction can be overestimated or underestimated

CRAFT Swapping the centroids
1 2 3 4 5 6 7 8 9 10 11 12 13 14 15 16 17 18
1 A A A A A A A A A A G G G G G G G G
2 A A G G Shipping
3 A A A A A A A A A A G G G G Department
4 B B B B B C C C C C E E G G G G G G
5 B B C C E E E E E E E E
6 B B C C C C C E E E E E E E E
7 B B B B B D D D D F F F F F F F E E
8 D D D D D D D F F F
9 D D F F F F F F
10 D D D D D D D D H H H H H F F F F F
Dummy Department
Receiving D. Shipping D.
Centroid of E Centroid of F
Centroid of F Centroid of E
To calculate the estimated change in cost after the
exchange:

Estimation of the change in transportation cost
CRAFT Example Trial distance matrix
Trial cost matrix Initial cost matrix

CRAFT Exchanging two departments
If the areas of the two departments are of equal sizes one department takes the shape of the other.
If the areas are not identical:
◦ Draw a box enclosing the two departments (this enclosed shaped includes the grids of the two departments only)
◦ Count the number of grids of the smaller department. Let this count be k
◦ Count k grids from the non-adjacent side of the larger department. These grids now become the new location of the smaller department. The space emptied by the smaller department now becomes part of the larger department’s new territory

CRAFT Exchanging two departments

1 2 3 4 5 6 7 8 9 10 11 12 13 14 15 16 17 18
1 A A A A A A A A A A G G G G G G G G
2 A A G G Shipping
3 A A A A A A A A A A G G G G Department
4 B B B B B C C C C C E E G G G G G G
5 B B C C E E E E E E E E
6 B B C C C C C E E E E E E E E
7 B B B B B D D D D F F F F F F F E E
8 D D D D D D D F F F
9 D D F F F F F F
10 D D D D D D D D H H H H H F F F F F
Dummy Department
Receiving D. Shipping D.
CRAFT Example – exchanging E and F
New Layout – after exchanging E and F
1 2 3 4 5 6 7 8 9 10 11 12 13 14 15 16 17 18
1 A A A A A A A A A A G G G G G G G G
2 A A G G
3 A A A A A A A A A A G G G G
4 B B B B B C C C C C F F G G G G G G
5 B B C C F F F F F F F F
6 B B C C C C C F F F F F F F
7 B B B B B D D D D E E E E E E F F
8 D D D D D D D E E F F
9 D D E E E E E E F F
10 D D D D D D D D H H H H H E E F F F
Receiving D. Shipping D.
Department E needs less space than department F. Then:
Starting from the non-adjacent side of department F, locate all the cells for department E
E

CRAFT Example
Final Layout – after exchanging B and C
Receiving D. Shipping D.
1 2 3 4 5 6 7 8 9 10 11 12 13 14 15 16 17 18
1 A A A A A A A A A A G G G G G G G G
2 A A G G
3 A A A A A A A A A A G G G G
4 C C C B B B B B B B F F G G G G G G
5 C C C B B F F F F F F F F
6 C C B B B B B B F F F F F F F
7 C C C C B D D D D E E E E E E F F
8 D D D D D D D E E F F
9 D D E E E E E E F F
10 D D D D D D D D H H H H H E E F F F

Manual Adjustment on CRAFT output
CRAFT Example

CRAFT Insufficiency of Adjacency for Exchange
If 2 departments are not equal in area, then adjacency is a necessary but not sufficient condition for an exchange
CRAFT is unable to exchange departments 2 and 4 without splitting the department 2 or shifting other departments

CRAFT - Pros
CRAFT is flexible with respect to department shapes. In theory, CRAFT is applicable only to rectangular facilities, yet using dummy
extensions, we can still apply CRAFT algorithm to non-rectangular shapes.
Dummy departments
• Have no flows or interaction with other departments
• Require certain area
• Can be fixed
• Used for: Non-rectangular facilities
Fixed areas in the layout (obstacles, unusable areas, etc.)
Aisle locations
Extra space
Building irregularities
CRAFT captures the initial layout with reasonable accuracy

CRAFT - Cons
Locally optimal solution only
◦ CRAFT is a path-oriented method so the final layout is dependent on the initial layout. Therefore, a number of different initial layouts should be used as input to the CRAFT procedure.
CRAFT may lead to irregular shapes both for individual departments and the facility itself.
◦ Most of the time, a manual “finishing” must be done before presenting the CRAFT output.
It is not always possible to exchange two unequal size, adjacent departments without splitting the larger one.

Next lecture
Layout generation
◦ MCRAFT
◦ BLOCPLAN
◦ LOGIC