lbbw fixed income conference 2015.€¦ · bmw group automotive: balanced sales ... business lines...
TRANSCRIPT

LBBW FIXED INCOME CONFERENCE 2015.
Stuttgart, September 29, 2015
BERND DASER,INVESTOR RELATIONS.
AGENDA.
1 OPERATING PERFORMANCE 2015
2 FUTURE GROWTH
3 FUNDING THE GROWTH: BMW GROUP TREASURY ACTIVITIES
4 SUMMARY

BMW Group Investor Presentation, LBBW Fixed Income Conference, 09/2015 Page 3
BMW GROUP POSTS SOLID FIRST HALF-YEAR RESULTS.
Profit before tax - BMW Group
H1-2015: € 4,851 mn H1-2014: € 4,813 mn +0.8
PBT margin: 10.8% PBT margin: 12.6% -1.8 pp
EBIT - Automobiles
H1-2015: € 3,613 mn H1-2014: € 3,741 mn -3.4
EBIT margin: 8.9% EBIT margin: 10.7% -1.8 pp
Revenues - BMW Group Change in %
H1-2015: € 44,852 mn H1-2014: €38,140 mn +17.6
Deliveries to Customers (in units) - Automobiles
H1-2015: 1,099,748 H1-2014: 1,020,211 +7.8
Revenues - Automobiles
H1-2015: € 40,543 mn H1-2014: € 35,063 mn +15.6
Free Cash Flow - Automobiles
H1-2015: € 2,557 mn H1-2014: € 1,002 mn .
EBT - Financial Services
H1-2015: € 1,055 mn H1-2014: € 905 mn +16.6
2014 numbers adjusted

9.0 8.8
8.1 7.9 7.8
6.76.4 6.4
1.4
-0.6
8.0
11.8
10.8
9.4
9.6
8.9
-2
-1
0
1
2
3
4
5
6
7
8
9
10
11
12
13
2000 2001 2002 2003 2004 2005 2006 2007 2008 2009 2010 2011 2012* 2013 2014 H1-2015
in %
*) 2012 figures have been adjusted in accordance with the revised version of IAS 19, see note 7 on page 106 of the annual report 2012.
Target
corridor
BMW Group Investor Presentation, LBBW Fixed Income Conference, 09/2015 Page 4
EBIT MARGIN DEVELOPMENT AUTOMOTIVE SEGMENT.TARGET PROFITABILITY OF 8-10%.
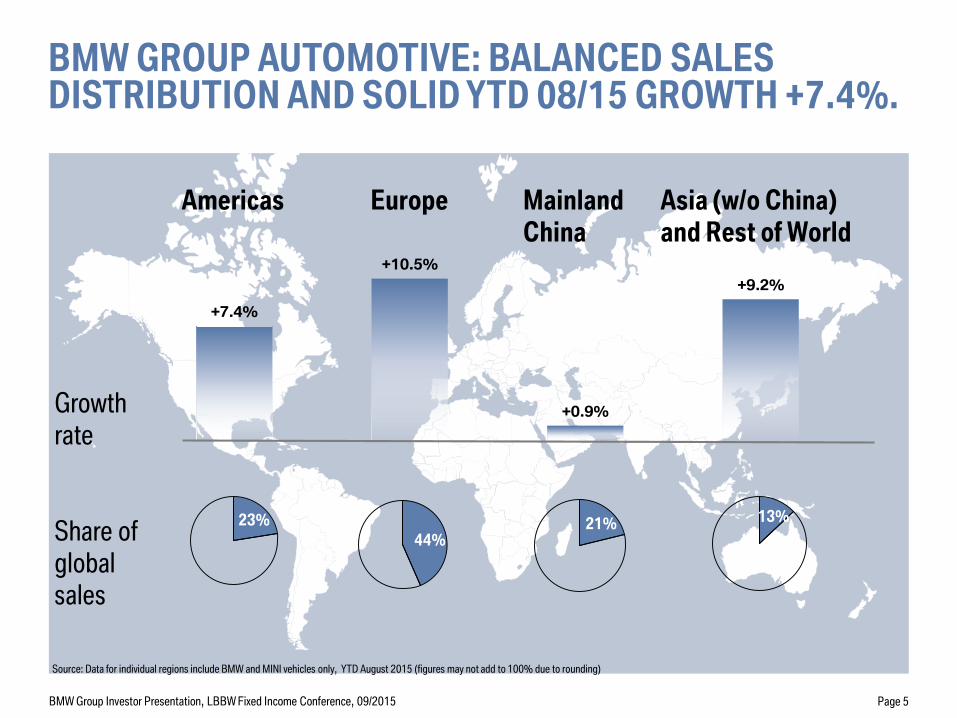
+7.4%
+10.5%
+0.9%
+9.2%
BMW GROUP AUTOMOTIVE: BALANCED SALES DISTRIBUTION AND SOLID YTD 08/15 GROWTH +7.4%.
Share of
global
sales
Source: Data for individual regions include BMW and MINI vehicles only, YTD August 2015 (figures may not add to 100% due to rounding)
Growth
rate
Mainland
China
Asia (w/o China)
and Rest of World
Americas Europe
23%
44%21% 13%
Page 5BMW Group Investor Presentation, LBBW Fixed Income Conference, 09/2015

BMW GROUP FINANCIAL SERVICES IS AN INTEGRAL PART OF THE AUTOMOTIVE VALUE CHAIN .
Global Presence June 2015
Global Operations in 54 Countries
Business Lines (Portfolio Size Q2/2015)
BankingInsurance
Multi Make
Financing
Commercial FinanceRetail Finance
€ 15.6 bn
€ 7.9 bn
€ 9.3 bn
€ 74.0 bn
3.0 mn Contracts
Fleet
Business
€ 10.2 bn
Page 6BMW Group Investor Presentation, LBBW Fixed Income Conference, 09/2015
29%
25%16%
30%
~4.1 Million Serviced Retail Contracts
EU Bank
EMEA
Americas
Asia, Pacific

13.6%
17.8% 17.8%19.2% 19.5%
17.1% 17.2% 17.4%
20.9%
24.7% 24.1%
20.0% 20.7%22.5%
20.8%23.9%
20.9%
17.2% 18.3%
19.1%
22.5%24.0%
25.2%27.2%
27.6%
24.3%24.1%
21.1% 19.7%
21.5%
20.9%
21.2%
0%
5%
10%
15%
20%
25%
30%
35%
40%
45%
50%
55%
2000 2001 2002 2003 2004 2005 2006 2007 2008 2009 2010 2011 2012 2013 2014 H1-2015
Financing Leasing
34.5% 35.0%36.1%
38.3%
42.0%41.1%
42.4%
48.5%
44.6%
49.0%
41.1%
48.2%
* The penetration rate dropped significantly due to the consolidation of BMW Group Financial Services China as of January 1st, 2011.
*
40.4%
44.0%
41.7%
BMW Group Investor Presentation, LBBW Fixed Income Conference, 09/2015 Page 7
PENETRATION RATE RETAIL BUSINESS.
45.1%

DEVELOPMENT OF CREDIT LOSS RATIO.
0.54%
0.46%
0.41%
0.37%
0.41%
0.46%
0.59%
0.84%
0.67%
0.49%0.48%
0.46%0.50%
0.34%
0.3%
0.4%
0.5%
0.6%
0.7%
0.8%
0.9%
2002 2003 2004 2005 2006 2007 2008 2009 2010 2011 2012 2013 2014 H1-2015
BMW Group Investor Presentation, LBBW Fixed Income Conference, 09/2015 Page 8

BMW Group Investor Presentation, LBBW Fixed Income Conference, 09/2015 Page 9
RESIDUAL VALUE DEVELOPMENT IN THE USA.
Source: Manheim Used Vehicle Index, mix and mileage adjusted.
70
75
80
85
90
95
100
105
110
115
120
Jan
-06
Ap
r-0
6
Ju
l-0
6
Oct
-06
Jan
-07
Ap
r-0
7
Ju
l-0
7
Oct
-07
Jan
-08
Ap
r-0
8
Ju
l-0
8
Oct
-08
Jan
-09
Ap
r-0
9
Ju
l-0
9
Oct
-09
Jan
-10
Ap
r-1
0
Ju
l-1
0
Oct
-10
Jan
-11
Ap
r-1
1
Ju
l-1
1
Oct
-11
Jan
-12
Ap
r-1
2
Ju
l-1
2
Oct
-12
Jan
-13
Ap
r-1
3
Jul
-13
Oct
-13
Jan
-14
Ap
r-1
4
Ju
l-1
4
Oct
-14
Jan
-15
Ap
r-1
5
Ju
l-1
5
BMW brand used car index (through August 2015)

OUTLOOK 2015 – POSITIVE BUSINESS DEVELOPMENT DESPITE CHALLENGES.
BMW Group
Solid increase of BMW Group EBT compared to previous year.
Automotive Segment
Solid increase in vehicle deliveries and significant increase of revenues
compared to previous year.
EBIT margin in target range of 8-10%.
Financial Services Segment
Return on equity of at least 18%, on par with previous year.
Motorcycle Segment
Solid rise in deliveries compared to previous year.
BMW Group Investor Presentation, LBBW Fixed Income Conference, 09/2015 Page 10

AGENDA.
1 OPERATING PERFORMANCE 2015
2 FUTURE GROWTH
3 FUNDING THE GROWTH: BMW GROUP TREASURY ACTIVITIES
4 SUMMARY

CONNECTED CARS
NEW PRODUCTSE-MOBILITY
INNOVATIVE SERVICES
BMW Group Investor Presentation, LBBW Fixed Income Conference, 09/2015 Page 12
INNOVATIONS AND NEW PRODUCTS DRIVE FURTHER GROWTH.

Q1 Q2 Q3 Q4
= M Models
1 Series 5-door & 3-door LCI
X5 xDrive40e
X12 series Gran Tourer
X5 M
X6 M
7 Series6 Series & M6 Convertible LCI*
6 Series & M6Coupé LCI*
6 Series & M6Gran Coupé LCI*
MINI Clubman2 Series Convertible
BMW Group Investor Presentation, LBBW Fixed Income Conference, 09/2015 Page 13
PRODUCT ROADMAP 2015.
3 Series derivatives LCI
MINI John Cooper Works
*6 Series vehicles shown here
Luxury
Compact/
Small
Lower
Medium
Upper
Medium
Page 14
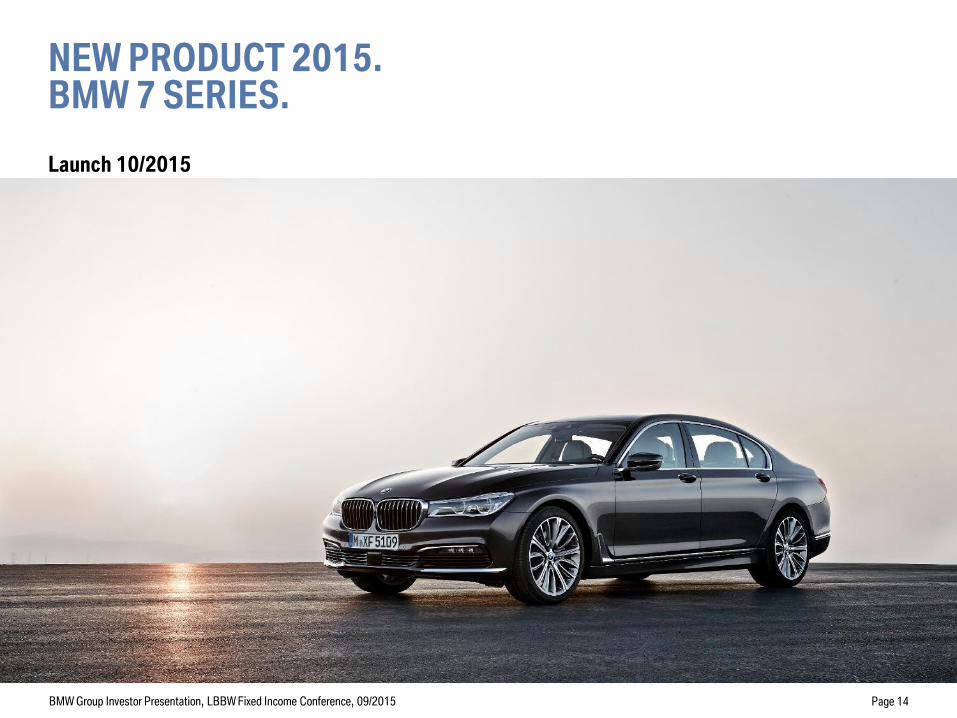
NEW PRODUCT 2015. BMW 7 SERIES.
Launch 10/2015
BMW Group Investor Presentation, LBBW Fixed Income Conference, 09/2015

WE ARE TRANSFERRING BMW i TECHNOLOGY TO OUR CORE BRAND VEHICLES – NEW PHEV MODELS.
BMW Group Investor Presentation, LBBW Fixed Income Conference, 09/2015
BMW 3 Series eDrive
~183 kW / 245 hp / >400Nm
~2.1 ltr/100km / ~ 50 gCO2/km
0-100 km/ h < 7.0 s
~ 35 km purely electric driving
Market launch: 2016.
BMW Concept Active Tourer eDrive
>140 kW / 190 hp / >250 Nm
~2.1 ltr/100km / ~ 50 gCO2/km
0-100 km/ h < 8.0 s
~ 35 km purely electric driving
Market launch: tbd.
BMW X5 xDrive40e
230kW / 313 hp / 450Nm
3.3 – 3.4 ltr/100km / 77 -78 g CO2/km
0-100 km/h 6.8 s
up to 31km purely electric driving
Market launch: Autumn 2015.
Page 15

BMW Group Investor Presentation, LBBW Fixed Income Conference, 09/2015 Page 16
INNOVATIVE TECHNOLOGIES AND SERVICES TO MEET CHANGING CUSTOMER DEMANDS.
Vehicle automation New BMW ConnectedDrive Store Touch Command
Connected Mobility iDrive Controller Fully automated parking

DRIVE NOW IS EXPANDING – BMW i3 JOINS THE FLEET.
BMW Group Investor Presentation, LBBW Fixed Income Conference, 09/2015 Page 17

AGENDA.
1 OPERATING PERFORMANCE 2015
2 FUTURE GROWTH
3 FUNDING THE GROWTH: BMW GROUP TREASURY ACTIVITIES
4 SUMMARY
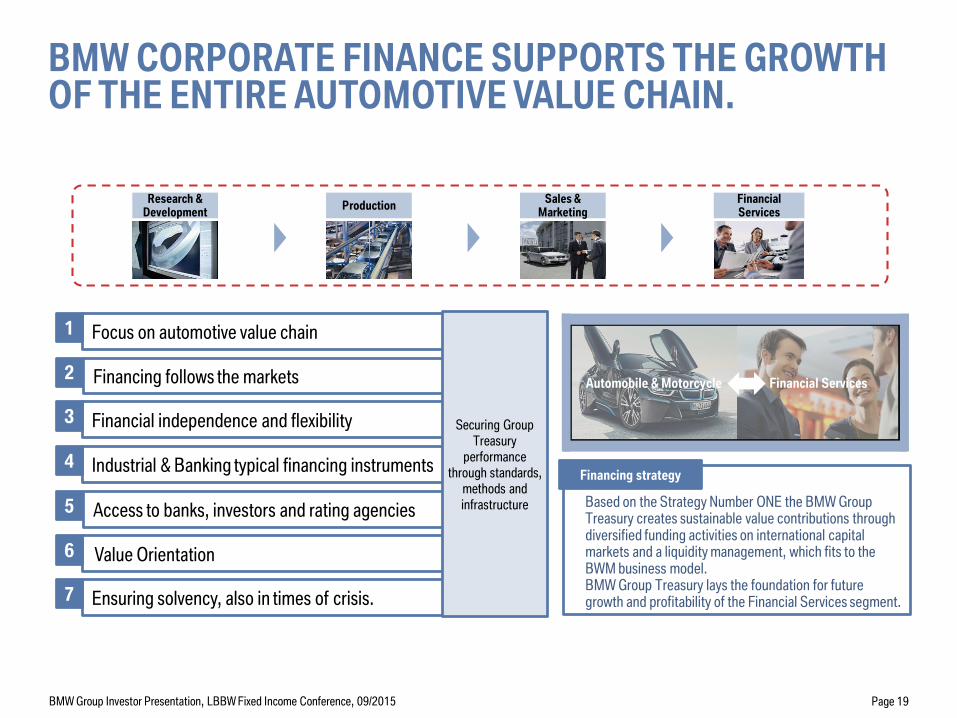
BMW CORPORATE FINANCE SUPPORTS THE GROWTH OF THE ENTIRE AUTOMOTIVE VALUE CHAIN.
Focus on automotive value chain
Financing follows the markets
Financial independence and flexibility
Industrial & Banking typical financing instruments
Access to banks, investors and rating agencies
Value Orientation
Ensuring solvency, also in times of crisis.
1
2
3
4
5
6
7
Automobile & Motorcycle Financial Services
Based on the Strategy Number ONE the BMW Group Treasury creates sustainable value contributions through diversified funding activities on international capital markets and a liquidity management, which fits to the BWM business model. BMW Group Treasury lays the foundation for future growth and profitability of the Financial Services segment.
Financing strategy
Securing Group
Treasury
performance
through standards,
methods and
infrastructure
Research & Development
ProductionSales &
MarketingFinancial Services
BMW Group Investor Presentation, LBBW Fixed Income Conference, 09/2015 Page 19

Page 20
InvestorsBanks
Group Treasury
„one face to the
market“
Rating
Agencies
ACCESS TO BANKS, INVESTORS AND RATING AGENCIES AS SUCCESS FACTORS.
BMW Group Investor Presentation, LBBW Fixed Income Conference, 09/2015

Page 21
BMW GROUP TREASURY OPERATING ENVIRONMENT.
Internal Drivers External Trends
Growing funding needs as a result
of growing automotive and
financial services business
Business growth in new marketsLow interest rates and high
liquidity
High volatility of emerging
markets’ economies and FX rates
Risk
ManagementFunding
Liquidity
Management
BMW Group Investor Presentation, LBBW Fixed Income Conference, 09/2015

Funding Instruments Financial Debt as of 30.06.2015 (€ 82.4 bn*)
CP
<1yr 1yr 2yrs 3yrs 4yrs 5yrs 7yrs 10yrs+
(EMTN) PPs Bonds
Customers deposits
Banks loans
Fed
FundsBCD’s
Bank-typical instrumentsIndustry-typical
instruments
ABS ABCP
DIVERSIFIED FUNDING MIX WITH A COMBINATION OF INDUSTRY AND BANK TYPICAL FINANCING INSTRUMENTS.
BMW Group Investor Presentation, LBBW Fixed Income Conference, 09/2015 Page 22
3.4%8.3%
9.9%
5.9%
0.9%
14.3%
7.2%
49.5%
0.5%
*Adjusted, excl. FX and interest rate derivatives
EMTN/bonds/
SSDs
Commercial Paper
ABS
Fed funds
Brokered CD‘s
Customer deposits
Structured
FinanceOther
Bank loans

SSDs*
1-4%Privat-
platzierungen*8-12%
Öffentliche
Anleihen*42-51%
Projekt-
bezogene Finanzierung
1-4%
Kredite
4-7%
Einlagen
7-13%
Brokered CDs
3-5%
ABS
12-16%
Commercial
Paper5-10%
SSDs*
1-4%
Anleihen/
Privat-platzierungen*
43-47%
Projekt-
bezogene Finanzierung
3-5%Kredite
6-7%
Einlagen
13-17%
Brokered CDs
6-8%
ABS
12-16%
Commercial
Paper6-10%
THE DEBT STRUCTURE ENSURES FLEXIBILITY IN LINE WITH THE GROWTH OF THE COMPANY.
BMW Group Investor Presentation, LBBW Fixed Income Conference, 09/2015 Page 23
The Financial Debt Structure is driven by:
Diversification
Maturities
Independency
Company Growth

Funding is done worldwide to optimize refinancing costs and to establish a broad investor base.
BMW Group Investor Presentation, LBBW Fixed Income Conference, 09/2015 Page 24
USA
USD Commercial Paper
USD US PP
USD ABS
Euro Capital Markets
EUR Commercial Paper
French Commercial Paper
EUR (EMTN) PPs
EUR Benchmark Bonds
USD Eurodollar
AUD Euroaussie
NOK (EMTN) Bonds
SEK (EMTN) Bonds
EUR ABS
Great Britain
GBP (EMTN) PPs
GBP Bonds
GBP ABS
Switzerland
CHF (EMTN) PPs
CHF Bonds
CHF ABS
Japan
JPY (EMTN) PPs
JPY Euro-Yen
JPY ABS
JPY Schuldschein
Australia
AUD (EMTN) PP
AUD ABS
AUD (AMTN) Bonds
Hong Kong
RMB (EMTN) PP
HKD (EMTN) PP
South Africa
ZAR ABS
ZAR Domestic Bonds
Canada
CAD ABS
CAD (EMTN) PPs
CAD Domestic Bonds
Mexico
MXN (EMTN) PP India
INR Domestic Bond
South Korea
KRW Domestic Bond
USD ABS
Mainland China
RMB ABS
BROAD INVESTOR BASE.
Brazil
BRL ABS

Page 25
Financing of Financial Services
Business free of liquidity risk
Verfügbarkeit der Konzernliquidität
über Kapitalsammelstellen (TCs).
Nutzen von Skalleneffekten.
Access to central bank liquidity
Maturity Profile
Treasury Center
Network
Central Bank
AccessInvestor Access
Strong free cash flow generation
Free Cash FlowLiquidity Reserve
Group Liquidity > 10 bn. EUR.
Availability of group liquidity thru
treasury centers. Using economic of
scale
Direct access to investors
BMW GROUP LIQUIDITY IS ENSURED, ALSO IN CASE OF A CRISIS.
BMW Group Investor Presentation, LBBW Fixed Income Conference, 09/2015

BMW GROUP WITH BEST RATING AMONG EUROPEAN AUTOMOTIVE MANUFACTURERS.
BMW Group Investor Presentation, LBBW Fixed Income Conference, 09/2015 Page 26
Standard & Poor's Moody's
Short-term Rating A-1 P-1
Long-term Rating A+ A2
Outlook Stable Positive

Page 27
BMW GROUP TREASURY SUPPORTS THE AUTOMOTIVE VALUE CHAIN ALSO THROUGH FINANCIAL RISK MANAGEMENT.
BMW Group Investor Presentation, LBBW Fixed Income Conference, 09/2015
Interest Risk Currency Commodities
BMW Group’s financial risk management increases planning reliability, reduces earnings risks
and allows to take advantage of market opportunities.
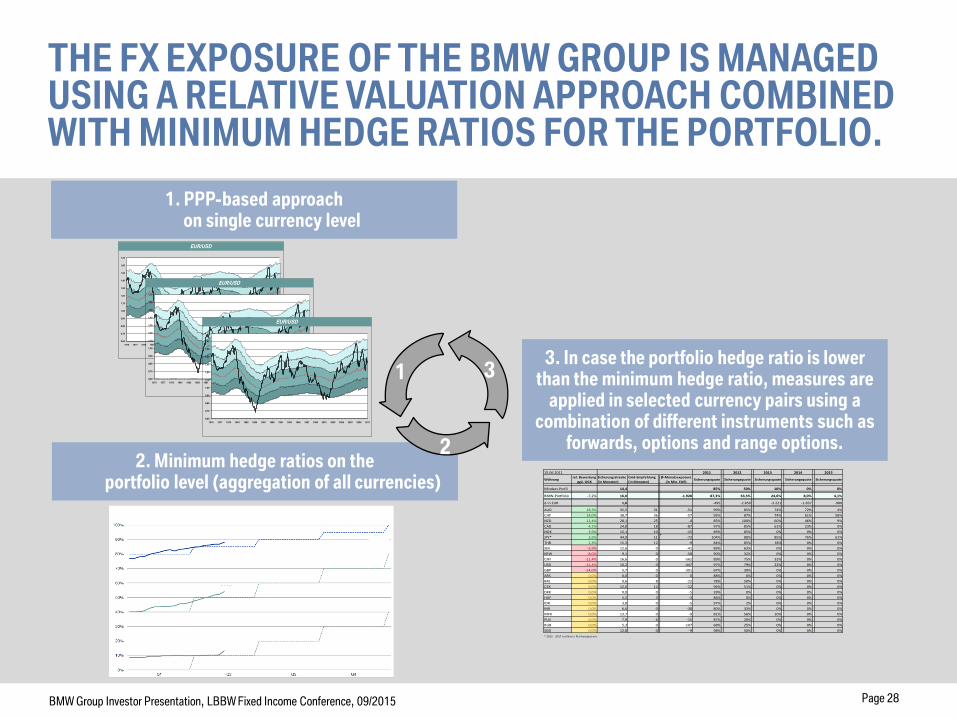
1. PPP-based approach on single currency level
2. Minimum hedge ratios on the portfolio level (aggregation of all currencies)
3. In case the portfolio hedge ratio is lower than the minimum hedge ratio, measures are
applied in selected currency pairs using a combination of different instruments such as
forwards, options and range options.
1 3
2
0,60
0,70
0,80
0,90
1,00
1,10
1,20
1,30
1,40
1,50
1,60
1,70
1975 1977 1979 1981 1983 1985 1987 1989 1991 1993 1995 1997 1999 2001 2003 2005 2007 2009 2011
EUR/USD
0,60
0,70
0,80
0,90
1,00
1,10
1,20
1,30
1,40
1,50
1,60
1,70
1975 1977 1979 1981 1983 1985 1987 1989 1991 1993 1995 1997 1999 2001 2003 2005 2007 2009 2011
EUR/USD
0,60
0,70
0,80
0,90
1,00
1,10
1,20
1,30
1,40
1,50
1,60
1,70
1975 1977 1979 1981 1983 1985 1987 1989 1991 1993 1995 1997 1999 2001 2003 2005 2007 2009 2011
EUR/USD
THE FX EXPOSURE OF THE BMW GROUP IS MANAGED USING A RELATIVE VALUATION APPROACH COMBINED WITH MINIMUM HEDGE RATIOS FOR THE PORTFOLIO.
Währungrel. Bewertung
ggü. GGK
Sicherungsstrecke
(in Monaten)
Grid-Empfehlung
(in Monaten)
Ø-Monatsexposure
(in Mio. EUR)Sicherungsquote Sicherungsquote Sicherungsquote Sicherungsquote Sicherungsquote
Mindest-Profil 14,4 85% 50% 10% 0% 0%
BMW-Portfolio -7,2% 16,0 -1.928 87,3% 63,5% 24,6% 8,0% 4,1%
Δ in EUR 1,6 -495 -2.850 -3.221 -1.837 -980
AUD 18,3% 35,5 31 -51 99% 85% 74% 72% 4%
CHF 14,0% 38,7 36 -57 95% 87% 74% 61% 58%
NZD 12,4% 28,1 25 -4 85% 100% 60% 46% 9%
CAD 4,1% 24,8 18 -87 97% 85% 61% 23% 0%
NOK 3,9% 15,1 10 -15 89% 85% 0% 0% 0%
JPY* 2,6% 44,9 11 -72 104% 88% 85% 76% 61%
THB 2,3% 15,3 12 -9 84% 85% 18% 0% 0%
SEK -5,9% 12,6 0 -41 89% 63% 0% 0% 0%
KRW -8,0% 9,1 0 -58 90% 32% 0% 0% 0%
CNY -11,4% 16,6 0 -562 89% 75% 32% 0% 0%
USD -11,4% 16,2 0 -447 97% 79% 22% 0% 0%
GBP -14,0% 5,7 0 -301 67% 30% 0% 0% 0%
ARS 0,0% 0,0 0 0 88% 0% 0% 0% 0%
BRL 0,0% 9,6 8 -22 78% 50% 0% 0% 0%
CZK 0,0% 12,0 12 -12 96% 51% 0% 0% 0%
DKK 0,0% 0,0 0 -5 39% 0% 0% 0% 0%
HUF 0,0% 5,5 3 -3 86% 0% 0% 0% 0%
IDR 0,0% 3,8 0 -5 97% 2% 0% 0% 0%
INR 0,0% 6,6 0 -30 80% 33% 0% 0% 0%
MYR 0,0% 13,7 0 -9 81% 56% 10% 0% 0%
PLN 0,0% 7,9 6 -15 87% 20% 0% 0% 0%
RUB 0,0% 5,3 0 -107 68% 25% 0% 0% 0%
SGD 0,0% 12,8 0 -9 98% 50% 0% 0% 0%
* 2012 - 2017 auf Bas is Ris ikoexposure
201515.06.2011 2011 2012 2013 2014
Page 28BMW Group Investor Presentation, LBBW Fixed Income Conference, 09/2015

AGENDA.
1 OPERATING PERFORMANCE 2015
2 FUTURE GROWTH
3 FUNDING THE GROWTH: BMW GROUP TREASURY ACTIVITIES
4 SUMMARY

SUMMARY.
GOOD FIRST HALF OF THE FINANCIAL YEAR 2015.
GUIDANCE CONFIRMED.
BMW GROUP IS WELL PREPARED FOR THE FUTURE.
BMW GROUP TREASURY MANAGES GROWING FUNDING
NEEDS AND IS WELL POSITIONED IN A VOLATILE MARKET
ENVIRONMENT.
BMW Group Investor Presentation, LBBW Fixed Income Conference, 09/2015 Page 30