ld p i leeds presentation outlook 2011 · ld p i leeds presentation outlook 2011 ... gold to soar...
TRANSCRIPT

L d P i L d P i Leeds Presentation Leeds Presentation Outlook 2011Outlook 2011
2626thth January 2011January 2011
CHARTERIS TREASURY PORTFOLIO MANAGERS IS AUTHORISED AND REGULATED BY THE FINANCIAL SERVICES AUTHORITY (FSA)

Charteris Treasury Portfolio Managers Limited
www.charteris.co.ukCharteris Treasury Portfolio Managers was established in 1984 as an Investment M t C Ch t i i f ll li d b th Fi i l S iManagement Company. Charteris is fully licensed by the Financial Services Authority. The investment team have in aggregate over 100 years experience of global financial markets.
B k tf li t iBespoke portfolio management services
Funds under management
a. Private Clients
b. Personal Pension Funds (SIPPS)
c. The Top Performing UK Gilt Fund calendar year 2007 & 2009* M i t 4* rated F dMorningstar 4* rated Fund.
d. Consistent Top Quartile (07/08/09/10*) for the Elite Charteris Premium Income Fund in the IMA UK Equity Income Sector. Morningstar 4* rated.
Charteris is Regulated by FSA – Low Risk Category*Source Prof. Adviser & Lipper
2

CHARTERIS METHODOLOGY OF ANALYSING MARKETS
All FactorsAll Factors
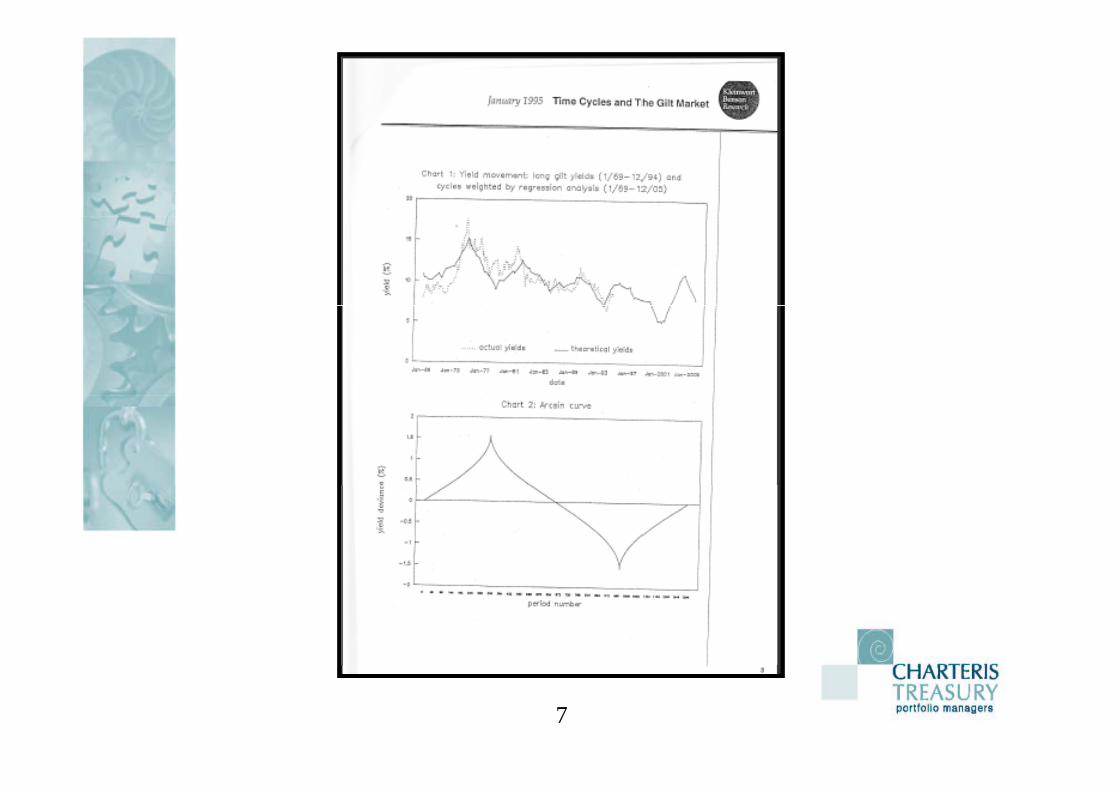
• Take into account Fundamental Analysis and Technical Analysis (i e Charts) and Cyclical Analysis with particularAnalysis (i.e. Charts) and Cyclical Analysis with particular emphasis on Cycle Analysis
• Macro Top-Down Bottom-Up approach. Supplemented by individual stock picking
• Totally reject efficient market hypothesis (random walk• Totally reject efficient market hypothesis (random walk theory).
3

Cycles
Bonds & Commodities have similar length cycles (inversely related)
Certain Cycles are well knownCertain Cycles are well known• The 54 Year cycle is known as the “Kondratieff Cycle” – It was discovered
by Nikolai Kondratieff (a Russian economist who analysed the price of Wheat in England going back to the 12th Century)
• “Kuznets Cycle” – Approx 18 year real estate cycle named after Simon Kuznets (an American economist who won the Nobel Prize for his work in identifying this cycle)identifying this cycle)
• The 9-11 year “Jaguar cycle” named after Clement Jaguar (a French economist). This cycle is predominant in Commodity Markets
• The 40 month cycle is known as “the Kitchen cycle” – named after Professor Joseph Kitchin of Harvard University. This cycle is present in share prices, interest rates, commodities & many more totally unrelated items
4

5

6
7

8

Top down approach our global macro overviewoverview
1. Global economy is in the middle of one of its biggest ever booms in history – The Globaleconomy has doubled in size in the past decade and is set to double again in the next 10 years
2. This is the primary cause of the ongoing super bull market in commodities which is leading to Asian inflation – which in turn feeds through to western inflation as Asia is the producer of lowest cost. E.g. A men’s shirt in Primark last year cost £3.80 – now it is £5 – still cheap but an imported inflation rate of 31.5% - Wheat & other food prices showing similar gains. We are now importing Inflation from Asia NOT DeflationInflation from Asia – NOT Deflation.
3. Most European countries being bypassed by this with the notable exception of Germany. Euro-land stuck trying to sort out legacy debts from the previous boom (ex Germany) which is becoming reluctant to pick up the tab. If strains within the Euro become too great Germany might go back to the Deutschemarkgo back to the Deutschemark.
4. USA in similar position to most of Europe – but has a different remedy i.e. Printing their debts away. (Ultimately inflationary & will destroy the US Dollar as a trusted store of value by Asian and Arab central banks (i.e. The world creditor nations) – Gold to soar to even higher levels.
5. UK in similar position to the USA as we are not in the Euro and have also printed money on a gargantuan scale. No sign of a double-dip – indeed growth prospects being revised up. UK Equities very very cheap relative to Gilts on an historic basis.
6. 30 year Bull market in G7 Government bonds is OVER – it ended at the end of August 2010.Our view is that we are now in a bear market which will unfold over the next 4 years with some very nasty potential losses for investors who are asleep at the wheel.
9

Global Economy Forecast Growth
10

Current Inflation / Deflation Debate
Root Cause By Product
Keynesian View (usually left of centre politically)
WAGE INFLATION INCREASE IN THE MONEY SUPPLY
politically)
Monetarist View ( ll i ht f
INCREASE IN MONEY SUPPLY
WAGE INCREASES(usually right of centre politically)
MONEY SUPPLY
11

12

UK Gilt Yield Curve Source: Bloomberg
13

Real Yield 5 Year Index Linked Gilt – Last 20 Years
Source: Bloomberg
14

Gross Redemption Yield – Short Gilt Last 15 Years
Source: Bloomberg
15

10 year Gilt Yield since 1992 - constant maturity
Source: Bloomberg
16

Source: ukpublicspending.co.uk
17

Source: ukpublicspending co uk
18
Source: ukpublicspending.co.uk

Current Nominal Yield
Current Real re: Inflation, Adjusted,
Income Yield
(Assuming UK inflation is 4%)
Potential Capital Gain/Loss
Cash 0.5% Minus 3.5% ZERO
Conventional Gilts
Short (5yr) 2.6% Minus 1.4% Loss 15%
Long (50yr) 4.4% Plus 0.4% Loss 40%
Index Linked
Short (5yr) / Minus 0.2% Loss 14%
Long (50yr) / Plus 0.2% Loss 39%
Equities 3.0% Minus 1.0% (Doesn’t allow for Dividend increases)
Infinite GainDividend increases)
Gold ZERO Minus 4% Infinite Gain
G ld E iti 1% Mi 3% I fi it G iGold Equities 1% Minus 3% Infinite Gain
19

City Financial Strategic Gilt Fund Source: Bloomberg
This chart highlights the performance of the Charteris managed City Financial Strategic Gilt Fund.
20

Equity / Gilt Yield Ratio Since 1980
Source: Giltsoft
21
Sou ce G tso t

Equity / Index Linked Yield Ratio Since 1980
Source: Giltsoft
22
Sou ce G tso t

Dow Jones Index Since 1900 (Logarithmic Scale)
Source: CQG
23

CHARTERIS TREASURY PORTFOLIOCHARTERIS TREASURY PORTFOLIO MANAGERS LTD
Elite Charteris Premium Income Elite Charteris Premium Income Elite Charteris Premium Income Elite Charteris Premium Income FundFund
January 2011January 2011
CHARTERIS TREASURY PORTFOLIO MANAGERS IS AUTHORISED AND REGULATED BY THE FINANCIAL SERVICES AUTHORITY (FSA)
24

• CityWire ‘A’ rated Manager – Ian Williams
• Top Quartile performance Calendar Year07/08/09/10* *(Source Lipper and Professional Adviser)
• Outperformed FTSE 100 by 3.61% in 2009**(Source Bloomberg)
• Outperformed FTSE 100 by 7 86% in 2010*• Outperformed FTSE 100 by 7.86% in 2010*(Source Bloomberg)
•Target dividend yield 6-7%.
25

• Formerly The EFA James Brearley Premium Growth Trust : Charteris assumed Investment Management control in November 2008
• Investment Universe : FTSE 100 Companies
• Fund Aims : To provide Income and Capital G th b t f i th FTSE100 th hGrowth by outperforming the FTSE100 through active stock selection together with the tactical and measured writing of covered call optionsand measured writing of covered call options.
26

Why invest in the Elite Charteris Premium Income Fund?
• Potentially boosts the income from a portfolio of FTSE 100 shares enabling the investor to benefit from higher income whilst not necessarily missing out on capital gains.
• Income boosted as the premium generated from the writing of call options are added to dividends.
• Different to other call option funds because options are only written during periods of the year when certain technical and fundamental investment criteria are met. Many option funds continuously write y p yoptions and consequently run the risk of missing out on strongly rising markets.
• Unlike traditional income funds stock selection is not limited to high• Unlike traditional income funds stock selection is not limited to high yielding stocks and the uncertainty as to whether the dividend will be maintained. The three month option premium on higher volatility shares can exceed the annual dividend yield on high income low volatility shares i e as at the 17th January 2011 a three month at thevolatility shares i.e. as at the 17th January 2011 a three month at the money call on Xstrata earns 8.5% against the annual dividend yield on Shell of approx 5%.
27

Converting Options to Income
• As dividends can be cut the option proceeds are arguably a more reliable source of income.
• The Fund is always invested in cash or FTSE 100 shares. By writing options for just three months a year it is possible to significantly boost the income whilstis possible to significantly boost the income whilst retaining exposure to the FTSE 100 for the majority of the year. y
28

Covered call option writing in practiceE lExample
The Fund holds Vodafone shares valued at 175p on the 1st January. The Fund writes a 3 month covered call option with a 175p strike at 8p per share (4.5%)
Scenario’s over a 3 month time horizon
1) Vodafone rises to £2 (+14%) at option expiry – Fund appreciates by 8p instead of 25p if no option had been written [relative underperformance absolute return]p [ p ]
2) Vodafone rises to £1.80 (+2.8%) – Fund appreciates by 8p (8p option proceeds) versus only 5p if no option written [Absolute and relative outperformance]
3) Vodafone stays at £1.75 – Fund appreciates by 8p (option proceeds) [absolute and relative outperformance]p ]
4) Vodafone falls to £1.70 (-2.8%) – Fund appreciates by 3p (8p option proceeds offsets a 5p fall in share price) [absolute and relative outperformance]
5) Vodafone falls to £1.50 (-14%) - Fund depreciates by 17p verses a market fall of 25p if no option had been written (25p loss minus 8p option proceeds). [relative outperformanceoption had been written (25p loss minus 8p option proceeds). [relative outperformance but capital loss]
Irrespective of the performance of the shares the Fund keeps the option premium of 8p (4 5%) and this is available for distribution The Fund also maintains its entitlement to the(4.5%) and this is available for distribution. The Fund also maintains its entitlement to the dividend on the shares unless or until the option is exercised.
29

S i d i lif f tiScenarios during life of an option
Scenario 1Scenario 1
Break Even
Scenario 2
Scenario 3
Pric
e
Scenario 4Break Even
P
Scenario 5
Time
30

Scenarios during life of an option
Out-performance / under-performance of Fund
Scenarios Relative Absolute
1 Market Rises Sharply
2 Market Rises Marginally
3 Market Unchanged
4 Market Falls Marginally
5 Market Falls Sharplyp y
31

Top down approach our global macro overviewp pp g
1. The global economy is experiencing a cyclical shift in economic leadership from the USA to China of the type that occurs every 100 years or so ( witness the relative decline of Great Britain & the relative ascendancy of the USA several decades ago) Past shifts in economicBritain & the relative ascendancy of the USA several decades ago). Past shifts in economic power are typified by great volatility and uncertainty.
2. Commodity prices are half way through a bull market super cycle that is not due to peak until 2019 to 2020.
3. Powerful deflationary forces in western economies have been offset by QE (Quantitative Easing) which could ultimately prove inflationary. The outcome of this inflation/deflation tug of war is far from certain and we monitor this very closely.
4. We remain very negative on the UK Commercial Property Market and the consequential impact on banks, real estate and insurance companies and the wider affects this will have on the UK economy.
5. In the FX market we are negative on the three major western currencies i.e. the US dollar, Euro and Sterling. Long term trends favour the Asian and commodity producing currencies such as the Australian & Canadian Dollar.
6. Within the FTSE 100 we expect that overseas earners will outperform companies reliant on the UK economy due to higher growth rates overseas and the long term deterioration in the sterling exchange rate.
32

The Portfolio
33

Fund performance vs. FTSE 100 in 2010
{Source Bloomberg}
34

Elite Charteris Premium Income Fund Source: Bloomberg
Charteris took over Fund
35

CHARTERIS TREASURY PORTFOLIO MANAGERS LTD
WAY CHARTERIS WAY CHARTERIS WAY CHARTERIS WAY CHARTERIS G ld F dG ld F dGold FundGold Fund
J J January 2011January 2011
36

The Fund – Bullet Points
• The Fund is “Long-only Non-Leveraged”. It will not “short” or “hedge” Gold or Gold Assets in any way. The Fund will not employ any form of leverageg
• The Fund gives investors exposure to the Gold price under a regulated NURS (Non Ucits Retail Scheme)
•The Fund will invest predominately in “Blue Chip” Gold mining companies
• The Fund can also invest in smaller Gold mining companies
• The Fund can hold up to 10% in other funds i.e. Gold ETF’s (Exchange p ( gTraded Funds)
• The Fund can also invest in Gold ETC’s (Exchange Traded Certificates)
• Custodian – State Street Bank and Trust
• Fund Administration Sharefunds Limited• Fund Administration – Sharefunds Limited
37

Key Decisions about Inclusion of Gold Stocks
• The quality of the company i.e. Quality of Management etc
• The Quality of the Asset Base i.e. Proven & profitable Gold Reserves
•The “Beta” to a given move in the underlying commodity i.e. Cost of d ti l ti t th t iproduction relative to the current price
• Geographical Location of the Asset Base and Domicile of the Company
• No stock will represent more than 10% of portfolio
38

M it f G ld h G ld B lliMerits of Gold shares vs. Gold Bullion
• Gold Shares traditionally outperform Gold Bullion in a Bull Market dueGold Shares traditionally outperform Gold Bullion in a Bull Market due to the operational gearing (i.e. Fixed or semi-fixed costs vs. rising revenue stream)
• Gold shares have the ability to pay dividends to shareholders
• Gold mining companies can make discoveries due to their exploration activities
• Gold mining companies can be subject to take-over activity from larger Gold miners
39

Gold Price In USD
Source: Bloomberg
40

Source: BloombergGold Price In Euros
This chart dispels the myth that the Bull market in GOLD is
41just the residual of the bear market in the US Dollar

Real price of Gold using US consumer price Index
42

This is the REAL price of Gold using a different statistical measure of Inflationmeasure of Inflation
43

44

45

46

47

Source: US Federal Reserve
48

49
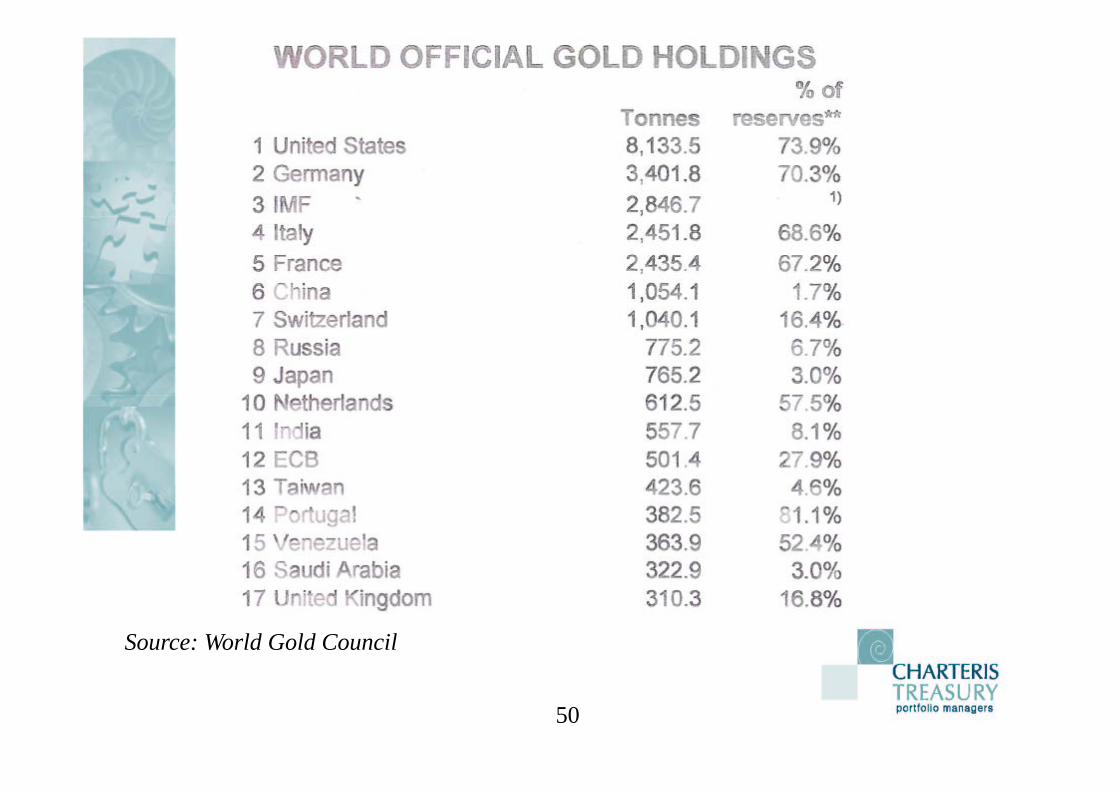
Source: World Gold Council
50

Gold Price In YEN Source: Bloomberg
This chart dispels the myth that deflation is negative for Gold. The Japanese economy has suffered deflation for the last 10 years but Gold in Yen has tripled.
51

WAY Charteris Gold Fund since launch Source: Bloomberg
52

Appendix Some of the relevant cycles
Gold Cycles
Year Month Weekly Day
40 480 2080 14600
3.36 40.4 173 1212
2.7 33.6 404 2828
83 10 43 300.83 10 43 300
.52 6.3 27 190
Bold print denotes the cycle under which it is commonly known as.Bold print denotes the cycle under which it is commonly known as.
53

Ian Williams – Chairman/Fund Manager Chartered FCSI
Ian has spent the last 35 years trading in Equities Commodities and G7 Government Bonds coveringIan has spent the last 35 years trading in Equities, Commodities and G7 Government Bonds, covering sales, research, market making and proprietary trading. He was a member of the London Stock Exchange for many years before joining Chase Manhattan Bank (now JP Morgan). He subsequently worked for Dresdner Kleinwort Benson and Guinness Mahon (now Investec) before becoming Chairman & Chi f E ti f Ch t i T P tf li M I th 4* t d “Ci Fi i l& Chief Executive of Charteris Treasury Portfolio Managers. Ian runs the 4* rated “City Financial Strategic Gilt Fund” which has been consistently been at the top of the IMA Gilt sector since it’s launch in December 2006 (source Lipper) as well as The 4* rated “Elite Charteris Premium Income Fund” which has also been consistently at the top of the IMA UK Equity Income sector. Ian is a Chartered Fellow of the Chartered Securities Institute.
Nick Taylor – Director/Fund Manager Chartered FCSI
Nick Taylor has 38 years of international investment management experience, gained at Morgan Grenfell, Invesco was Managing Director at Cigna International Investment Advisors and Matheson InvestmentInvesco, was Managing Director at Cigna International Investment Advisors and Matheson Investment Management. An award-winning manager, Nicholas has run Equity portfolios for a broad range of investors, including institutional pension funds, such as the Cadbury Schweppes Pension Fund alongside running several million pounds of private client portfolios and investment trusts. Nick is also a Chartered F ll f th Ch t d S iti I tit tFellow of the Chartered Securities Institute.
54

Contact Details
Charteris Treasury Portfolio Managers
8/9 Lovat Lane
London
EC3R 8DW
Phone: +44 (0)20 7220 9780
Fax : +44 (0)20 7929 6925Fax : +44 (0)20 7929 6925
Email : [email protected]
W b Sit h t i kWeb Site www.charteris.co.uk
55

Key Information and Risk Warnings
Thi i i i d b Ch i T P f li M L d hi h iThis presentation is issued by Charteris Treasury Portfolio Management Ltd which is authorised and regulated by the Financial Services Authority
• Past performance is not a guide to future performance and investors may not get back the full amount invested
• The price of shares and any income from them may fall as well as rise
• On redemption of holdings investors may not receive back the full amount invested. Management and other fees may reduce the capital invested
Th i f ti id d d t tit t d i l d ti f• The information provided does not constitute advice or a personal recommendation for which the duty of suitability would be owed by us and you should seek your own advice as to the suitability of any investment matter mentioned here
• Professional advisers should be aware that this document is intended for their use only and this document is not to be shown or given to any retail investorsand this document is not to be shown or given to any retail investors
• The presentation is made on the basis of our current understanding of United Kingdom Tax laws, which may be subject to change in the future
56