l.e. romera, s. hernandez, j.a. rodriguez e.t.s ...€¦ · load combinations we consider the load...
TRANSCRIPT

Structural response of a dam-foundation rock-
impounded water model under seismic and
thermal loading
L.E. Romera, S. Hernandez, J.A. Rodriguez
E.T.S. Ingenieros de Caminos, Canales y Puertos, University of La
Coruna, La Coruna 15192, Spain
ABSTRACT
In this paper a comprehensive study of the existing Spanish dam of Bolarque is
presented. The dam was composed of two different classes of concrete and also
two choices of material characteristic of the rock foundation were considered.
The seismic analysis was earned out taking in account the dam-foundation rock-impounded water interaction. Additionally, thermal loadings were included by
using an equivalent structural model. Overall 128 structural analyses were
carried out to complete consider the necessary combinations of materials,
seismic and thermal loadings. Numerical results are presented showing the
behaviour of the dam under the worst situations for empty and full reservoir.
1 . A BRIEF HISTORY OF BOLARQUE DAM
The Bolarque dam was built in 1910 and works to increase its height andtherefore to improve the volume of impounded water were carried out in 1954-1955. Figure la shows the cross-section of the dam and Figure Ib the structural
model which acommodate quite properly the actual geomeuy.
Transactions on the Built Environment vol 20, © 1996 WIT Press, www.witpress.com, ISSN 1743-3509

706 Earthquake Resistant Engineering Structures
The existing data of elastic modulus E of the dam materials from 1910 and 1954
belonged to a study made in 1987. It showed a great dispersion of values of
compression strength and, therefore, elastic modulus of both types of concrete.
Differences in data were so great that it was even nuclear what concrete was
more strength, as sometimes the better numerical results belonged to specimen
from 1911 concrete and sometimes to the concrete from 1954. Because of thattwo values were considered in the study, namely: E/, = 20-106 KN/m^,EK = 26-106 KN/rn^, for concrete material and Ej- = 26-10^ KN/m? and
Ef= 13-100 KN/m^, for the foundation. Therefore if we define
EM: elasticity modulus of initial concrete (1911),
E 2- elasticity modulus of new concrete (1954),
Ef elasticity modulus of foundation rock,
the complete set of cases considered in the analysis were the included in Table 1.
Table I. Elastic modulus for concrete and foundation rock
Name
wy
W2
W j
W7
EHI20406
20-106
26-10626406
20406
20406
26406
26406
Eh220406
20406
204062040626406
26406
26406
26-106
r
13-106
26406
13-10626406
13-10626406
13-106
26406
The dam is a part of the facilities linked to the nuclear power plant of Zorita
(Spain) and because of that the Spanish Nuclear Security Board ordered a study
to find out the safety coefficient of the system composed by dam-rockfoundation-impounded water under the point actuation of the three following
loads:
a) Static loads: Hydrostatic pressure and self-weight.
b) Thermal loads as indicated in paragraph 3.
c) Seismic loads as specified by the ground acceleration of NUREG/CR-0098
earthquake with a duration of 20 sec. divided in intervals of 0.005 sec., a
maximum vertical acceleration of 0.047 g, and two horizontal accelerations(HI and A/2J with maximum values of 0.07 g.
Transactions on the Built Environment vol 20, © 1996 WIT Press, www.witpress.com, ISSN 1743-3509

Earthquake Resistant Engineering Structures 707
2. SEISMIC ANALYSIS
Seismic analysis of the Bolarque dam was carried out considering both static
loads (hydrostatic pressure and self-weight) and ground acceleration of the
aforementioned earthquake. The structural model considered was composed by
an infinite viscoelastic domain, representing the foundation rock and an elastic
domain, with two different materials and hysteretic damping representing the
dam.&*%&&%&.
1 : 1 initial concrete (1911)
new concrete (1954)
Figure 2. Structural model for seismic analysis
The computer code was EAGD-84, developed by Chopra and coworkers f 1-6].
2.1. Dynamic parameters of the structural model
A hysteretic damping of value 77, = 0.1 was chosen. That means a viscous
damping of value e - 77,. / 2 = 0.05. Ten vibration frequencies were calculated
for each structural model (bol 1 to bol 8). The numerical results are presented in
Table 2.
Table 2. Vibration frecuencies (Hrz)
__L_.2
3
4
5
6
_7._8
9
10
bol 1
6.54
13.10
15.62
25.16
40.55
45.48
58.94
66.89
73.71
79.11
bol 2
_ 7JS6
16.94
17.38
28.67
44.15
47.21
62.59
69.62
76.06
83.37
bol 3
6/74
13.31
16.21
25.72
41.75
49.00
__6L6^__
73.27
79.11
84.09
bol 4
7,98
17.42
18.09
29.54
45.41
50.56
65.28
75.68
8124
87.90
bol 5
6,73 _
13.23
16.29
26.60
43.50
47.83
62.70
68.37
76.68
8236
bol 6
7,9fL
17.15
18.31
30.27
47.00
49.70
66.38
71.51
78.89
87.60
bol 7
&92
13.43
16.94
27.25
45.02
51.34
65.96
75.12
82.80
88.54
bol 8
8,29_17.62
19.10
31.20
48.65
52.96
_6 63_
78.15
85.78
93.27
Transactions on the Built Environment vol 20, © 1996 WIT Press, www.witpress.com, ISSN 1743-3509

708 Earthquake Resistant Engineering Structures
2.2. Selection of seismic response parameters
a) For a specified maximum excitation frecuency F, the computation of the
frecuency response functions and earthquake response, via the FFTalgorithm, depends on two parameters: NEXP, which is related to the
number of excitation frecuencies and time intervals; and the time interval
DT, in seconds. NEXP is related to the number of time intervals N. Namely
AT = 2*™ . As NEXP must be an integer number the actual number of time
intervals N = 4000 was incremented to N = 4096, adding 96 seconds with
zero vertical and horizontal accelerations and the end of the NUREG
earthquake data. Therefore the duration of the earthquake increased to
7 = 4096 x 0.025 sec = 20.48 sec. And A/EXf = 12.
b) The frecuency increment Af is obtained as Af = J/2T, therefore
Af= 0.0244 Hrz and it must be small enough to represent the frecuency
response functions for the generalizaded coordinates, especially near the
fundament resonant marks. It is recommended that Af< 0.02 fj, being/;
the smallest frecuency. The lowest value of// in Table 2 is/; = 6.54 Hrz.
Therefore 0.02 /y = 0. 131 Hrz and the constraint is accomplished.
c) The maximum frecuency represented F comes from the expresion
F - N Af. Therefore F = 100 Hrz. Obviously this value needs to be greater
than every value of Table 2 to represent adecuately the vibrations, what is,in fact, also accomplished. The value of F has another constraint
~'™ 2Kb 2(7+v)p
where Ej- elastic modulus of foundation rock,
v Poisson modulus of foundation rock,
b length between nodes on line connecting the dam and the
foundation rock,
pj- density of foundation rock.
In the finite element mesh of Bolarque dam b = 1.683 m. Also v = 0.33,
pf= 2.6 t/m3
For material with Ej- = 26 - 10^ KN/m?
F = 100 Hrz < vv,, , = 917.82 Hrz
For material with Ej •= 13 • W KN/m?
F = 100 Hrz < w,,,ox = 649 Hrz
d) To reduce the aliasing error it is recommended for the duration of the
earthquake T that:
Transactions on the Built Environment vol 20, © 1996 WIT Press, www.witpress.com, ISSN 1743-3509
Earthquake Resistant Engineering Structures 709
being 77 the histeretic damping rj = 0.1 and// the smallest value in Table 2.
In this case
7= 20.48 > 2.294
therefore the constraint is not violated.
e) The absorptiveness of the reservoir botton materials is characterized by the
wave reflection coefficient a, which is defined as the ratio of the amplitude
of the reflected hydrodynamic pressure wave to the amplitude of a vertically
propagating pressure wave incident on the reservoir bottom. The materials
at the bottom of the reservoir determine the value of the wave reflectioncoefficient a according to the following equation
l-Ka
1 + K
where water density
velocity of pressure waves in the water (C = 1438.6 m/sec)
bottom materials density (p, = 2.6 t/m^)
Ej- elastic modulus of bottom materials
For foundation rock with £>= 26 • 10^ KN/m^
P
C
P,-
For foundation rock with E= 13 • 10& KN/rn^j
& = 0.247
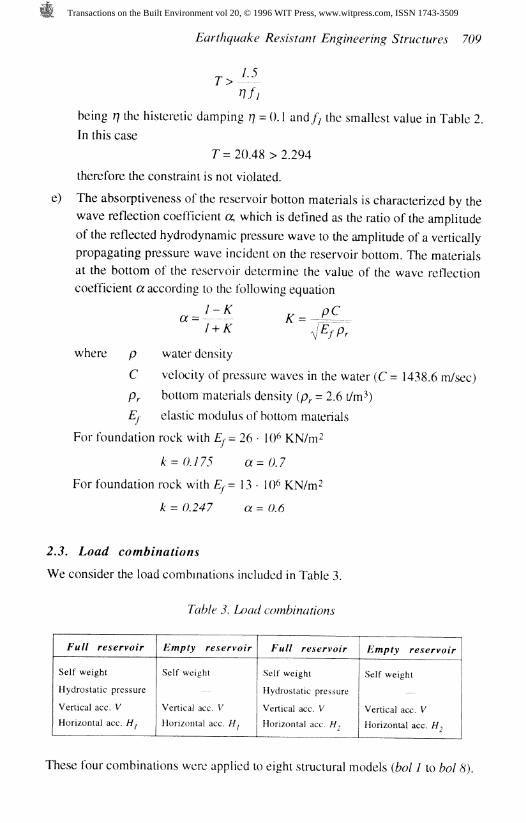
2.3. Load combinations
We consider the load combinations included in Table 3.
Table 3. Load combinations
Full reservoir
Self weight
Hydrostatic pressure
Vertical ace. VHorizontal ace. Hj
Empty reservoir
Self weight
Vertical ace. VHorizontal ace. H j
Full reservoir
Self weight
Hydrostatic pressure
Vertical ace. VHorizontal ace. H^
Empty reservoir
Self weight
Vertical ace. VHorizontal ace. H^
These four combinations were applied to eight structural models (bol 1 to bol 8).
Transactions on the Built Environment vol 20, © 1996 WIT Press, www.witpress.com, ISSN 1743-3509

710 Earthquake Resistant Engineering Structures
2.4. Graphical interfaces
A software application was worked out to allow a CAD presentation of the
structural models to be processed in EAGD-84 and a graphical visualization of
the structural responses of the models.
The visualizer module of the COSMOS/M software [7], called GEOSTAR, wasused hoth as CAD utility and structural responses visualizer. The flowchart of
modules as appears in the Figure 3.
Model preparationin
GEOSTAR
Figure 3. Graphical interfaces befrveen GEOSTAR and EAGD-84
3. THERMOELASTIC ANALYSIS OF BOLARQUE DAM
3.1. Equivalent structural model for thermal loadings
The analysis of Bolarque dam included temperature loadings. As EAGD-84 does
not consider such effects, the following procedure was stablished.
a) Structural models from Table 1 were analyzed using EAGD-84 softwareunder a set of loading composed by the self-weight and hydrostatic
pressures.
Figure 4. Structural models of Bolarque ckim
b) Several structural models composed of the Bolarque dam geometry and apart of the foundation rock were created as indicated in Figure 4b. The
elastic modulus of materials were those considered in bol 6 model. Manymodels with different values of c and d parameters were processed in order
Transactions on the Built Environment vol 20, © 1996 WIT Press, www.witpress.com, ISSN 1743-3509

Earthquake Resistant Engineering Structures 711
to mach the structural responses in the COSMOS/M software with those
obtained with EAGD-84.
The structural responses considered were:
—Horizontal displacement at the top.
—Vertical stresses in dam material.
The aim of the procedure was to identify a structural model in COSMOS/M
producing the same results for static loading than the EAGD-84 model. After
having found out that, a complete seismic study of Bolarque dam was carried
out by adding the following analyses:
a) Structural results in EAGD-84 for static and seismic loading.
b) Structural results in COSMOS/M for thermal loading.
After a quite extensive checking a final candidate was selected having c = ().!£>
and d = 0.656.
3.2. Thermal loadings considered
Loading conditions were variations of ± 15 °C with respect to a reference
temperature. Depending of the existence or not of impounded water, the
temperature variations considered in the analysis along the boundaries of the
model are presented in Figure 5. The second order line on the reservoir side of
the dam in Figure 5b was selected according with water temperature data from
existing dams.
a) Empty reservoir b) Full reservoir
Figure 5. Variation of temperatures on boundaries
A line for the variation of temperatures at the central points of the dam was also
defined. It was assumed that the temperature at the center of the bottom of the
dam had no variation from the temperature of reference (this hypothesis was
Transactions on the Built Environment vol 20, © 1996 WIT Press, www.witpress.com, ISSN 1743-3509

772 Earthquake Resistant Engineering Structures
justified by experimental data from other Spanish dams), and it was also
assumed a linear variation at that central line from bottom to top as presented in
Figure 6.
15 hH
Figure 6. Variation of temperatures at central points of the dam
The temperature distribution in the domain of the dam was defined by accepting
a linear variation from the boundaries. Experimental data showed gradients from
1 °C/m to 2 °C/m. Therefore both values were considered in the models as
indicated in Table 4.
Table 4. Values of AT an
Reservoir
Full
Empty
AT
±15°
±15°
gr rC/m)
1
2
1
2
The linear variation of temperatures from the boundaries to the interior of thedam would produced two different situations at a point of the domain, as
presented in Figure 7. Let define
AT^ Temperature on the upstream face of the dam
AT^ = ± 15 ° for empty reservoir
3°< ,.< 75°for full reservoir
- 3 ° > AT«r > - 7 5 ° for full reservoir
AT^ = ± 15° Temperature on the downstream face of the dam
Transactions on the Built Environment vol 20, © 1996 WIT Press, www.witpress.com, ISSN 1743-3509

Earthquake Resistant Engineering Structures 713
a) WFigure 7. Variation of temperatures inside the dam
If the crossing point between the lines representing the linear variation from theboundaries stood at a temperature lower than T/,, a situation as presented in
Figure 7a appeared. In the opposite case the distribution of temperatures was as
indicated in Figure 7b.
4. NUMERICAL RESULTS
Let remember that the total number of seismic analysis was 8x4 = 32 (eight
structural models by four load combinations). The envelope of stresses of the
complete set was also combinated with the thermal loadings of Table 4. That
means a number of 32 x 4 = 128 combinations. The numerical results obtained
were the following.
4.1. Worst situation with full reservoir
That situation arised for the following case:
• Structural model: bol 8
• Seismic loading: V + //2
• Thermal loading:For tensile stresses (Pj) the worst case contained the thermal loading
AT - - 15 °C, gj = 1- For compressive stresses (Pj) the worst case
contained the thermal loading AT = 15 °C, g? = 2.
Figure 8 shows values of Pj (separated into components) and Figure 9 presents
values of Pj.
4.2. Worst situation with empty reservoir
This situation corresponded to:
• Geometric model: bol 8
• Seismic loading: V + //2
Transactions on the Built Environment vol 20, © 1996 WIT Press, www.witpress.com, ISSN 1743-3509

714 Earthquake Resistant Engineering Structures
ENV P1
i
Figure 8. Values ofPj (kg/cm?) for the worst loading combination withfull reservoir.
ENV P3
Figure 9. Values ofP (kg/cm )for the worst loading combination withfull reservoir.
Transactions on the Built Environment vol 20, © 1996 WIT Press, www.witpress.com, ISSN 1743-3509

Earthquake Resistant Engineering Structures 715
ENV
i
Figure 10. Values of PI (kgcm )for the worst loading combination withempty reservoir.
Figure 11. Values ofPj (kg cm )for the worst loading combination withempty reservoir.
Transactions on the Built Environment vol 20, © 1996 WIT Press, www.witpress.com, ISSN 1743-3509

716 Earthquake Resistant Engineering Structures
• Thermal loading:For tensile stresses (Pj) the worst case contained the thermal loading
AT = - 15 °C, g? = 1. For compressive stresses (Pj) the worst case
contained the thermal loading AT = 15 °C, g? - 2.
Total values of principal stresses PI and P$ are showed in Figures 10 and 11,
respectively.
5. REFERENCES
1. CHOPRA, A.K.; CHAKRABARTI, P. and GUPTA, S.: Earthquake
Response of Concrete Gravity Dams Including Hydrodynamic and
Foundation Interaction Effects. Report N° UCB/EERC-80/01, Earthquake
Engineering Research Center, University of California, Berkeley,
California, Jan. 1980.
2. DASGUPTA, G. and CHOPRA, A.K.: Dym%/mc Sf#%fM Maf//cf,s/b,
Viscoelastic Half Planes. "Journal of the Engineering Mechanics Division",
ASCE, Vol. 105. N° EM5, Oct. 1979, pp. 729-745.
3. FENVES, G. and CHOPRA, A.K.: Earfgwatf AWyj/'j q/ CoMcr^^
Gravity Dams Including Reservoir Bottom Absorption and Dam-Water-Foundation Rock Interaction, "Earthquake Engineering and Structural
Dynamics", Vol. 12, pp. 663-680 (1984).
4. HALL, J.F.: An FFT Algorithm for Structural Dynamics, "Earthquake
Engineering and Structural Dynamics", Vol. 10, N° 6, Nov.-Dec. 1982,
pp. 797-811.
5. FENVES, G.; CHOPRA, A.K.: Effects of Reservoir Bottom Absortion
and Dam-Water-Foundation Rock Interaction on Frecuency ResponseFunctions for Concrete Gravity Dams, "Earthquake Engineering and
Structural Dynamics", Vol. 13, pp. 13-31 (1985).
6. FENVES, G.; CHOPRA, A.K.: EAGD-&4. A Compwffr frogmm /orEarthquake Analysis of Concrete Gravity Dams. Report N° UCB/EERC-
84/11. Earthquake Engineering Research Center, University of California,
Berkeley, California, August 1984.
7. COSMOS/M 1.71 version. User's Manual, SARC. Santa Monica,
California, 1994.
Transactions on the Built Environment vol 20, © 1996 WIT Press, www.witpress.com, ISSN 1743-3509