le tte rs to n a tu re - lamont–doherty earth...
TRANSCRIPT
letters to nature
756 NATURE |VOL 403 | 17 FEBRUARY 2000 |www.nature.com
9. Bai, T. & Pollard, D. D. Fracture spacing in layered rocks: a new explanation based on the stresstransition. J. Struct. Geol. 22, 43–57 (2000).
10. Bai, T. & Pollard, D. D. Spacing of fractures in a multilayer at fracture saturation. Int. J. Fract. (in thepress).
11. Price, N. J. Fault and Joint Development in Brittle and Semi-Brittle Rocks 176 (Pergamon, Oxford,1966).
12. Pollard, D. D. & Aydin, A. Progress in understanding jointing over the past century. Geol. Soc. Am.Bull. 100, 1181–1204 (1988).
13. National Research Council Rock Fractures and Fluid Flow: Contemporary Understanding andApplications 551 (National Academy Press, Washington DC, 1996).
14. Whittaker, B. N., Gaskell, P. & Reddish, D. J. Subsurface ground strain and fracture developmentassociated with longwall mining. Mining Sci. Technol. 10, 71–80 (1990).
15. Thouless, M. D., Olsson, E. & Gupta, A. Cracking of brittle films on elastic substrates. Acta Metall.Mater. 40, 1287–1292 (1992).
16. Hong, A. P., Li, Y. N. & Bazant, P. Theory of crack spacing in concrete pavements. J. Eng. Mech. 123,267–275 (1997).
17. Lachenbruch, A. H. Depth and spacing of tension cracks. J. Geophys. Res. 66, 4273–4292 (1961).18. Hu,M. S. & Evans, A. G. The cracking and decohesion of thin films on ductile substrates. ActaMetall.
37, 917–925 (1989).19. Thouless,M.D. Somemechanics for the adhesion of thin films.Thin Solid Films 181, 397–406 (1989).20. Thouless,M. D. Crack spacing in brittle films on elastic substrates. J. Am. Ceram. Soc. 73, 2144–2146
(1990).21. Timoshenko, S. P. & Goodier, J. N. Theory of Elasticity 3rd edn, 567 (McGraw-Hill, New York, 1970).22. Wawrzynek, P. A. & Ingraffea, A. R. Interactive finite element analysis of fracture processes: An
integrated approach. Theor. Appl. Fract. Mech. 8, 137–150 (1987).
AcknowledgementsWe thank A. Aydin,M. Gross, G.Mavko and Y. Yue for discussions and suggestions. Thiswork was supported by the Stanford RFP and the US NSF.
Correspondence and requests for materials should be addressed to T. B.(e-mail:[email protected]).
.................................................................Temperature trends overthe past five centuries reconstructedfrom borehole temperaturesShaopeng Huang*, Henry N. Pollack* & Po-Yu Shen†
*Department of Geological Sciences, The University of Michigan, Ann Arbor,Michigan 48109-1063, USA†Department of Earth Sciences, The University of Western Ontario, London,Ontario, N6A 5B7, Canada
.................................. ......................... ......................... ......................... ......................... ........
For an accurate assessment of the relative roles of naturalvariability and anthropogenic influence in the Earth’s climate,reconstructions of past temperatures from the pre-industrial aswell as the industrial period are essential. But instrumentalrecords are typically available for no more than the past 150years. Therefore reconstructions of pre-industrial climate relyprincipally on traditional climate proxy records1–5, each withparticular strengths and limitations in representing climaticvariability. Subsurface temperatures comprise an independentarchive of past surface temperature changes that is complemen-tary to both the instrumental record and the climate proxies.Herewe use present-day temperatures in 616 boreholes from allcontinents except Antarctica to reconstruct century-long trendsin temperatures over the past 500 years at global, hemispheric andcontinental scales. The results confirm the unusual warming ofthe twentieth century revealed by the instrumental record6, butsuggest that the cumulative change over the past five centuriesamounts to about 1 K, exceeding recent estimates from conven-tional climate proxies2–5. The strength of temperature reconstruc-tions from boreholes lies in the detection of long-term trends,complementary to conventional climate proxies, but to obtain acomplete picture of past warming, the differences between theapproaches need to be investigated in detail.
The thermal regime of the uppermost continental crust isdetermined in part by the outward flow of heat from the deepinterior of the Earth and in part by fluctuations of temperature atthe surface. In homogeneous rock and in the absence of changes atthe surface, the temperature in the subsurface increases linearly withdepth, at a rate which is governed by themagnitude of the terrestrialheat flow and the thermal conductivity of the rock. Fluctuations ofsurface temperature propagate downward into the rock as attenu-ating thermal waves superimposed on the temperature profileassociated with the deeper heat flow. The depth to which disturb-ances can be observed is determined by the amplitude, duration andspectral composition of the temperature change at the surface.Owing to the generally low thermal diffusivity of rock, propagationof climate signals in the subsurface is slow. Following a change intemperature at the surface, it takes about 100 years for the perturba-tion to reach a depth of 150m, and 1,000 years to reach 500m depth.Complications in reconstructing a ground surface temperature(GST) history from subsurface temperature data can, however,arise from various non-climatic disturbances7 that perturb subsur-face temperatures.We have assembled a database of borehole temperatures for
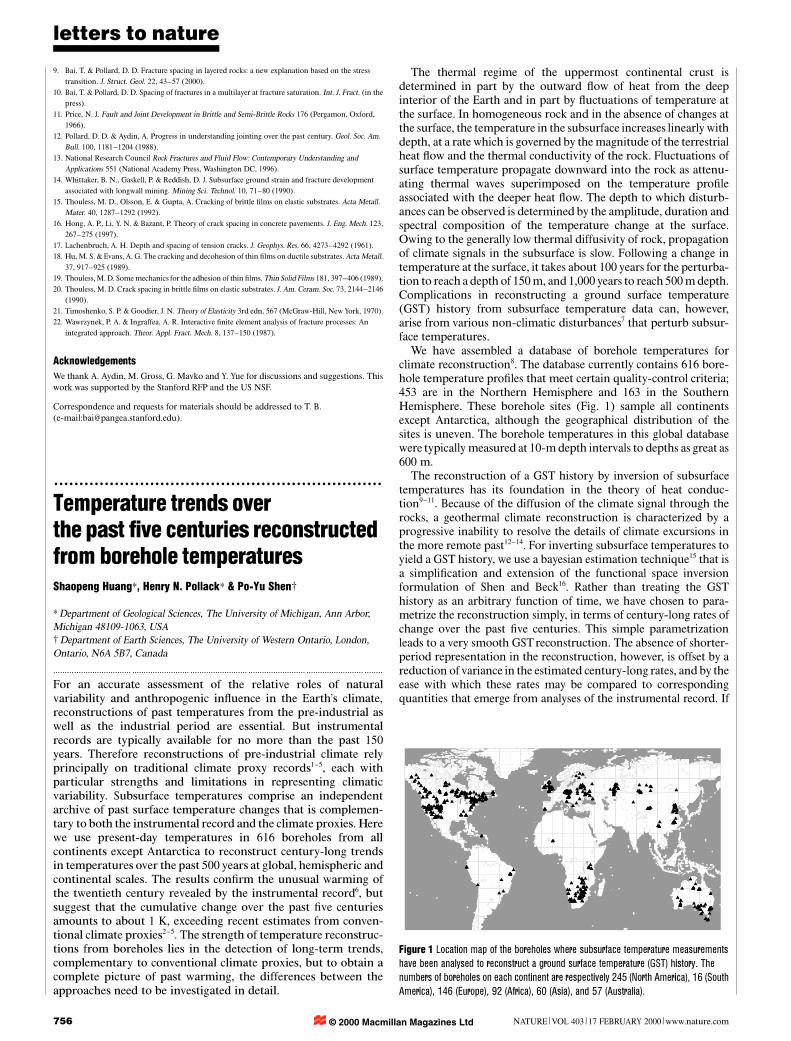
climate reconstruction8. The database currently contains 616 bore-hole temperature profiles that meet certain quality-control criteria;453 are in the Northern Hemisphere and 163 in the SouthernHemisphere. These borehole sites (Fig. 1) sample all continentsexcept Antarctica, although the geographical distribution of thesites is uneven. The borehole temperatures in this global databasewere typicallymeasured at 10-m depth intervals to depths as great as600 m.The reconstruction of a GST history by inversion of subsurface
temperatures has its foundation in the theory of heat conduc-tion9–11. Because of the diffusion of the climate signal through therocks, a geothermal climate reconstruction is characterized by aprogressive inability to resolve the details of climate excursions inthe more remote past12–14. For inverting subsurface temperatures toyield a GST history, we use a bayesian estimation technique15 that isa simplification and extension of the functional space inversionformulation of Shen and Beck16. Rather than treating the GSThistory as an arbitrary function of time, we have chosen to para-metrize the reconstruction simply, in terms of century-long rates ofchange over the past five centuries. This simple parametrizationleads to a very smooth GST reconstruction. The absence of shorter-period representation in the reconstruction, however, is offset by areduction of variance in the estimated century-long rates, and by theease with which these rates may be compared to correspondingquantities that emerge from analyses of the instrumental record. If
Figure 1 Location map of the boreholes where subsurface temperature measurementshave been analysed to reconstruct a ground surface temperature (GST) history. Thenumbers of boreholes on each continent are respectively 245 (North America), 16 (SouthAmerica), 146 (Europe), 92 (Africa), 60 (Asia), and 57 (Australia).
© 2000 Macmillan Magazines Ltd

letters to nature
NATURE |VOL 403 | 17 FEBRUARY 2000 |www.nature.com 757
climate-change trends do not coincide closely with the calendarcenturies, such as when a natural century-long trend straddles twocalendar centuries, the inversion will attribute part to one centuryand part to the other, thus creating a temporal smearing of thetemperature trend. In the inversion we employ an a priori nullhypothesis for the GST history; that is, an initial estimate that therehas been no climate change. This is a conservative hypothesis that isalso fully independent of any extant models of climate change. Asresolution diminishes further back in time, the null hypothesisbecomes more difficult to reject.
Of the 616 borehole temperature profiles we analysed, 479 show anet warming over the past five centuries. The average of thecumulative temperature change over the five-century interval is awarming of about 1.0 K (Fig. 2). In the twentieth century alone, theaverage surface temperature of the continents has increased byabout 0.5 K, and the twentieth century has been the warmestcentury of the past five. This ensemble average is consistent withthat derived earlier from a smaller and geographically morerestricted data set of 358 boreholes from eastern North America,central Europe, southern Africa, and Australia17. Although themechanism of the coupling between the air temperature at thesurface and the GST is not simple, and varies from one geographicalsetting to another18–20, at a large spatial scale the trends of the surfaceair temperature anomaly and the GSTanomaly match well (Fig. 2).Both the globalmean surface air temperature (SAT) anomaly series6
and the GST continental reconstruction show substantial warmingin the twentieth century. The geothermal reconstruction is ingenerally good agreement with the trend of the global SAT recordin both the late nineteenth and twentieth centuries, and extends theclimate history back several hundred years before the instrumental
record. Almost 80% of the net temperature increase observed hasoccurred in the nineteenth and twentieth centuries.The magnitude of ground surface warming over the past five
centuries is greater in the Northern Hemisphere than in the South-ern Hemisphere: the five-century cumulative change is 1.1 K in theformer, and 0.8 K in the latter. The twentieth-century temperaturechange is 0.6 K in theNorthernHemisphere comparedwith 0.4 K inthe Southern Hemisphere. These values compare, respectively, with0.60 and 0.65 K per century for hemispheric trends in the combinedland and sea surface air temperature6. The geothermal hemisphericestimates for the twentieth century show even greater consistencywith the land-only hemispheric trends of 0.56 and 0.47 K percentury reported by Jones21. We note that the relatively smallnumber of geothermal observations—and the limited geographicalregions represented by them, particularly in the Southern Hemi-sphere—make tentative any comparisons with hemispheric SATtrends.
Additional regional and temporal variability can be seen in theindividual continental GST histories (Fig. 3), although the absenceof data in large parts of several continents precludes a detailedinterpretation. The five-century cumulative temperature changesare respectively 1.2 K for North America, 1.4 K for South America,0.8 K for Europe, 0.8 K for Africa, 1.2 K for Asia and 0.5 K forAustralia. The GST reconstructions for all six continents exhibit acommon characteristic: the temperature change in the twentiethcentury is the largest of the past five centuries. Intercontinentalcomparisons for the earlier centuriesmust be assessedwith caution,particularly because of the sparseness of observations in SouthAmerica and Asia.Considerable effort has been given recently to combining several
proxies in order to produce global, hemispheric and regional-scaleclimate reconstructions1–5,21–23. Figure 4 shows the comparison ofour Northern Hemisphere geothermal reconstruction with threerecentmulti-proxy representations. All show significant increases oftemperature in the twentieth century, but display differences in theprevious four centuries. The differences between the various recon-structions may arise in part because of the different geographicaldistribution of the data used in the respective reconstructions, orperhaps because of differing weights given to individual proxy datasets in the multi-proxy reconstructions22. Of the full hemisphericreconstructions, the geothermal estimate of the five-century tem-perature change is the largest.The differences in the pre-instrumental centuries between the
geothermal reconstruction and the multi-proxy reconstructions
Southern Hemisphere
-1.0
-0.5
0.0
1500 1600 1700 1800 1900 2000Year
Northern Hemisphere
Tem
pera
ture
rel
ativ
e to
pre
sent
day
(K)
-1.0
-0.5
0.0
G lobal
-1.0
-0.5
0.0
Figure 2 Global and hemispheric averages of GST history over the past five centuries.Shaded areas represent 6 1 standard error about the mean. Superimposed are thecorresponding series of instrumental surface air temperatures (SAT)6. Because thegeothermal reconstruction is the concatenation of century-long trends, and the SATanomaly series are referenced to the mean over the period 1961–90, we have shifted theSAT series along the temperature axis to enable an easy comparison of their respectivetrends. The SAT records have been shifted −0.20 K for the global series, −0.28 K for theNorthern Hemisphere and −0.13 K for the Southern Hemisphere.
K per 100 yr0.0
0.5
1.0
Figure 3 Continental century-long GST changes. In each histogram, the five columnsfrom left to right represent respectively the sixteenth, seventeenth, eighteenth, nineteenthand twentieth centuries. The magnitude of the temperature change is shown as the heightof the column. The continental reconstructions for South America and Asia are lightlyshaded to indicate the larger uncertainties in these two continents because of the lowspatial density of observations.
© 2000 Macmillan Magazines Ltd

letters to nature
758 NATURE |VOL 403 | 17 FEBRUARY 2000 |www.nature.com
may also arise in part from the role of tree-ring series in theirreconstructions22. Tree-ring data are an important resource inpalaeoclimate reconstruction because of their annual resolutionand relatively good spatial and temporal coverage. However, tree-ring analyses generally involve some temporal detrending23, aprocess that is intended to mute long-term growth trends thatmay be present in the data. For this reason, the long-term trendsderived from borehole temperatures may have a role as usefulcomplements to the traditional proxy reconstructions. Whateverthe underlying causes of the differences between the variousreconstructionsmay be, however, the resolution of these differences,particularly in determining the total temperature change over thefive-century interval, is important. This temperature change has thepotential to be a useful empirical constraint on the climate-sensitivity factor of global climate models. M
Received 7 June; accepted 8 December 1999.
1. Overpeck, J. et al. Arctic environmental change of the last four centuries. Science 278, 1251–1256(1997).
2. Briffa, K. R., Jones, P. D., Schweingruber, F. H. & Osborn, T. J. Influence of volcanic eruptions onNorthern Hemisphere summer temperature over the past 600 years. Nature 393, 450–455 (1998).
3. Jones, P.D., Briffa, K.R., Barnett, T.P. & Tett, S.F.B.High-resolution palaeoclimatic records for the lastmillennium: interpretation, integration and comparison with general circulation model control-runtemperatures. Holocene 8, 455–71 (1998).
4. Mann,M.E., Bradley, R.S. &Hughes,M.K. Global-scale temperature patterns and climate forcing overthe past six centuries. Nature 392, 779–787 (1998).
5. Mann, M.E., Bradley, R.S. & Hughes, M.K. Northern hemisphere temperatures during the pastmillennium: inferences, uncertainties, and limitations. Geophys. Res. Lett. 26, 759–762 (1999).
6. Jones,P.D.,New,M., Parker,D.E.,Martin, S. & Rigor, I.G. Surface air temperature and its changes overthe past 150 years. Rev. Geophys. 37, 173–199 (1999).
7. Shen,P.-Y., Pollack,H.N.,Huang, S. &Wang, K. Effects of subsurfaceheterogeneity on the inference ofclimate change from borehole temperature data: model studies and field examples from Canada. J.Geophys. Res. 100, 6383–6396 (1995).
8. Huang, S. & Pollack, H.N. Global Borehole Temperature Database for Climate Reconstruction (IGBPPAGES/World Data Center-A for Paleoclimatology Data Contribution Series No. 1998-044, NOAA/NGDC Paleoclimatology Program, Boulder, Colorado, 1998).
9. Birch, F. The effects ofPleistocene climatic variations upon geothermal gradients.Am. J. Sci. 246, 729–760 (1948).
10. Cermak, V. Underground temperature and inferred climatic temperature of the past millennium.Palaeogeogr. Palaeoclimatol. Palaeoecol. 10, 1–19 (1971).
11. Lachenbruch, A.H. & Marshall, B.V. Changing climate: geothermal evidence from permafrost in theAlaskan Arctic. Science 234, 689–696 (1986).
12. Clow, G.D. Temporal resolution of surface temperature histories inferred from borehole temperaturedata. Palaeogeogr. Palaeoclimatol. Paleoecol. 98, 81–86 (1992).
13. Beltrami, H. & Mareschal, J.C. Resolution of ground temperature histories inverted from boreholetemperature data. Glob. Planet. Change 11, 57–70 (1995).
14. Harris, R.H. & Chapman,D.S. Climate change on the Colorado Plateau of eastern Utah inferred fromborehole temperatures. J. Geophys. Res. 103, 7363–6381 (1998).
15. Huang, S., Shen, P.-Y. & Pollack, H.N. Deriving century-long trends of surface temperature fromborehole temperatures. Geophys. Res. Lett. 23, 257–260 (1996).
16. Shen, P.-Y & Beck, A.E. Least squares inversion of borehole temperaturemeasurements in functionalspace. J. Geophys. Res. 96, 19965–19979 (1991).
17. Pollack, H.N., Huang, S. & Shen, P.-Y. Climate change record in subsurface temperatures: a globalperspective. Science 282, 279–281 (1998).
18. Chapman, D.S., Chisolm, T.J. & Harris, R.N. Combining borehole temperature and meteorologicaldata to constrain past climate change. Palaeogeogr. Palaeoclimatol. Palaeoecol. 98, 269–281 (1992).
19. Lewis, T.J. The effect of deforestation on ground surface temperatures.Glob. Planet. Change 18, 1–13(1998).
20. Majorowicz, J.A. & Skinner, W.R. Potential causes of differences between ground and surface airtemperature warming across different ecozones in Alberta, Canada. Glob. Planet. Change 15, 79–91(1997).
21. Jones, P.D. Hemispheric surface air temperature variations: A reanalysis and an update to 1993. J.Clim. 7, 1794–1802 (1994).
22. Jones, P.D. It was the best of times, it was the worst of times. Science 280, 544–545 (1998).23. Briffa, K. R. & Osborn, T. J. Seeing the wood from the trees. Science 284, 926–927 (1999).
AcknowledgementsWe thank the International Heat Flow Commission and international colleagues formaking available many of the borehole temperature profiles that we analysed. S.H. isoriginally from the Institute of Geology and Geophysics, Chinese Academy of Sciences.This work was supported by the US National Science Foundation, the US NationalOceanic and Atmospheric Administration, and the International Geological CorrelationProject 428.
Correspondence and request for materials should be addressed to H.N.P.(e-mail: [email protected]).
Arctic; ref.1
-1.5
-1.0
-0.5
0.0
0.5
1500 1600 1700 1800 1900 2000Year
N . Hemisphere; ref.3
Tem
pera
ture
rel
ativ
e to
pre
sent
day
(K)
-1.5
-1.0
-0.5
0.0
0.5
N . Hemisphere; ref.4
-1.5
-1.0
-0.5
0.0
0.5
Figure 4 Comparison of five-century Northern Hemisphere geothermal reconstructionswith three multi-proxy reconstructions (refs 4, 3 and 1). The Mann et al.4 and Jones et al.3
reconstructions have been shifted along the temperature axis −0.25 K and −0.20 K,respectively, to enable direct comparison of the trends. The Overpeck et al.1 recon-struction has not been shifted.
.................................................................Effect of stream channel sizeon the delivery of nitrogento the Gulf of MexicoRichard B. Alexander, Richard A. Smith & Gregory E. Schwarz
U. S. Geological Survey, 413 National Center, Reston, Virginia 20192, USA
................. ......................... ......................... ......................... ......................... .........................
An increase in the flux of nitrogen from the Mississippi riverduring the latter half of the twentieth century has causedeutrophication and chronic seasonal hypoxia in the shallowwaters of the Louisiana shelf in the northern Gulf of Mexico1–5.This has led to reductions in species diversity,mortality of benthiccommunities and stress in fishery resources4. There is evidence fora predominantly anthropogenic origin of the increased nitrogenflux2,5–7, but the location of the most significant sources in theMississippi basin responsible for the delivery of nitrogen tothe Gulf of Mexico have not been clearly identified, because theparameters influencing nitrogen-loss rates in rivers are not wellknown.Here we present an analysis of data from 374 USmonitor-
© 2000 Macmillan Magazines Ltd