lead time: what we know about it
TRANSCRIPT

Lead Time:What We Know About It
And How It Can Help Forecast Your Projects
Alexei ZheglovLean Kanban Asia-Pacific
Bangalore, December 2014


@az1
#lkapac

“When a measure becomes a target,it ceases to be a good measure.”
Goodhart’s Law
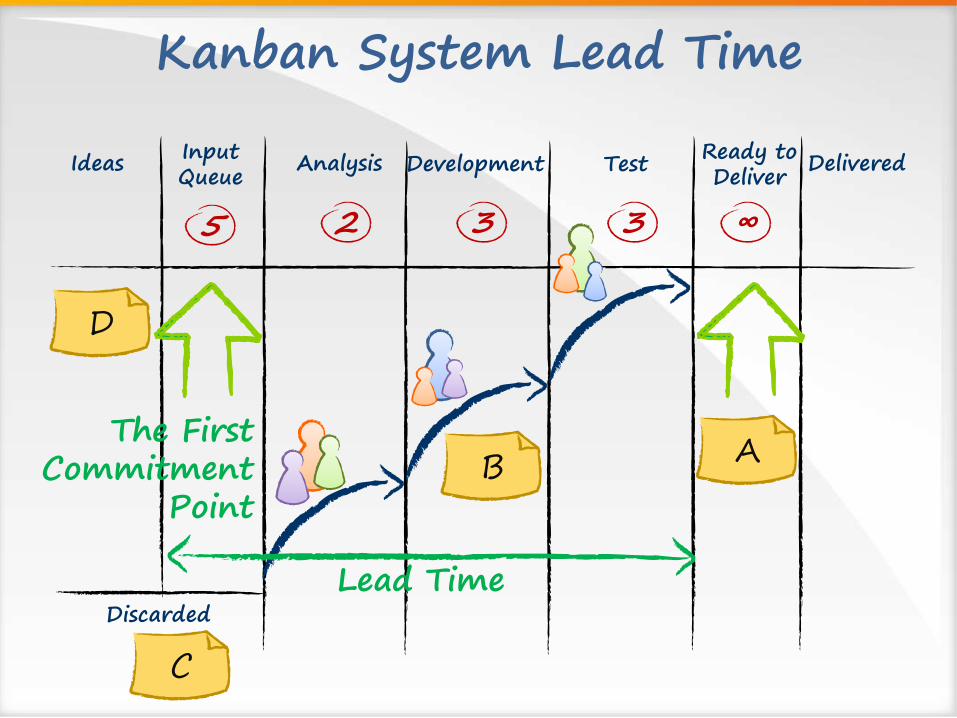
Kanban System Lead Time
DeliveredIdeas AnalysisInputQueue
Ready to Deliver
∞325
Development Test
3
Lead Time
The FirstCommitment
Point
AB
C
Discarded
D

Ask Not
DeliveredIdeas AnalysisInputQueue
Ready to Deliver
∞325
Development Test
3
Lead Time
AB
C
Discarded
D
Not “how long will it take?”

Do Ask
DeliveredIdeas AnalysisInputQueue
Ready to Deliver
∞325
Development Test
3
Lead Time
AB
C
Discarded
D
When should we start?
When do we need it?

Decide
DeliveredIdeas AnalysisInputQueue
Ready to Deliver
∞325
Development Test
3
Lead Time
AB
C
Discarded
D
One eventprecedes (leads) another one
by this much
One eventprecedes (leads) another one
by this much

Why?
DeliveredIdeas AnalysisInputQueue
Ready to Deliver
∞325
Development Test
3
Lead Time
The FirstCommitment
PointAB
C
Discarded
D
Includes the time the work item spent as
an option
Depends on the transaction costs (external to the
system)
Measures the true delivery capability

Customer Lead Time
DeliveredIdeas Activity 1InputQueue
Output Buffer
∞???
Activity 2 Activity 3
?
Customer Lead Time
AB
Kanban system(s) lead time+
time spent in the unlimited buffer(s)
C
Discarded
D

(Local) Cycle Time
DeliveredIdeas Activity 1InputQueue
Output Buffer
∞???
Activity 2 Activity 3
?
AB
C
Discarded
D
Cycle time is always localAlways qualify where
it is from and to
Often depends mainly on the size of the local effort
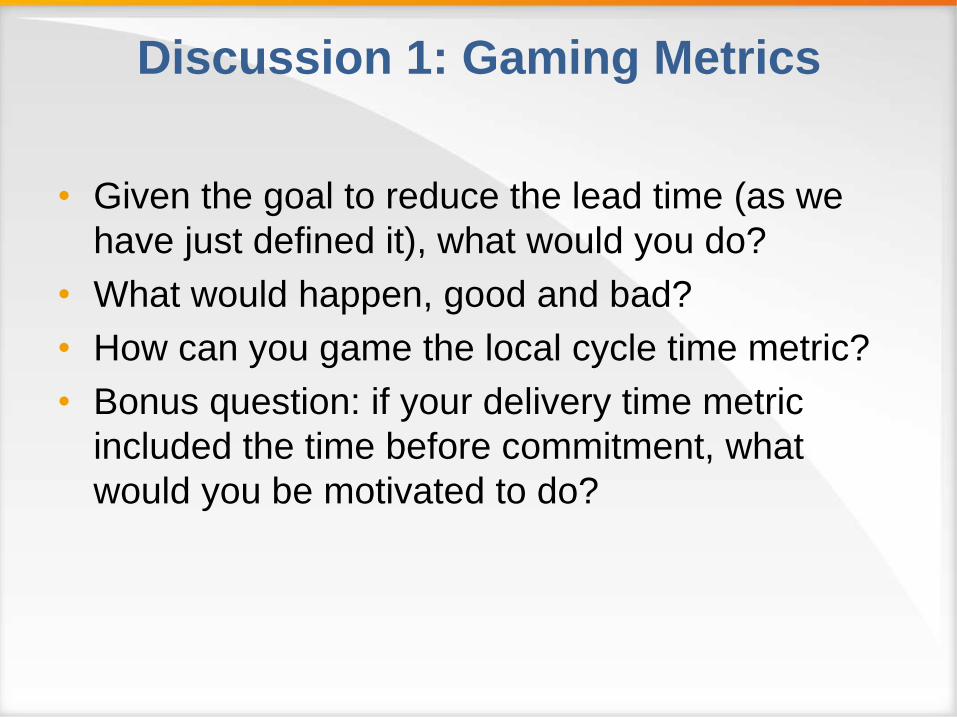
Discussion 1: Gaming Metrics
• Given the goal to reduce the lead time (as we
have just defined it), what would you do?
• What would happen, good and bad?
• How can you game the local cycle time metric?
• Bonus question: if your delivery time metric
included the time before commitment, what
would you be motivated to do?
Readyto Test
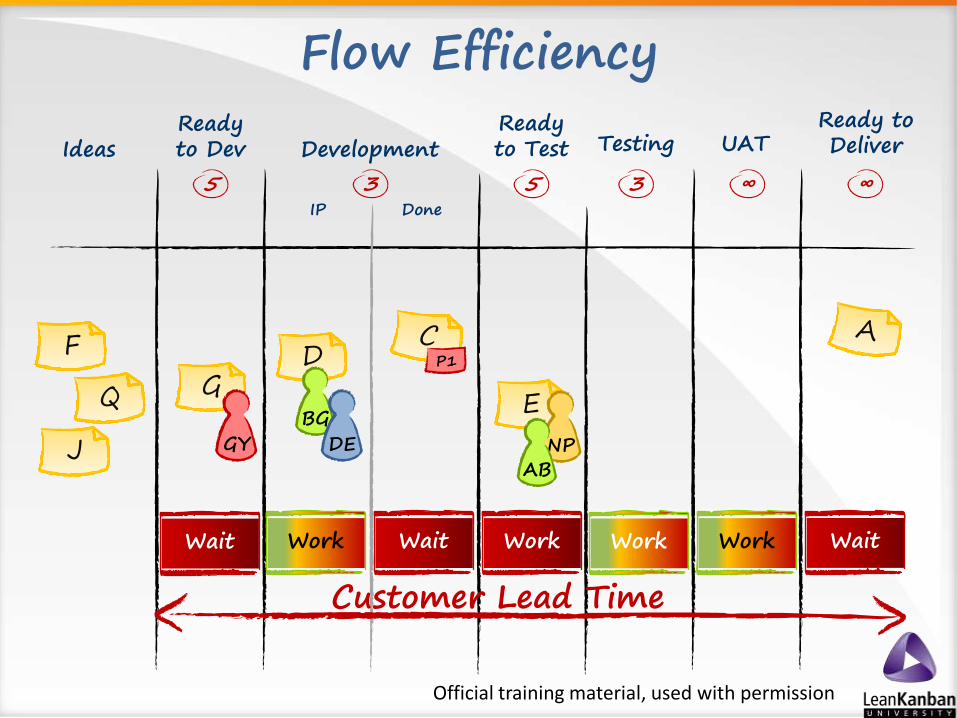
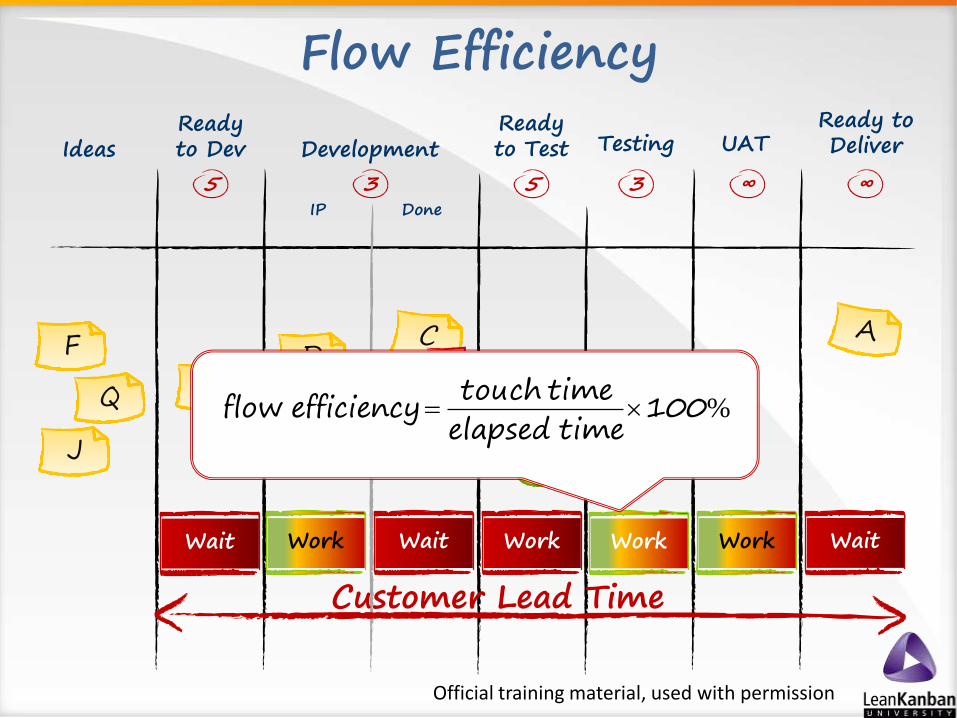
Flow Efficiency
F
E
J
GD
GYBG
DE NP
P1
AB
Customer Lead Time
Wait Wait WorkWork
IdeasReadyto Dev
5IP
Development Testing
Done
3 35
UATReady toDeliver
∞ ∞
Work WaitWork
Official training material, used with permission
Readyto Test
Flow Efficiency
F
E
J
GD
GYBG
DE NP
P1
AB
Customer Lead Time
Wait Wait WorkWork
IdeasReadyto Dev
5IP
Development Testing
Done
3 35
UATReady toDeliver
∞ ∞
Work WaitWork
Official training material, used with permission
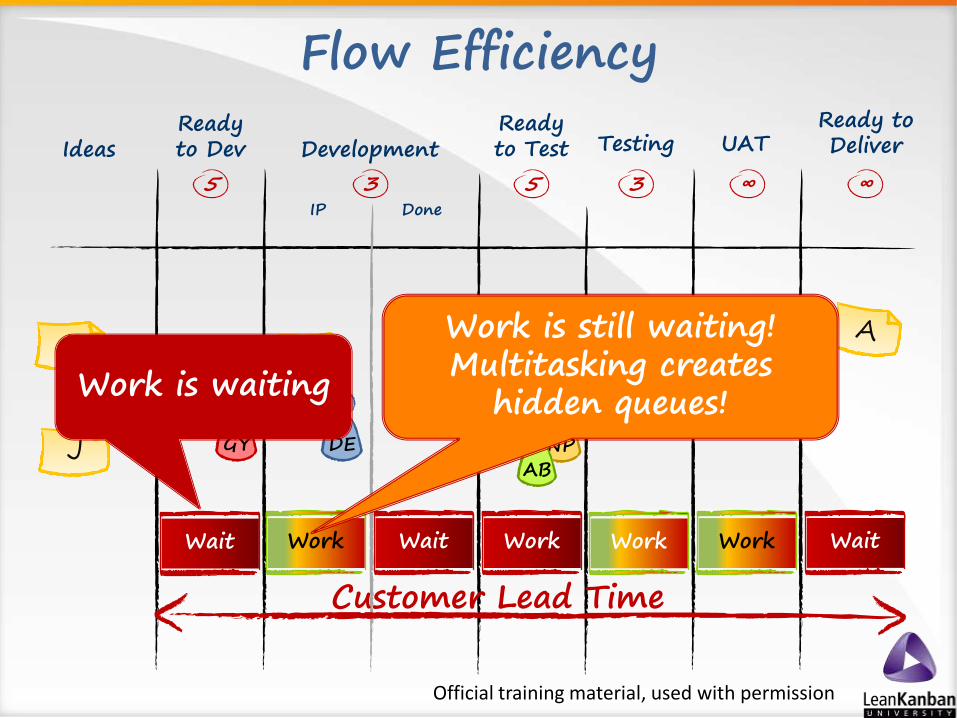
Work is waiting
Work is still waiting!Multitasking creates
hidden queues!
Readyto Test
Flow Efficiency
F
E
J
GD
GYBG
DE NP
P1
AB
Customer Lead Time
Wait Wait WorkWork
IdeasReadyto Dev
5IP
Development Testing
Done
3 35
UATReady toDeliver
∞ ∞
Work WaitWork
Official training material, used with permission
%100time elapsedtime touch
efficiencyflow

Readyto Test
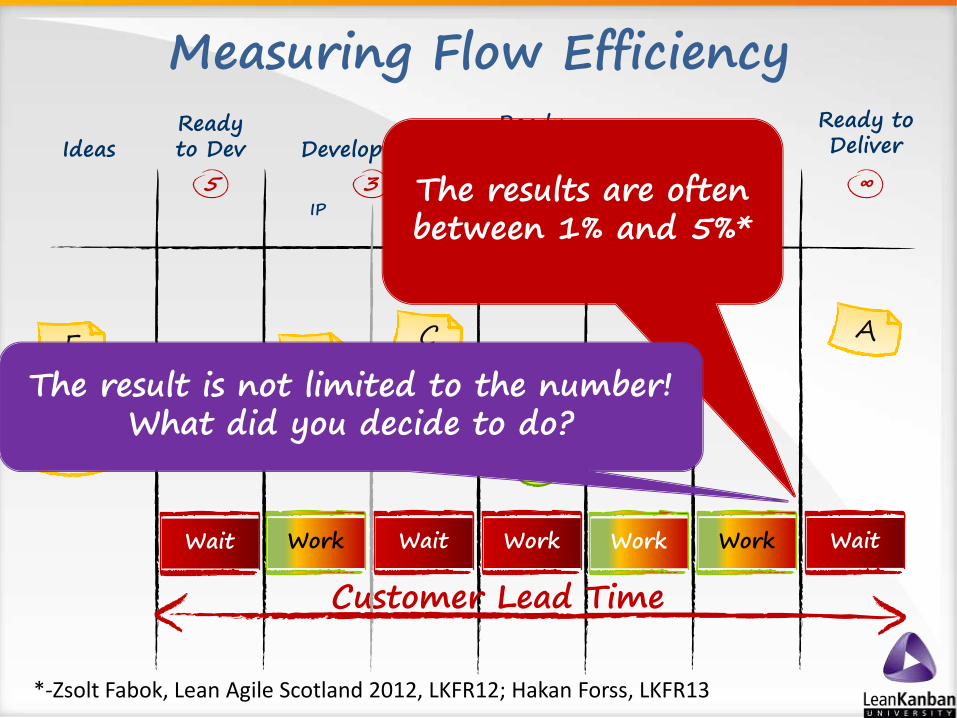
Measuring Flow Efficiency
F
E
J
GD
GYBG
DE NP
P1
AB
Customer Lead Time
Wait Wait WorkWork
IdeasReadyto Dev
5IP
Development Testing
Done
3 35
UATReady toDeliver
∞ ∞
Work WaitWork
Official training material, used with permission
Timesheets arenot necessary!
Rough approximations (±5%) are often sufficient
In Aggregate
Sampling
Readyto Test
Measuring Flow Efficiency
F
E
J
GD
GYBG
DE NP
P1
AB
Customer Lead Time
Wait Wait WorkWork
IdeasReadyto Dev
5IP
Development Testing
Done
3 35
UATReady toDeliver
∞ ∞
Work WaitWork
The results are often between 1% and 5%*
*-Zsolt Fabok, Lean Agile Scotland 2012, LKFR12; Hakan Forss, LKFR13
The result is not limited to the number!What did you decide to do?

If the Flow Efficiency Is 5%...
If... Before After Improvement
Hire 10x engineers 100 95.5 +4.7%
The task is three times bigger 100 110 -9.1%
The task is three times smaller 100 96.7 +3.4%
Reduce delays by half 100 52.5 +90%

Discussion 2:
Consequences of Low Flow Efficiency
(all positives, really)
• Why is lead time is hard to fudge?
• Why does lead time improve mostly due to
system-level improvements?
• How likely are the lead time data from your
previous projects to help you plan a new one?
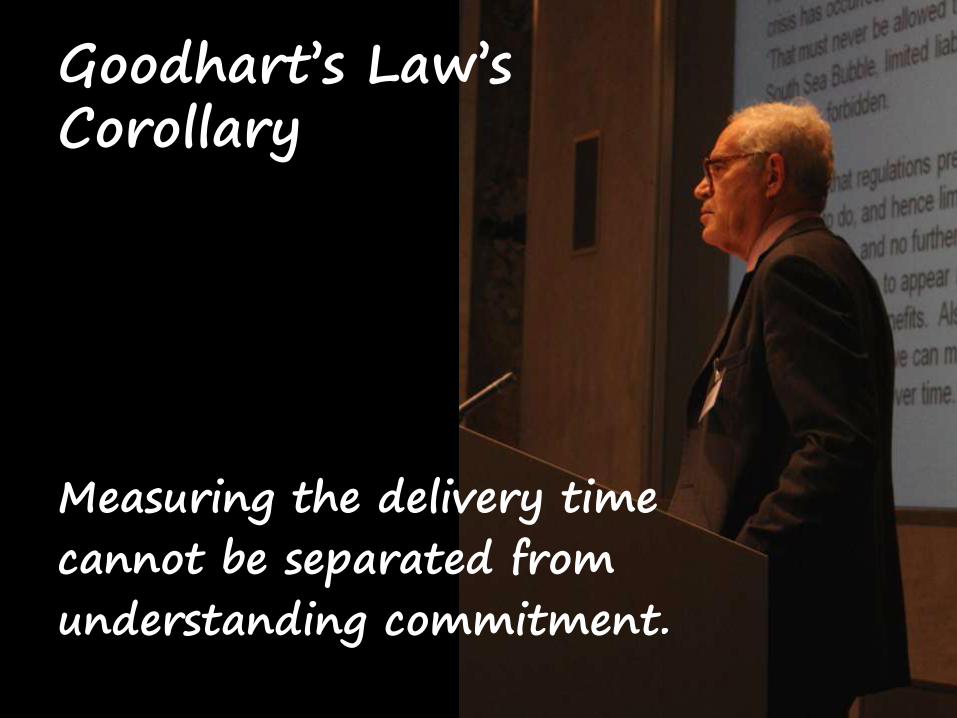
Measuring the delivery timecannot be separated fromunderstanding commitment.
Goodhart’s Law’s Corollary

Start Measuring?
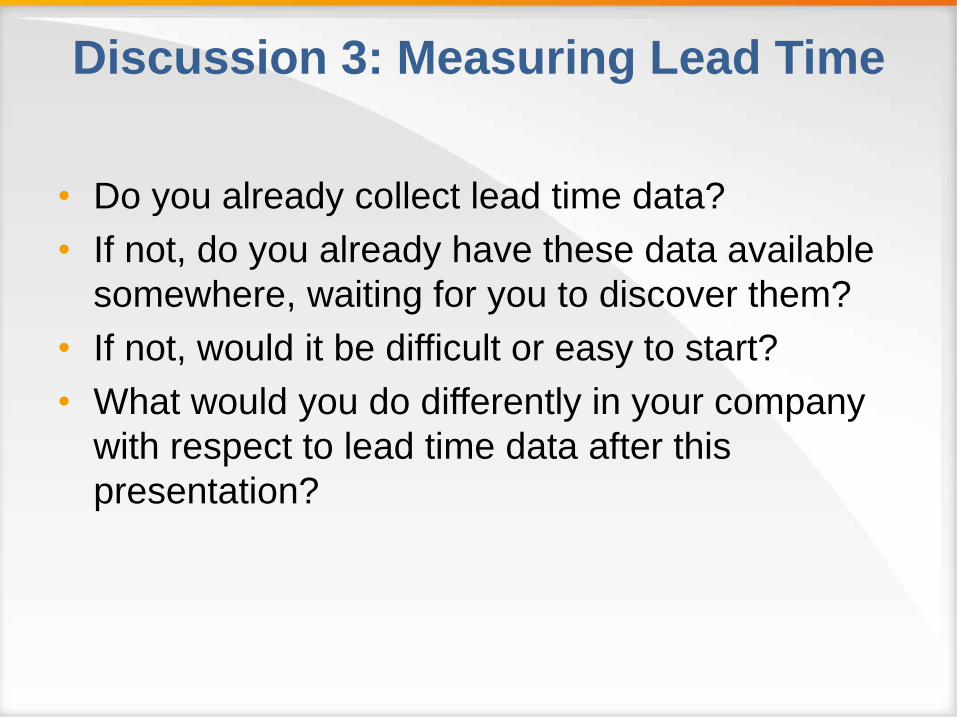
Discussion 3: Measuring Lead Time
• Do you already collect lead time data?
• If not, do you already have these data available
somewhere, waiting for you to discover them?
• If not, would it be difficult or easy to start?
• What would you do differently in your company
with respect to lead time data after this
presentation?
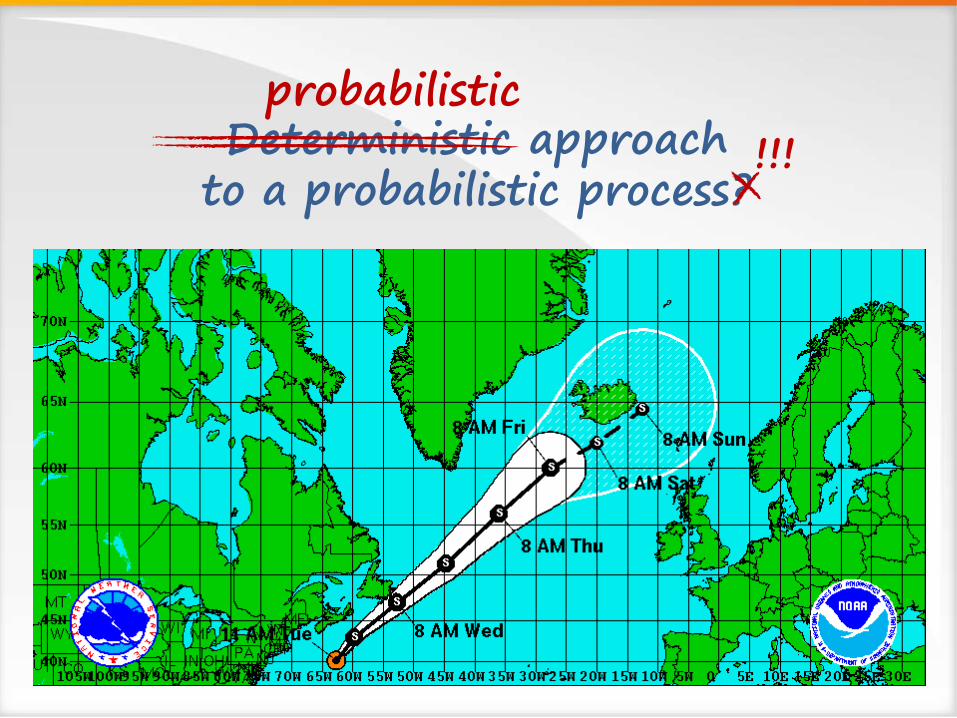
Deterministic approachto a probabilistic process?
probabilistic
!!!
0
2
4
6
8
10
12
14
16
18
20
0-4 5-9 10-14 15-19 20-24 25-29 30-34 35-39 40-44 45-49 50-54 55-59 60-64 65-69 70-74 75-79 80-84 85-89 95-99 100-104
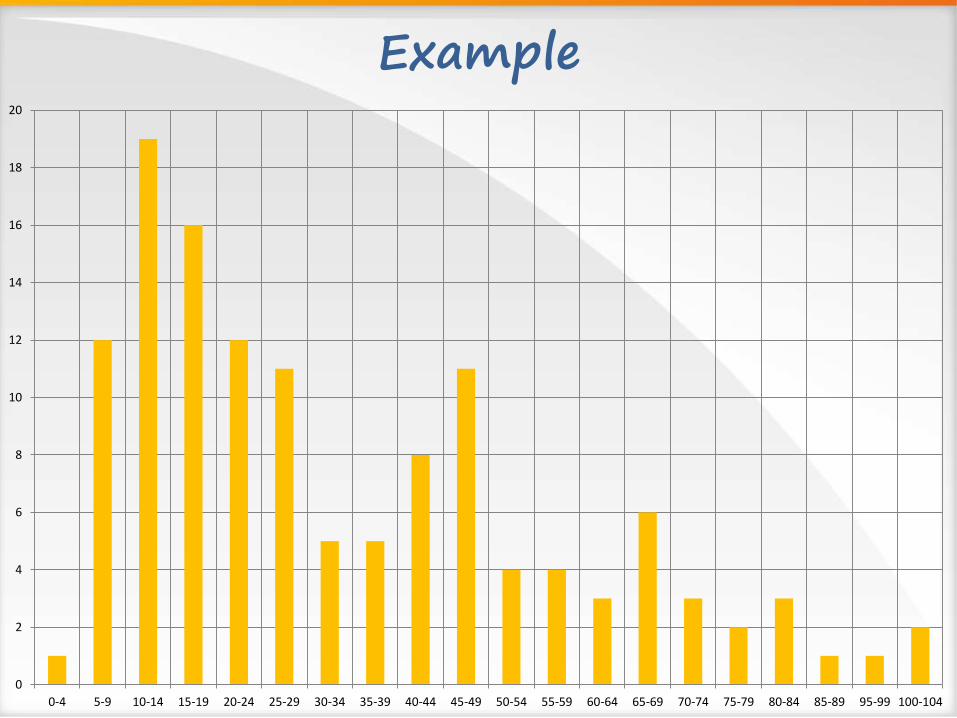
Example

0
2
4
6
8
10
12
14
16
18
20
0-4 5-9 10-14 15-19 20-24 25-29 30-34 35-39 40-44 45-49 50-54 55-59 60-64 65-69 70-74 75-79 80-84 85-89 95-99 100-104
Example
Best-fit distribution:Weibull with
shape parameter k=1.62
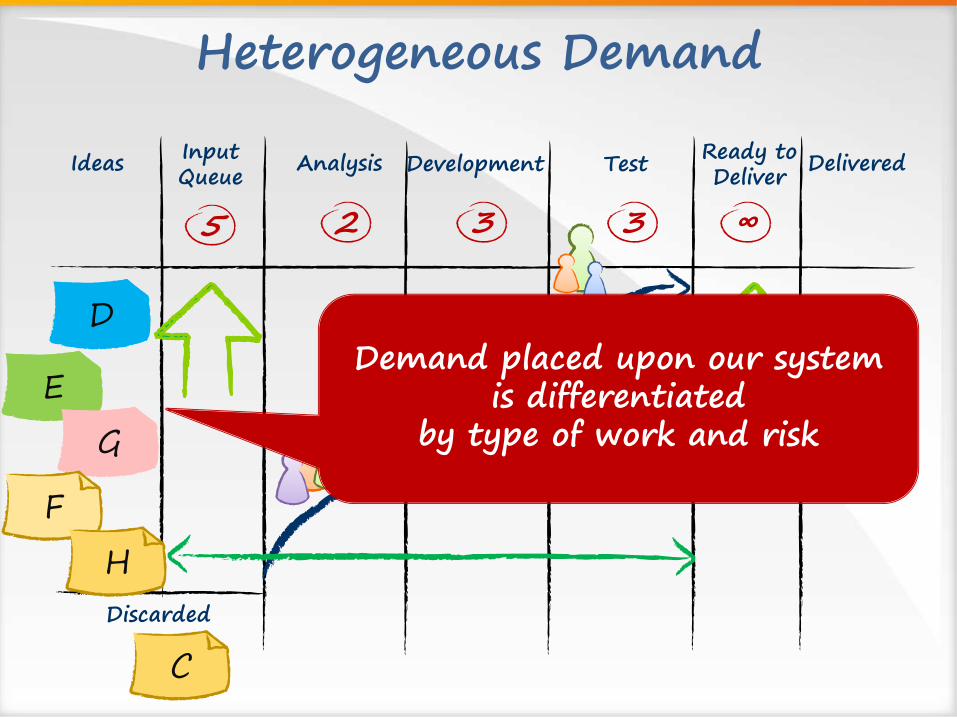
Heterogeneous Demand
DeliveredIdeas AnalysisInputQueue
Ready to Deliver
∞325
Development Test
3
AB
C
Discarded
D
E
G
F
H
Demand placed upon our system is differentiated
by type of work and risk
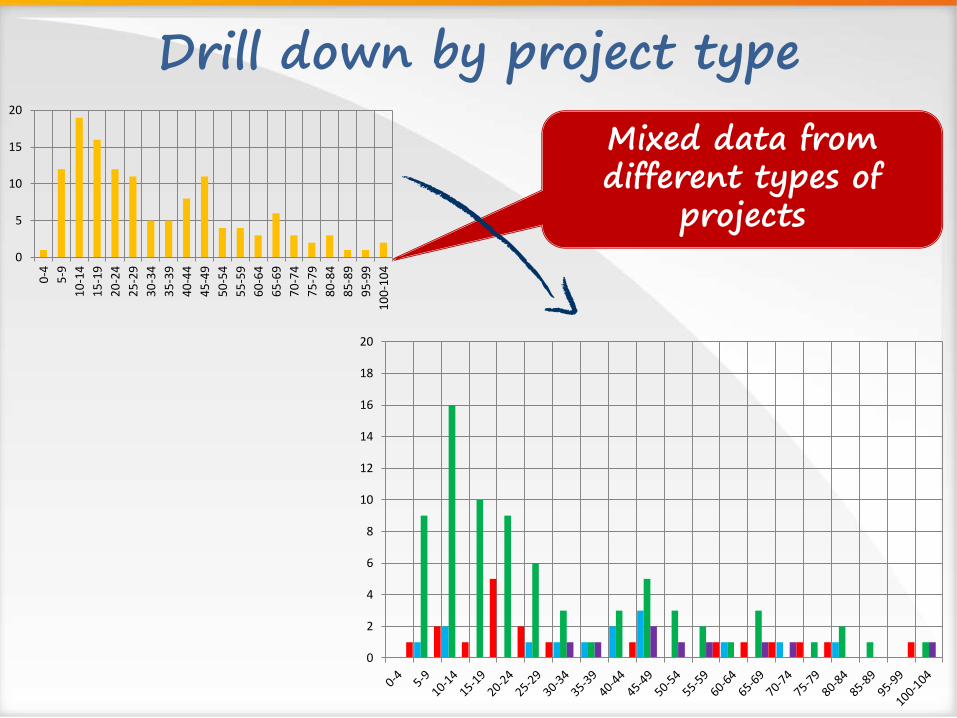
Drill down by project type
0
5
10
15
20
0-4
5-9
10
-14
15
-19
20
-24
25
-29
30
-34
35
-39
40
-44
45
-49
50
-54
55
-59
60
-64
65
-69
70
-74
75
-79
80
-84
85
-89
95
-99
10
0-1
04
0
2
4
6
8
10
12
14
16
18
20
Mixed data from different types of
projects

4 types, 4 different distributions
0
5
10
15
20
0-4
5-9
10
-14
15
-19
20
-24
25
-29
30
-34
35
-39
40
-44
45
-49
50
-54
55
-59
60
-64
65
-69
70
-74
75
-79
80
-84
85
-89
95
-99
10
0-1
04
0
5
10
15
20
0-4
5-9
10
-14
15
-19
20
-24
25
-29
30
-34
35
-39
40
-44
45
-49
50
-54
55
-59
60
-64
65
-69
70
-74
75
-79
80
-84
85
-89
95
-99
10
0-1
04
0
2
4
6
8
10
12
14
16
18
5-9
10
-14
15
-19
20
-24
25
-29
30
-34
35
-39
40
-44
45
-49
50
-54
55
-59
60
-64
65
-69
75
-79
80
-84
85
-89
10
0-1
04
0
1
2
3
4
5
6
0-4
5-9
10
-14
15
-19
20
-24
25
-29
40
-44
55
-59
60
-64
65
-69
70
-74
75
-79
95
-99
...
...

Delivery Expectations
0
5
10
15
20
0-4
5-9
10
-14
15
-19
20
-24
25
-29
30
-34
35
-39
40
-44
45
-49
50
-54
55
-59
60
-64
65
-69
70
-74
75
-79
80
-84
85
-89
95
-99
10
0-1
04
0
5
10
15
20
0-4
5-9
10
-14
15
-19
20
-24
25
-29
30
-34
35
-39
40
-44
45
-49
50
-54
55
-59
60
-64
65
-69
70
-74
75
-79
80
-84
85
-89
95
-99
10
0-1
04
Shape Average In 98%
1.62
1.23
1.65
3.22
In 85% of cases
30 d
35 d
40 d
56 d
<51
<63
<68
<78
<83
<112*
<110*
<99
The averages are insufficientto specify delivery capabilities!
The average says nothing about variability! Needed:
the average and a high percentile (usually 80-99%)
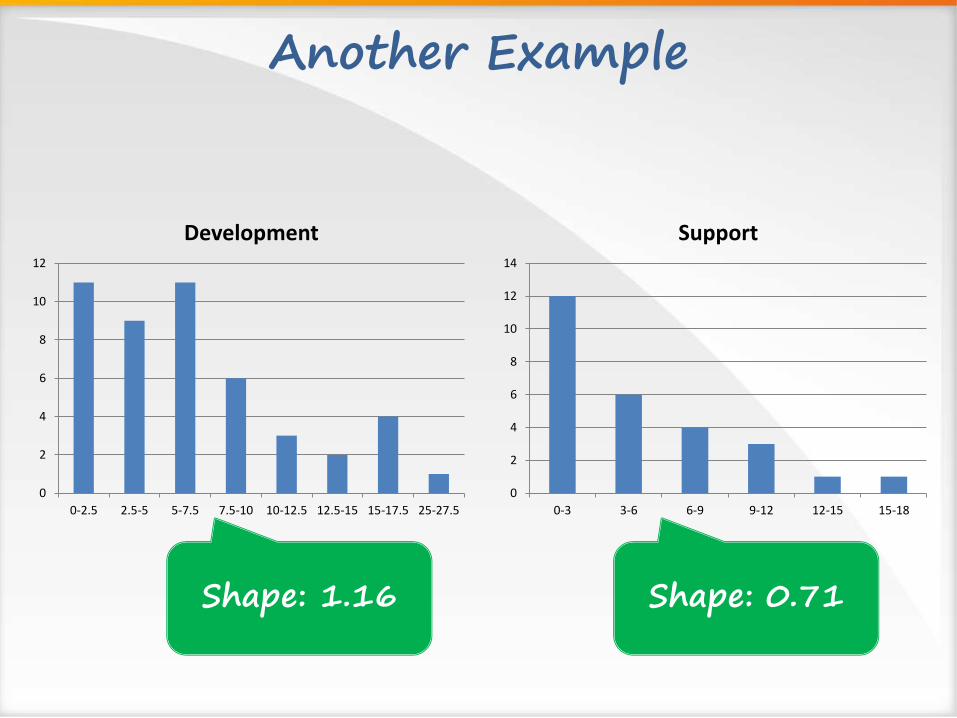
Another Example
0
2
4
6
8
10
12
0-2.5 2.5-5 5-7.5 7.5-10 10-12.5 12.5-15 15-17.5 25-27.5
Development
0
2
4
6
8
10
12
14
0-3 3-6 6-9 9-12 12-15 15-18
Support
Shape: 1.16 Shape: 0.71
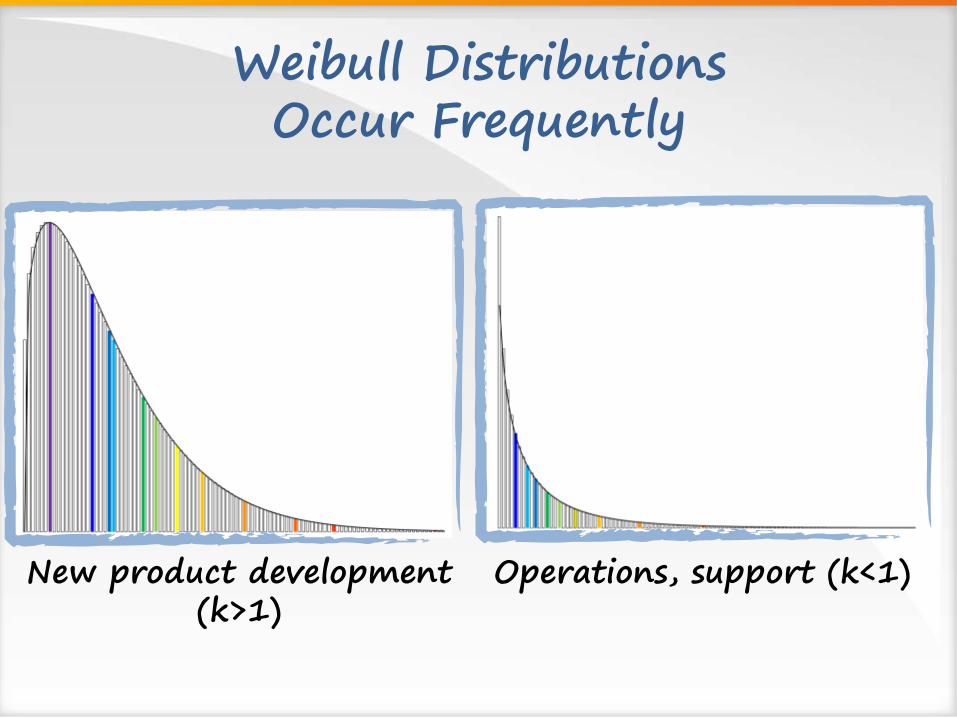
Weibull DistributionsOccur Frequently
Operations, support (k<1)New product development(k>1)
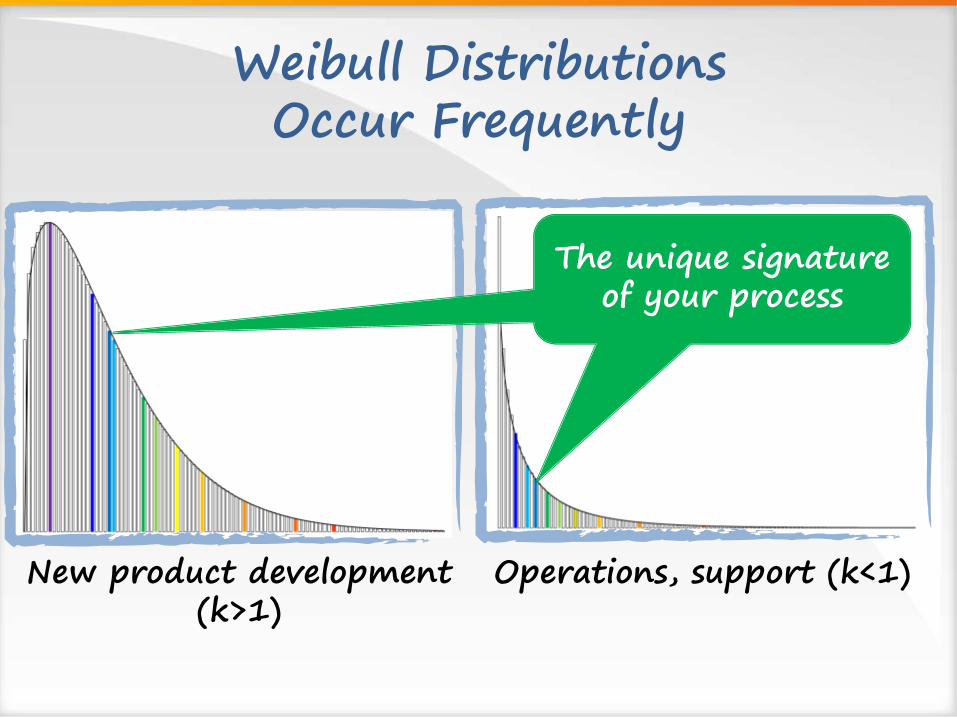
Weibull DistributionsOccur Frequently
Operations, support (k<1)New product development(k>1)
The unique signature of your process
The unique signature of your process

Bias
Feedback
How to “Read” a Distribution
Scale
Control
Expectations
Forecast
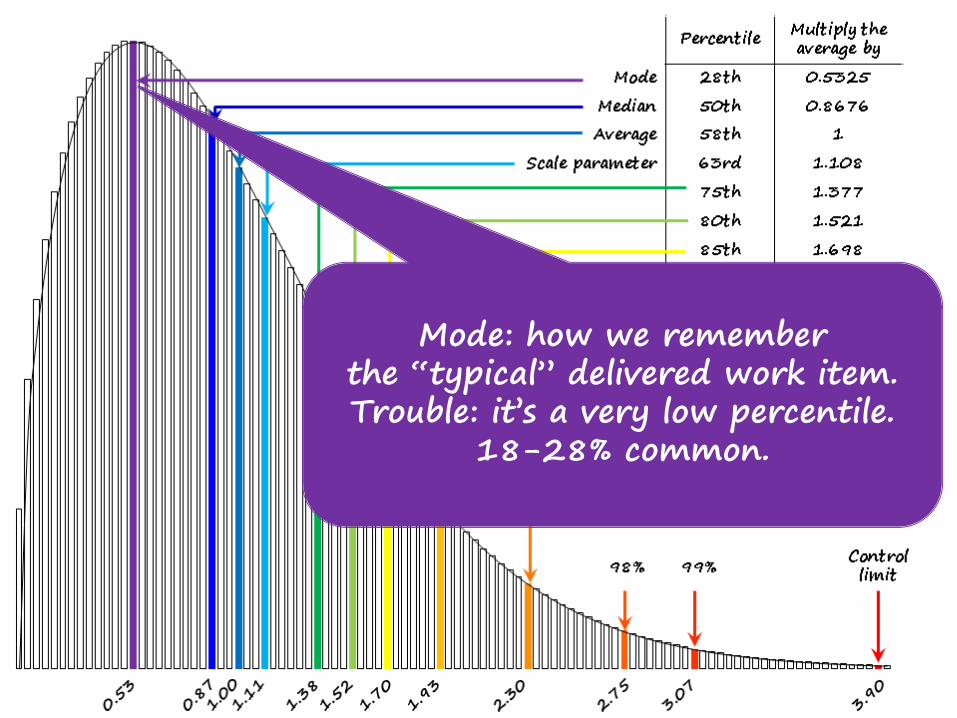
Mode: how we rememberthe “typical” delivered work item.Trouble: it’s a very low percentile.
18-28% common.
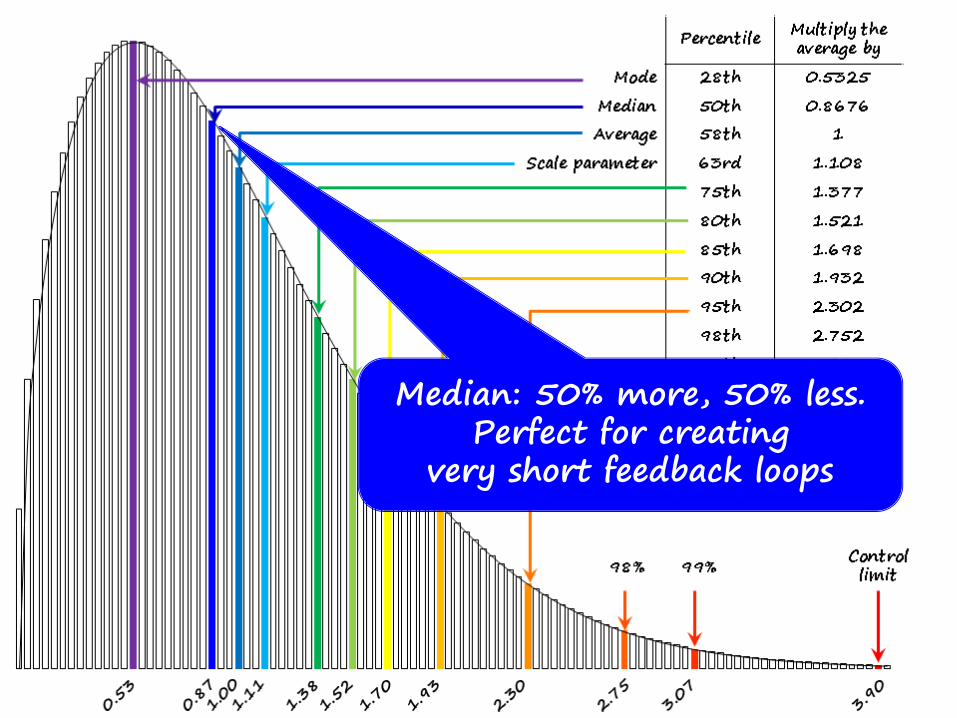
Median: 50% more, 50% less.Perfect for creating
very short feedback loops

Average: we need it for Little’s Law
LeadTime
WIPteDeliveryRa
Little’s Law:handle with care

The 63% percentile isthe best indicator of scale

High percentiles (80th-99th):critical to defining
service-level expectations
High percentiles (80th-99th):critical to defining
service-level expectations
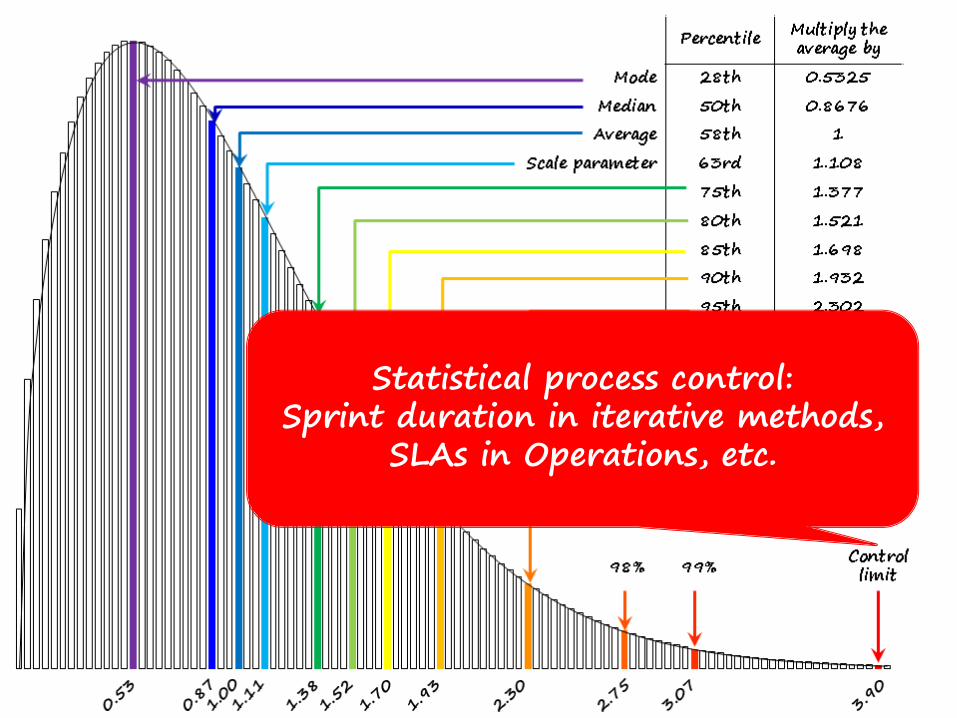
Statistical process control:Sprint duration in iterative methods,
SLAs in Operations, etc.
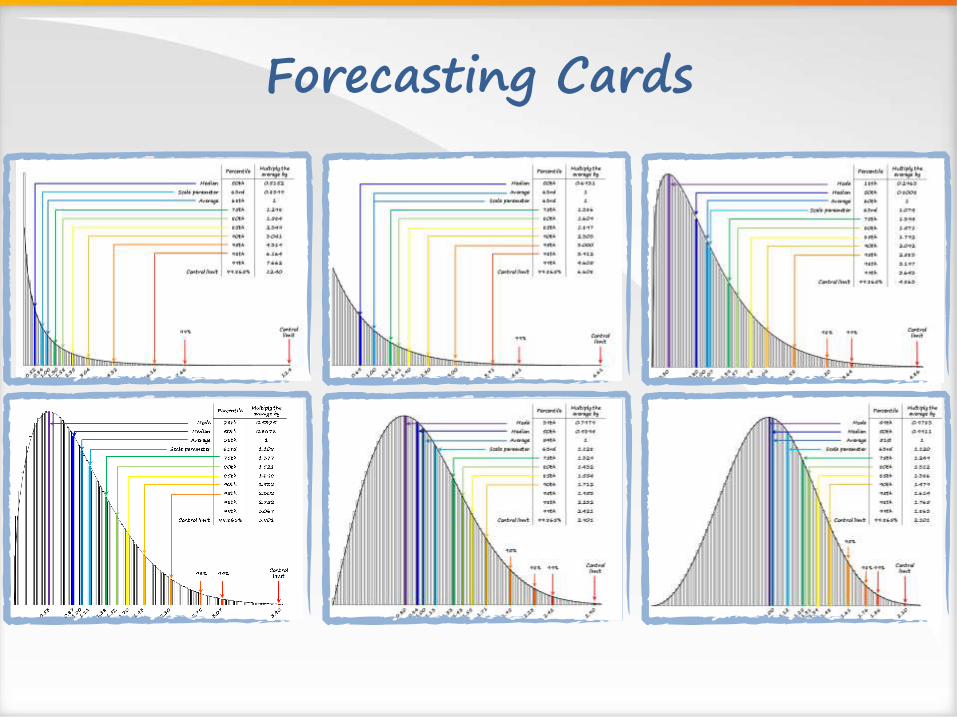
Forecasting Cards
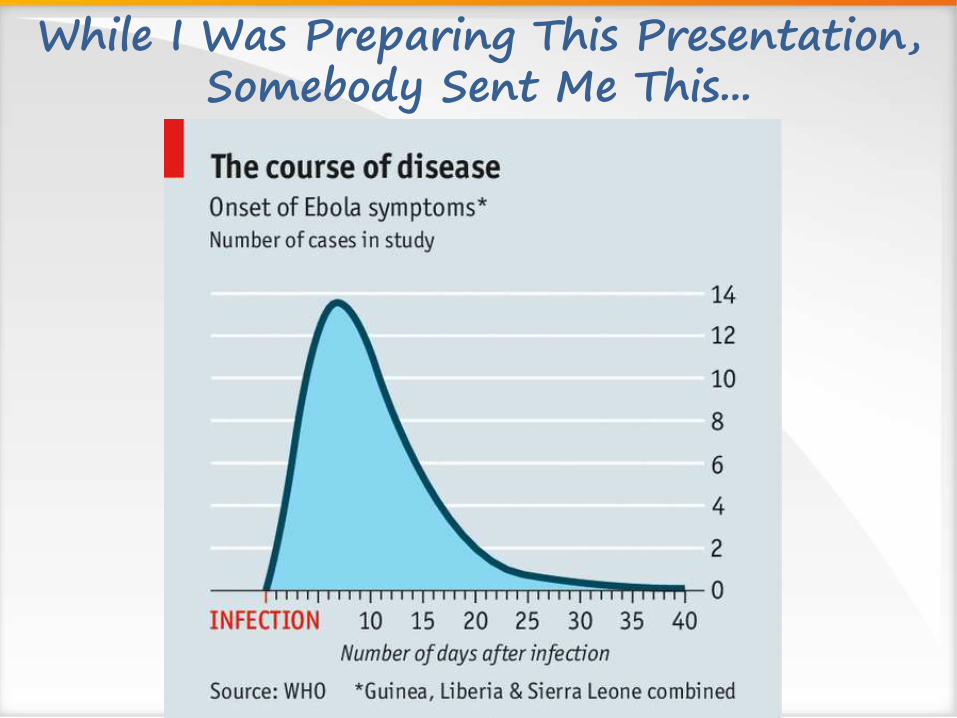
While I Was Preparing This Presentation, Somebody Sent Me This...
Discussion 4:
Probabilistic or Deterministic?
• Would you describe the prevailing approach in
your organization as probabilistic or
deterministic?
• Is the expected answer to “how long will it take?”
a single number?
• Can you instead ask, “when do we need it?” and
“when should we start?”
• Can you make decisions given distributions of
probabilities?

TestReady
S
RQ
P
ON
F
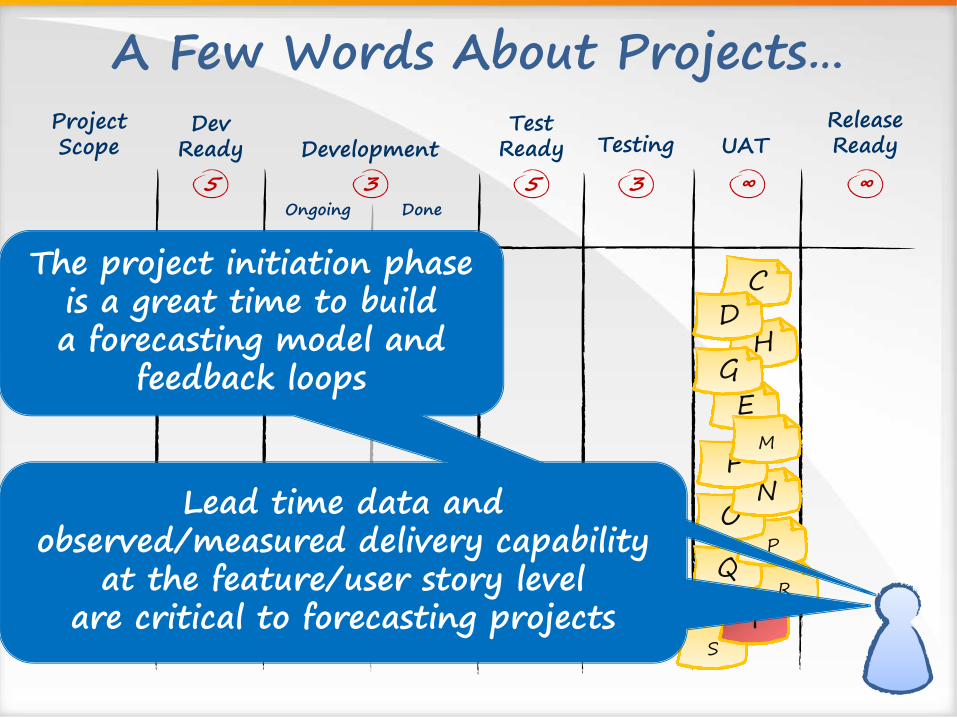
A Few Words About Projects…
E
I
G
D
M
DevReady
5Ongoing
Development Testing
Done
3 35
UATReleaseReady
∞ ∞
ProjectScope
Official training material, used with permission

Delivery Rate
Lead Time
WIP=
Applying Little’s Law
From observed capability
Treat as a fixed variable
Targetto
achieve plan
Calculated based on known lead time
capability & required delivery rate
Determines staffing level
Official training material, used with permission

Delivery Rate
Lead Time
WIP=
Applying Little’s Law
From observed capability
Treat as a fixed variable
Targetto
achieve plan
Calculated based on known lead time
capability & required delivery rate
Determines staffing level
Complicating factors here:Dark matter
“Z-curve effect”Scope creep
Complicating factors here:Variety of work item types and risks
TestReady
S
RQ
P
ON
F
A Few Words About Projects…
E
I
G
D
M
DevReady
5Ongoing
Development Testing
Done
3 35
UATReleaseReady
∞ ∞
ProjectScope
Lead time data andobserved/measured delivery capability
at the feature/user story levelare critical to forecasting projects
The project initiation phase is a great time to builda forecasting model and
feedback loops

New Kanban Book
Mike Burrows
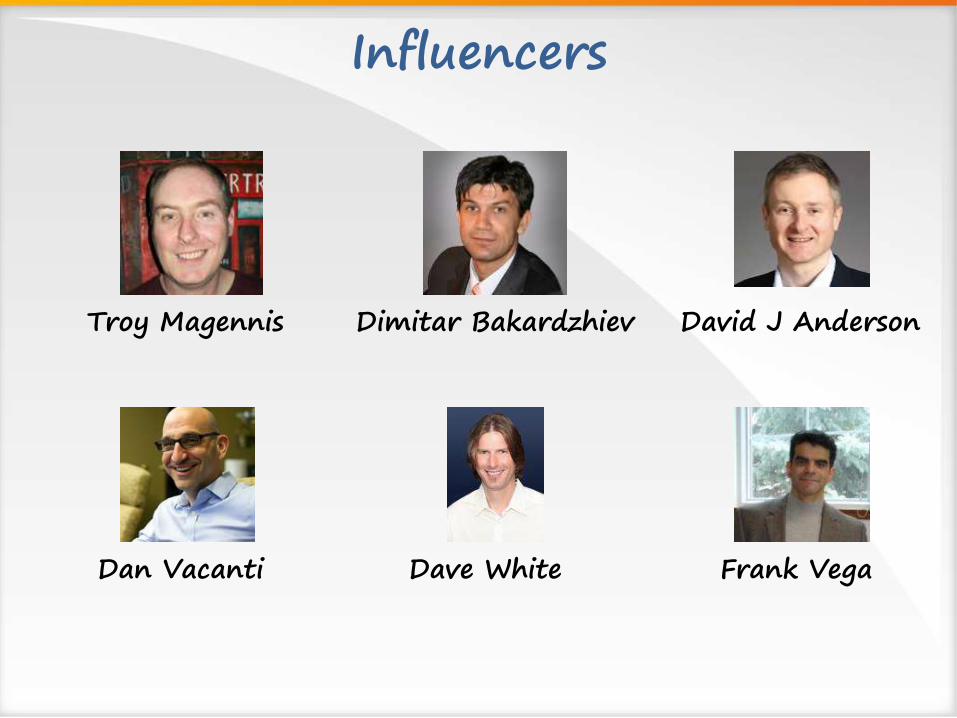
Influencers
Troy Magennis Dimitar Bakardzhiev David J Anderson
Dan Vacanti Dave White Frank Vega

Discussion 5: What Now?
• What new ideas have your learned in this
session today?
• What will you do differently when you return to
your office tomorrow?
