leadership self-efficacy scale. a new multidimensional ... · leadership self-efficacy scale. a new...
TRANSCRIPT

3
LEADERSHIP SELF-EFFICACY SCALE.
A NEW MULTIDIMENSIONAL INSTRUMENT
ANDREA BOBBIO
ANNA MARIA MANGANELLI UNIVERSITY OF PADOVA
The paper presents a new multidimensional scale for measuring Leadership Self-Efficacy (LSE). Six-hundred and ninety-five individuals participated in the study: 372 university students and 323 non-student adults. The research was conducted via a self-administered questionnaire. Exploratory and con-firmatory factor analyses were performed. The final LSE scale is made up of 21 items referring to six correlated dimensions (Starting and leading change processes in groups, Choosing effective followers and delegating responsibilities, Building and managing interpersonal relationships within the group, Showing self-awareness and self-confidence, Motivating people, Gaining consensus of group mem-bers), all loading on a second-order General Leadership Self-Efficacy factor. The LSE scale showed sufficient psychometric properties and stability of the factorial structure in both groups. In order to ob-tain evidence about convergent and discriminant validity of the scale, correlations with General Self-Efficacy, Machiavellianism, Motivation to Lead, past and present leadership experiences were consid-ered. Moreover, gender differences in LSE scores were assessed. Results are presented and discussed.
Key words: Construct-Validity; Gender differences; Leadership; Leadership Self-Efficacy; Structural equation modeling.
Correspondence concerning this article should be addressed to Andrea Bobbio, Dipartimento di Psicologia Generale,
Università degli Studi di Padova, Via Venezia 8, 35131 PADOVA (PD), Italy. E-mail: [email protected]
INTRODUCTION1
The concept of self-efficacy, which is the individual’s belief in the ability to successfully
face specific tasks or situations, was introduced and developed by Bandura (1986), and has been
identified in social-cognitive theory as the most powerful self-regulatory mechanism in affecting
behaviors. Reviewing the results of several studies, Bandura (1997) described effective individu-
als as people who are motivated, resilient to adversity, goal-oriented, and able to think clearly
even under pressure or in stressing conditions. In addition, the more confident an individual is
about being able to successfully perform a task, the more frequently he/she will engage in that
task (Stajkovic & Luthans, 1998).
Leaders, key figures of groups and organizations, are typically described as highly com-
mitted people, perseverant in the face of obstacles, goal-oriented, and able to solve problems in
an efficient, practical, and quick way (Locke et al., 1991; Yukl, 2006). What seems to emerge
from the literature is moreover that leadership roles are generally assumed by people with high
self-efficacy beliefs who are inclined to expend greater efforts to fulfill their leadership roles and
to persevere longer when faced with difficulties (Bandura, 1997; Chemers, Watson, & May,
2000; House & Podsakoff, 1994; Jago, 1982; McCormick, Tanguma, & Sohn, 2002; Murphy,
2001; Yukl, 2006). Even if a universally accepted definition and measurement of leadership still
TPM Vol. 16, No. 1, 3-24 – Spring 2009 – © 2009 Cises

4
TPM Vol. 16, No. 1, 3-24
Spring 2009 © 2009 Cises
Bobbio, A., & Manganelli A. M. Multidimensional Leadership Self-Efficacy
Scale
needs to be found, most leadership classifications “reflect the assumption that it involves a proc-
ess whereby intentional influence is exerted by one person over other people to guide, structure,
and facilitate activity and relationship in a group or organization” (Yukl, 2006, p. 3).
In recent years, the social and economic context has been characterized by widespread
setbacks and relevant changes, seemingly the “ideal” environment to increase the attention of re-
searchers and professionals on leaders’ training and efficacy. Leaders are indeed people who
could instill new ideas, enthusiasm, and “vision” in organizations dealing with the reduced effec-
tiveness of their traditional managing processes (Yukl, 2006).
Starting from these suggestions, our aim was to develop and test a new multidimensional
instrument in order to measure Leadership Self-Efficacy that could be a useful instrument for
both basic and applied research in several contexts.
Leadership Self-Efficacy
Self-Efficacy proved to be a useful motivational process in various domains of human
functioning (Locke, 2003). Furthermore, personality research highlighted the importance of motiva-
tional processes and also ascertained that Self-Efficacy is a central motivational construct for pre-
diction of behaviors (Ng, Ang, & Chan, 2008). Leadership Self-Efficacy (from now on, LSE) could
be defined as a specific form of efficacy beliefs related to leadership behaviors and so it deals with
individual self-efficacy beliefs to successfully accomplish leadership role in groups. In the literature
the studies on LSE are few (e.g., Chemers et al., 2000; Kane, Zaccaro, Tremble, & Masuda, 2002;
Paglis & Green, 2002; Ng et al., 2008). Recently, Ng et al. (2008) showed that, on the one hand,
leaders’ personality traits (i.e., Neuroticism, Extraversion, and Consciousness) were important ante-
cedents of LSE and, on the other, how and when LSE mediated the relationship between personal-
ity traits and leader effectiveness, on the basis of job demands and job autonomy. These results are
very important because they confirm previous theoretical assertions that distal personality traits af-
fect work behavior through proximal motivational mediators (e.g., LSE) (Barrick & Mount, 2005;
Judge, Bono, Remus, & Gerhardt, 2002; Kanfer, 1990); furthermore, they emphasize the role
played by LSE in explaining leadership effectiveness. In this sense, they open the way for several
practical implications in an organizational context concerning, for example, leaders’ selection and
training processes.
One of the most relevant studies for our review on measurement of LSE was conducted
by Paglis and Green (2002), who investigated managers’ motivation to promote and practice a
change-oriented leadership. The aim of their study was to explain differences in managers’ be-
havior in American industries: some managers, in fact, actively seek out new opportunities for
growth and development while some others emphasize balance, stability, and control. Paglis and
Green, starting from Bandura’s (1986, 1997) social cognitive theory, linked leadership and self-
efficacy, and proposed that high self-efficacy managers will be seen by their direct collaborators
as engaging in more leadership attempts, showing high resilience to adversity, and emphasizing
change perspectives. Paglis and Green defined LSE as “a person’s judgment that he or she can
successfully exert leadership by setting a direction for the work group, building a relationship
with followers in order to gain their commitment to change goals, and working with them to
overcome obstacles to change” (2002, p. 217). Accordingly, their study was particularly focused

5
TPM Vol. 16, No. 1, 3-24
Spring 2009 © 2009 Cises
Bobbio, A., & Manganelli A. M. Multidimensional Leadership Self-Efficacy
Scale
on managers’ motivation for attempting the leadership of change. This definition was based on
three of the main leadership tasks in leading change processes, and so LSE here reflects manag-
ers’ judgments of their capabilities for: (1) setting a direction for where the work group should be
headed; (2) gaining followers’ commitment to change goals; and (3) overcoming obstacles stand-
ing in the way of meeting change objectives. These tasks constitute the core part of their model
which is also made up of four groups of LSE antecedents. Such antecedents are important sources
of influence on managers’ LSE judgments and were all measured in the study. They are: (1) indi-
vidual antecedents (e.g., successful experiences in leadership roles, internal locus of control, self-
esteem); (2) subordinates’ antecedents (e.g., cynicism about change, performance characteristics);
(3) superiors’ antecedents (e.g., leadership modeling, coaching behavior); (4) organizational an-
tecedents (e.g., support for change, resource supply, job autonomy). The following assumptions
and predictions completed the model: LSE will be positively related to managers’ attempts to
lead change; managers’ organizational commitment will moderate the relationship between LSE
and leadership attempts, so that this relationship will be stronger for those high in organizational
commitment; perceived crisis will moderate the relationship between LSE and leadership at-
tempts, so that this relationship will be stronger when crisis perceptions are higher.
The model was tested through a questionnaire-based survey which involved 150 manag-
ers and 41 direct collaborators, in a real estate company and in a chemical firm. LSE was meas-
ured with a 12-item scale. In particular, as stated before, the construct tried to capture managers’
convictions that they are able to accomplish the following leadership tasks with their work
groups: (1) setting direction for where the group should be headed (LSE direction-setting, four
items, α = .86); (2) gaining followers’ commitment to change goals (LSE gaining commitment,
four items, α = .92) and (3) overcoming obstacles standing in the way of meeting change objec-
tives (LSE overcoming obstacles, four items, α = .86). A general LSE score was then computed
(LSE total). As expected, positive correlations were found between LSE direction-setting sub-
scale and leadership experiences, locus of control, self-esteem, leadership attempts. Positive cor-
relations were revealed between LSE gaining commitment subscale and locus of control, self-
esteem, subordinates’ abilities, organizational commitment, and leadership attempts. Positive cor-
relations were present between LSE overcoming obstacles subscale and locus of control, self-
esteem, subordinates’ abilities, job autonomy, organizational commitment. Positive correlations
emerged between LSE total and internal locus of control, self-esteem, subordinates’ abilities. In
sum, Paglis and Green (2002) had interesting results confirming the majority of their predictions.
The model proposed is very rich, taking into consideration, as it does, several factors, both indi-
vidual and related to the work context that could influence the efficacy of managerial behavior.
The above mentioned research was criticized by Schruijer and Vansina (2002). Their re-
marks fundamentally regarded the fact that leadership refers to a multilevel relationship between
people and context. From this point of view, they called for a better reconsideration of the com-
plexity involved in leadership dynamics rather than limiting the research focus on an individualis-
tic perspective. In particular, “leader” and “leadership” are not synonymous: the former regards a
particular person enacting a role, while the latter refers to a function which can be but not neces-
sarily is fulfilled by a single person; leader-subordinates relationships are determined not only by
leader’s characteristics: they are processes of reciprocal influence in which followers’ character-
istics play an important role; leadership self-efficacy is an individual characteristic that could not
6
TPM Vol. 16, No. 1, 3-24
Spring 2009 © 2009 Cises
Bobbio, A., & Manganelli A. M. Multidimensional Leadership Self-Efficacy
Scale
be separated from any specific situation. And, finally, the model did not consider some important
variables: among them leader’s cognitive capabilities.
We agree with Schruijer and Vansina’s (2002) remarks, stressing the complexity of lead-
ership dynamics (e.g., the essence of leadership lies in the relation between leader and followers,
and the importance of the situation must be taken into account. For a detailed discussion and test
of multiple level of analysis on leadership issues, see Livi, Kenny, Albright, & Pierro, 2008).
Furthermore, we saw in Paglis and Green’s (2002) work a contribution that could be considered
as too focused on leading change matters. Anyway, as many authors, we sustain that an individu-
alistic or trait-like perspective on leadership issues remains valid (e.g., Goktepe & Schneier,
1989; Ilies, Gerhardt, & Huy, 2004; Judge et al., 2002; Judge, Piccolo, & Remus, 2004; Silver-
thorne, 2001). As an example, Zaccaro (2007) recently proposed a model dealing with how
leader distal attributes (cognitive abilities, personality, motives and values) and proximal attrib-
utes (social appraisal skills, problem solving skills, expertise/tacit knowledge) influence leader
performance. Of course, some of these characteristics are more situation-bound than others. For
example, the contributions of certain leadership skills vary across different situations. Likewise,
expertise and tacit knowledge are even more strongly linked to situational performance require-
ments. Nonetheless, several cognitive, social, and dispositional variables will exert a constant,
stable, and significant influence on leadership, relatively independent of situational factors.
The last work addressed here is by McCormick et al. (2002), whose aim was to use the
LSE construct as a determinant of leadership behavior and so make a distinction between leaders
and non-leaders. Their hypotheses can be summarized in three points: (1) LSE is positively asso-
ciated with the frequency of attempting to assume leadership role; (2) the number of leadership
role experiences is positively associated with leadership self-efficacy; (3) women report a signifi-
cant lower leadership self-efficacy score and significantly fewer leadership experiences than men
of similar age and education level.
All the variables in their empirical study were measured with a self-report structured
questionnaire administered to 223 university students in England. LSE was measured with eight
items proposed by Kane and Baltes (1998). Participants had to rate their ability to: (1) perform
well as a leader in different contexts; (2) motivate group members; (3) build group members’
confidence; (4) develop teamwork; (5) “take change” when necessary; (6) communicate effec-
tively; (7) develop effective task strategies; (8) assess the strength and weakness of the group. A
single leadership self-efficacy score was computed summing item responses. McCormick et al.
(2002) obtained support for all their hypotheses except for the number of leadership experiences
that was not statistically different between male and female students. Regarding the LSE scale
adopted, it should be underlined that the complexity of each leadership function or activity, as
described by each sub dimension, would be better captured by multi-item rather than single-item
measures. Usually, the latter are considered unsound and inadequate representations of psycho-
logical multifaceted constructs (Chan & Drasgow, 2001; Wanous & Hudy, 2001). A similar criti-
cal comment could also be addressed to the LSE scales adopted in the works by Chemers et al.
(2000), Kane et al. (2002), and Ng et al. (2008).
From this background, we can conclude that a new multidimensional LSE scale could be
a useful contribution for scholars and practitioners interested in the connection between self-
efficacy and leadership issues.

7
TPM Vol. 16, No. 1, 3-24
Spring 2009 © 2009 Cises
Bobbio, A., & Manganelli A. M. Multidimensional Leadership Self-Efficacy
Scale
AIMS OF THE STUDY AND HYPOTHESES
The principal aim of the study was to develop a multidimensional LSE scale. Several
sources were taken into consideration in order to generate the initial item pool for the LSE scale
(e.g., Chemers et al., 2000; Ilies et al., 2004; Kane & Baltes, 1998; McCormick et al., 2002; Nor-
thouse, 2001; Paglis & Green, 2002; Pierro, 2004; Schruijer & Vansina, 2002; Yukl, 2006; Zim-
merman & Zahniser, 1991). The purpose was to select and depict the most important leadership
functions and the most crucial leadership competences, which can be summarized in the follow-
ing four broad areas.
The first refers to the responsibility of setting a direction for the group, which is always
attributed to leaders (Yukl, 2006). In this sense, the exercise of leadership is based on processes
like “optimization” and “change,” in order to adapt organizations and groups to the rapidly chang-
ing environment around them and also make them proactive. In particular, a change-oriented
mind-set is what should characterize an effective leadership (Paglis & Green, 2002).
The second area is based on the tradition stemming from Hollander’s (1958) work, which
suggested that both at the beginning and all along their reign, leaders must gain and preserve their
credibility and consensus of the group. This process could be articulated into three domains: le-
gitimacy and authority of the leader based on past experiences; group identification showed by
the leader; leader’s example, values, and beliefs. In synthesis, this area stresses the urgency for
any effective leader to gain and maintain the consensus of group members with his/her concrete
actions, pro-group vision, identification, and beliefs.
The third area includes all those individual characteristics and skills that are generally asso-
ciated with an effective leadership, such as communication skills, social and relational compe-
tences, management competences, self-awareness, and self-confidence. In particular, the abilities to
demonstrate self-awareness, self-confidence, and to effectively master social relationships within
the group are assigned the most important place (Judge et al., 2004; Locke et al., 1991; Northouse,
2001).
Finally, the forth conceptual area refers to the fact that leaders usually propose new ideas,
influence group members, and change their behaviors (Brown, 2000). In this sense, the leader
motivates, inspires, develops the team, gives opportunity to followers, gets people on board for
strategy, shares portions of his/her power. In fact, one of the most important leadership responsi-
bilities is the selection of the best group members for any specific task or situation, in order to
enhance their commitment, make them grow, and get the best possible results (Yukl, 2006).
In order to test the convergent and discriminant validity of LSE, we studied the relation-
ships between LSE and General Self-Efficacy (GSE; Sherer & Adams, 1983), Machiavellianism
(MACH; Christie & Geis, 1970), Motivation to Lead (MTL; Chan & Drasgow, 2001), past and
present leadership experiences, and a measure of leader efficacy. Moreover, correlations with
Social Desirability (Crowne & Marlowe, 1960) were also addressed.
The General Self-Efficacy (GSE) scale is, by definition, a measure not related to any par-
ticular task, and so we expected it to be positively but moderately correlated with LSE, given the
fact that they share the same conceptual background and also because, as we stated before, lead-
ership roles seem to be generally assumed by people with high self-efficacy beliefs. In addition,
since LSE is supposed to be more specific for the leadership field, its correlations with leadership
experience were expected to be higher than those involving the GSE score.

8
TPM Vol. 16, No. 1, 3-24
Spring 2009 © 2009 Cises
Bobbio, A., & Manganelli A. M. Multidimensional Leadership Self-Efficacy
Scale
Machiavellianism (MACH) is a way to conceptualize the use of power and influence, in-
troduced into the psychological literature by Christie and Geis (1970). The Authors, starting from
their interest in factors that determine individual decisions to join political and religious extremist
organizations, focused their attention on the leaders of those groups, trying to figure out the pro-
files of men able to control others. They discovered some characteristics of the “intriguer,” taking
inspiration from “The Prince” by Machiavelli (1513/2004), among which: a relative absence of
emotional participation in interpersonal relationships, independence from conventional morality,
absence of psychopathological traits, low ideological involvement (Galli & Nigro, 1983). Indi-
viduals high in Machiavellianism are characterized by cynicism and manipulation of others and
there is also a lot of evidence confirming that they exploit a wide range of duplicitous tactics to
achieve their self-interest goals (Fehr, Samson, & Paulhus, 1992). Our hypothesis was that Ma-
chiavellianism and LSE would be weakly correlated or independent. This because, considering
oneself to be efficient as a leader, is a personal characteristic based on experiences (Bandura,
1997), and therefore should be independent from any ideological/strategic orientation or way to
conceptualize the use of power.
Motivation to Lead (MTL) is the motivation that supports people in leading others and
looking for leadership positions. Chan and Drasgow (2001) articulated MTL into three dimen-
sions. The first is called Affective-Identity and expresses the fact that people like to lead. Having
high scores in this dimensions is usually associated with agreeableness, extraversion, quest for
success and competition, a high number of past leadership experiences, and self-confidence. The
second dimension, called 2oncalculative, measures motivation to assume leadership roles with-
out any direct advantage or benefit. The third one is called Social-2ormative and reflects peo-
ple’s motivation to occupy leadership roles as a consequence of a sense of responsibility and so-
cial duty. Chan and Drasgow (2001) hypothesized that LSE was positively correlated with all
three MTL dimensions. In three independent samples (Singapore military, Singapore students,
and U.S. students), LSE average correlation coefficients were .57 for Affective-Identity, .26 for
Noncalculative and .35 for Social-Normative. Furthermore, only Affective-Identity and Social-
Normative dimensions predicted LSE scores (average βs equal to .40 and.17, respectively). We
expected to obtain a similar pattern of results in our study.
We were also interested in evaluating if answers to the LSE scale were affected by peo-
ple’s tendencies to give socially desirable answers in order to present themselves under a socially
favorable light (Crowne & Marlowe, 1960). Social desirability is commonly used to corroborate
instrument discriminant validity (Paulhus, 1991): in fact, by administering Social Desirability
scales along with the measure of interest, the researcher expects to obtain low intercorrelation co-
efficients.
Furthermore, we studied the correlations between the LSE scale and three leadership-
related measures, such as leadership efficacy — the degree to which anyone considers himself to
be an effective leader — and number of past and present experiences in leadership roles. Our
hypothesis was that they would be all positively correlated with the LSE scale. Moreover, these
three correlations should be higher when compared to the ones that the same measures exhibit
with the GSE Scale. As we said, LSE is designed to be a more domain-specific measure than
GSE.
Finally, we examined male and female scores. Our prediction was that males would show
a higher level of LSE and leadership experiences compared to females. Indeed, despite the in-

9
TPM Vol. 16, No. 1, 3-24
Spring 2009 © 2009 Cises
Bobbio, A., & Manganelli A. M. Multidimensional Leadership Self-Efficacy
Scale
creasing presence of women in traditionally male roles, leadership is still considered a “man’s
job” (Eagly & Karau, 1991, 2002; McCormick, Tanguma, & Sohn, 2003; Ryan & Haslam, 2005;
Yukl, 2006). The role of gender stereotypes in determining gender differences in assuming lead-
ership roles is totally relevant, as demonstrated by Megargee (1969). In the study the effects of
gender and dominance on the choice of leader in pairs of college students was examined. In each
pair, one member was high-dominant and the other low-dominant, according to their scores on a
previously administered personality measure. In mixed-sex pairs in which the man was high-
dominant, the percentage of men assuming leadership roles was 88%. In contrast, in mixed-sex
pairs in which the man was low-dominant, the high-dominant woman was leader in only 25% of
the dyads. In same-sex pairs, the high-dominant individual emerged as leader in 69% of the
cases. These results were replicated and extended by other researchers (e.g., Carbonell, 1984;
Fleischer & Chertkoff, 1986; Nyquist & Spence, 1986). Apparently, gender stereotypes and im-
plicit role demands may discourage women from assuming leadership roles. All this implies that
women could have low confidence in their leadership abilities and efficacy, and, consequently, a
reduced number of leadership experiences as a result of a pernicious mixture of both external
(i.e., stereotypes) and internal (i.e., personality traits, attributional styles) barriers, mutually rein-
forcing. The importance of the latter has been less explored (McCormick et al., 2002, 2003; Mor-
rison, 1992).
METHOD
Participants
A total of 695 individuals, 372 university students and 323 non-student adults, took part
in the research on a voluntary basis, filling out a structured questionnaire. Everyone was prelimi-
narily told that participation was voluntary without any form of compensation, and that all the
data would be treated confidentially, only for research purposes. Afterwards, participants were
briefly informed about the aim of the study.
The students, all from the University of Padova, were 178 males (47.8%) and 194 fe-
males (52.2%). They were recruited one by one thanks to the co-operation of two graduating stu-
dents in a variety of locations, such as libraries, computer rooms, university canteens, and
classes, after lessons. The majority of them was born in Northern Italy (84.8%; Central Italy =
6.9%; Southern Italy = 8.3%); 51.3% attended the Department of Psychology, 10.6% Engineer-
ing, 10% Humanities, 8.4% Science, 8.1% Law, 7.8% Economics, 2% Medicine, and 1.8% Agri-
culture. Mean age was 22.22 years (SD = 3.32): 22.51 years (SD = 3.22) for males and 21.96
years (SD = 3.41) for females with no difference, t(370) = 1.573, ns.
The adult group was composed of 162 males (50.2%) and 161 females (49.8%). In this
case as well participants were individually contacted by two graduating students. The majority
was born in Northern Italy (83.6%; Central Italy = 5.6%; Southern Italy = 10.8%). Concerning
education, 20.1% had a compulsory school degree; 52.5% a senior high school degree; 23.6%
graduated from university, and 3.8% had a post-graduate degree. As to current jobs, 37.1% were
white-collar workers, 17.6% managers, 17.6% blue-collar workers, 18.6% entrepreneurs, and
9.1% were retired or unemployed at the time of the study. Mean age was 42.1 years (SD = 9.55):

10
TPM Vol. 16, No. 1, 3-24
Spring 2009 © 2009 Cises
Bobbio, A., & Manganelli A. M. Multidimensional Leadership Self-Efficacy
Scale
42.4 years (SD = 9.98) for the male subgroup and 41.8 years (SD = 9.01) for the female sub-
group, t(320) = .554, ns.
Materials
Leadership Self-Efficacy. We developed a 61-item pool on the basis of the relevant litera-
ture and following extended discussion with experts (academics and professionals). The items
were designed in order to cover all the crucial leadership areas previously described. The re-
sponse scale ranged from one 1 = absolutely false to 7 = absolutely true.
General Self-Efficacy. We used the version by Sherer et al. (1982), in the Italian form by
Pierro (1997). The scale is made up of 17 items; the response scale ranged from 1 = strongly dis-
agree to 7 = strongly agree. Examples of items are: “When I make plans, I am certain I can make
them work” and “I feel insecure about my ability to do things” (reversed scoring).
Machiavellianism. We adopted the Mach IV by Christie and Geis (1970), in the Italian
version by Galli and Nigro (1983). It is made up of 20 items, 10 expressing Machiavellian atti-
tudes and 10 expressing anti-Machiavellian attitudes. The response scale ranged from 1 = strongly
disagree to 7 = strongly agree. Examples are: “Never tell anyone the real reason you did some-
thing unless it is useful to do so” and “It is wise to flatter important people.”
Motivation to Lead. Developed by Chan and Drasgow (2001), and validated in the Italian
context by Bobbio and Manganelli Rattazzi (2006), the scale is composed of 27 items, nine for
Affective-Identity MTL (an example is: “Most of the time, I prefer being a leader rather than a
follower when working in a group”), nine for Noncalcultative MTL (e.g., “If I agreed to lead a
group, I would never expect any advantages or special benefits”) and nine for Social-Normative
MTL (e.g., “It is appropriate for people to accept leadership roles or positions when they are
asked”). Items were randomly presented and the response scale ranged from 1 = strongly dis-
agree to 7 = strongly agree.
Social Desirability. We used a 12-items short form of the Marlowe and Crowne scale
(Italian version by Manganelli Rattazzi, Canova, & Marcorin, 2000). As regards the response
scale, it ranged from 1 = absolutely false to 7 = absolutely true. Examples are: “It is sometimes
hard for me to go on with my work, if I am not encouraged” and “I have never deliberately said
something that hurt someone’s feelings.”
Leader Efficacy. We used three items, modified from Paglis and Green’s (2002) work.
The first was: “If you were in a leadership position, how effective do you think you would be as a
leader?,” with the response scale ranging from 1 = not effective to 7 = very effective. The second
was: “To what extent do you think your capacities would fit the requirements of a leadership po-
sition?”. The response scale ranged from 1 = not at all to 7 = very much. The third was: “To what
extent do you think it would be easy for you to succeed in a leadership role?” and the response
scale ranged from 1 = not at all to 7 = very much.
Past and present leadership experiences. We modified two items from Chan (1999). The
first was: “In the past, how often have you occupied leadership positions in groups, associations,
institutions, etc. (e.g., leader in a sport team, coordinator of cultural or political groups, etc.)?”.
The response scale was: 1 = never, 2 = rarely or almost never; 3 = sometimes; 4 = often; 5 = very
often. The second item was: “Please, carefully consider your personal experience – at school, in

11
TPM Vol. 16, No. 1, 3-24
Spring 2009 © 2009 Cises
Bobbio, A., & Manganelli A. M. Multidimensional Leadership Self-Efficacy
Scale
extra-curricular activities or at work, extra-work – and rate the amount of your experiences in
leadership roles in comparison with your peers (e.g., the people of your age), using the scale pro-
posed below.” The response scale was 1 = almost no leadership experience if compared to my
peers; 2 = few leadership experiences if compared to my peers; 3 = an average amount of leader-
ship experiences if compared to my peers; 4 = a number of leadership experiences slightly above
average compared to my peers; 5 = a number of leadership experiences largely above average
compared to my peers. The third and last item, administered only to the adult sample, was: “How
frequently in your current job are you required to assume leadership roles or positions?”. The re-
sponse scale was: 1 = never; 2 = rarely; 3 = sometimes; 4 = often; 5 = very often.
Data Analyses
As regards the LSE scale, exploratory and confirmatory factor analysis (LISREL 8.54)
were performed in the student group, and only confirmatory factor analysis was performed in the
adult group. Preliminarily, the analysis of multivariate normality of item distributions was carried
out through PRELIS 2.54.
Goodness-of-fit was checked using several indexes simultaneously (Bollen, 1989); two
indexes were: χ2 and the ratio between χ2 and degree of freedom (χ
2/df). The former suggests a
good fit when it is not significant; the latter is acceptable if it falls between 1 and 3, especially
when n is high, and very good if it falls between 1 and 2 (Byrne, 1998; Schumaker & Lomax,
1996). It must be noted that the χ2 value strongly depends on the number of cases considered. For
this reason, we adopted further fit indexes that are less sensitive to the sample size: RMSEA
(values equal to or smaller than .08 are considered satisfactory), CFI (values equal or higher than
.95 are indicative of a good fit), SRMR (recommended values are lower than .05). In some analy-
ses we also considered the AIC (Aikaike Information Criterion; Hu & Bentler, 1999; Schermel-
leh-Engel, Moosbrugger, & Müller, 2003).
Finally, we computed composite scores for every scale and subscale, calculated correla-
tion coefficients, and checked the differences between males and females via t-test and multivari-
ate analyses of variance (MANOVAs).
RESULTS
In the student and in the adult group, both skewness and kurtosis for the majority of LSE
items fell between –1.00 and +1.00 (no value was lower than –1.401 or greater than 1.611).
Mardia’s (1970) index of relative multivariate kurtosis, which must vary between –1.96 and
+1.96 to support multivariate normality of data distribution, was acceptable and equal to 1.156
for the student group, and to 1.184 for the adult one. However, the tests for skewness and kurtosis
resulted significant: for the student group, Z = 69.689 (p < .0001) and Z = 26.412 (p < .0001) re-
spectively; for the adult group, Z = 79.763 (p < .0001) and Z = 26.423 (p < .0001) respectively.
Because some of these results indicated that the assumption of multivariate normality could not
be accepted, we carried out confirmatory factor analyses via the robust maximum likelihood
12
TPM Vol. 16, No. 1, 3-24
Spring 2009 © 2009 Cises
Bobbio, A., & Manganelli A. M. Multidimensional Leadership Self-Efficacy
Scale
method, that is considered preferable even for small samples with a non-normal data distribution
(Schermelleh-Engel et al., 2003).
Student Group
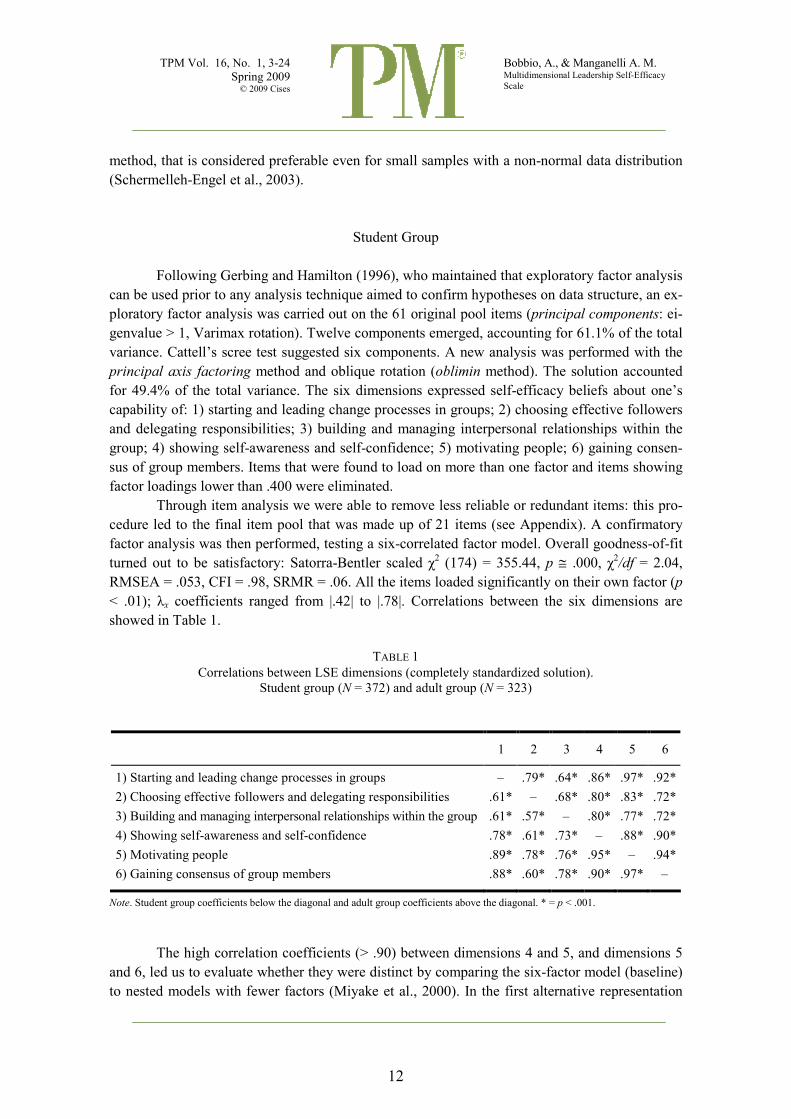
Following Gerbing and Hamilton (1996), who maintained that exploratory factor analysis
can be used prior to any analysis technique aimed to confirm hypotheses on data structure, an ex-
ploratory factor analysis was carried out on the 61 original pool items (principal components: ei-
genvalue > 1, Varimax rotation). Twelve components emerged, accounting for 61.1% of the total
variance. Cattell’s scree test suggested six components. A new analysis was performed with the
principal axis factoring method and oblique rotation (oblimin method). The solution accounted
for 49.4% of the total variance. The six dimensions expressed self-efficacy beliefs about one’s
capability of: 1) starting and leading change processes in groups; 2) choosing effective followers
and delegating responsibilities; 3) building and managing interpersonal relationships within the
group; 4) showing self-awareness and self-confidence; 5) motivating people; 6) gaining consen-
sus of group members. Items that were found to load on more than one factor and items showing
factor loadings lower than .400 were eliminated.
Through item analysis we were able to remove less reliable or redundant items: this pro-
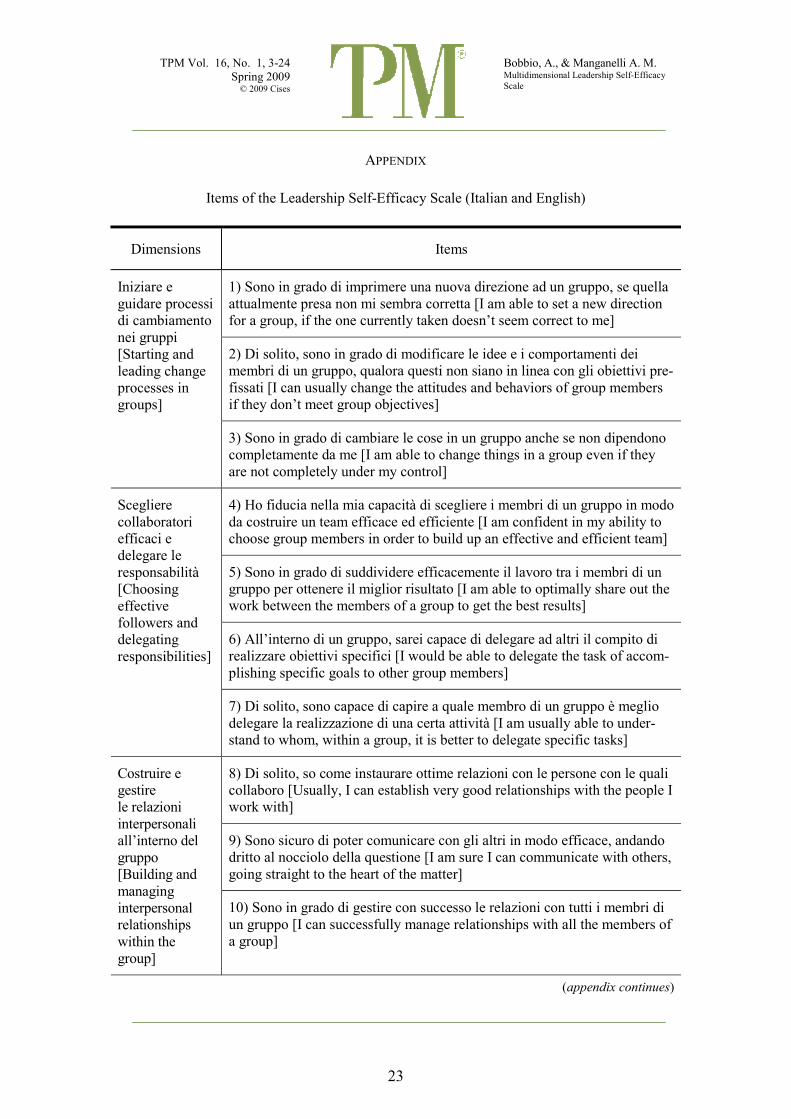
cedure led to the final item pool that was made up of 21 items (see Appendix). A confirmatory
factor analysis was then performed, testing a six-correlated factor model. Overall goodness-of-fit
turned out to be satisfactory: Satorra-Bentler scaled χ2 (174) = 355.44, p ≅ .000, χ
2/df = 2.04,
RMSEA = .053, CFI = .98, SRMR = .06. All the items loaded significantly on their own factor (p
< .01); λx coefficients ranged from |.42| to |.78|. Correlations between the six dimensions are
showed in Table 1.
TABLE 1
Correlations between LSE dimensions (completely standardized solution).
Student group (2 = 372) and adult group (2 = 323)
1 2 3 4 5 6
1) Starting and leading change processes in groups – .79* .64* .86* .97* .92*
2) Choosing effective followers and delegating responsibilities .61* – .68* .80* .83* .72*
3) Building and managing interpersonal relationships within the group .61* .57* – .80* .77* .72*
4) Showing self-awareness and self-confidence .78* .61* .73* – .88* .90*
5) Motivating people .89* .78* .76* .95* – .94*
6) Gaining consensus of group members .88* .60* .78* .90* .97* –
2ote. Student group coefficients below the diagonal and adult group coefficients above the diagonal. * = p < .001.
The high correlation coefficients (> .90) between dimensions 4 and 5, and dimensions 5
and 6, led us to evaluate whether they were distinct by comparing the six-factor model (baseline)
to nested models with fewer factors (Miyake et al., 2000). In the first alternative representation
13
TPM Vol. 16, No. 1, 3-24
Spring 2009 © 2009 Cises
Bobbio, A., & Manganelli A. M. Multidimensional Leadership Self-Efficacy
Scale
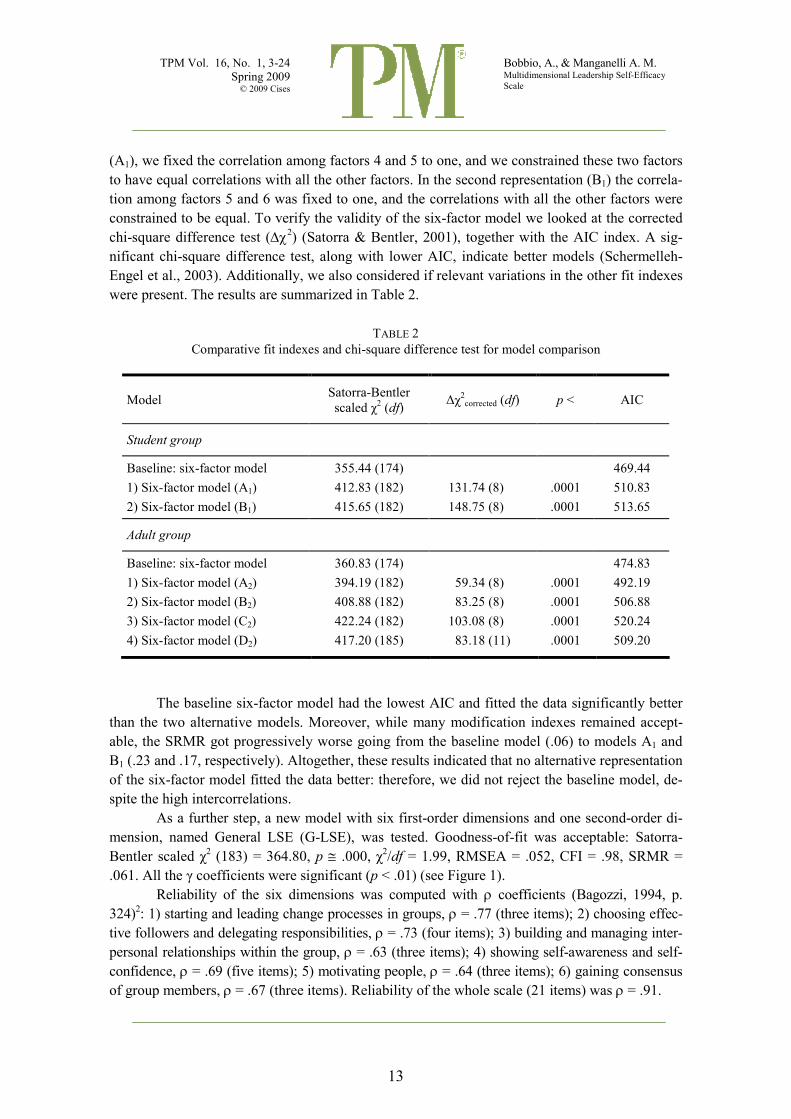
(A1), we fixed the correlation among factors 4 and 5 to one, and we constrained these two factors
to have equal correlations with all the other factors. In the second representation (B1) the correla-
tion among factors 5 and 6 was fixed to one, and the correlations with all the other factors were
constrained to be equal. To verify the validity of the six-factor model we looked at the corrected
chi-square difference test (∆χ2) (Satorra & Bentler, 2001), together with the AIC index. A sig-
nificant chi-square difference test, along with lower AIC, indicate better models (Schermelleh-
Engel et al., 2003). Additionally, we also considered if relevant variations in the other fit indexes
were present. The results are summarized in Table 2.
TABLE 2
Comparative fit indexes and chi-square difference test for model comparison
Model Satorra-Bentler
scaled χ2 (df)
∆χ2
corrected (df) p < AIC
Student group
Baseline: six-factor model 355.44 (174) 469.44
1) Six-factor model (A1) 412.83 (182) 131.74 (8) .0001 510.83
2) Six-factor model (B1) 415.65 (182) 148.75 (8) .0001 513.65
Adult group
Baseline: six-factor model 360.83 (174) 474.83
1) Six-factor model (A2) 394.19 (182) 59.34 (8) .0001 492.19
2) Six-factor model (B2) 408.88 (182) 83.25 (8) .0001 506.88
3) Six-factor model (C2) 422.24 (182) 103.08 (8) .0001 520.24
4) Six-factor model (D2) 417.20 (185) 83.18 (11) .0001 509.20
The baseline six-factor model had the lowest AIC and fitted the data significantly better
than the two alternative models. Moreover, while many modification indexes remained accept-
able, the SRMR got progressively worse going from the baseline model (.06) to models A1 and
B1 (.23 and .17, respectively). Altogether, these results indicated that no alternative representation
of the six-factor model fitted the data better: therefore, we did not reject the baseline model, de-
spite the high intercorrelations.
As a further step, a new model with six first-order dimensions and one second-order di-
mension, named General LSE (G-LSE), was tested. Goodness-of-fit was acceptable: Satorra-
Bentler scaled χ2 (183) = 364.80, p ≅ .000, χ
2/df = 1.99, RMSEA = .052, CFI = .98, SRMR =
.061. All the γ coefficients were significant (p < .01) (see Figure 1).
Reliability of the six dimensions was computed with ρ coefficients (Bagozzi, 1994, p.
324)2: 1) starting and leading change processes in groups, ρ = .77 (three items); 2) choosing effec-
tive followers and delegating responsibilities, ρ = .73 (four items); 3) building and managing inter-
personal relationships within the group, ρ = .63 (three items); 4) showing self-awareness and self-
confidence, ρ = .69 (five items); 5) motivating people, ρ = .64 (three items); 6) gaining consensus
of group members, ρ = .67 (three items). Reliability of the whole scale (21 items) was ρ = .91.

14
TPM Vol. 16, No. 1, 3-24
Spring 2009 © 2009 Cises
Bobbio, A., & Manganelli A. M. Multidimensional Leadership Self-Efficacy
Scale
2ote. The first coefficient concerns the university student group, the second concerns the adult group.
Figure 1 General model of the LSE scale (completely standardized solution).
λ4 2=.61; .73
γ31 =.74; .75
γ41 =.94; .90
γ51 =.98; .97
ξ1 = G-LSE
η2 = LSE Choose &
Delegate
η5 = LSE Motivate
η6 = LSE Consensus
γ21 =.67; .80
λ1 1=.78; .76
λ2 1=.70; .72
λ3 1=.71; .68
λ5 2=.63; .67
λ6 2=.64; .69
λ7 2=.68; .66
λ8 3=.64; .52
λ9 3=.46; .70
λ10 3=.69; .71
λ11 4=.42; .48
λ12 4=.62; .60
λ13 4=.62; .74
λ14 4=.48; .64
λ15 4=.63; .68
λ16 5=.56; .60
λ17 5=.67; .76
λ18 5=.61; .73
λ19 6=.54; .56
λ20 6=.69; .79
λ21 6=.69; .79
y1
y3
y2
y4
y6
y5
y7
y8
y10
y9
y11
y13
y12
y14
y15
y19
y21
y20
y16
y18
y17
ε1=.39; .42
ε2=.51; .48
ε3=.50; .53
ε4=.63; .47
ε5=.61; .55
ε7=.54; .56
ε8=.59; .72
ε6=.59; .52
ε9=.79; .51
ε11=.82; .77
ε10=.52; .61
ε12=.62; .64
ε16=.69; .63
ε17=.55; .42
ε18=.63; .47
ε13=.62; .46
ε14=.77; .60
ε15=.60; .54
ε20=.53; .38
ε21=.52; .38
ε19=.71; .69
ζ6=.10; .03
ζ1=.29; .04
ζ2=.55; .35
ζ3=.45; .44
ζ4=.08; .18
ζ5=.06; .03
η1 = LSE Change
η3 = LSE Relationships
γ11 =.85; .96
γ61 =.95; .97
η4 = LSE Self-Confidence
15
TPM Vol. 16, No. 1, 3-24
Spring 2009 © 2009 Cises
Bobbio, A., & Manganelli A. M. Multidimensional Leadership Self-Efficacy
Scale
Adult Group
The goodness-of-fit of the six-factor model and 21 observed variables was tested on the
adult group obtaining acceptable results: Satorra-Bentler scaled χ2 (174) = 360.83, p ≅ .000, χ
2/df
= 2.07, RMSEA = .058, CFI = .98, SRMR = .060. All the λx coefficients were significant (p <
.01) and ranged from |.50| to |.79|. Correlations between the six dimensions are presented in Table
1.
Again, the high correlation coefficients (> .90) between dimensions 1 and 5, dimensions
1 and 6, and dimensions 5 and 6, led us to compare the six-factor model to nested models, fol-
lowing the same steps previously described.
In the first alternative representation (A2), we fixed the correlation among factors 1 and 5
to one, and constrained these two factors to have equal correlations with all the other factors. Af-
terward, with the same procedure and constrains, we tested the 1-6 (B2), 5-6 (C2), and 1-5-6 (D2)
alternative representations. The results are summarized in Table 2.
The baseline model had again the lowest AIC and fitted the data significantly better than
all the alternative models. Many modification indexes remained acceptable for all the alternative
models specified, but again the SRMR got progressively worse going from the baseline model
(.06) to models A2-D2 (.18, .20, .24, and .23, respectively). In sum, no alternative representation
of the six-factor model fitted the data better: therefore, the baseline model could not be rejected,
albeit the high inter-correlations.
Finally, the data-fit of the second-order model was checked with satisfactory results:
Satorra-Bentler scaled χ2 (183) = 399.36, p ≅ .000, χ
2/df = 2.18, RMSEA = .061, CFI = .98,
SRMR = .064. All the γ coefficients were significant (p < .01) (see Figure 1).3
Reliability coefficients (ρ) were as follows: 1) starting and leading change processes in
groups, ρ = .77 (three items); 2) choosing effective followers and delegating responsibilities, ρ =
.79 (four items); 3) building and managing interpersonal relationships within the group, ρ = .65
(three items); 4) showing self-awareness and self-confidence, ρ = .77 (five items); 5) motivating
people, ρ = .74 (three items); 6) gaining consensus of group members, ρ = .76 (three items). Reli-
ability of the whole scale (21 items) was ρ = .94.
Composite Scores and Gender Differences
Reliability coefficients, all satisfactory, for all the measures included in the questionnaire
are summarized in Table 3 and 4. We calculated composite scores for students and adults and ex-
amined differences between males and females within each group. In the case of LSE and MTL
we conducted multivariate analysis of variance (MANOVA), with gender as between-participant
factor; in all the other cases the t-test was used. Results of univariate effects (MANOVA) and t-
tests are showed in Table 3 and 4.
In the case of students the only significant difference regarded Machiavellianism, which
was higher for males. The multivariate effect for MTL was nonsignificant, F(3, 368) = 2.485, p <
.06, ηp2
= .02, just like the multivariate effect for LSE, F(6, 365) = 1.014, n.s., ηp2
= .02. Never-
theless, it should be noted that the univariate effect for Noncalculative dimension of MTL was
16
TPM Vol. 16, No. 1, 3-24
Spring 2009 © 2009 Cises
Bobbio, A., & Manganelli A. M. Multidimensional Leadership Self-Efficacy
Scale
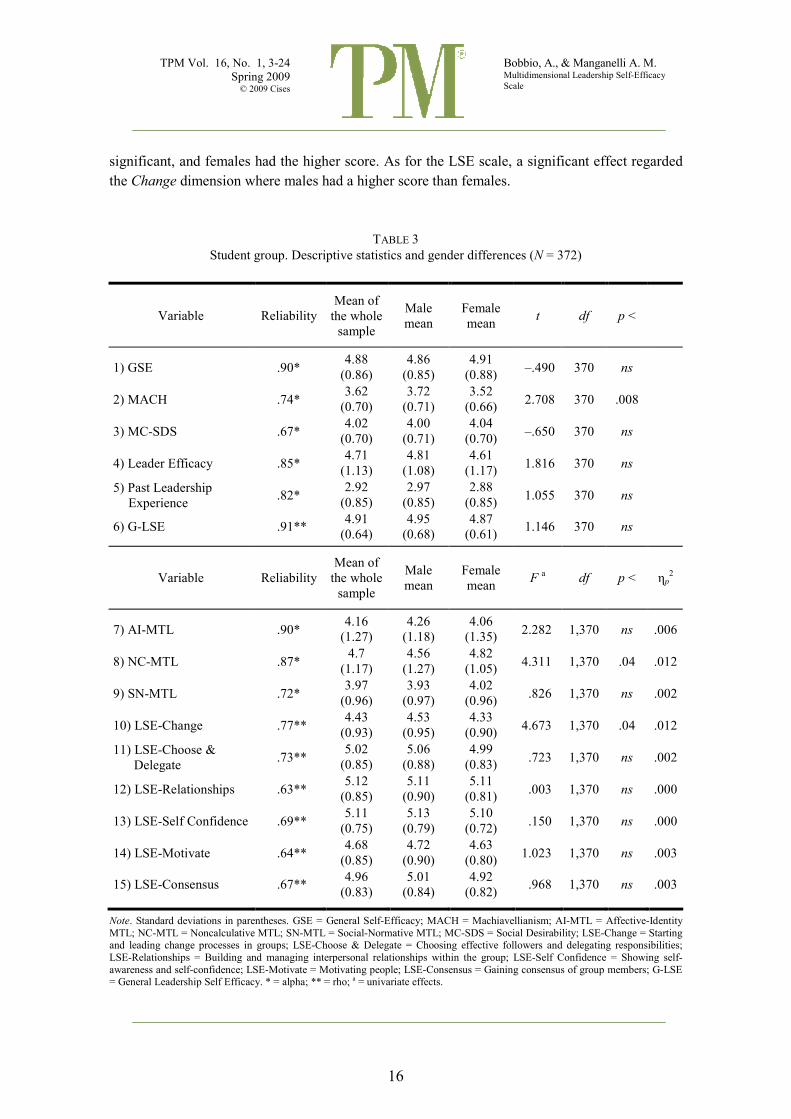
significant, and females had the higher score. As for the LSE scale, a significant effect regarded
the Change dimension where males had a higher score than females.
TABLE 3
Student group. Descriptive statistics and gender differences (2 = 372)
Variable Reliability
Mean of
the whole
sample
Male
mean
Female
mean t df p <
1) GSE .90* 4.88
(0.86)
4.86
(0.85)
4.91
(0.88) –.490 370 ns
2) MACH .74* 3.62
(0.70)
3.72
(0.71)
3.52
(0.66) 2.708 370 .008
3) MC-SDS .67* 4.02
(0.70)
4.00
(0.71)
4.04
(0.70) –.650 370 ns
4) Leader Efficacy .85* 4.71
(1.13)
4.81
(1.08)
4.61
(1.17) 1.816 370 ns
5) Past Leadership
Experience .82*
2.92
(0.85)
2.97
(0.85)
2.88
(0.85) 1.055 370 ns
6) G-LSE .91** 4.91
(0.64)
4.95
(0.68)
4.87
(0.61) 1.146 370 ns
Variable Reliability
Mean of
the whole
sample
Male
mean
Female
mean F
a df p < ηp
2
7) AI-MTL .90* 4.16
(1.27)
4.26
(1.18)
4.06
(1.35) 2.282 1,370 ns .006
8) NC-MTL .87* 4.7
(1.17)
4.56
(1.27)
4.82
(1.05) 4.311 1,370 .04 .012
9) SN-MTL .72* 3.97
(0.96)
3.93
(0.97)
4.02
(0.96) .826 1,370 ns .002
10) LSE-Change .77** 4.43
(0.93)
4.53
(0.95)
4.33
(0.90) 4.673 1,370 .04 .012
11) LSE-Choose &
Delegate .73**
5.02
(0.85)
5.06
(0.88)
4.99
(0.83) .723 1,370 ns .002
12) LSE-Relationships .63** 5.12
(0.85)
5.11
(0.90)
5.11
(0.81) .003 1,370 ns .000
13) LSE-Self Confidence .69** 5.11
(0.75)
5.13
(0.79)
5.10
(0.72) .150 1,370 ns .000
14) LSE-Motivate .64** 4.68
(0.85)
4.72
(0.90)
4.63
(0.80) 1.023 1,370 ns .003
15) LSE-Consensus .67** 4.96
(0.83)
5.01
(0.84)
4.92
(0.82) .968 1,370 ns .003
2ote. Standard deviations in parentheses. GSE = General Self-Efficacy; MACH = Machiavellianism; AI-MTL = Affective-Identity
MTL; NC-MTL = Noncalculative MTL; SN-MTL = Social-Normative MTL; MC-SDS = Social Desirability; LSE-Change = Starting and leading change processes in groups; LSE-Choose & Delegate = Choosing effective followers and delegating responsibilities;
LSE-Relationships = Building and managing interpersonal relationships within the group; LSE-Self Confidence = Showing self-
awareness and self-confidence; LSE-Motivate = Motivating people; LSE-Consensus = Gaining consensus of group members; G-LSE = General Leadership Self Efficacy. * = alpha; ** = rho; a = univariate effects.
17
TPM Vol. 16, No. 1, 3-24
Spring 2009 © 2009 Cises
Bobbio, A., & Manganelli A. M. Multidimensional Leadership Self-Efficacy
Scale
TABLE 4
Adult group. Descriptive statistics and gender differences (2 = 323). Univariate effects
Variable alpha
Mean of
the whole
sample
Male
mean
Female
mean t df p <
1) GSE .88* 5.12
(0.85)
5.21
(0.76)
5.03
(0.93) 1.60 321 ns
2) MACH .73* 3.40
(0.70)
3.43
(0.75)
3.36
(0.65) .892 321 ns
3) MC-SDS .74* 4.40
(0.78)
4.35
(0.80)
4.45
(0.76) –1.116 321 ns
4) Leader Efficacy .87* 4.72
(1.24)
5.16
(0.98)
4.29
(1.32) 6.730 321 .0001
5) Past Leadership
Experience .80*
3.00
(0.95)
3.28
(0.92)
2.73
(0.90) 5.426 321 .0001
6) Present Leadership
Experience ‡
–
3.20
(1.12)
3.54
(1.06)
2.85
(1.07) 5.870 321 .0001
7) G-LSE .94** 5.10
(0.71)
5.26
(0.67)
4.95
(0.72) 4.019 321 .0001
Variable alpha
Mean of
the whole
sample
Male
mean
Female
mean F
a df p < ηp
2
8) AI-MTL .84* 4.25
(1.26)
4.65
(1.17)
3.85
(1.23) 35.43 1,321 .0001 .10
9) NC-MTL .85* 4.96
(1.19)
4.76
(1.25)
5.16
(1.10) 8.92 1,321 .004 .03
10) SN-MTL .74* 4.22
(0.96)
4.37
(0.94)
4.07
(0.95) 7.99 1,321 .006 .024
11) LES-Change .77** 4.59
(0.96)
4.83
(0.86)
4.35
(0.99) 21.482 1,321 .001 .06
12) LES-Choose & Delegate .79** 5.13
(0.92)
5.27
(0.85)
4.98
(0.95) 8.282 1,321 .005 .025
13) LES-Relationships .65** 5.29
(0.84)
5.29
(0.78)
5.20
(0.90) .866 1,321 ns .003
14) LSE-Self Confidence .77** 5.31
(0.79)
5.44
(0.72)
5.18
(0.84) 8.716 1,321 .004 .03
15) LSE-Motivate .74** 5.01
(0.92)
5.19
(0.88)
4.84
(0.93) 12.113 1,321 .002 .04
16) LSE-Consensus .76** 5.16
(0.90)
5.39
(0.82)
4.94
(0.92) 16.425 1,321 .001 .06
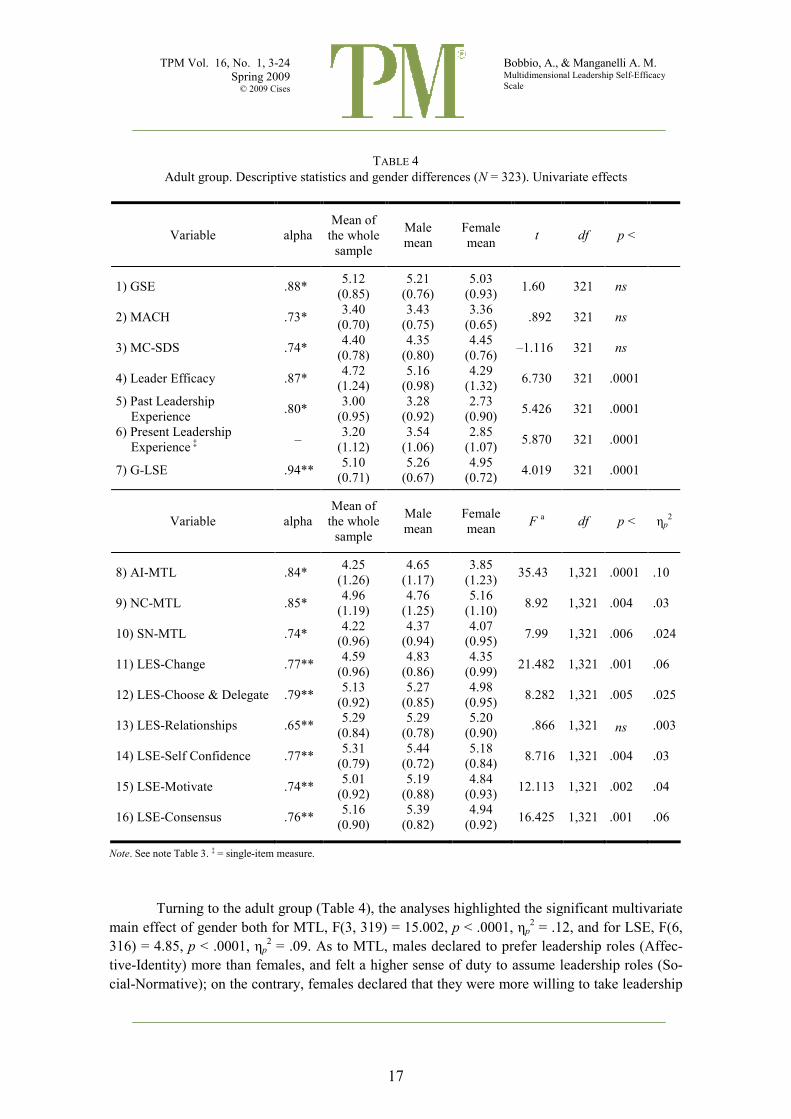
2ote. See note Table 3. ‡ = single-item measure.
Turning to the adult group (Table 4), the analyses highlighted the significant multivariate
main effect of gender both for MTL, F(3, 319) = 15.002, p < .0001, ηp2 = .12, and for LSE, F(6,
316) = 4.85, p < .0001, ηp2 = .09. As to MTL, males declared to prefer leadership roles (Affec-
tive-Identity) more than females, and felt a higher sense of duty to assume leadership roles (So-
cial-Normative); on the contrary, females declared that they were more willing to take leadership
18
TPM Vol. 16, No. 1, 3-24
Spring 2009 © 2009 Cises
Bobbio, A., & Manganelli A. M. Multidimensional Leadership Self-Efficacy
Scale
responsibilities even without benefits or rewards (Noncalculative) than males. Regarding the LSE
scale, males generally had higher scores than females and consequently a higher General LSE
score (G-LSE). No differences emerged between the two groups only for the LSE-Relationships
dimension, that expresses individual confidence in building and managing interpersonal relation-
ships within a group. Furthermore, males saw themselves as very effective leaders (leader effi-
cacy) and, particularly, claimed to have had and to currently have a greater amount of leadership
experiences (past leadership experience and present leadership experience).4
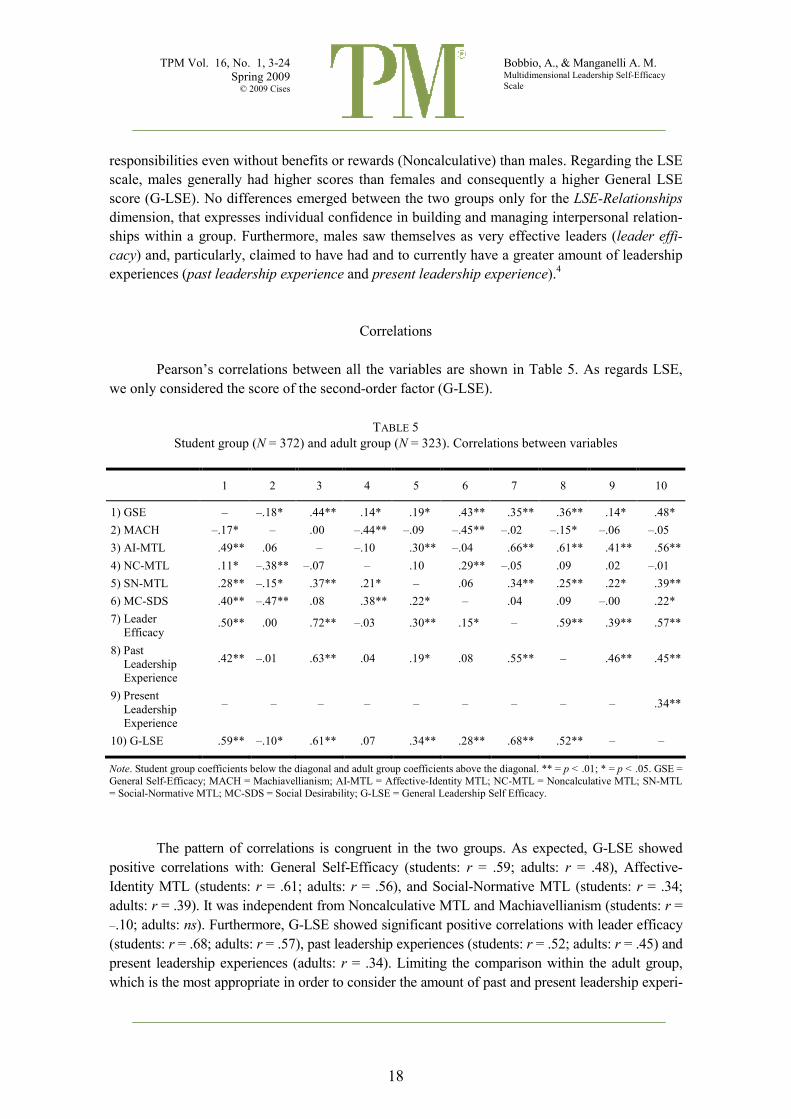
Correlations
Pearson’s correlations between all the variables are shown in Table 5. As regards LSE,
we only considered the score of the second-order factor (G-LSE).
TABLE 5
Student group (2 = 372) and adult group (2 = 323). Correlations between variables
1 2 3 4 5 6 7 8 9 10
1) GSE – –.18* .44** .14* .19* .43** .35** .36** .14* .48*
2) MACH –.17* – .00 –.44** –.09 –.45** –.02 –.15* –.06 –.05
3) AI-MTL .49** .06 – –.10 .30** –.04 .66** .61** .41** .56**
4) NC-MTL .11* –.38** –.07 – .10 .29** –.05 .09 .02 –.01
5) SN-MTL .28** –.15* .37** .21* – .06 .34** .25** .22* .39**
6) MC-SDS .40** –.47** .08 .38** .22* – .04 .09 –.00 .22*
7) Leader
Efficacy .50** .00 .72** –.03 .30** .15* – .59** .39** .57**
8) Past
Leadership
Experience
.42** –.01 .63** .04 .19* .08 .55** – .46** .45**
9) Present
Leadership
Experience
– – – – – – – – – .34**
10) G-LSE .59** –.10* .61** .07 .34** .28** .68** .52** – –
2ote. Student group coefficients below the diagonal and adult group coefficients above the diagonal. ** = p < .01; * = p < .05. GSE =
General Self-Efficacy; MACH = Machiavellianism; AI-MTL = Affective-Identity MTL; NC-MTL = Noncalculative MTL; SN-MTL
= Social-Normative MTL; MC-SDS = Social Desirability; G-LSE = General Leadership Self Efficacy.
The pattern of correlations is congruent in the two groups. As expected, G-LSE showed
positive correlations with: General Self-Efficacy (students: r = .59; adults: r = .48), Affective-
Identity MTL (students: r = .61; adults: r = .56), and Social-Normative MTL (students: r = .34;
adults: r = .39). It was independent from Noncalculative MTL and Machiavellianism (students: r =
–.10; adults: ns). Furthermore, G-LSE showed significant positive correlations with leader efficacy
(students: r = .68; adults: r = .57), past leadership experiences (students: r = .52; adults: r = .45) and
present leadership experiences (adults: r = .34). Limiting the comparison within the adult group,
which is the most appropriate in order to consider the amount of past and present leadership experi-
19
TPM Vol. 16, No. 1, 3-24
Spring 2009 © 2009 Cises
Bobbio, A., & Manganelli A. M. Multidimensional Leadership Self-Efficacy
Scale
ences, the GSE score showed to be less correlated with the leader efficacy measure (.35 vs. .57, z =
3.5, p < .004), and the present leadership experiences (.36 vs. .45, z = 2.75, p < .006), when com-
pared with the G-LSE score. The correlations of GSE and G-LSE with past leadership experiences
were not statistically different (.14 vs. .34, z = 1.25). These results gave support to the fact that the
LSE scale was more focused on the leadership domain than the GSE scale.
Finally, G-LSE was moderately correlated with Social Desirability (students: r = .28;
adults: r = .22) and, interestingly, these correlations were significantly lower than the ones be-
tween GSE and Social Desirability (students: r = .40, z = 1.78, p < .04; adults: r = .43, z = 3.09, p
< .001).
DISCUSSION
The research aimed to develop a multidimensional LSE scale. The LSE scale is made up
of 21 items referring to six first-order dimensions, highly correlated but distinct. The six dimen-
sions successfully express what we have tried to identify as the core parts of an effective leader-
ship: a change-oriented mind-set, the ability to choose followers and delegate responsibilities in
order to get things done, some key personal abilities related to communication and management
of interpersonal relationships, self-awareness, self-confidence, and motivation topics, and finally
the leader’s attention toward preserving and gaining, even strategically, consensus and thus the
support of group members. As regards the gaining consensus of group members dimension in
particular, which is rooted in the socio-psychological research tradition stemming from Hol-
lander’s (1958) work, our scale attempted to introduce an original contribution to the Leadership
Self-Efficacy research domain. The results of the second-order factor analysis also legitimate the
use of a general measure of LSE. Furthermore, the factorial structure and reliability coefficients
resulted similar in both groups of participants and all the main hypotheses regarding validity of
the LSE scale were supported.
Gender differences regarding leadership experiences and leadership self-efficacy emerged
only within the adult group, where men showed higher self-reported scores than women. We be-
lieve that this finding is relevant since it is consistent with the literature on gender stereotypes. Ad-
ditionally, it is coherent with the assumptions of the self-efficacy theory (Bandura, 1997) which
states that self-efficacy expectations are widely based on (individual and vicarious) experience.
Limitations of our study include sample recruitment procedure and composition, reliance
on self-report data, and the accompanying risk of inflated correlations due to method variance.
Although these limitations are fairly widespread in the field of research in psychology, its impact
could be lessened by extending the research to different populations and seeing how the results
tally. Item wording could be improved in future studies and new items could also be developed,
especially regarding those dimensions which showed barely acceptable reliability coefficients
(around or lower than .70).
The relationships between LSE and other measures could be the subject of further stud-
ies. Among them, as an example, those belonging to the tradition of managerial effectiveness
(e.g., MSAI, Management Skills Assessment Instrument; Cameron & Quinn, 1999). Finally, the
analysis of the predictive validity of the LSE scale, in real situations or in the laboratory with arti-
ficial group tasks is needed.

20
TPM Vol. 16, No. 1, 3-24
Spring 2009 © 2009 Cises
Bobbio, A., & Manganelli A. M. Multidimensional Leadership Self-Efficacy
Scale
In conclusion, the multidimensional LSE scale presented here is a useful instrument for
researchers and practitioners, in the fields of social, personality, work and organizational psy-
chology. We foresee an immediate and practical use of the LSE scale in leaders’ selection, as-
sessment, and training programs in organizational settings. Furthermore, the scale could be used
for the selection of participants in laboratory experiments on leadership dynamics.
ACKNOWLEDGMENTS
The Authors wish to thank Alberto Cigana for his contribution to the early development of this work and Chiara Bertola, Francesca Michielin, Silvia Prati, and Claudia Todesco for their support in collecting the data.
NOTES
1. The research was funded by the Italian Ministry for University and Scientific Research (MIUR) (grants
code 60A17-9000/04 and code CPDR064981/06). Portions of this paper were presented at “Studying Leadership: 3
rd International Workshop”, Centre for Leadership Studies, University of Exeter (UK),
December 15-16, 2004. 2. Obtained via the (Σλi)
2/[(Σλi)
2 +
Σθi] formula, in which λi is the loading of item i, θi is the error variance
corresponding to λi, and the standardized solution is assumed. This coefficient is very close to Cron-bach’s alpha; however, it weighs items with the respective loadings.
3. The results of a multigroup analysis (Byrne, 1998) comparing adult and student groups indicated in-variance of factor structure, λ, γ and ε coefficients.
4. With reference to the adult group, we examined the effect of the level of education (recoded into three categories: primary school, 2 = 63; junior and senior high school, 2 = 165; graduate or higher, 2 = 86) via a 2 (gender) X 3 (education) analysis of variance (ANOVA) on the following variables: past leader-ship experiences, present leadership experiences, G-LSE score. Apart from the expected gender effect, we found a main effect of education for past leadership experiences: people with a lower level of edu-cation declared less leadership experiences in comparison with people with a higher level of education, F(2, 308) = 10.67, p < .0001. Interactions were nonsignificant.
REFERENCES
Bagozzi, R. P. (1994). Structural equation modeling in marketing research: Basic principles. In R. P.
Bagozzi (Ed), Principles of marketing research (pp. 317-385). Oxford, UK: Blackwell Publishers. Bandura, A. (1986). Social foundations of thought and action: a social cognitive theory. Prentice Hall, NJ:
Englewood Cliffs. Bandura, A. (1997). Self-efficacy: The exercise of control. New York: Freeman. Barrick, M. R., & Mount, M. K. (2005). Yes, personality matters: Moving on to more important matters.
Human Performance, 18, 359-372. Bobbio, A., & Manganelli Rattazzi, A. M. (2006). A contribution to the validation of the “Motivation to
Lead” Scale. A research in the Italian context. Leadership, 2, 117-129. Bollen K. A. (1989). Structural equations with latent variables. New York: John Wiley & Sons. Brown, R. (2000). Group processes: Dynamics within and between groups (2
nd ed.). Oxford, UK: Black-
well. Byrne, B. M. (1998). Structural equation modeling with LISREL, PRELIS and SIMPLIS: Basic concepts,
applications and programming. London-New Jersey: Lawrence Erlbaum Associated Inc. Cameron, K. S., &. Quinn, R. E. (1999). Diagnosing and changing organizational culture. New York: Ad-
dison-Welsey Publishing Company Inc. Carbonell, J. (1984). Sex roles and leadership revisited. Journal of Applied Psychology, 69, 44-49. Chan, K.Y. (1999). Toward a theory of individual differences and leadership: Understanding the motiva-
tion to lead. Unpublished PhD Thesis, University of Illinois at Urbana-Champaign, USA.

21
TPM Vol. 16, No. 1, 3-24
Spring 2009 © 2009 Cises
Bobbio, A., & Manganelli A. M. Multidimensional Leadership Self-Efficacy
Scale
Chan, K. Y., & Drasgow, F. (2001). Toward a theory of individual differences and leadership: Understand-ing the motivation to lead. Journal of Applied Psychology, 86, 481-498.
Chemers, M. M, Watson, C. B., & May, S. T. (2000). Dispositional affect and leadership effectiveness: A comparison of self-esteem, optimism, and efficacy. Personality and Social Psychology Bulletin, 26, 267-277.
Christie, R., & Geis, F. L. (1970). Studies in Machiavellianism. London, UK: Academic Press. Crowne, D. P., & Marlowe, D. (1960). A new scale of social desirability independent of psychopathology.
Journal of Consulting Psychology, 24, 349-354. Eagly, A. H., & Karau, S. J. (1991). Gender and the emergence of leaders: A meta-analysis. Journal of
Personality and Social Psychology, 60, 685-710. Eagly, A. H., & Karau, S. J. (2002). Role congruity theory of prejudice towards female leaders. Psycho-
logical Review, 109, 573-598. Fehr, B., Samsom, D., & Paulhus, D. L. (1992). The construct of Machiavellianism: Twenty years later. In
C. D. Spielberger & J. N. Butcher (Eds.), Advances in personality assessment (Vol. 9, pp. 77-116). Hillsdale, NJ: Lawrence Erlbaum Associates, Inc.
Fleischer, R., & Chertkoff, J. (1986). Effects of dominance and sex on leader selection in dyadic work groups. Journal of Personality and Social Psychology, 50, 94-99.
Galli, I., & Nigro, G. (1983). Versione italiana della scala MACH IV [Italian version of the Mach IV scale]. Firenze, IT: O.S.
Gerbing, D. W., & Hamilton, J. G. (1996). The viability of exploratory factor analysis as a precursor to confirmatory factor analysis. Structural Equation Modeling, 3, 62-72.
Goktepe, J. R., & Schneier, C. R. (1989). Role of sex, gender roles, and attraction in predicting emergent leaders. Journal of Applied Psychology, 74, 165-167.
Hollander, E. P. (1958). Conformity, status, and idiosyncrasy credit. Psychological Review, 65, 117-127. House, R. J., & Podsakoff, P. M. (1994). Leadership effectiveness: Past perspectives and future directions
for research. In J. Greenberg (Ed.), Organizational behavior: The state of the science (pp. 45-82). Hillsdale, NJ: Laurence Erlbaum Associates Inc.
Hu, L., & Bentler, P. M. (1999). Cutoff criteria for fit indexes in covariance structure analysis: Conven-tional criteria versus new alternatives. Structural Equation Modeling, 6, 1-55.
Ilies, R., Gerhardt, M. W., & Huy, L. (2004). Individual differences in leadership emergence: Integrating meta-analytic findings and behavioral genetics estimates. International Journal of Selection and As-sessment, 12, 207-219.
Jago, A. (1982). Leadership: Perspectives in theory and research. Management Science, 28, 315-336. Judge, T. A., Bono, J. E., Remus, I., & Gerhardt, M. W. (2002). Personality and leadership: A qualitative
and quantitative review. Journal of Applied Psychology, 87, 765-780. Judge, T. A., Piccolo, R. F., & Remus, I. (2004). The forgotten ones? The validity of consideration and ini-
tiating structure in leadership research. Journal of Applied Psychology, 89, 36-51. Kane, T. D., & Baltes, T. R. (1998). Efficacy assessment in complex social domains: Leadership efficacy in
small task groups. Paper presented at the annual meeting of The Society of Industrial and Organiza-tional Psychology. Dallas, TX.
Kane, T. D., Zaccaro, S. J., Tremble, T. T., Jr., & Masuda, A. D. (2002). An examination of the leader’s regulation of groups. Small Group Research, 33, 65-120.
Kanfer, R. (1990). Motivation theory and industrial and organizational psychology. In M. D. Dunnette & L. M., Hough (Eds.), Handbook of industrial and organizational psychology (2
nd ed., Vol. 1, pp. 75-
171). Palo Alto, CA: Consulting Psychologists Press. Livi, S., Kenny, D. A., Albright, L., & Pierro, A. (2008). A social relations analysis of leadership. The
Leadership Quarterly, 19, 235-248. Locke, E. A. (2003). Good definitions: The epistemological foundation of scientific progress. In J. Green-
berg (Ed.), Organizational behavior: The state of the science (2nd
ed., pp. 415-444). Mahwah, NJ: Erlbaum.
Locke, E. A., Kirkpatrick, S., Wheeler, J. K., Schneider, J., Niles, K., Goldstein, H., et al. (1991). The es-sence of leadership: The four keys to leading successfully. New York: Lexington Books.
Machiavelli, N. (1513/2004). Il Principe [The Prince]. Milano: Feltrinelli. Manganelli Rattazzi, A. M., Canova, L., & Marcorin, R. (2000). La desiderabilità sociale. Un’analisi di
forme brevi della scala di Marlowe e Crowne [Social desirability. An analysis of short forms of the Marlowe-Crowne social desirability scale]. Testing Psicometria Metodologia, 7, 5-17.
Mardia, K. V. (1970). Measures of multivariate skewness and kurtosis with applications. Biometrika, 57, 519-530.
McCormick, M. J., Tanguma, J., & Sohn, A. (2002). Extending self-efficacy theory to leadership: A review and empirical test. Journal of Leadership Education, 1, 1-15.
McCormick, M., Tanguma, J., & Sohn, A. (2003, Spring). Gender differences in beliefs about leadership capabilities: Exploring the glass ceiling phenomenon with self-efficacy theory. The Kravis Leader-ship Institute Leadership Review.

22
TPM Vol. 16, No. 1, 3-24
Spring 2009 © 2009 Cises
Bobbio, A., & Manganelli A. M. Multidimensional Leadership Self-Efficacy
Scale
Megargee, E. I. (1969). Influence of sex roles on the manifestation of leadership. Journal of Applied Psy-chology, 53, 377-382.
Miyake, A., Friedman, N., Emerson, M. J., Witzki, A. H., Howerter, A. & Wager, T. D. (2000). The unity and diversity of executive functions and their contribution to “frontal lobe” tasks: A latent variable analysis. Cognitive Psychology, 41, 49-100.
Morrison, A. (1992). The new leaders. San Francisco: Jossey-Bass. Murphy, S. (2001). Leader self-regulation: The role of self-efficacy and multiple intelligences. In R. E.
Riggio, S. E. Murphy, and F. J. Pirozzolo (Eds.), Multiple intelligences and leadership (pp. 163-186). Mahwah, N.J.: Lawrence Erlbaum Associates Inc.
Northouse, P. G. (2001). Leadership. Thousand Oaks, CA: Sage Publications. Ng, K. Y., Ang, S., & Chan, K. Y. (2008). Personality and leader effectiveness: A moderated mediation
model of leadership self-efficacy, job demands, and job autonomy. Journal of Applied Psychology, 93, 733-743.
Nyquist, L., & Spence, J. (1986). Effects of dispositional dominance and sex role expectations on leader-ship behaviors. Journal of Personality and Social Psychology, 50, 87-93.
Paglis, L. L., & Green, S. G. (2002). Leadership self-efficacy and managers’ motivation for leading change. Journal of Organizational Behavior, 23, 215-235.
Paulhus, D. L. (1991). Measurement and control of response bias. In J. P. Robinson, P. R. Shaver, & L. S. Wrightsman (Eds.), Measures of personality and social psychological attitudes (pp. 17-59). San Diego, CA: Academic Press.
Pierro, A. (1997). Caratteristiche strutturali della scala di General Self-Efficacy [Structural characteristics of the General Self-Efficacy Scale]. Bollettino di Psicologia Applicata, 221, 29-38.
Pierro, A. (2004). Potere e leadership [Power and leadership]. Roma: Carocci. Ryan, M. K., & Haslam, S. A. (2005). The glass cliff: Evidence that women are over-represented in pre-
carious leadership positions. British Journal of Management, 16, 81-90. Satorra, A., & Bentler, P. M. (2001). A scaled difference chi-square test statistic for moment structure
analysis. Psychometrika, 66, 507-514. Schermelleh-Engel, K., Moosbrugger, H., & Müller, H. (2003). Evaluating the fit of structural equation
models: Test of significance and descriptive goodness-of-fit measures. Methods of Psychological Research Online, 8, 23-74.
Schruijer, S. G. L., & Vansina L. S. (2002). Leader, leadership and leading: From individual characteristics to relating in context. Journal of Organizational Behavior, 23, 869-874.
Schumaker, R., & Lomax, R. (1996). A beginner’s guide to structural equation modeling. Mahwah, NJ: Lawrence Erlbaum Associates Inc.
Sherer, M., & Adams, C. H. (1983). Construct validation of the self-efficacy scale. Psychological Reports, 53, 899-902.
Sherer, M., Maddux, J. E., Mercadante, B., Prenticedunn, S., Jacobs, B., & Rogers R. W. (1982). The self-efficacy scale: Construction and validation. Psychological Report, 51, 219-247.
Silverthorne, C. (2001). Leadership effectiveness and personality: A cross cultural evaluation. Personality and Individual Differences, 30, 301-309.
Stajkovic, A. D. & Luthans, F. (1998). Self-efficacy and work-related performance: A meta-analysis, Psy-chological Bulletin, 124, 240-261.
Wanous, J. P., & Hudy, M. J. (2001). Single-item reliability: A replication and extension. Organizational Research Methods, 4, 361-375.
Yukl, G. (2006). Leadership in organization. Upper Saddle River, NJ: Pearson Prentice Hall. Zaccaro, S. J. (2007). Trait-based perspective of leadership. American Psychologist, 62, 6-16. Zimmerman, A. M., & Zahniser H. J. (1991). Refinements of sphere-specific measures of perceived con-
trol: Development of a sociopolitical control scale. Journal of Community Psychology, 19, 189-204.
23
TPM Vol. 16, No. 1, 3-24
Spring 2009 © 2009 Cises
Bobbio, A., & Manganelli A. M. Multidimensional Leadership Self-Efficacy
Scale
APPENDIX
Items of the Leadership Self-Efficacy Scale (Italian and English)
Dimensions Items
1) Sono in grado di imprimere una nuova direzione ad un gruppo, se quella
attualmente presa non mi sembra corretta [I am able to set a new direction
for a group, if the one currently taken doesn’t seem correct to me]
2) Di solito, sono in grado di modificare le idee e i comportamenti dei
membri di un gruppo, qualora questi non siano in linea con gli obiettivi pre-
fissati [I can usually change the attitudes and behaviors of group members
if they don’t meet group objectives]
Iniziare e
guidare processi
di cambiamento
nei gruppi
[Starting and
leading change
processes in
groups]
3) Sono in grado di cambiare le cose in un gruppo anche se non dipendono
completamente da me [I am able to change things in a group even if they
are not completely under my control]
4) Ho fiducia nella mia capacità di scegliere i membri di un gruppo in modo
da costruire un team efficace ed efficiente [I am confident in my ability to
choose group members in order to build up an effective and efficient team]
5) Sono in grado di suddividere efficacemente il lavoro tra i membri di un
gruppo per ottenere il miglior risultato [I am able to optimally share out the
work between the members of a group to get the best results]
6) All’interno di un gruppo, sarei capace di delegare ad altri il compito di
realizzare obiettivi specifici [I would be able to delegate the task of accom-
plishing specific goals to other group members]
Scegliere
collaboratori
efficaci e
delegare le
responsabilità
[Choosing
effective
followers and
delegating
responsibilities]
7) Di solito, sono capace di capire a quale membro di un gruppo è meglio
delegare la realizzazione di una certa attività [I am usually able to under-
stand to whom, within a group, it is better to delegate specific tasks]
8) Di solito, so come instaurare ottime relazioni con le persone con le quali
collaboro [Usually, I can establish very good relationships with the people I
work with]
9) Sono sicuro di poter comunicare con gli altri in modo efficace, andando
dritto al nocciolo della questione [I am sure I can communicate with others,
going straight to the heart of the matter]
Costruire e
gestire
le relazioni
interpersonali
all’interno del
gruppo
[Building and
managing
interpersonal
relationships
within the
group]
10) Sono in grado di gestire con successo le relazioni con tutti i membri di
un gruppo [I can successfully manage relationships with all the members of
a group]
(appendix continues)

24
TPM Vol. 16, No. 1, 3-24
Spring 2009 © 2009 Cises
Bobbio, A., & Manganelli A. M. Multidimensional Leadership Self-Efficacy
Scale
Appendix (continued)
Dimensions Items
11) Sono in grado di identificare i miei punti di forza e i miei punti di debo-
lezza [I can identify my strengths and weaknesses]
12) Ho fiducia nella mia capacità di realizzare le cose [I am confident in my
ability to get things done]
13) So sempre come tirare fuori il meglio dalle situazioni che mi si prospet-
tano [I always know how to get the best out of the situations I find myself
in]
14) Grazie alla mia esperienza e alle mie competenze, sono in grado di aiu-
tare i membri di un gruppo a raggiungere gli obiettivi prefissati [With my
experience and competence I can help group members to reach the group’s
targets]
Dimostrare
consapevolezza
e fiducia in se
stessi [Showing
self-awareness
and
self-confidence]
15) Come leader, di solito sono in grado di far valere i miei principi e i miei
valori [As a leader, I am usually able to affirm my beliefs and values]
16) Sono sicuro di poter motivare i membri di un gruppo col mio esempio
[With my example, I am sure I can motivate the members of a group]
17) Quando avvio un nuovo progetto, di solito so come coinvolgere e moti-
vare i membri di un gruppo [I can usually motivate group members and a-
rouse their enthusiasm when I start a new project]
Motivare
le persone
[Motivating
people]
18) Sono capace di valorizzare e motivare ciascun membro di un gruppo
nell’esercizio dei propri compiti e delle proprie funzioni [I am able to moti-
vate and give opportunities to any group member in the exercise of his/her
tasks or functions]
19) Di solito, sono capace di farmi apprezzare dalle persone che collabora-
no con me [I can usually make the people I work with appreciate me]
20) Sono sicuro di poter ottenere il consenso dei membri di un gruppo [I am
sure I can gain the consensus of group members]
Ottenere
il consenso dei
membri del
gruppo
[Gaining
consensus of
group members] 21) Di solito sono in grado di guidare un gruppo col consenso di tutti i
membri [I can usually lead a group with the consensus of all members]