leadership styles and performance of secondary …
TRANSCRIPT

LEADERSHIP STYLES AND PERFORMANCE OF SECONDARY
SCHOOLS IN RWANDA.
A CASE STUDY OF NYARUGENGE DISTRICT SCHOOLS.
BIZUMUREMYI STEVEN
MED/42258/2016
Research Project Submitted in Partial Fulfillment of the Requirements for
the Award of the Degree of Master of Education (Educational,
Management, Planning and Administration Option) of Mount Kenya
University.
MAY 2018

ii
DECLARATION
This research study is my original work and has not been presented to any other institution.
No part of this research should be reproduced without the authors‟ consent or that of Mt.
Kenya University.
Students Name: BIZUMUREMYI Steven
Sign: ……………………. Date: ……………………..
Declaration by the supervisor(s)
This research project has been submitted with our approval as the Mount Kenya University
supervisor.
1. Name: Mr. HARERIMANA Jean Paul
Sign: ……………………… Date: ………………….
2. Dr Hesbon Andla
Sign: ............................... Date:...............................

iii
DEDICATION
This research project is dedicated to my parents Pastor Kayigirwa Laurent and Mukamana
Peline, Mukamana Jacqueline my wife, Abumugisha Beni Sabin my son, my other family
members, special friends and colleagues with all my sincere heartfelt gratitude and due
respect.

iv
ACKNOWLEDGEMENTS
The success of this research project is a huge endeavor that I cannot claim to own alone. I
wish to extend my heartfelt thanks to my wife for her sacrifice in my studies. I am grateful to
my supervisor Mr. Harerimana Jean Paul for his wise counsel and guidance while I was
writing this research project. His constant parental guidance and technical support greatly
inspired me. I also wish to extend my sincere thanks to all lecturers of Mount Kenya
University who in one way or another helped me to achieve all that I have achieved
academically. Furthermore, I owe thanks to my colleagues who were very helpful and
generously contributed constructive ideas towards this research project. To all of you not
mentioned but sincerely contributed to the fulfillment of this research proposal, may God,
The Almighty reward you abundantly.

v
ABSTRACT
This study aims at investigating Leadership Styles and Performance of secondary schools in
Nyarugenge District. This study was guided by the following specific objectives: to examine
the leadership styles employed in secondary schools in Nyarugenge district, to determine the
level of performance of secondary schools in Nyarugenge district and establish the
relationship between Leadership styles and Performance of Secondary Schools in
Nyarugenge District- Rwanda. The findings of the study are likely to assist policy makers in
different educational institutions such as REB and sectors stretching from Government to the
general public, the findings from this study are likely also to be used as references for further
researchers consider when implementing such policies. The study may further prompt more
researches in the area having contributed to literature and methodology for such future
studies. Descriptive survey research design was used to establish whether there is significant
relationship between School Leadership style and performance of secondary schools in
Nyarugenge District. A sample of 17 school administrators, 117 teachers out of the target
population of 202 respondents was randomly and purposively selected to participate in the
study. Questionnaires were used to collect primary data while secondary data was obtained in
published documents and reports. The collected data was tabularized for analysis using SPSS
version 22.0. Pearson Correlation coefficient was determined using partial correlational
analysis of the independent and dependent variables. The findings of the study revealed a
strong and positive influence of democratic leadership style on students‟ academic
achievement at r=0.932; significant at p=0.004 level. The results on Laissez-faireleadership
style showed positive influence on students‟ academic performance at R-value is positive
0.101 and not significant (p=0.072,). The findings revealed that autocratic leadership style
strongly (R=0.546) influence school performance but the relationship is insignificant with p
value = 0.081. The study recommended that MINEDUC provides training to head teachers in
order to enhance their leadership skills in terms of in-service programme so that they practice
concurrently what they learn and Schools to create leaders‟ network in which they share ideas
in regard to school management. Such networks would be between head teachers, discipline
masters, academic masters or teachers. Exchange programs in which teachers visit other
schools to see how different styles are employed would benefit such a network.

vi
TABLE OF CONTENT
DECLARATION........................................................................................................................... ii
DEDICATION.............................................................................................................................. iii
ACKNOWLEDGEMENTS ........................................................................................................ iv
ABSTRACT ................................................................................................................................... v
TABLE OF CONTENT ............................................................................................................... vi
LIST OF TABLES ....................................................................................................................... ix
LIST OF ACRONYMNS AND ABBREVIATIONS ................................................................ xi
DEFINITION OF KEY TERMS ............................................................................................... xii
CHAPTER ONE: INTRODUCTION ........................................................................................ 1
1.0. Introduction .............................................................................................................................. 1
1.1 Background of the Study .......................................................................................................... 1
1.2. Problem Statement ................................................................................................................... 2
1.3. Objectives of the study............................................................................................................. 3
1.5. Significance of the Study ......................................................................................................... 4
1.6. Limitation of the Study ............................................................................................................ 5
1.7. Scope of the Study ................................................................................................................... 6
1.8. Organization of the Study ........................................................................................................ 7
2.0 Introduction ............................................................................................................................... 8
2.1. Theoretical literature ................................................................................................................ 8
2.1.1. Leadership styles and school Leadership .............................................................................. 8
2.1.2. Meaning of School Leadership ............................................................................................. 9
2.1.3. Characteristics of School Leadership.................................................................................. 10
2.1.4. Types of decision-making in School Leadership ................................................................ 12

vii
2.1.5. Significance of Educational Leadership and Leadership .................................................... 13
2.1.6. Developing School Leaders ................................................................................................ 14
2.1.7. Managing people and resources within a school ................................................................ 15
2.1. 8. Motivation and educational outcomes ............................................................................... 15
2.1.9. Barriers to School Leadership in Rwanda .......................................................................... 16
2.1.9.1 Lack of Professional training ............................................................................................ 16
2.1.9.2 Emphasis on national exam rather than quality of education ........................................... 17
2.1.9.3 Poor condition of teachers ................................................................................................ 18
2.1.10 Role of the school Leadership on students‟ performance .................................................. 19
2.1.11 Students‟ academic performance ....................................................................................... 19
2.2. Empirical Literature ............................................................................................................... 20
2.3. Critical Review and Research Gap Identification .................................................................. 22
2.4. Theoretical framework ........................................................................................................... 23
2.5. Conceptual framework ........................................................................................................... 25
2.6. Summary ................................................................................................................................ 26
CHAPTER THREE: RESEARCH METHODOLOGY ......................................................... 27
3.0 Introduction ............................................................................................................................. 27
3.1 Research design ...................................................................................................................... 27
3.2 Target Population .................................................................................................................... 27
3.3Sample Design ......................................................................................................................... 27
3.3.2. Sampling technique ............................................................................................................. 28
3.4 Data collection methods and instruments ............................................................................... 29
3.5 Validity and Reliability of Instruments................................................................................... 29
3.5.1 Validity of the research instruments .................................................................................... 29
3.5.2 Reliability of the research instrument .................................................................................. 30
3.6 Data analysis Procedure .......................................................................................................... 30
3.7 Ethical Consideration .............................................................................................................. 31

viii
CHAPTER FOUR: RESEARCH FINDINGS AND DISCUSSION ...................................... 32
4.0 Introduction ............................................................................................................................. 32
4.2.2 Analysis of Demographic Characteristics of Respondents .................................................. 33
4.2.3 Age of Teachers and Head teachers ..................................................................................... 33
4.2 Leadership style employed in the secondary schools ............................................................. 36
Chapter five: summary, conclusion and recommendations .................................................... 52
5.0 Introduction ............................................................................................................................. 52
5.1 Summary ................................................................................................................................. 52
5.1.1 The Commonly used Leadership Styles in Secondary Schools ........................................... 52
5.1.2 Performance of the secondary schools ................................................................................. 53
5.2 Conclusion .............................................................................................................................. 55
5.2.1 The Commonly used Leadership Style in Secondary Schools ............................................ 55
5.2.2 Performance of the secondary schools ................................................................................. 56
5.3 Recommendation .................................................................................................................... 57
5.4 Suggested further studies ........................................................................................................ 58
REFERENCES ............................................................................................................................. 59
APPENDICES ............................................................................................................................. 63
APPENDIX A: QUESTIONNAIRES .......................................................................................... 64
APPENDIX D.1 QUESTIONNAIRE FOR ADMINISTRATORS AND TEACHERS .............. 65

ix
LIST OF TABLES
Table: 3. 1: Table showing the sample size selection and sampling techniques ..................... 29
Table: 4. 1: Response rate of the study .................................................................................... 32
Table: 4. 2: Categorization by age group ................................................................................. 33
Table: 4. 3: Categorization by gender of the respondents ....................................................... 34
Table: 4. 4: Educational Level of the respondents ................................................................... 35
Table: 4. 5 Autocratic leadership style .................................................................................... 36
Table: 4. 6: Democratic leadership style.................................................................................. 39
Table: 4. 7: Laissez-faire leadership style................................................................................ 42
Table: 4. 8: Behavior of teachers in the school ........................................................................ 44
Table: 4. 9: Response to financial stability of the school ........................................................ 47
Table: 4. 10 Level of student‟s academic performance ........................................................... 49
Table: 4. 11: Pearson Correlation r -value ............................................................................... 50
x
LIST OF FIGURES
Figure: 2. 1: Conceptual Framework ....................................................................................... 25

xi
LIST OF ACRONYMNS AND ABBREVIATIONS
12YBE : Twelve Years Basic Education
9YBE : Nine Years Basic Education
CVI : Content Validity Index
D.V : Dependent Variable
Dr. : Doctor
GIE : General Inspectorate of Education
GoR : Government of Rwanda
I.D : Independent Variable
MED : Masters of Education
MINEDUC : Ministry of Education
MKU : Mountain Kenya University
Mt. : Mount
SA : Strongly Agree
SAQ : Self-Administered Questionnaire
SD : Strongly Disagree
TIMSS : Test in Mathematics and Social Sciences
TVET : Technical and Vocational Education Training

xii
DEFINITION OF KEY TERMS
Academic Performance: Academic performance is a term used for students achievement
based on how well they are doing in their studies.
Financial stability: is a state in which the financial system, i.e. the key financial markets
and the financial institutional system is resistant to economic shocks and is fit to smoothly
fulfill its basic functions; the intermediation of financial funds, management of risks and the
arrangement of payments.
Leadership Styles: These are Leadership styles applied by school administrators in
implementing the organizational goals.
School Leadership: It is an applied branch of Leadership where techniques and principles of
Leadership are used to accomplish the desired objectives of the school.
School: Is an institution designed to provide learning spaces and learning environments for
the teaching of students under the direction of teachers.
Secondary Schools: Public schools depend primarily on local, state, and federal government
funds. This research will include also government aided school because their ways of
operation is almost the same as in public schools.
Teacher's behavior: Teacher's behavior is defined as the behavior or activities of persons as
they go about doing whatever is required of teachers, particularly those activities that are
concerned with the direction of guidance of the learning of others.

1
CHAPTER ONE: INTRODUCTION
1.0. Introduction
This chapter presents the background to the study, statement of the problem, purpose,
objectives, research questions, scope, and significance of the study and definition of the key
terms.
1.1 Background of the Study
Leadership is the process of influencing the activities of a group of people by a leader in
efforts towards goal achievement (Nworgu, 1991). It involves a force that
initiates actions in people and the leader himself or herself (Nwadian, 1998). It could be
described as the ability to get things done with the assistance and co-operation of other
people within the school system (Aghenta, 2001; Mouton and Black 1994).
The government of Rwanda has taken various leadership styles to improve and empower the
above domains of school organization with the purpose of improving secondary schools
performance. The government‟s objective in vision 2020 is to provide Universal Secondary
Education (USE) by 2010 and subsequently Basic Education for All (EFA) by 2015.
Achieving these targets meant addressing the high drop-out and repetition rates (Ministry of
Education, 2003).
Furthermore, according to the Ministry of Education (2003), particular attention was given to
teaching Leadership styles, technology at all levels, promoting students centered
methodology and the establishment of counseling and career guidance against this
background, it is necessary to look critically at ways and means of ensuring that education
and training continues to provide a strong foundation. The Government of Rwanda has
chosen the path of decentralization as a way of empowering the population-women and men,
girls and boys-to participate in development activities that affect them, including education.

2
Obilan (2017) conducted a study that investigated the school Leadership Styles and Students‟
Academic Performance in secondary schools in Kicukiro District– Rwanda and the findings
indicated a strong negative significant relationship with r (137) = -.567, p<.05between
School Leadership Styles and Students‟ Academic performance, sighting the predominant
Leadership style used to be democratic. Despite the fact that Obilan‟s study was carried out in
Rwanda and Kigali city where Nyarugenge is also located, there is need to examine the
leadership styles commonly employed in secondary schools which seemingly has more effect
on the performance of schools in Nyarugenge district (Nyarugenge, DEO, 2015). Basing on
this backdrop, this study intends to investigate the relationship between leadership styles and
performance of secondary schools in Nyarugenge district – Rwanda.
1.2. Problem Statement
School performance is a predominant concern of society in the current times that gives
justification for highly performing schools in terms of grades, professional staff,
infrastructural outlook and financial muscle attract many parents to enroll their children in
such schools and students in those schools feel the pride to belong to those schools. Such
schools are characterized by effectiveness in managing academic activities; assessment and
evaluation are regularly administered, high discipline, effective communication, and
conducive learning environment among others. (Muvunyi. 2013)
The Rwandan government after the 1994 genocide against the Tutsi and inherited various
problems and challenges. Education sector as a crucial domain for a country‟s development
had to be given priority. Rwanda has implemented various education reforms. These reforms
were aimed at improving service delivery in the education sector by decentralizing budgetary
and managerial decisions. The main focus was on strengthening accountability mechanisms
by encouraging greater district and community participation in the planning and management
of school resources (MINEDUC, 2011). Since 2005, the education sector in Rwanda has

3
been decentralized. Schools at the basic level are controlled by district education officers,
school principals, and PTAs (MINEDUC, 2006). Despite all Governments‟ interventions in
funding education; capitation grant, provision of scholastic materials, training teachers,
infrastructural development ( MINEDUC, 2001) in order to lift the banner of education.
In Nyarugenge district schools register different experiences in all facets of performance;
some schools are seen performing better than others in terms of teacher behavior at school,
infrastructural development, financial stability, students‟ performance among others despite
common interventions made by GoR in allocating capitation grants, providing scholastic
materials, and building of classrooms (Nyarugenge, DEO, 2015). This raises a need for the
study to be conducted examining the leadership styles employed in different secondary
schools that could be responsible for the difference in school performance of secondary
schools. This study therefore, finds its justification to investigate the relationship between
leadership styles and performance of secondary schools in Nyarugenge district - Rwanda.
1.3. Objectives of the study
This study contains the following objectives: General objectives and Specific objectives
1.3.1. General objective
To investigate the relationship between Leadership styles and Performance of secondary
schools in Nyarugenge District – Rwanda
1.3.2. Specific Objectives
This study was guided by the following three objectives:
i. To examine the Leadership styles employed in secondary schools in Nyarugenge
District – Rwanda.

4
ii. To determine the level of Performance Secondary Schools of Nyarugenge District-
Rwanda.
iii. To establish the relationship between Leadership styles and Performance of
Secondary Schools in Nyarugenge District- Rwanda.
1.4. Research Questions
This study answered the following research questions:
i. What are the Leadership styles employed in Secondary Schools in Nyarugenge
District - Rwanda?
ii. What is the level of Performance of secondary schools in Nyarugenge District -
Rwanda?
iv. What is the relationship between leadership styles and performance of secondary
schools in Nyarugenge District - Rwanda?
1.5. Significance of the Study
The findings of the study are going to assist policy makers in different educational
institutions such as REB and sectors stretching from Government to the general public. They
will use it while reviewing and drafting policies that often act as guidelines on the strategy
that they always consider when implementing such policies.
From the findings of this research the education stakeholders, are further likely to learn how
to motivate teachers in an effort to attract highly qualified and competent teachers who can
effectively and efficiently deliver in order to improve on the quality academic performance of
students in secondary schools in Nyarugenge District - Rwanda. The findings from this study
are also to be used as references for further researchers consider when implementing such
policies.

5
The study may further prompt more researches in the area having contributed to literature and
methodology for such future studies.
1.6. Limitation of the Study
The researcher faced the following limitations. The main limitation to this research thesis is
that selected secondary schools in Nyarugenge District are scattered and therefore, it may not
be easy to reach at the sampled schools. The researcher appointed research assistants from
each sampled school to coordinate and administer the questionnaires to respondents in their
schools to bridge the distance gap.
Another limitation was that some of the main respondents (Headmasters) hold administrative
positions which expose to them both internal and external school functions; hence due to their
most often busy schedules it may not be easy for the researcher to find them for interview
sessions. To remedy this limitation, the researcher sought appointment in written to allow the
respondents check their work schedules in time and there was a routine follow up by the
researcher/research assistant both through telephone calls and physical visits to their offices.
Apart from the anticipated challenges of this study, there was limitation of this study in terms
of coverage. The findings of this study may not be enough to be generalized for the entire
Rwanda or even Nyarugenge district because of variation in school contexts. Beside, this
study only examined the constructs considered in the conceptual framework which may not
comprehensively explain the leadership styles and school performance. However, the
findings of this study were enough to achieve its purpose.

6
1.7. Scope of the Study
1.7.1 Geographical Scope
Nyarugenge is a district in Kigali Province, Rwanda. Its heart is the city centre
of Kigali (which is towards the west of the urban area and the province), and contains most of
the city's businesses. Nyarugenge district is divided into 10 sectors (imirenge): Gitega,
Kanyinya, Kigali, Kimisagara, Mageragere, Muhima, Nyakabanda, Nyamirambo,
Nyarugenge and Rwezamenyo. The district is a home to 284,561 People, total
area134 km2 (52 sq mi) and 2,100/km
2 (5,500/sq mi) Density. Nyarugenge district has got 48
secondary schools offering education on public and private basis. For the purpose of this
study, Nyarugenge district in Kigali city is not on good record of performance in the city. The
community however, keep wondering why some schools within the district perform better
than others for which the researcher hypothesizes to be leadership styles to be the most likely
factor that determines the level of school performance in terms of teacher behavior, financial
stability and students‟ academic performance
1.7.2 Content Scope
The study discussed the leadership styles employed in secondary schools in Nyarugenge
District which were measured by autocratic style, democratic style and laissez faire style; and
determine the level of school performance which on the other hand be measured by teacher
behavior, financial stability and students‟ academic performance. After examining the
variables independently, the findings of this study were regressed to establish relationship
between leadership styles and school performance in secondary schools in Nyarugenge
District- Rwanda.

7
1.7.3 Time Scope
The process of carrying out this started in November, 2016 and is expected to be finished in
May, 2018.
1.8. Organization of the Study
The research report was organized into five chapters; Chapter one introduces the study by
giving the background information on the research, problem statement, objectives and
research questions, significance of the study, limitations and scope of the study.
Chapter two reflects the review of relevant literature on the research questions and concept
related written of the topic from various scholars and other sources of information with
specific reference to how it applies to leadership styles in secondary school in Nyarugenge.
This chapter captures theoretical literature, empirical review, critical review and research gap
identification, theoretical framework, conceptual framework and summary of chapter.
Chapter three discussed the research methodology adopted for the study and relevant
justifications. It outlines the methodology for carrying out the secondary and primary data
collections and how results were analyzed. Research design, target population, sample size
and sampling procedure, validity and reliability of research instrument, data analysis
procedure and ethical consideration constitute this chapter. Chapter four is a presentation of
the findings, Discussion, analysis and interpretation and chapter five summarizes, concludes
and highlights the recommendations.

8
CHAPTER TWO: REVIEW OF RELATED LITERATURE
2.0 Introduction
This chapter presents a theoretical literature, Empirical Literature, theoretical framework and
conceptual framework, that examines how motivation and teacher performance and related
studies. The literature review integrated current data on the direct effects of school
Leadership on student success and some indirect effects school Leaders might have on
student achievement. A variety of Leadership styles was also researched to see if a specific
Leadership style is associated more positively with greater student achievement.
2.1. Theoretical literature
In this section the research presents different concepts such as Leadership styles and school
Leadership, meaning of school Leadership, characteristics of school Leadership, types of
decision-making in school Leadership, significance of educational Leadership and
Leadership, developing school Leaders, managing people and resources within a school,
motivation and educational outcomes, barriers to school Leadership in Rwanda, poor
infrastructure of secondary schools, lack of professional training, emphasis on national exam
rather than quality of education, poor conditions of teachers, role of the school Leadership on
students‟ performance, measuring students‟ performance.
2.1.1. Leadership styles and school Leadership
The five behavioral indices cover a significant range of principals‟ Leadership actions. To
further summarize their behavior, two Leadership styles instructional Leadership and
administrative Leadership were defined. They characterize more comprehensively principals‟
approach to their Leadership approach. Principals scoring high for the first Leadership style
are significantly involved in what is referred to in the research literature on school Leadership
as an instructional Leadership style. This index was derived by averaging the indices for the

9
first three Leadership behaviors, Leadership for school goals, instructional Leadership and
direct supervision of instruction in the school. The second Leadership style can be best
referred to as an administrative Leadership style and was derived by averaging the indices for
the Leadership behaviors, accountable Leadership and bureaucratic Leadership (Ross &
Gray, 2006). This style of Leadership focuses on administrative tasks, enforcing rules and
procedures, and accountability. In schools, emphasis that school Leadership is an organic
activity, dependent on interrelations and connections where school managers are only one
source of Leadership (Daoust, 2008). Teachers, governors and students also contribute to the
Leadership of a school (Riley, 2003) Again, there is an understanding that school principals
cannot be sufficiently informed to make all decisions in school, nor can they be present in all
places and situations where decision need to be made and therefore some decisions must be
made by teachers, and at times, by students as well as governors (Moos, 2008).
2.1.2. Meaning of School Leadership
The school administration is different from other enterprises dues to its goals. However, like
any other organization, the school needs means to run efficiently. These means are mainly of
human, material, financial, legal and technological nature. The existence of these means is
not enough in itself; there is a need to make rational utilization and combination which
fundamentally remains the responsibility of the head teacher. Indeed, school heads today
face a big challenge not only to know different tools of secondary school Leadership but also
to maintain the required professionalism to efficiency handle the available means. This goes
further because some of them do not yet master the basic principles of school Leadership or
face problem of understanding which may hinder the efficiency of the general administration
of the school (Allan, 2002)

10
As Allan (2002) posits, a school is a social organization. It has its specified objectives, the
chief objective being to impart quality education to students. The human resource; it has its
financial resources, material and physical. The head master is the manager of the school. The
manager has to see whether objectives of the school are achieved in the best and cheapest
way. He needs to plan carefully, organize means and materials, make best possible use of
physical resource such as school buildings, etc. He needs to direct, people, control and
monitor the various activities of the school and take decisions. He needs to evaluate the
progress and achievements in short; he also needs to manage the human and materials
resources, materials and financial Leadership or administrable resource to get the objectives
achieved.
2.1.3. Characteristics of School Leadership
Leadership first is basically multidisciplinary. Although Leadership has developed as a
separate discipline, it draws knowledge and concepts from various disciplines such as
psychology, economics, etc. Leadership integrates concepts drawn from various disciplines
and applies them to the functioning of an organization. Secondary school Leadership has an
applied branch, although Leadership is a distinct field of study, school Leadership has not yet
developed as a separate discipline. It is an applied branch of Leadership. It applies the
techniques and principles of Leadership to accomplish the desired objectives of the school
(Witziers et al. 2003).
According to Hallinger and Heck (1996), school Leadership should not be based on rigid
principles. It should be flexible. Although there are rules and regulations for every school,
there is need to be sensitive in taking decisions. But there should be a fluid condition without
any specific norm or standard rules and regulation, because fluidity may create confusion and
chaos. What is meant is a proper balance between rigidity and flexibility. School Leadership
should not be a bundle of theoretical principles.

11
The school should decide its objectives which are achievable. It should provide measures to
achieve the objectives which are practicable. There must be close connection between school
Leadership, social and political philosophy of a country. Leadership of a school must adjust
itself to the ideals, partners and mores of a society. It must be in conformity with the political
system of the country.
Every school has a set of certain objectives. The school organizes means and material to
accomplish these objectives. Planning, organizing, direction and control, decision making and
evaluation all must be geared to the accomplishment of the objectives of the school. School
Leadership in modern days is therefore, regarded as Leadership by objectives. School
Leadership is humane in nature. It deals with human beings, teachers, students, parents and
community members. It is concerned with the welfare and development of human beings in
the school setting. The human element is the most essential element of school Leadership
(Fullan, 1981). Although Leadership has grown as profession in business and industry, school
Leadership is not a profession. The main benchmarks of a profession include a body of
specialized knowledge, (b) formal training and experience, (c) an organization to espouse
professionalization, (d) an ethical code for the guidance of conduct, (e) the licensing of
practitioners, and a commitment to service rather than to monetary benefits. In terms of these
benchmarks school Leadership cannot be called as a profession. It is a semi profession
(Witziers et al. 2003).
According to Allan (2002), the principles of school Leadership are not absolute, they are
relative. Schools differ from one another in terms of size, homogeneity, stability and other
related field. Since schools differ from one another, style of Leadership must also vary from
school to school. The same headmaster, who has been successful with certain techniques in
one school, may be a failure with the same techniques in another school because of the
differences in situational factors.

12
2.1.4. Types of decision-making in School Leadership
According to Allan (2002), decision making in school can be broadly classified into three
categories based upon the subject involved. The three categories are: technical decision,
managerial decision and institutional decision. The first is technical decision; this Isa decision
concerning the process by which inputs are charged into outputs by the school.
For example, in the last board examinations, students did so badly in science and in order to
improve their performance in science, the school Leadership may change the teacher and
other teacher may be given the responsibility of teaching science to the students of class.
Here, teacher is the input and performance of students is the output.
The second type is managerial decisions, this is a decision related to issue of coordination and
support of the core activities of the school. It is also concerned with the relationship between
the school and its immediate environment. The third decision is institutional decision this
involve long term planning and policy formulation. Examples include expansion of school
building, opening of additional sections, etc. Various decisions in school Leadership can also
be classified into two categories based on the nature of the problem (Allan, 2002).
These two categories are programmed decisions and none programmed decisions.
Programmed decisions are those involving simple, common and frequently occurring
problems that have well established and understood solutions. The programmed decisions
limit the headmaster‟s freedom. The decision is taken in pursuance of rules, procedure and
policies of the school. Non-programmed decision deal with unusual or unique problems. If a
problem has not come up often enough to be covered by a policy, or is so important that it
deserves then special treatment must be handled by a non-programmed decision. Usually
non-programmed decisions are taken at the top level. Programmed decisions are also called
tactful decisions while the non-programmed decisions are called strategic decisions.

13
Programmed decision or tactful decision can be delegated to lower levels, but strategic
decisions usually take the head or deputy head of the school (Allan, 2002).
2.1.5. Significance of Educational Leadership and Leadership
There is great interest in educational Leadership in the early part of the 21st century. This is
because of the widespread belief that the quality of Leadership makes a significant difference
to school and students outcome including many parts of the world. It has been recognized that
schools require effective Leaders and managers if they are to provide the best possible
education for their learners. As the global economy gathers pace, more governments are
realizing that their main assets are their people and that remaining or becoming competitive,
depends on increasing the development of a highly skilled workforce (Witziers et al. 2003).
This requires trained and committed teachers but they; in turn need the Leadership of highly
effective principals and the support of other senior and middle managers (Fullan, 1981). The
field of educational Leadership and Leadership is pluralist, with many competing
perspectives and an inevitable lack of agreement on the exact nature of the discipline. One
key debated whether educational Leadership is a distinct field or simply a branch of the
wider study of Leadership. The author‟s view is clear and consistent, having been articulated
for more than 20 years. Education can learn from other settings, educational Leadership and
Leadership has to be centrally concerned with the purpose or aims of education. These
purposes or goals provide the crucial sense of direction to underpin school Leadership.
Unless this link between purpose and Leadership is clear and close, there is a danger of
managerialism and a stress on procedures at the expense of educational purpose and values
(Fullan, 1999).
The process of deciding on the aims of the organization is at the heart of educational
Leadership. In most schools, aims are decided by the head teacher. However, school aims are

14
strongly influenced by pressures from the external environment, and particularly from the
expectations of government, often expressed through legislation or formal policy statements.
Schools may be left with the residual task of interpreting external imperatives rather than
determining aims on the basis of their own assessment of learner needs. The key issue here is
the extent to which school managers are able to modify government policy and develop
alternative approaches based on school-level values and vision (Ross & Gray, 2006).
2.1.6. Developing School Leaders
The school improvement movement of the past 20 years has put great emphasis on the role of
Leaders. The “quality of Leadership of the principal” has been found repeatedly to play a
crucial role in improvement of the school Leadership and students‟ performance. But this
should not be interpreted as simply meaning that the principal should be made more
powerful. Fullan in his 1981 review of America and Canadian research also concluded “that
the positive or negative role of the principal has a critical influence on teachers‟ receptiveness
of new ideas (Fullan, 1981).
In addition, a range of administrative, financial and disciplinary responsibilities falls
ultimately to school managers. But the ability to delegate such functions, especially on a day
to day basis, can be one of the most crucial competencies for a busy school Leader.
However, a description of responsibilities, does not define the competencies needed to
manage modern schools effectively. The school is seen as a community of learners where all
participants, principals, teachers, parents and students engage in learning and teaching. In
order to lead this community, a school Leader has to use different Leadership styles of
Leading; these are instructional Leaders, these serve as a role model, co-coordinating the
educational program, encouraging professional development and effective problem solving
(Witziers et al. 2003).

15
According to Amabile (1999), there is also the transformational Leader; this promotes school
improvement and renewal through professional co-operation, professional development and
effective problem solving. The third is integrative Leader; this combines personnel,
educational and financial Leadership vision which encompasses the school‟s mission of
continuous improvement. The fourth is co-operative Leadership; this is viewed as a shared
responsibility of the whole school and is undertaken by professional staffs that are qualified
to assume managerial responsibilities such as instruction, teacher co-operative, vision
development, facilities Leadership, professional development, encouragement and
recognition, standardization of procedures and monitoring of change.
2.1.7. Managing people and resources within a school
The principal needs to play a crucial role, not through control but through Leadership; this
requires the effective Leadership of people, resources and knowledge around a commonly
shared mission. This requires the effective Leadership of people, resource and knowledge
around a commonly shared mission. Principals must, among other things, be able to manage
real change where necessary, hold together an effective staff team, which can manage the
deployment of physical resources, knowledge, ideas and priorities during his or her time in
order not to get distracted from these essential tasks (Amabile, 1999).
2.1. 8. Motivation and educational outcomes
In several recent studies, self-determined motivation has been linked to various educational
outcomes across the age, from early elementally school to college students. Some of the
studies have shown that students who had more self- determined forms of motivation for
doing schoolwork were more likely to stay in schools than students who had less self-
determined motivation (Daoust, 2008).

16
Earlier, we identified conceptual understanding and personal adjustment as the most
important educational outcomes. Several recent investigations have focused on the relation of
motivation to these outcomes. Students who had greater intrinsic motivation and identified
regulation showed more positive emotions in the classroom, more enjoyment of academic
work, and more satisfaction with school than students whose motivational profile were less
autonomous. Promoting greater self- determination, that is a greater sense of choice, more
self-initiation of behavior, and greater personal responsibility, is an important developmental
goal (Amabile, 1999).
2.1.9. Barriers to School Leadership in Rwanda
Education challenges are complex issues that affect working lives of school principals,
teachers and administrators. For educational change in Rwanda, the reform process has to
deal with the past and its history, changing pre- established practices, values, attitudes and
structures within an educational structure (MINEDUC, 2006). To put it another way, head
teachers across many different contexts are faced with a wide range of challenges because of
the nature of the school environments in which they work. The challenges for school
principal in Rwanda that are now presented have been distilled from practitioners identified
as key informants because of their experience of the nation‟s education system after the
genocide. These challenges faced by head teachers in schools had been pointed out by
different authors as four major challenges as school Leaders.
2.1.9.1 Lack of Professional training
Although professional development activities for school principal and teachers exist in
Rwanda, they tend not to take into account the realities of school life. In service training
usually consists of one shot retraining courses, arranged in centers and run by educators who
often have little understanding of the context, history or complexity of teaching and learning
in a transitional environment (MINEDUC, 2011). Also very few schools in Rwanda have

17
their own professional development plans. Indeed more of an administrator than a mentor, or
initiator, of professional development activities.
This situation is compounded by the difficulties associated with the Ministry of Education‟s
immense task of upgrading the skills and qualification of more than 50 percent of Rwanda
teachers (MINEDUC, 2011). While 97 percent of primary school teachers are deemed to be
qualified, the challenges are particularly daunting in the secondary school sector teachers
(MINEDUC, 2011). However, research manifested that there is no money for the teachers to
enhance their knowledge and skills. The responsibility for recruiting principal and teachers
resides at the district level and school head teacher are themselves thrust into Leadership
positions without training, mentoring or support. They perceive the obtaining of a scholarship
for further study through the Ministry of Education to be somewhat mysterious activity,
rather than one depending on the choice knowledge or the ability of candidates. This second
major challenge for school head teacher is how to progress professionally and enhance their
skills in the absence of monetary assistance, support and knowledge of clear pathways
enabling this to occur (MINEDUC, 2011).
2.1.9.2 Emphasis on national exam rather than quality of education
The competition nature of Rwanda‟s examination driven curriculum places intense pressure
on school principals, teachers and students, and fosters the promotion of a teacher-centered
classroom. There is constant pressure to maintain high achievement scores, better than the
position of schools in national examination rankings, and improve students test results.
Head teachers observed that teachers who are involved with examination classes are
especially prone to this pressure (MINEDUC, 2010).

18
As a result of concentrating their attention on improving students „test scores, only very
limited opportunities are provided for engaging in more enterprising approaches in the
classroom. In summary, then , a third major Leadership challenge for principal at the school
level is dealing with the emphasis in school on set examinations while also attempting to
meet the Ministry of Education „goal of providing quality education. Another point referred
to this challenge is language as medium of instruction. Kinyarwanda is spoken by all, English
and French are spoken by those who have been to school. However, with the Rwandan‟s
increasing involvement in international partnerships, including membership of the East
African Community and the British Commonwealth, the government has considered the
importance of giving priority to the development of literacy in English, which is seen as an
important mechanism for trade and socioeconomic development, and as a gateway to the
global knowledge economy (MINEDUC, 2010). It is against this background that a new
policy was implemented in 2009 introducing English as the medium of instruction throughout
the education system. This presented an additional challenge to school head teachers who had
to find ways to improve their own English language proficiency, and that of their teachers,
since most of them had francophone background.
2.1.9.3 Poor condition of teachers
Fieldwork conducted over various periods in Rwanda has revealed that the average class size
is over 55 students per teacher, thus making the work of principals and teachers very
demanding. Furthermore, the classrooms in which their teachers are often overcrowded and
under furnished. For many principals, there is compensation in the provision of good housing.
This is seen as an incentive, especially by those located in the rural areas and in schools with
boarding facilities. However, they are then presented with the major challenge of providing
some means, similar residential accommodation for teaching staff, recognizing the influence
it can have on teachers‟ motivation and morale (MINEDUC, 2010).

19
2.1.10 Role of the school Leadership on students’ performance
Leadership, especially head-teachers‟ Leadership, this has been an object to studies since the
late 1960s, but the concept of Leadership is neither unanimously defined, nor a consensus has
yet been reached on its actual role and actual relevance within the school environment (Fullan
as cited in Simon. Et al. 2009). Good Leadership can certainly contribute to school
improvement by abetting the motivation, participation, and coordination of the teachers;
recent studies have widened the range of action of school Leadership research to the various
organizational levels: school managers, department heads, coordinators, teachers (Amabile,
1999) and distributed Leadership that could yield a higher impact on student achievement
than what was yet shown. This dissertation takes its moves within the strand of research that
identifies a significant role of Leadership for student achievement and tries to understand
whether there are patterns of behavior of head-teachers that yield better results than others
with respect to facilitating the student learning process and whether such patterns are
consistent or replicable across countries.
2.1.11 Students’ academic performance
Evaluating what students have learned throughout the course can be accomplished in many
ways, depending on the course objectives and how students‟ performance was measured.
Homework, class participation, papers and tests are all traditional methods for assessment
that can be created and recorded within Blackboard. Portfolios, projects and presentations are
also ways that students can demonstrate their understanding and mastery of course material
and these too can be implemented on the blackboard (Fullan as cited in Simon. et al., 2009).

20
2.2. Empirical Literature
This section reviews different studies conducted in relation to leadership styles and school
performance. Some of these studies found positive while others found negative relationship
between the variables as indicated below;
Obilan (2017) conducted a study on school leadership styles and students‟ academic
performance in secondary schools in Kicukiro district – Rwanda. His study aimed at
investigating school Leadership Styles and Students‟ Academic Performance in secondary
schools in Kicukiro District. The study had three (3) objectives: to examine the school
Leadership styles employed by secondary school head teachers in Kicukiro District, to
determine the level of students‟ academic performance in Kicukiro District and to establish
the relationship between schools leadership styles and students‟ academic performance in
Kicukiro district. Descriptive survey research designs was used to establish whether there is
significant relationship between School Leadership style and students‟ academic performance
in secondary schools in Kicukiro District. The study had a sample of 10 school
administrators, 60 teachers and 73 students were randomly purposively selected to participate
in the study. Questionnaires were used to collect primary data while secondary data was
obtained in published documents and memoirs. The collected data was tabularized for
analysis using SPSS version 22.0. Pearson Correlation coefficient was determined using
partial correlational analysis of the independent and dependent variable. There was a strong
negative significant relationship with r (137) = -.567, p<.05between School Leadership
Styles and Students‟ Academic performance. The predominant Leadership style used were
democratic and Laissez-faire while autocratic Leadership style lacked. It was recommended
that school administrators learn how to motivate teachers through inclusive managerial
practices, in an effort to attract highly qualified and competent teachers who can effectively

21
and efficiently deliver in order to improve the quality of students‟ academic performance.
(Obilan, 2017)
In her study, Joy (2013) aiming at investigating the influence of school principals‟ Leadership
styles on Kenya certificate of secondary education performance in Nairobi found that a mean
score ranging from 4.1 to 6.0 on students‟ KCSE was observed by schools where the head
teacher adopted autocratic Leadership style while 6.1-9.0 mean score were obtained by
democratically lead schools. The descriptive survey involved 24 headteachers, and 99
teachers through a questionnaire. Similarly in an attempt to establish the relationship between
leadership style adopted by head teachers in Mbooni district of Kenya specifically
democratic, autocratic and laissez-faire and academic performance of primary pupils in
Kenya Certificate of Primary Education.
Patricia (2012) found a positive correlation when autocratic style was applied while there was
a negative relationship for the laissez-faire style. The study design was descriptive research
survey and sampled 240 teachers purposively sampled and given questionnaires. The
collected data was analyzed using Chi square test and Pearson‟s Product moment at 0.05
alpha level of significance. The study concluded that 85% of the respondents attributed the
good pupils‟ performance to democratic leadership style (R2
=.415) while only 3.3%
attributed it to laissez-faire (R2 = .268). The democratic leadership style enabled teachers to
fully participate together with pupils in discussions that aimed at the betterment of their
KCPE examination according to 65.3%. Other factors were found to intervene in the
relationship however when age, gender, academic professional qualification and
administrative/teaching experience were considered, they had no significant influence.
Achieng (2000) found that head teachers rated as being democratic had high mean
performance than autocratic head teachers. The finding concur with Kimacia (2007) who
observes that there is a relationship between Leadership styles and students‟ performance in

22
national examinations and also notes that democratic head teachers had higher performance
than autocratic head teachers. Huka (2003) contradicts by noting that head teachers who are
rated most democratic had the lowest mean score while autocratic head teachers had higher
mean score. Muli (2005) had the same findings. Kimacia (2007) found that there is no
significant difference between head teachers age and Leadership style. This contradicted with
Achieng (2000) in her study that Leadership styles are as a result of age. Head teachers aged
41-45 years are democratic. Kimacia (2007) found out that age does not influence teachers in
rating head teachers Leadership styles. This contradicts with Huka (2003) who notes that
teachers aged 40 years and above rated head teachers as being democratic while those
between 20-25 years rated them as autocratic. School Leadership is managing a school in a
very effective and efficient manner with a view to get maximum advantages for a school.
A school being a social organization with specified objectives, the school Leadership means
the use of people and other resources to accomplish the objectives of the school.
School leadership has two major aspects-internal leadership which covers issues like
students‟ leadership and admission. Library and laboratory leadership, building, physical
material, financial and human resources etc. Whereas external leadership covers relations
with the community and outside agencies connected with the establishment and functioning
of the schools.
2.3. Critical Review and Research Gap Identification
Studies have endeavored to measure the influence of several factors on the academic
performance of students. For example Hamilton et al. (2000) tested the hypothesis that
providing guided notes to supplement teachers‟ instruction would have an effect on students‟
performance. Seven students, ages 13 to 18 years were given instruction in a class for
incarcerated juveniles. The instruction was provided using a lecture format and guided notes.
Students‟ performance was judged on the accuracy of the note taking and scores on a

23
comprehension quiz. Six of the 7 students improved their academic performance through the
use of the guided notes.
Specific to this study is the influence of school Leadership style on students‟ academic
performance. There is a growing amount of empirical evidence to show the relationship
between school Leadership style and students‟ academic performance however much of it is
unable to provide conclusive findings. The study of Patricia (2012) threw some light on the
relationship however it is not certain how the intervening variable were controlled in the
study. She independently evaluated the intervening variables and used the opinions of the
respondents about their effects while Joy (2013) study did not limit any extraneous variables.
The current study endeavored to include intervening variables that have been found to
cofound the relationships in similar studies. The age and gender of the school leader are the
two intervening variables that were limited in this study. The studies in related areas use
random sampling and include none administration personnel in the schools. |Such studies
suffer lack of knowledgeable experts and as such the information collected is not very
accurate. The current study involved school head teachers, deputy head teachers and director
of studies as informants and by virtual of their positions these were very much capable of
providing very relevant information for this study.
Finally, most of the studies related to this research have been carried out in developed
countries and very little is known about the consequences of poor school leadership on
academic performance in low developed countries. In this light therefore, the researcher
concentrated in Rwanda‟s context for this study.
2.4. Theoretical framework
The theory adapted for this study was derived from the System‟s theory input-output model
developed by Ludwig Von Bertalanffy in 1956. The theory, according to Koontz and
Weihrich, (1988) postulates that an organized enterprise does not exist in a vacuum; it is

24
dependent on its environment and management styles in which it is established. They add that
the inputs from the environment are received by the organization, which then transforms
them into outputs. As adapted in this study, the students (Inputs) are admitted into secondary
schools, with different admission points, from different social economic backgrounds and are
from various school backgrounds, when they get into the secondary schools system, the
management of the schools transforms them through the process of teaching and learning
(school management styles) and the students output is seen through their academic
performance. A school has been considered to be an open system that interacts with several
other systems and researchers argue that if administrators or school Leadership views the
school in this perspective then discovering and locating sources of problems in the school as
an organization becomes an easy task (Nwankwo, 1982).
The leadership styles of a school produce varying results from the system since each has a
particular emphasis it places upon the process of the inputs. The overall output which is
measured by the type of student leaving the school after going through the process purified
through several ingredients such as examination and other forms of assessments is a measure
of the type of leadership style of the school among other things (Obilade, 1989). The input,
output and process components dependent on the three fundamental components thus
decision about the input, aims and objectives and evaluation. These fundamental components
are the call of any Leadership in not only a school but organizations. Leaders are stationed in
the center of strategic planning for the organization and so influence goal settings decision
making and system evaluations to determine the next input.

25
2.5. Conceptual framework
Conceptual Framework
Independent Variable Dependent Variable
Leadership Styles Performance of Secondary schools
Intervening Variable
The framework modal in Fig 2.1 suggests that the independent variable is conceptualized into
three elements that constitute school leadership styles, namely; autocratic, Democratic and
laissez-faire; autocratic is conceptualized as being rude to staff and students, not involving
students in determining how they should be governed, not listening to students‟ concerns, not
being held accountable for his decisions and not allowing freedom of speech.
Democratic style is conceptualized as being accountable in everything he does in
administration whereas laissez-faire is conceptualized as don‟t care attitude, having no
answers to students‟ concerns; making no decisions at times they are critically necessary.
Dependent variable; School performance is conceptualized as, teacher behavior, students‟
academic performance and school financial stability a detailed in the questionnaire
Autocratic Style
Democratic Style
Laissez faire Style
Teacher behavior
Students‟ academic
performance
Financial stability
Age
Gender
Figure: 2. 1: Conceptual Framework
Source: Researcher (2017)

26
2.6. Summary
From the Literature review, several researchers seem to be in accord that there is a
relationship between School Leadership style and performance of secondary schools. These
conclusions was however confirmed or dispelled because empirical evidence has been
obtained from the research.
Literature further revealed that the input through to the output in education system is bound
together by internal factors unique to the system. Leadership style of the head teacher is a
significant ingredient in the academic output system and in this study, their type of leadership
greatly determines how the internal processes work together hence a great bearing on the
final output. A school being a social organization with specified objectives, the school
Leadership means the use of people and other resources to accomplish the objectives of the
school. School Leadership is also presumed to encompass two predominant aspects-internal
Leadership which covers issues like students‟ leadership and admission. Library and
laboratory Leadership, building, physical material, financial and human resources etc.
Whereas external Leadership covers relations with the community and outside agencies
connected with the establishment and functioning of the schools.

27
CHAPTER THREE: RESEARCH METHODOLOGY
3.0 Introduction
This chapter deals with the research methodology that was used in the study. The chapter
includes: the research design, target population, sampling design, data collection methods and
instruments, data quality control, research procedure and data analysis techniques that was
employed in this study.
3.1 Research design
The study employed both quantitative and qualitative approaches. It was a descriptive survey
in design which was analytical in nature. It was a survey because it enabled the researcher to
gather data from large number of respondents at the same time so as to describe the nature of
school performance in secondary schools in Nyarugenge District. The researcher was further
able to involve different categories of respondents (teachers and administrators) at the same
time (Enon, 1998).
3.2 Target Population
According to Amin (2003), population refers to the aggregate of all that conforms to a given
specification. The target population included all the secondary school teachers and
administrators in all secondary schools in in Nyarugenge District. There were 26 secondary
schools in Nyarugenge District (DEO Nyarugenge, 20016). Of the target population of 176
secondary school teachers and 26 head teachers (DEO, Nyarugenge, 2006).
3.3 Sample Design
This study employed simple random sampling and purposive sampling techniques. Simple
random sampling was used in order to avoid bias and to ensure that each respondent had an

28
equal chance of being selected. According to Amin (2005) randomization is effective in
creating equivalent representative groups that are essentially the same on all relevant
variables thought of by the researcher.
3.3.1 Sample size
The researcher used the model developed by Yamane (1967) formula as stated below.
Where N = sample size, N is the total population, and e is the margin of error selected at 5%.
After substitution, 134 participants will be included in the study
Therefore 134 individuals participated in this study and their composition as follows:
Proportionally,
26*134/202 17 Head teachers
176*134/202 117 teachers.
The sample size of the schools to be used the formula as:
3.3.2. Sampling technique
Table 3.1 summarizes the categorization of the sample.

29
Table: 3. 1: Table showing the sample size selection and sampling techniques
Category Population Sample size Sampling technique
Teachers 176 117 Simple Random
Head teachers 26 17 Simple Random
Total 202 134
Source: Primary Data (2017)
A simple random sampling technique was employed in this study so that every participant is
given an equal and independent chance to participate in the study. A list of all teachers and
head teachers was obtained and then randomly sampled using a random sample number
generated using Microsoft Excel. The first 17 head teachers and 117 teachers selected from
the first 26 schools. Approximately five teachers from each school were sampled.
3.4 Data collection methods and instruments
The study used the following methods with their respective instruments. Questionnaire
survey was used to enlist responses from secondary school teachers. This method
administered questionnaire (SAQs) consisting of closed and open ended questions. The SAQs
was used to enable the researcher to cover a large population quickly and at a reasonably low
cost. To enrich data collected through the questionnaires, interviews were administered to the
secondary school head teachers using interview guides.
3.5 Validity and Reliability of Instruments
3.5.1 Validity of the research instruments
Validity of research instrument refers to the extent to which the instrument measures what it
is supposed to measure (Amin, 2005). To ensure validity of the research instrument, the

30
researcher used expert raters and research supervisors in the School of Education. The rated
findings were used to calculate content validity index (CVI) using the formula:
CVI = K/N
Where K = Total number of items in the questionnaire declared valid by both raters / judges.
N = Total number of items in the questionnaire
The computed CVI of the instrument was 0.88 which index was qualified by Amin (2005)
who recommended that if CVI is above 0.7, the content is considered valid.
3.5.2 Reliability of the research instrument
Reliability of the instrument refers to the degree to which the said instrument consistently
measures whatever it is measuring (Amin, 2005). Reliability of the instrument was ensured
through split-half. In this case, the instrument was piloted with respondents. Test re-test
Piloting of two schools; G.S Kacyiru and Kabuga High School in Gasabo District was
conducted (Amin, 2005). The pilot tested scores was then be correlated using Pearson
Product Moment Correlation Coefficient and if the computed results “r” = 0.7/and above was
an indication of high correlation. This indicated that the research instrument to be used was
reliable because the minimum reliability index recommended in survey studies is 0.7 (Amin,
2005).
3.6 Data analysis Procedure
The data collected was processed for analysis by editing, coding and entering it into the
computer using the Statistical Package for Social Scientists (SPSS). These data were made
ready for presentation using frequency tables, means and percentages. The actual analysis
was based on related frequencies or percentages obtained from frequency tables and
descriptive statistics.

31
Data collected by interview guide was analyzed by organizing it into patterns, categories and
through description. This helped to rate the significances of leadership styles in influencing
school performance in secondary schools in Nyarugenge District.
3.7 Ethical Consideration
Different scholar wrote ethical issues as a crucial part of research to be considered when
conducting survey research. (Enon, 1995) The respondents filled their questionnaires without
any influence. The researcher used anonymity and confidentiality, identifying purpose and
sponsor, and analysis and reporting. Each guideline was addressed individually with
explanations to help eliminate or control any ethical concerns.
In this study, respondents‟ identities were protected; from this prospective respondents were
told the purpose of the study and its organization. Therefore, the researcher informed the
respondents that the research entitled the relationship between teachers‟ job satisfaction and
job performance is only carried out for academic purposes and personally sponsored. Also an
ethical guideline is to accurately report both the methods and the results of the study to
professional colleagues in the educational community.

32
CHAPTER FOUR: RESEARCH FINDINGS AND DISCUSSION
4.0 Introduction
This chapter presents the findings of the study and begins by presenting the response rate,
demographic data and then the research objectives chronologically.
4.1.1 Response Rate
The study had targeted to sample (N) 24schools of which n=17 were head teachers and n=117
Teachers, all conducted within Secondary schools in Nyarugenge District.
Table: 4. 1: Response rate of the study
Respondent Questionnaire Given Questionnaire Received
Head teachers 17 16
Teachers 117 115
Total 134 131
Source: Primary data (2017)
For teachers, the response rate was 98% (n=115) and for head teachers the responses were
96% (n=16). This response rates were considered suitable enough to give a true reflection of
the issues under study.

33
4.2.2 Analysis of Demographic Characteristics of Respondents
It was important to analyse the background characteristics of the various respondents of the
study; that is the head teachers and teachers who participated in this study. Their
characteristics have a strong bearing on the study‟s findings relating to the hypotheses.
4.2.3 Age of Teachers and Head teachers
Table: 4. 2: Categorization by age group
Teacher Head teacher
Age category Frequency Percentage Frequency Percentage
26-35 7 6
36-45 82 71 5 33
46-55 27 23 10 67
Total 116 100 15 100
Source: Primary data (2017)
The age of teacher respondents was analysed and the findings revealed that more than half of
the teachers (71%) who participated in the study were between the ages of 36 and 45 years,
followed by (23%) between the ages of 46 and 55 and a small percentage (6%) between the
ages of 26 and 35 years. Since the majority of teachers in secondary schools in Rwanda are in
their thirties (30s) this explains why the study was dominated by participants from this age

34
group. The majority of the head teachers (67%) were 46 and 55 years of age and the rest
(33%) were 36 and 45 years age.
Gender of the respondents
Table 4.3 presents the respondents by their gender and presents them categorized under
teachers and head teachers.
Table: 4. 3: Categorization by gender of the respondents
Gender Head teacher Teacher
Frequency Percentage Frequency Percentage
Male 8 56 57 49
Female 7 44 74 51
Total 15 100 116 100
Source: Primary data (2017)
From Table 4.3 56% of head teachers were Male compared to 49% of teachers of the same
gender. A total of 44%females were head teachers and 51 were teachers. This implies that
majority of the head teachers were males while female teachers were more. The difference
was minimal therefore gender factors were normally distributed and its effect randomized.
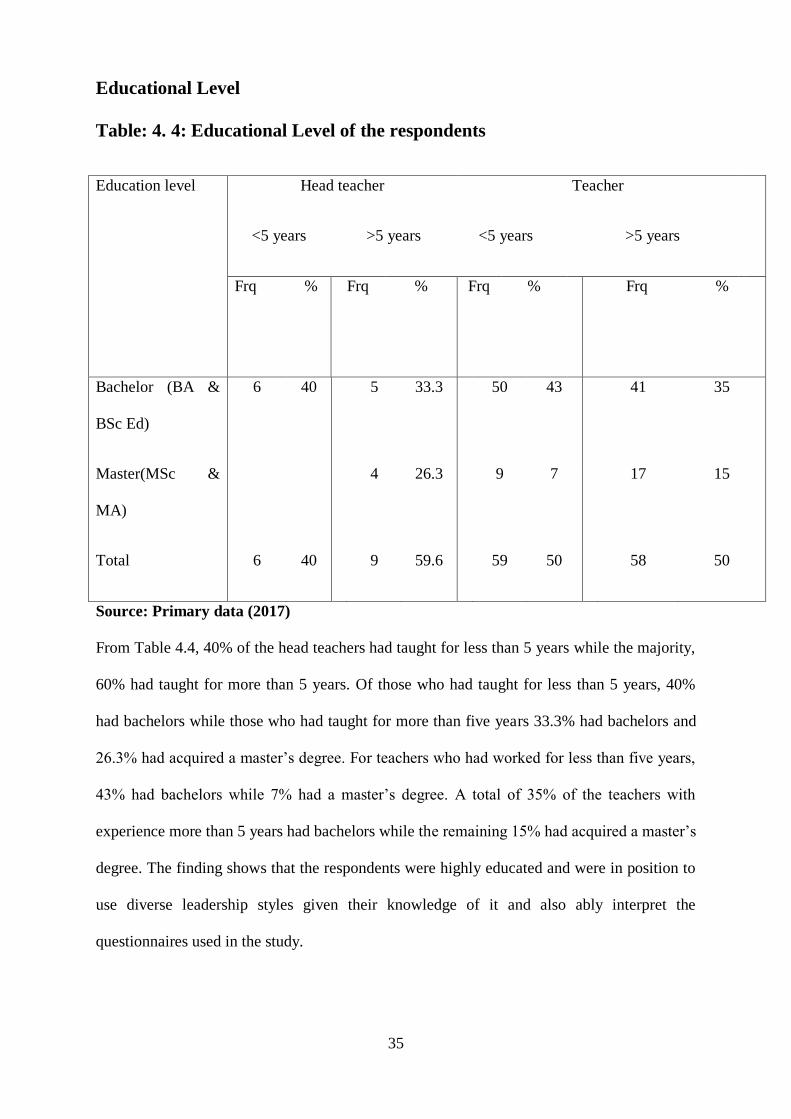
35
Educational Level
Table: 4. 4: Educational Level of the respondents
Education level Head teacher Teacher
<5 years >5 years <5 years >5 years
Frq %
Frq % Frq % Frq %
Bachelor (BA &
BSc Ed)
6 40 5 33.3 50 43 41 35
Master(MSc &
MA)
4 26.3 9 7 17 15
Total 6 40 9 59.6 59 50 58 50
Source: Primary data (2017)
From Table 4.4, 40% of the head teachers had taught for less than 5 years while the majority,
60% had taught for more than 5 years. Of those who had taught for less than 5 years, 40%
had bachelors while those who had taught for more than five years 33.3% had bachelors and
26.3% had acquired a master‟s degree. For teachers who had worked for less than five years,
43% had bachelors while 7% had a master‟s degree. A total of 35% of the teachers with
experience more than 5 years had bachelors while the remaining 15% had acquired a master‟s
degree. The finding shows that the respondents were highly educated and were in position to
use diverse leadership styles given their knowledge of it and also ably interpret the
questionnaires used in the study.

36
4.2 Leadership style employed in the secondary schools
Table: 4. 5 Autocratic leadership style
N % N % N %
AUTOCRATIC
STYLE SD D A SA Mean Sd
Lack of periodical staff
meetings 13
9.60% 14 10.70% 107 79.7% 4.3 4.11
Immediate expulsion 12
8.80% 15 11.50% 107 79.7% 4.3 4.14
Teachers uninvolved in
decision making
11
8.30% 26 19.40% 97 72.3% 1.1 4
Students are referred to
secretary when Head
teacher needed
29
21.40% 21 15.90% 84 62.7% 1.3 3.65
Students have no rights
of expression
21
15.50% 20 15.10% 93 69.5% 1.2 3.89
The head teacher has no
time to listen to teachers‟
advise
18
13.50% 22 16.70% 94 69.8% 1.1 3.88
Head teacher determines
policy
23
17.40% 82 61.5% 28 21% 1.3 3.67
No functional students‟
Leadership body.
17
12.80% 15 11.20% 102 76.00% 1.2 4.06
Leaders determined by
head teachers‟ office
44
32.50% 15 11.50% 75 55.90% 3.3 1.56
Students in this school
have no rights to express
their views.
45
33.30% 22
16.30% 68 50.40% 3.2 1.47
No need for a head
teacher to consult
anybody to facilitate
his/her decision.
16
11.60% 19 13.90% 100 74.60% 4.1 1.18
The head teacher is in
many incidences
unavailable to attend to
teachers‟ concerns.
47
35.30% 14 10.70% 72 54.00% 3.3 1.66

37
There are no forums for
students‟ meeting with
school administrators
21 15.50% 20 15.10% 93 69.50% 1.2 3.89
Teachers have no time
for students a part from
during normal timetable
hours.
18 13.50% 22 16.70% 94 69.80% 1.1 3.88
The head teacher does
not socialize with anyone
in the school
23 17.40% 28 21.00% 82 61.50% 1.3 3.67
Teachers are not allowed
to express their concerns
in this school
17 12.80% 102 76.2% 15 11.2% 1.2 4.06
Average 17.4% 14.9% 67.7%
Source: Primary data (2017)
According to Table 4.5, 13 (9.6%) 107(79.7%) agreed that in their schools teachers were
involved in decision making and with a mean of 4.3 (Sd =4.11) implied that majority agreed
that teachers were involved in decision making. Similarly according to 79.9%, agreed that
once a student misbehaved they were expelled without investigation. The head teacher
always referred students to his secretary whenever not available (62.7%) of the respondents.
The respondents disagreed 61% that their students had no rights in the school and the mean
agreement of 1.1, Sd = 3.88 means that majority disagreed. It was found that the school didn‟t
have a functional student‟s body according to 102 (76%) while in those schools where the
student leadership body existed, the head teacher appointed them according to 75 (55.9%).
According to 67(49.6%) students in their schools had rights to express themselves while the
remaining 50.4% it was true. This shows that in most schools students have right to express
themselves while others did so. It was agreed (100, 74.6%) that the head teacher did not do
much consultation with others while making some decisions while 47(35.3%) and 72(54%)

38
strongly disagreed and agreed that the head teacher was in many instances unavailable to
attend to teachers concerns. In many cases the head teachers are in meetings at district or
community and such engagements makes them to be less available in schools. The schools
did not have a forum for students and administrations of the school to meet and discuss
pertinent issues (93, 69.5%), he did not socialize with others according to 82(61.5%) while
the respondents disagreed that head teacher never allowed them to express their concerns.
The overall average of responses showed that 17.4% strongly disagreed, 14.9% disagreed
while 67.7% agreed with the statement of autocratic leadership. The findings show that the
head teachers exercised autocratic leadership styles in the schools.
Democratic leadership in the school
A total of 12 questions were asked to evaluate the democratic leadership style in the school.
The findings are as presented in Table 4.6 with SD =Strongly disagree, D = disagree, UC =
Uncertain, A = agree and SA = strongly agree and Sd = Standard Deviation

39
Table: 4. 6: Democratic leadership style
In this school there is, SD % D % UC % A % SA % Mean Sd
freedom of
expression 4 3.1 14 10.2 21 15.3 90 67.0 6 4.4 3.60 0.85
Periodic student
meeting. 13 9.9 11 8.5 14 10.5 70 52.4 25 18.7 3.62 1.17
Regular student
addresses 11 8.5 24 18.0 6 4.8 36 27.2 56 41.5 3.75 1.38
a suggestion 28 20.7 47 35.4 37 27.9 16 11.9 5 4.1 2.43 1.07
Update to students
and seek opinions 31 23.1 61 45.2 25 19.0 10 7.8 4 2.7 2.83 4.47
Patron represents
students 19 13.9 46 34.0 28 21.1 32 23.8 10 7.1 2.76 1.17
Students have right to
elect leaders 11 8.5 10 7.1 10 7.8 71 52.7 32 23.8 3.76 1.15
Equal rights to vote or
be voted in leadership 31 22.8 11 8.5 2 1.7 31 23.1 59 43.9 3.57 1.63
Periodically students
are reminded over
school values.
4 3.1 34 25.2 38 28.6 38 28.6 20 14.6 3.27 1.09
Student conflict with
teacher
democratically
handled
10 7.5 22 16.3 14 10.5 28 21.1 60 44.6 3.79 1.36
Students‟
representatives are
invited during
students‟ disciplinary
meetings.
4 3.1 51 38.4 36 26.9 39 28.9 4 2.7 2.90 0.95
Teachers create set
classroom policies
inclusively.
9 6.8 26 19.7 27 20.1 54 40.1 18 13.3 3.33 1.14
Average 11 22 16 32 18 3.30 1.45
Source: Primary data (2017)

40
According to Table 4.6 90(67%) agreed that in their school the students had the freedom
to express their concerns and the mean of 3.6 (SD = 0.85) indicates that the majority
agreed with the question. A total of 70(52.4%) agreed that the head teacher periodically
met the student leaders (Mean = 3.62, SD = 1.17) and whenever necessary the head
teacher addressed all students (A = 36, 27.2%, SA = 56, 41.5%, mean = 3.75, SD = 1.38).
the finding implied that majority of the respondents were in agreement with the
statements. Other areas of agreement were; students had the right to choose their leaders
and vote or be voted (mean = 3.76, SD = 1.15) and (Mean = 3.57, SD = 1.63)
respectively; whenever students complained about their teachers, the matter was handled
by hearing both sides (mean = 3.79, SD = 1.36).
However the leadership did not place suggestion boxes in the school (D = 47, 35.4%,
Mean = 2.43, SD = 1.07). The low SD implied that majority of the respondents across all
the schools had similar observations. The some leadership almost did not seek student‟s
opinions (Mean = 2.83, SD = 4.47). The very high SD implied that the observation was
widely divergent from the mean. It was also found that the students did not have a teacher
representative in form of patron to the staff (Mean = 2.76, SD = 1.17). The low SD here
indicates a high convergence to the mean- implying in most schools this observation was
similar. There was no conclusion whether the leadership periodically remained the
students about school values (Mean = 3.33, SD = 1.09) and also if at all teachers together
with the students created classroom policies (Mean = 3.33, SD = 1.14). Both responses
had low SD implying the observation was common to most respondents.

41
The average response was that 11% strongly disagreed, 22% disagreed, and 16% were
not sure, 32% and 18% agreed and strongly agreed respectively with democratic
leadership style in the school. The mean was 3.30 and Sd = 1.45 implying that though the
on average most leadership employed democratic styles, the respondent were not able to
clearly identify a particular school leadership with democratic. This is consistent with the
findings of Mwaura and Thinguri (2014) who found that no single leadership style is
effective for leading but rather different circumstances required different styles or a mix
of them.
Laissez-faire leadership style
A total of 11 questions were used to establish this form of leadership style in the sampled
schools. The findings are as presented in Table 4.4 with SD = Strongly disagree, D =
disagree, UC = Uncertain, A = agree and SA = strongly agree.
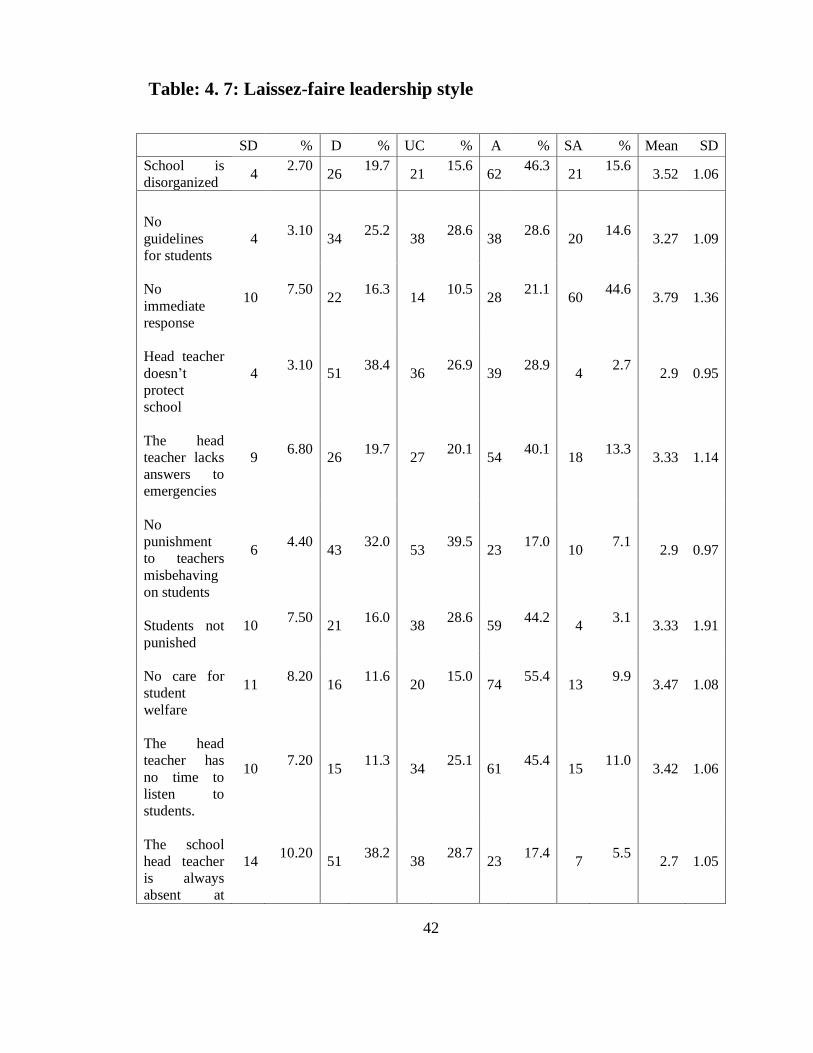
42
Table: 4. 7: Laissez-faire leadership style
SD % D % UC % A % SA % Mean SD
School is
disorganized 4
2.70
26
19.7
21
15.6
62
46.3
21
15.6
3.52 1.06
No
guidelines
for students
4 3.10
34
25.2
38
28.6
38
28.6
20
14.6
3.27 1.09
No
immediate
response
10 7.50
22
16.3
14
10.5
28
21.1
60
44.6
3.79 1.36
Head teacher
doesn‟t
protect
school
4 3.10
51
38.4
36
26.9
39
28.9
4
2.7
2.9 0.95
The head
teacher lacks
answers to
emergencies
9 6.80
26
19.7
27
20.1
54
40.1
18
13.3
3.33 1.14
No
punishment
to teachers
misbehaving
on students
6 4.40
43
32.0
53
39.5
23
17.0
10
7.1
2.9 0.97
Students not
punished
10 7.50
21
16.0
38
28.6
59
44.2
4
3.1
3.33 1.91
No care for
student
welfare
11 8.20
16
11.6
20
15.0
74
55.4
13
9.9
3.47 1.08
The head
teacher has
no time to
listen to
students.
10 7.20
15
11.3
34
25.1
61
45.4
15
11.0
3.42 1.06
The school
head teacher
is always
absent at
14 10.20
51
38.2
38
28.7
23
17.4
7
5.5
2.7 1.05

43
school.
Teachers are
less concerned
with students‟
welfare.
15 11.20
32
23.8
49
36.7
29
21.4
9
6.8
2.89 1.08
Average 7
23
25
33
12
3.23 1.16
Source: Primary data (2017)
According to table 4.7 shows that 62 (46.3%) and 21(15.6%) agreed and strongly agreed
that there school was disorganized, mean of 3.52 (Sd = 1.06) indicates that the majority
found the leadership unable to provide order in their school. Also there was agreement
that the school took long to respond to school concerns (mean = 3.79, Sd = 1.09), and the
head teacher did not care about student‟s welfare (Mean = 3.47, Sd = 1.08).There were a
number of uncertainty about leadership of the school in some items. Specifically, it was
not certain whether the schools guideline for students or teachers (Mean = 3.27, Sd =
1.09), whether the head teacher always lacked or had answers to emergencies in the
school (Mean = 3.33, Sd = 1.14), if the head teacher punished students who misbehaved
(mean = 3.33, Sd = 1.91), and whether teachers were concerned about student‟s welfare
(Mean = 3.23, Sd = 1.16).There were disagreement on whether the head teacher never
protected the school from attacks both within and outside (mean = 2.9, Sd = 0.95), or
never punished teachers who misbehaved on students (Mean = 2.9, Sd = 0.97) but was
always present in the school according to the majority (Mean = 2.7, Sd = 1.05). The
negated response were rejected by the respondents thereby give it a positive value. And
like other responses, the average response showed that 30% disagreed to this leadership
style, 25% were not sure while the remaining 45% were in agreement. However the mean

44
was neutral (Mean = 3.23, Sd = 1.16) implying that it was difficult to conclude that given
the behavior of the leadership, laissez-fair style was predominant in the school. This
finding is still defended by the observations of Mwaura and Thinguri (2014) that denies
the predominance of a single leadership style in a school.
Performance of the secondary schools
The performance of secondary schools was measured by the teacher‟s behavior, financial
and student‟s academic performance. Tables presented in this section summarize the
findings with SD = strongly disagree, D = disagree, UC = Uncertain, A = agree and SA =
strongly agree and Sd = standard deviation.
Table: 4. 8: Behavior of teachers in the school
Teachers
SD D UC
A SA M
ean
N %
N %
N %
N %
N
%
Punctual 0 8 5.6 8 5.6 59 43.7 60 45.1 4.28
Happy with the
school
2 1.4 9 7 11 8.5 62 46.5 49 36.6 3.73
Relate well with
students
2 1.4 8 5.6 13 9.9 47 35.2 64 47.9 4.23
Counsel students 0 0 2 1.4 4 2.8 66 49.3 62 46.5 4.41
Enter classes
promptly
2 1.4 2 1.4 13 9.9 64 47.9 53 39.4 4.23
leave classes after
bell
0 0 13 9.9 8 5.6 60 45.1 53 39.4 4.14

45
lead students by
example
6 4.2 23 17 30 23 60 45.1 15 11.3 3.42
give regular
assignments
8 5.6 13 9.9 17 13 72 53.5 25 18.3 3.69
enthusiastically
participate in school
activities
24 18.2 13 9.9 11 8.5 59 43.7 26 19.7 3.37
Leave school at the
official time
4 2.8 6 4.2 30 23 55 40.8 40 29.7 3.9
create extra time to
support slow
learners
4 2.8 11 8.5 26 20 64 47.9 28 21.1 3.76
draw schemes of
work and submit
them to the
concerned office
8 5.6 13 9.9 17 13 72 53.5 25 18.3 3.69
Source: Primary data (2017)
Table 4.8 shows that there was a very strong agreement that teachers reported early in the
school (59, 43.7% and 60, 45.1%, Mean = 4.28), that there was a good relationship
between teachers and students (111, 83.1% and Mean = 4.23), teachers created time to
advise indiscipline students (128, 95.8%, mean = 4.41), teachers enter class promptly and
leave class after the bell (Mean = 4.23, and 4.14). there were slight agreement on whether
teachers were happy with the administration (Mean = 3.73), teachers gave regular
assignments to students, marked them and provided feedback in time (Mean = 3.69),
teachers left school at the official time (mean = 3.9), teachers created extra time to
support slow learning students (mean = 3.76) and teachers at the beginning of the
academic term drew schemes of work and submitted them to the concerned office (Mean

46
= 3.69). The teachers did not lead students by examples (mean = 3.42) and also they did
not show enthusiasm in school activities. The finding therefore shows that the behavior of
the teachers was good though they had a few weaknesses as indicated.
Financial stability of the schools
The research assumed that financial stability is an indicator of school performance and
used seven questions to investigate the opinions of the respondents about how stable their
schools were financially. The findings are represented in Table 4.6 with SD = Strongly
disagree, D = disagree, UC = uncertain, A = Agree and SA = strongly agree.
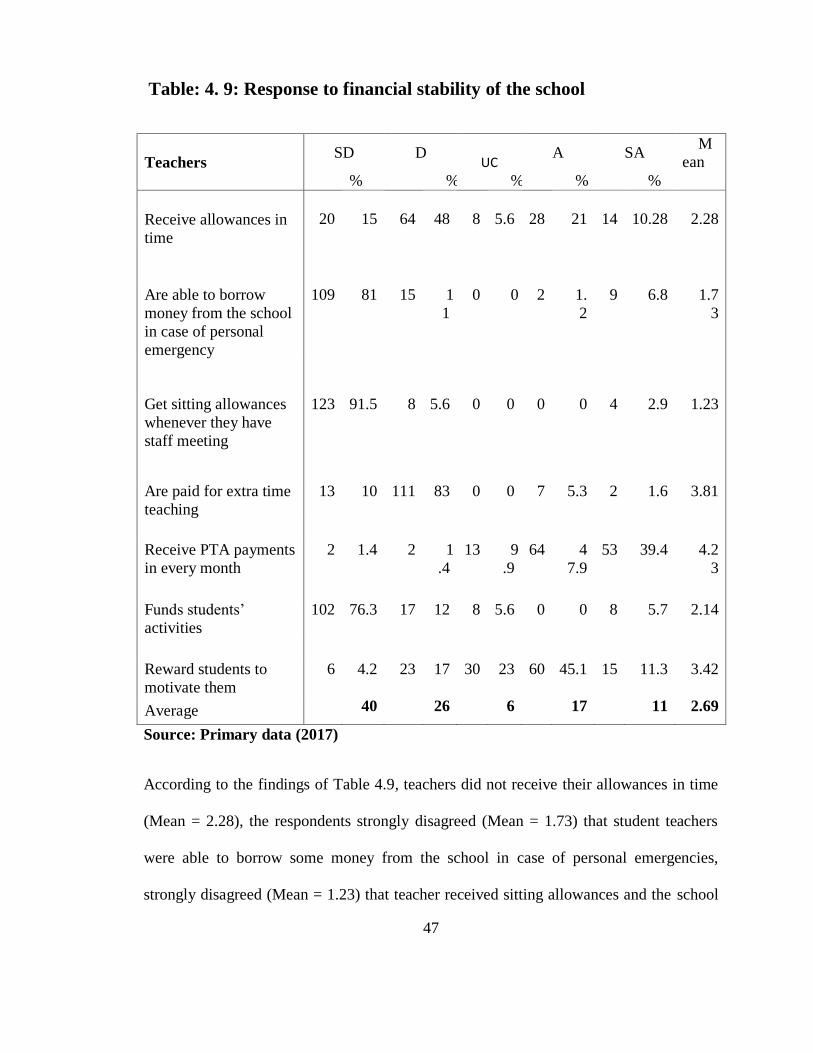
47
Table: 4. 9: Response to financial stability of the school
Teachers SD D
UC A SA
M
ean
% % % % %
Receive allowances in
time
20 15 64 48 8 5.6 28 21 14 10.28 2.28
Are able to borrow
money from the school
in case of personal
emergency
109 81 15 1
1
0 0 2 1.
2
9 6.8 1.7
3
Get sitting allowances
whenever they have
staff meeting
123 91.5 8 5.6 0 0 0 0 4 2.9 1.23
Are paid for extra time
teaching
13 10 111 83 0 0 7 5.3 2 1.6 3.81
Receive PTA payments
in every month
2 1.4 2 1
.4
13 9
.9
64 4
7.9
53 39.4 4.2
3
Funds students‟
activities
102 76.3 17 12 8 5.6 0 0 8 5.7 2.14
Reward students to
motivate them
6 4.2 23 17 30 23 60 45.1 15 11.3 3.42
Average 40 26 6 17 11 2.69
Source: Primary data (2017)
According to the findings of Table 4.9, teachers did not receive their allowances in time
(Mean = 2.28), the respondents strongly disagreed (Mean = 1.73) that student teachers
were able to borrow some money from the school in case of personal emergencies,
strongly disagreed (Mean = 1.23) that teacher received sitting allowances and the school

48
did not fund student activities (2.14). There were moderate agreement that teachers were
paid extra time taught (Mean = 3.81), agreement that teachers received PTA payments
monthly and that student leaders were rewarded as a motivation (Mean = 3.42).
Overall, 40% strongly disagreed, 26% disagreed, 6% were uncertain, 17% agreed and
11% strongly agreed with the financial stability of the school. The mean of 2.69 showed
that majority disagreed with the financial stability position of the school. This finding is
in line with that of Ambogo (2012) who found that most schools operate on limited
financial resources with others barely able to spend money on any additional needs other
than the payment of teacher salary and other essential resources.

49
Student’s performance
Level of students’ academic performance in Secondary schools in Nyarugenge
District-Rwanda
Table: 4. 10 Level of student’s academic performance
A SA D SD Mean
N % N % N % N %
Students of this school exhibit high
performance in terms of grades in
examinations. 84 63 43 32 6 4.3 0 0 4.4
In this school we experience few cases
of late coming. 81 61 36 27 10 7.2 5 4 4.2
Students regularly attend classes in
this school. 134 100 0 0 0 0 0 0 5.0
Students always consult teachers for
further clarifications about their
subjects. 68 51 30 23 20 15 13 9.5 3.7
Students demand for extra lessons
outside normal school timetable. 83 62 35 26 5 3.5 10 7.2 3.43
Students often demand for cross
academic programmes with other
schools. 121 90 10 7.2 0 0 0 0 4.6
Students enthusiastically welcome
regular or periodical assignments. 48 36 49 37 24 18 10 7.2 4.3
Source: Primary data (2017)
S. A. = Strongly Agree A = Agree D =Disagree S. D. = Strongly Disagree
According to 4.10 students exhibited high performance in terms of grade in examination
(mean = 4.4), there were few cases of late coming (mean = 4.2), students regularly
attended classes (mean = 5.0), students always demanded for cross academic programs

50
with other schools and students were enthusiastically regular on periodic assignments
(mean = 4.3). The students however did not demand for extra lessons outside the normal
school timetable (mean = 3.43) neither consulted teachers for further clarifications.
Oladejo, Olosunde, Gbolagade, Amos, and Olawale (2011) noted that given the tight
school time table, students rarely have time for any other activities in most schools in
Africa. The findings in Table 4.7 show that the students performed well in most schools.
The relationship between leadership style and schools performance
The objective of the study was to establish a relationship between leadership style and
school performance. A correlation of independent variable and dependent variable was
performed to answer this objective and the results are as shown in Table 4.11
Table: 4. 11: Pearson Correlation r -value
Leadership styles
Democratic Laissez-faire Autocratic
Pearson
correlation
2-tailed
sig.
Pearson
correlation
2-Tailed
sig.
Pearson
correlation
2-
tailed
sig
1 Trs.
Behavior
0.525* 0.037
**
0.873* 0.001** 0.402 0.064
2 Financial 0.369 0.002** 0.627* 0.049 0.061 0.048*
3 St.
performance
0.544*
0.004**
0.489 0.054
0.355 0.621
Source: Primary data (2017)
The findings on Table 4.11 established that democratic leadership styles influences
student performance due to the fact that correlation coefficient (R = 0.544, p =0.004).
This implies that there is a strong and positive influence of democratic leadership style on
students‟ academic performance. For the case of Laissez-faireleadership style, the results
showed that it is also positively influence students‟ academic performances as the

51
R=0.489, p = 0.054 implying positive and statistically significant. Autocratic style on the
other hand was not significantly relating with students performance given that R = 0.355,
P = 0.621.
The relationship between teachers behaviour and democratic leadership style produced R
= 0.525, p = 0.037 showing that the relationship was positive and statistically significant.
There was a very strong positive (R = 0.873) and statistically significant (P = 0.001)
relationship between Laissez-faire leadership style and teachers behaviour. Teachers
being of age and evaluated by their performance contract did not just behave well
because the head teacher was strict on them. Teachers‟ behaviour was not affected by
autocratic leadership style of the head teacher.
The relationship between financial stability of the school and head teachers leadership
style showed a positive (R = 0.369, P = 0.0002) with democratic style, and (R= 0.061, p
= 0.048) with autocratic styles. There was a positive relationship (R = 0.627) with
Laissez-faire though it was not statistically significant.

52
CHAPTER FIVE: SUMMARY, CONCLUSION AND
RECOMMENDATIONS
5.0 Introduction
This chapter presents the summary of the findings, logical conclusions drawn from the
study and recommendations from the study.
5.1 Summary
5.1.1 The Commonly used Leadership Styles in Secondary Schools
Overall, most of head teachers applied autocratic leadership style according to 67.7%. to
some degree involved teachers in decision making according to mean of 4.3 (SD =4.11)
and gave students rights to expression however he expelled students who misbehaved
according to 79.9%, didn‟t have a functional student‟s body according to 102 (76%)
meaning students were not involved in management of the school or if they did exist, the
head teacher di appoint them according to 75 (55.9%). The head teacher did not have
much consultation with others while making decisions according to 100 (74.6%) and was
in many cases attending to external meetings.
The average response was that 11% strongly disagreed, 22% disagreed, and 16% were
not sure, 32% and 18% agreed and strongly agreed respectively with democratic
leadership style in the school. The mean was 3.30 and SD = 1.45 implying that though
the on average most leadership employed democratic styles, the respondent were not able
to clearly identify a particular school leadership with democratic. Some signs of
53
democratic leadership did exist for example students had freedom of expression, and
when necessary, the head teacher addressed staff and students concerning school
concerns. However the leadership did not place suggestion boxes in the school, did not
seek student‟s opinions, did not have a teacher representative in form of patron to the
staff, did not periodically remained the students about school values or collaboratively
create classroom policies.
It was not possible to conclude whether the head teachers applied Laissez-faire leadership
style though some observed disorganization in the school mean of 3.52 (SD = 1.06), the
school took long to respond to school concerns (mean = 3.79, SD = 1.09), and the head
teacher did not care about student‟s welfare (Mean = 3.47, SD = 1.08).
5.1.2 Performance of the secondary schools
The finding showed that the behavior of the teachers was good though they had a few
weaknesses as indicated. Teachers reported early in the school (Mean = 4.28), there was a
good relationship between teachers and students (Mean = 4.23), teachers created time to
advise indiscipline students (mean = 4.41), teachers enter class promptly and leave class
after the bell (Mean = 4.23, and 4.14).
However teachers were unhappy with the administration (Mean = 3.73), did not give
regular assignments to students and did not mark them or provide feedback in time (Mean
= 3.69), teachers left school at the official time (mean = 3.9), teachers created extra time
to support slow learning students (mean = 3.76)

54
Financially the schools were not stable according to mean = 2.69 because the teachers did
not receive their allowances in time (Mean = 2.28), teachers were unable to borrow some
money from school (Mean = 1.73) teachers did not receive sitting allowance (Mean =
1.23) neither were they paid any allowance for extra work they provided (Mean = 3.81).
Student’s academic performance
Students exhibited high performance in terms of grade in examination (mean = 4.4), there
were few cases of late coming (mean = 4.2), students regularly attended classes (mean =
5.0), students always demanded for cross academic programs with other schools and
students were enthusiastically regular on periodic assignments (mean = 4.3). The students
however did not demand for extra lessons outside the normal school timetable (mean =
3.43) neither consulted teachers for further clarifications. Oladejo, Olosunde, Gbolagade,
Amos, and Olawale (2011) noted that given the tight school time table, students rarely
have time for any other activities in most schools in Africa. The findings in Table 4.7
shows that the students performed well in most schools.
The relationship between leadership style and schools performance
The chi-square and regression analysis established that democratic leadership styles
influences student‟s academic achievement/performance due to the fact that, Chi-square
R-value is 0.932. This implies that there is a strong and positive influence of democratic
leadership style on students‟ academic achievement because the R-value nearly equals to
1. Additionally, the relationship is also significant at p=0.004 level. For the case of
Laissez-faireleadership style, the results showed that it is also positively influence

55
students‟ academic performances as the R-value is positive 0.101 and not significant
(p=0.072). Although is positive the relationship is very weak. The laissez-faire leader
tries to give away his powers and does not follow up progress. In most cases, laissez-faire
leaders do not prompt good academic performance because they are too liberal and
flexible. This is why their overall performance is often poor. The findings revealed that
autocratic leadership style strongly (R=0.546) influence school performance but the
relationship is insignificant with p value = 0.081. The result indicated that the autocratic
leadership style negatively influence academic achievement because the r value is
negative as they adopt harsh leadership style which are widely detested by teachers and
students alike. It implies that the more autocratic leadership styles are used, the poorer the
influence on academic achievement.
5.2 Conclusion
5.2.1 The Commonly used Leadership Style in Secondary Schools
There was more employment of autocratic leadership style though evidence of mixed
styles was also found. For instance though much power resided with the head teacher,
teachers were occasionally involved in decision making, the students had the freedom to
express their concerns, the head teacher periodically met the student leaders and
whenever necessary the head teacher addressed all students. The students had the right to
choose their leaders and vote or be voted and whenever students complained about their
teachers, the matter was handled by hearing both sides. However the leadership did not
place suggestion boxes in the school, did not seek student‟s opinions, did not have a
teacher representative in form of patron to the staff and did not periodically remained the

56
students about school values. The school was disorganized, the leadership unable to
provide order in their school, the school took long to respond to school concerns, the
head teacher did not care about student‟s welfare and it was not certain whether the
schools had guideline for students or teachers and the head teacher always lacked or had
answers to emergencies in the school. The head teacher never protected the school from
attacks both within and outside or never punished teachers who misbehaved on students
but was always present in the school
5.2.2 Performance of the secondary schools
Teacher’s behavior
Teachers reported early in the school, that there is a good relationship between teachers
and students, teachers create time to advise indiscipline students and teachers enter class
promptly and leave class after the bell. In some schools teachers were happy with the
administration, gave regular assignments to students, marked them and provided
feedback in time, left school at the official time, created extra time to support slow
learning students and at the beginning of the academic term drew schemes of work and
submitted them to the concerned office. However the teachers did not lead students by
examples and also they did not show enthusiasm in school activities.
Financial stability of the schools
The teachers did not receive their allowances in time, student teachers were not able to
borrow some money from the school in case of personal emergencies, teacher didn‟t

57
receive sitting allowances and the school did not fund student activities. However some
schools paid the teachers extra time taught, PTA payments were received monthly and
student leaders were rewarded as a motivation.
Student’s academic performance
Students exhibited high performance in terms of grade in examination (mean = 4.4), there
were few cases of late coming, students regularly attended classes, students always
demanded for cross academic programs with other schools and students were
enthusiastically regular on periodic assignments. The students however did not demand
for extra lessons outside the normal school timetable neither consulted teachers for
further clarifications.
The relationship between leadership style and schools performance
Academic performance is a weak positively influenced by democratic leadership (R =
0.932, p = 0.004) and laissez-faire (R = 0.101, p = 0.072) but a strong negative (R = -
0.546, p = 0.081) one with autocratic leadership style.
5.3 Recommendation
It is recommended that the MINEDUC provides training to head teachers in order to
enhance their leadership skills. Such trainings would be designed as an in-service so that
they practice concurrently what they learn.
Schools should create leaders network in which they share ideas in regard to school
management. Such networks would be between head teachers, discipline masters,

58
academic masters or teachers. Exchange programs in which teachers visit other schools to
see how different styles are employed would benefit such a network.
The funding of the schools are very little and always fail any good leadership efforts.
Stakeholders need to support school management through contributions so that the school
has enough funds to finance their activities. This would provide the capability of the
school to train leaders, reward best performers sponsor programs designed to support
leadership and management.
5.4 Suggested further studies
i. Effect of school feed program on provision of basic education in Rwanda schools
ii. The role of in-service training on the performance of teachers in public secondary
schools
iii. The relationship between financial resources on the performance of secondary
schools in Rwanda
59
REFERENCES
Abramis, D.J. (1994). Relationship of job stressors to job performance: Linear or an
inverted. Psychology Reports, 75, 547-558.
Acato, Y. (2006, February 21). Quality assurance vital. New vision, university guide
2006/2007.
Achieng OU (2000). “A Study of the Effects of Leadership Styles on Performance in
K.C. S. E. Examination in Nairobi. Unpublished M.Ed. Project, University of
Nairobi.
Aghenta, J.A., 2000. Educational Planning in the 21st
Century. In: Fadipe, J.O. and E.E. Oluchukwu (Ed.), Educational Planning and
Administration in Nigeria in the 21st Century. National Institute for
Educational Planning and Administration, Ondo, pp: 2-6
Allan W, et al., (2002) School Leadership and administration, adopting a cultural
perspective, published by Routled Farmer. Great Britain
Al-safran, E., Brown, D., & Wiseman, A. (n.d.). The effect of principal ‟ s Leadership
style on school environment and outcome. Research in Higher Education Journal,
1–19. Retrieved from http://www.aabri.com/copyright.html
Amabile, T.M. (1979) Effects of external evaluations on artistic creativity. Journal of
Personality and Social Psychology, 37,221 -233
Ambogo, M. M. (2012). The Relationship between Availability of Teaching/Learning
Resources and Performance in Secondary School Science Subjects in Eldoret
Municipality, Kenya. Journal in Emerging Trends in Education Research and
Policy Studies (JETERAPS), 3(4), 530–536.
Bakkabulindi, F.E.K. (2008). Research Methods proto-type notes for MA/Mgt Students.
EAIHESD, School of Education, Makerere University, and Kampala.
Bass, B. (1997). Does the transactional/transformational Leadership transcend? American
Psychologist, 52, 130–139.
Cohen, L., & Manion, L. (1995).Research Methods in Education. Newbury Park: Sage.
Daoust, H (1988) Motivation and educational: A look at some important consequences.
Canadian Psychology

60
Enggelbrecht, P., Oswald, M., & Forlin, C. (2006). Transforming Schools Using the Index for Inclusion in South Africa. Retrieved from
http://en.wikipedia.org/w/index.phd&oldid=450994087
Fullan, P, (1981) Modern principals of the schools need to be able to take on a wide
variety of Roles, technological Education Vol. 13, No. 1
Fullan (1999), Factors Affecting Students‟ Performance in Sixth Grade Modular
Technology Education, Journal of Technology Education, Vol. 13, No. 2.
Gay, L.R & Airasian, P. (2003).Educational Research: Competencies for Analysis and
Applications. (7th
edition).Merril Prentice Hall, USA.
Gitau, E. W. (2010). The Head teachers’ Leadership styles And Their Effects on KCPE
performance in Public Primary Schools in Kandara Division, Muranga District,
Kenya. Nairobi, Nairobi.
Hallinger, P., Bickman, L., & Davis, K. (1996). School context, principal Leadership, and
student Reading achievement. Elementary School Journal, 96(5), 527‐549.
Hallinger, P., & Heck, R. H. (1996). Reassessing the principals’ role in school
effectiveness: A Review of empirical research, 1980‐1995. Educational Administration Quarterly,
Hamillington et al. (2000), Teaching and learning preferences of lecturers and students in
professional education courses in university of Education. Journal of research
and development in education Vol.8, 45-46.
Huka MD (2003). “Study of Head teachers‟ Leadership Styles and Performance of
K.C.S.E Examinations in Secondary Schools in Mandera District.” Unpublished
Med Project, University of Nairobi.
Joy, N. (2013). Influence of secondary school principals’ Leadership styles on students’
performance in Kenya Certificate of Secondary Education in Nairobi County,
Kenya. Nairobi, Nairobi.
Kabuchi, S. N. (2010). Influence of Head teachers’ Leadership Styles On Pupils’
Performance in Kenya Certificate of Primary Education in Westlands District,
Nairobi Kenya
Katana, D. R. (2007). Factors affecting performance in KCPE Examination In
primaryschools in Malindi District. Nairobi.
Kendra, C. (2011). Leadership Styles. Retrieved from www.personalitybook.com
Kicukiro District. (2015). School Performance report 2015. Kigali City.

61
Kimacia MK (2007). “Relationship between Head teachers’ Leadership Styles and Girl Student Performance in K.C.S.E in Public Secondary Schools in Narok District.
Unpublished M.Ed. Project, University of Nairobi.
Kothari, C.R. (1985). Research Methodology: Methods and Techniques. New Delhi: New
Age International Publishers.
Lawrie, A. (1992). Managing quality of service. London: Directory of Social Change.
Leadwood, K. A., Aitken, R., &Jantzi, D. (2001).Making schools smarter: A system for
Monitoring school and district progress. Thousand Oaks, CA: Corwin Press.
Leithwood, K. A., Jantzi, D., & Steinbach, R. (1999).Changing Leadership for changing
times. Buckingham, UK: Open University Press.
Lynch, K. (1996). School improvement: The role of the investors in people standard.
Stratford-upon-Avon: National Association of Grant Maintained Primary Schools.
Miller and Rowan. (2006). Effects of Organic Leadership on Student Achievement
American Educational Research Journal 43 no2 summer, 2006.
Ministry of Education (2006) Consolidation Act No. 170 of 2 June 2006. Ministry of
Education.
Ministry of Education (2011) Annual Education Report 2010 Featuring Nursery, Primary
Secondary, Literacy and special education
Moos, L. (2008) what kinds of democracy in educational are facilitated by supra- and
Transnational agencies? European Educational Research Journal
Mouton, J.S. and R.R. Black, 1994. Synergogy. San Francisco, Jossey - Base.
Mugo, W. . (2008). Factors Affecting Performance in KCPE Examination In Primary
Schools in Moyale District. Nairobi, Nairobi.
Muli MM (2005).Effects of Head teachers Leadership Styles on Performance in Physics
at K.C.S.E Examination in Mutomo Division, Kitui District.” Unpublished Med
Project, University of Nairobi.
Mwakipesile, A. P. (2015). Absenteesim and academic performance among the girl child
in community secondary schools in Morogoro District Tanzania. Mount Kenya.
Mwaura, W. W., & Thinguri, R. (2014). A Theoretical and Empirical Review of the
Relationship between Head Teachers ‟ Leadership Styles and KCPE Performance in
Public Primary Schools in Kenya. Journal of Education and Practice, 5(25), 123–
130.

62
Nwadian, 1998. Educational Management for Sub-Saharan African. Nigeria Society for Educational Planning.
Nwankwo, J. I. (1982). Educational Administration: Theory and Practice. Ibadan: Bisi
Books Nigeria Ltd.
Nworgu, B.G., 1991. Educational Research: Basic Issues and Methodology. Wisdom
Publisher Ltd., Ibadan.
Obilade, S. O. (1989). Introduction to Educational Administration. Ibidan: Odusote
Bookstore Ltd.
Obilan A. (2017). School leadership styles and students’ academic performance in
secondary schools in Kicukiro district – Rwanda. Scholars‟ press.SIA
OmniScriptum Publishing Germany.
Ojacor, A. (2006). Research Methodology: A Guide to Social Research Process.
Kampala.
Patricia, N. M. (2012). Influence of Headteachers ’ Leadership Styles on Pupils ’
Performance in Kenya Certificate of Primary Education in Mbooni Division , Kenya
Patricia Nthoki Muia A Research Project Submitted in Partial Fulfillment for the
Requirements for the Degree of Mast. Nairobi, Nairobi.
Pfeffer and Coote (1991).Is Quality Good for You? A Critical review of Quality
Assurance in the Welfare Services, Institute of Public Policy Research, London.
Rilez, P. (2003). The Administrative process. Prentice Hall Inc. Englewood Cliffs, New
Jersey.
Ross, J. A., & Gray, P. (2006). Transformational Leadership and teacher commitment to
Organizational values: The mediating effects of collective teacher efficacy.
School Effectiveness and School Improvement, 17(2), 179‐199.
Simon R.P .Clarke, Thomas A. (2009). School level Leadership in post conflict society.
White, B. (2002). Writing Your MBA Dissertation. London: Thomson Learning.
Witziers, B., Bosker, R. J., & Kruger, M. L. (2003). Educational Leadership and student
Achievement: The elusive search for an association. Educational Administration
Quarterly, 39(3), 398‐425.

63
APPENDICES

64
APPENDIX A: QUESTIONNAIRES
LEADERSHIP STYLES AND PERFORMANCE OF SECONDARY SCHOOLS IN
NYARUGENGE DISTRICT - RWANDA
Dear Respondent,
I, Bizumuremyi Steven a master of education student carrying out a thesis research and
you have been selected to take part in a research study entitled: Leadership styles and
Performance of secondary schools in Rwanda. A Case Study of Nyarugenge District
Schools. The research is my academic work being conducted as a requirement for Partial
Fulfillment of requirement for the Award of the Degree of Master of Educational
Planning, Management and Administration.
Instructions:
Kindly answer the questions that are in this questionnaire. Using the scales assigned to
each statement, indicate by ticking (√) the appropriate bracket that answers the questions.
Please do not write your name.
i. Please tick [√] the correct response from the options given.
ii. Use a pen and not pencil to answer this questionnaire.
BIZUMUREMYI STEVEN

65
APPENDIX D.1 QUESTIONNAIRE FOR ADMINISTRATORS AND TEACHERS
Date …………/ /2017
Name of school …………………………………………………………………………..
A: Demographic information
1. Gender of respondent
i. Male ( )
ii. Female( )
2. Marital status
i. Married ( )
ii. Single ( )
iii. Divorced ( )
iv. Widow/Widower ( )
3. Age
i. 25- below ( )
ii. 26-35 ( )
iii. 36-45 ( )
iv. 46-55 ( )

66
v. 56- Above ( )
4. Education Qualifications ( tick (√) the appropriate)
i. Diploma in education ( )
ii. B.A with education ( )
iii. B.Sc. with education ( )
iv. M.A Education ( )
v. M.Sc. ( )
vi. Others (Please specify)
……………………………………………………………………
5. Work experience
i. 1-3 years ( )
ii. 4-6 ( )
iii. 7-9 ( )
iv. 10-above ( )
6. Administrative status (Tick (√) the appropriate one)
i. Head Teacher ( )
ii. Deputy Head Teacher ( )
iii. Director of studies ( )
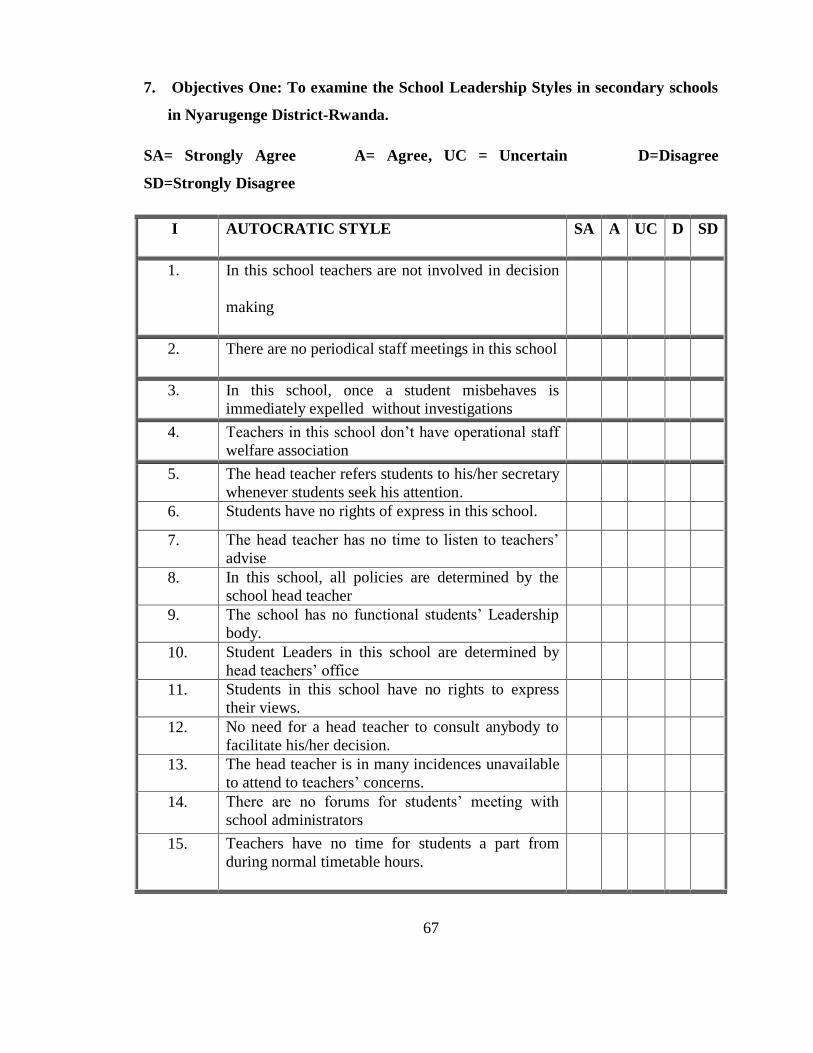
67
7. Objectives One: To examine the School Leadership Styles in secondary schools
in Nyarugenge District-Rwanda.
SA= Strongly Agree A= Agree, UC = Uncertain D=Disagree
SD=Strongly Disagree
I AUTOCRATIC STYLE SA A UC D SD
1. In this school teachers are not involved in decision
making
2. There are no periodical staff meetings in this school
3. In this school, once a student misbehaves is
immediately expelled without investigations
4. Teachers in this school don‟t have operational staff
welfare association
5. The head teacher refers students to his/her secretary
whenever students seek his attention.
6. Students have no rights of express in this school.
7. The head teacher has no time to listen to teachers‟
advise
8. In this school, all policies are determined by the
school head teacher
9. The school has no functional students‟ Leadership
body.
10. Student Leaders in this school are determined by
head teachers‟ office
11. Students in this school have no rights to express
their views.
12. No need for a head teacher to consult anybody to
facilitate his/her decision.
13. The head teacher is in many incidences unavailable
to attend to teachers‟ concerns.
14. There are no forums for students‟ meeting with
school administrators
15. Teachers have no time for students a part from
during normal timetable hours.

68
16. The head teacher does not socialize with anyone in
the school
17. Teachers are not allowed to express their concerns
in this school
II. DEMOCRATIC STYLE SA A UC D SD
1. There is maximum involvement of students in the
school administration.
2. School rules, values and regulation manuals are
displayed for students‟ easy access on notice boards
& library.
2. Students have freedom of speech to communicate
their concerns.
3. In this school the head teacher meets student
Leaders periodically.
4. The head teacher addresses all students whenever
necessary.
5. There is a suggestion box in this school where
students freely drop their concerns and given
considerable attention.
6. The head teacher periodically updates students
about the progress of the school and seeks students‟
opinion.
7. The school has a patron of student Leaders to
present students‟ concerns in staff meetings.
8. Students are given due opportunity to choose / elect
Leaders of their choice.
9. All students have equal rights to vote or be voted in
students‟ politics of this school.
10. Periodically students are reminded over school
values.
11. Once students complain about a teacher, the issue is
given due respect and dealt with accordingly.
12. Students‟ representatives are invited during
students‟ disciplinary meetings.
13. Teachers create set classroom policies inclusively.
III. LAISSEZ FAIRE STYLE SA A UC D SD

69
1. There is disorganization in this school.
2. The school has no guidelines for students/teachers.
3. The head teacher takes very long to respond to the
school concerns
4. The head teacher does not protect the school
against intrinsic and extrinsic attacks.
5. The head teacher always lacks answers to
emergencies in the school
6. The head teacher does not punish teachers who
misbehave on students.
7. The head teacher doesn‟t punish students who
misconduct themselves
8. In this school the head teacher does not care about
students‟ welfare.
9. The head teacher has no time to listen to students.
10. The school head teacher is always absent at school.
11. Teachers are less concerned with students‟ welfare.
8. Objectives Two: To Determine the level of Performance of secondary schools in
Nyarugenge District-Rwanda.
SA= Strongly Agree A= Agree D=Disagree SD=Strongly Disagree
I Statement SA A UC D SD
Teacher behavior
a. Teacher in this school report to school early
b. Teachers are happy with the school administration
c. There is good relationship between teachers and
students in this school
d. Teacher create time to advise/ counsel indiscipline
students

70
e. Teacher enter classes to teach in promptly
f. Teachers leave classes after the end lesson bell has been
rang
g. Teachers in this school lead students by example
h. Teachers give regular assignments to students, mark
them and give feedback in time
i. Teachers in this school enthusiastically participate in
school activities
j. Teacher in this school leave school at the official time
k. Teachers create extra time to support slow learning
students
l. Teachers at the beginning of academic every term draw
schemes of work and submit them to the concerned
office
II Financial Stability
SA A UC D SD
a. In this school teacher receive allowances in time
b. In this school students teacher are able to borrow money
from the school in case of personal emergency
c. Teachers in this school get sitting allowances whenever
they have staff meeting
d. Teachers in this school are paid for extra time teaching
e. Teacher receive PTA payments in every month
f. The school funds students‟ activities
g. In this school Student leaders are rewarded to motivate
them
III Students’ Academic Performance SA A UC D SD
1) Students of this school exhibit high performance in
terms of grades in examinations.
2) In this school we experience few cases of late coming.
3) Students regularly attend classes in this school.
4) Students always consult teachers for further
clarifications about their subjects.

71
5) Students demand for extra lessons outside normal
school timetable.
6) Students often demand for cross academic programmes
with other schools.
7) Students enthusiastically welcome regular or periodical
assignments.