leading a healthcare lean transformation - home | uw … · leading a healthcare lean...
TRANSCRIPT
Leading a Healthcare Lean Transformation
Jill Case-Wirth, VP Operations, CNO
Raymond Georgen, MD, FACS
Heather Murphy, ICU Manager
Copyright © 2009. All Rights Reserved3
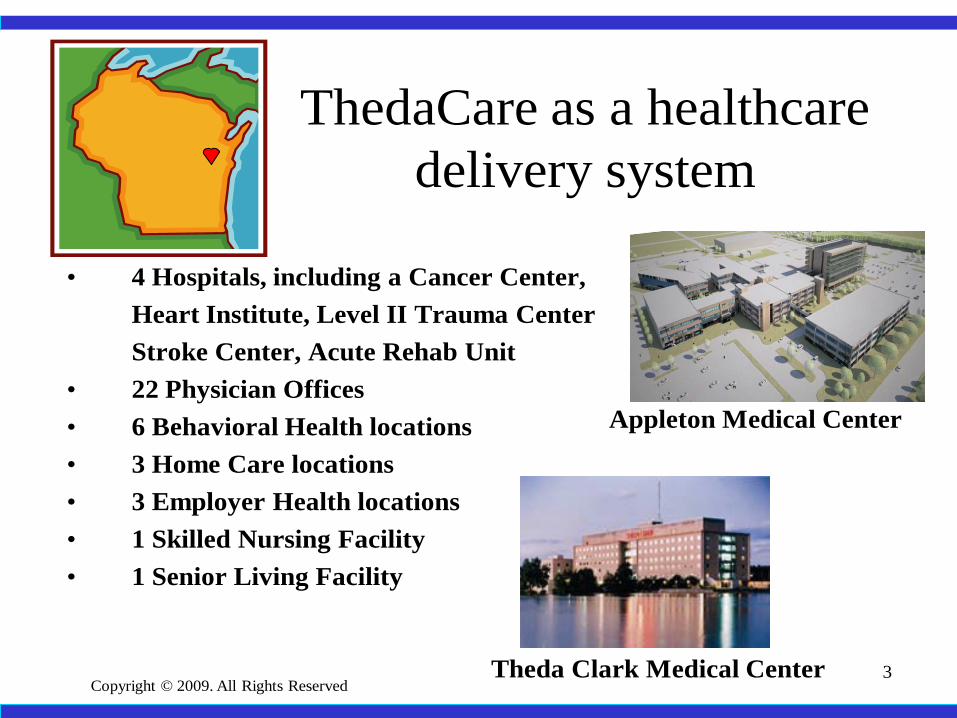
ThedaCare as a healthcare delivery system
• 4 Hospitals, including a Cancer Center,Heart Institute, Level II Trauma CenterStroke Center, Acute Rehab Unit
• 22 Physician Offices• 6 Behavioral Health locations• 3 Home Care locations• 3 Employer Health locations• 1 Skilled Nursing Facility• 1 Senior Living Facility
Theda Clark Medical Center
Appleton Medical Center

Transforming Healthcare
ThedaCare’s Redesign Equation:
Quality
Cost
Saving Lives and Transforming Healthcare
Copyright © 2010 ThedaCare. All Rights Reserved.
= Value
Lean Technology as a Tool to create better value
“Lean is a set of concepts, principles and tools used to create and deliver the most Value
from the Customers’ perspective while consuming the fewest resources and fully utilizing the skills and knowledge of those
who do the work.”-Lean Enterprise Institute
Copyright © 2010 ThedaCare. All Rights Reserved
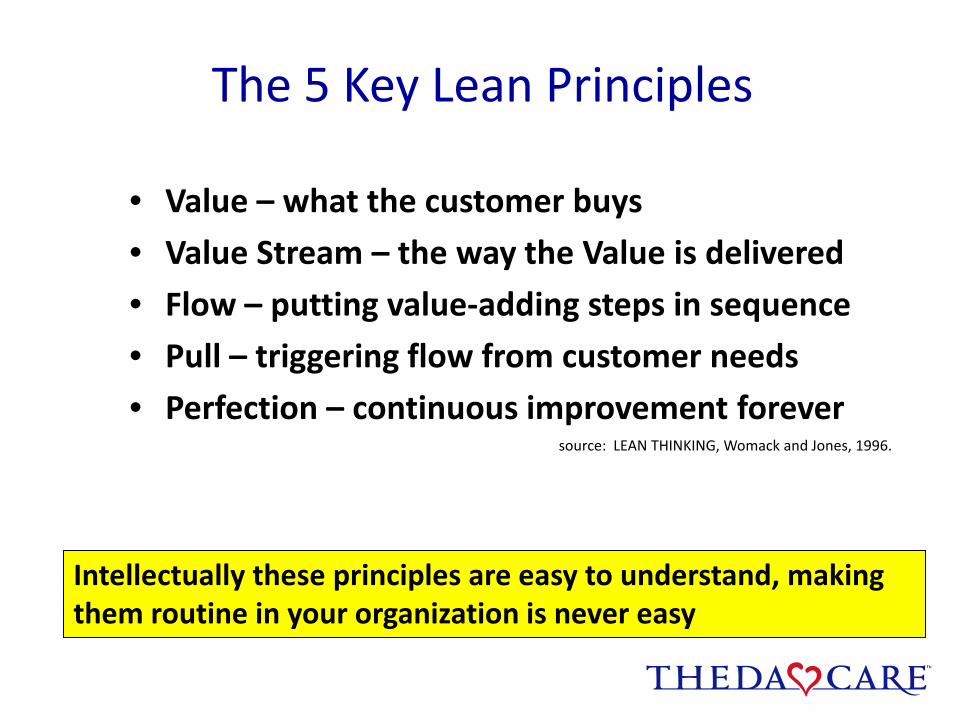
The 5 Key Lean Principles
• Value – what the customer buys
• Value Stream – the way the Value is delivered
• Flow – putting value-adding steps in sequence
• Pull – triggering flow from customer needs
• Perfection – continuous improvement foreversource: LEAN THINKING, Womack and Jones, 1996.
Intellectually these principles are easy to understand, making them routine in your organization is never easy
Wha
t is Le
an ?
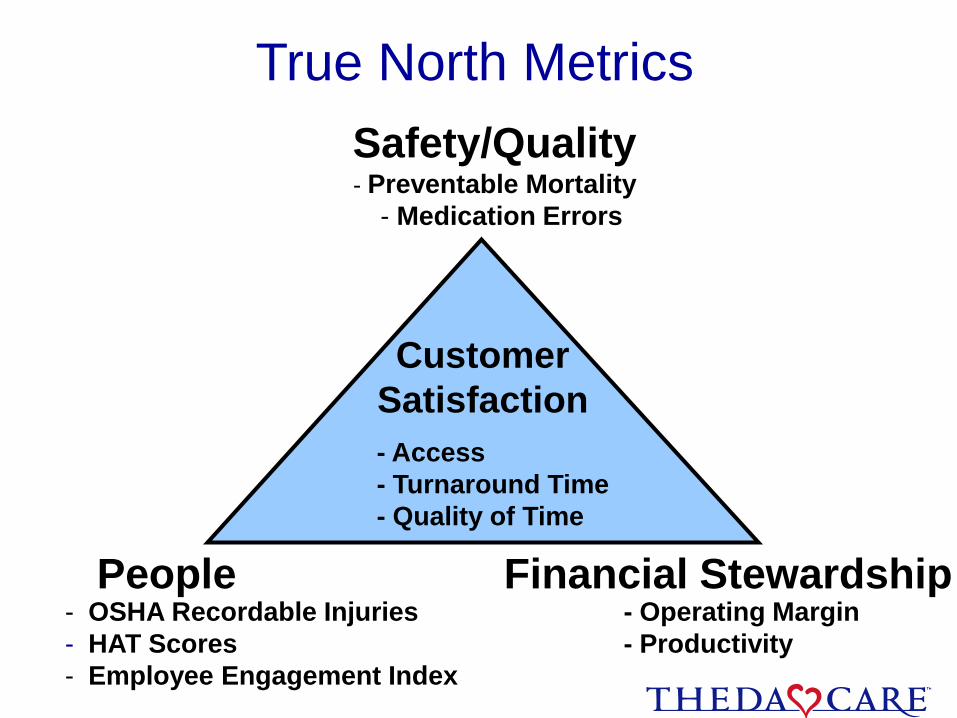
- OSHA Recordable Injuries- HAT Scores- Employee Engagement Index
- Operating Margin- Productivity
Financial StewardshipPeople
Safety/Quality- Preventable Mortality
- Medication Errors
- Access- Turnaround Time- Quality of Time
CustomerSatisfaction
True North Metrics

Copyright 2010 All rights reserved
Ideal State Information FlowStaff Staff Staff
Lead
CEO
VP
Sr VP
Super-visor
Level 1
StrategyGoalsPurpose•Mentoring•Teaching•Barrier Removal•Strategy•True North
Status of the Business:•Information•Continuous Improvement•Metrics•Escalation
Manager
Level 2
Level 3
Level 4
Level 5
Level 6
Level 7
•Goals•Tactical Management
•Control•Daily assessment
•50-75% Standard Work
•Executive Functions•Strategic
•Innovative•Weekly/Monthly Assessment
•10-25% Standard Work
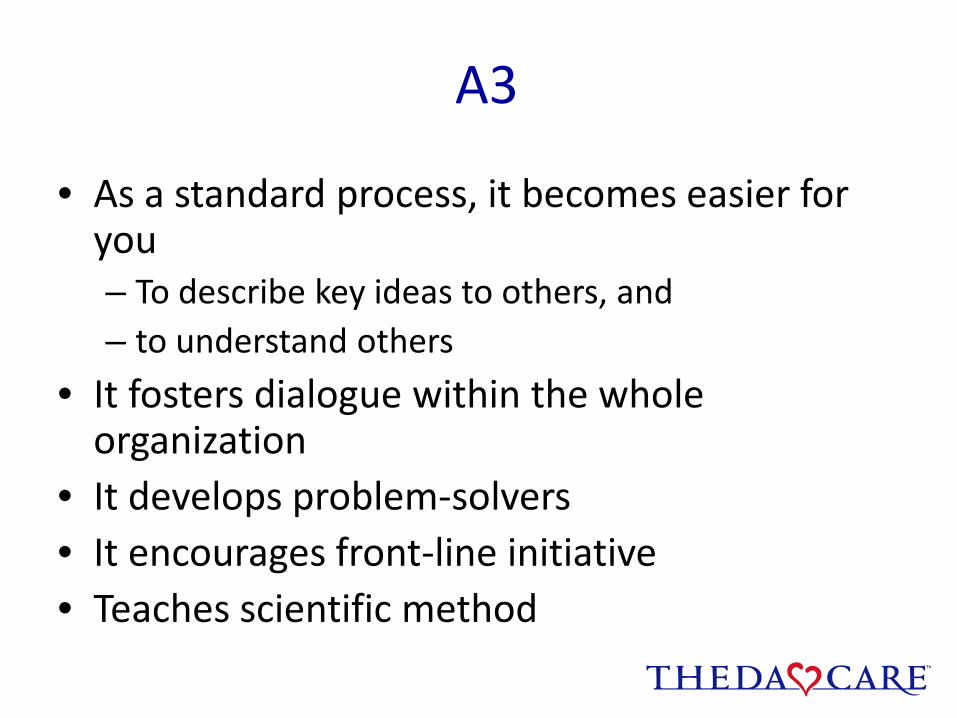
A3
• As a standard process, it becomes easier for you – To describe key ideas to others, and– to understand others
• It fosters dialogue within the whole organization
• It develops problem-solvers• It encourages front-line initiative• Teaches scientific method
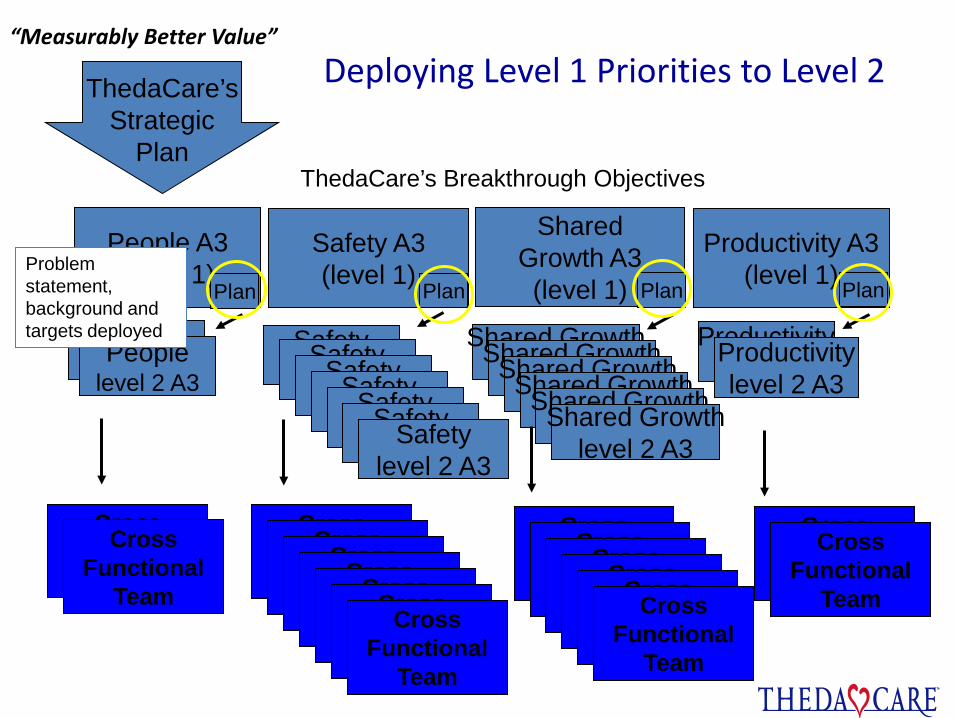
Deploying Level 1 Priorities to Level 2ThedaCare’sStrategic
Plan
Safety(level 2)
People(level 2)Peoplelevel 2 A3
Safety(level 2)Safety
(level 2)Safety(level 2)Safety
(level 2)Safety(level 2)Safetylevel 2 A3
Shared Growth(level 2)Shared Growth
(level 2)Shared Growth(level 2)Shared Growth
(level 2)Shared Growth(level 2)Shared Growthlevel 2 A3
Productivity(level 2)Productivitylevel 2 A3
Safety A3(level 1)
People A3(level 1)
SharedGrowth A3(level 1)
Productivity A3(level 1)
Plan Plan Plan Plan
ThedaCare’s Breakthrough Objectives
“Measurably Better Value”
Cross Function
Team
Cross Functional
Team
Cross Function
Team
Cross Function
Team
Cross Function
Team
Cross Function
Team
Cross Function
Team
Cross Function
Team
Cross Functional
Team
Cross Function
Team
Cross Function
Team
Cross Function
Team
Cross Function
Team
Cross Function
Team
Cross Functional
Team
Cross Function
Team
Cross Functional
Team
Problem statement, background and targets deployed
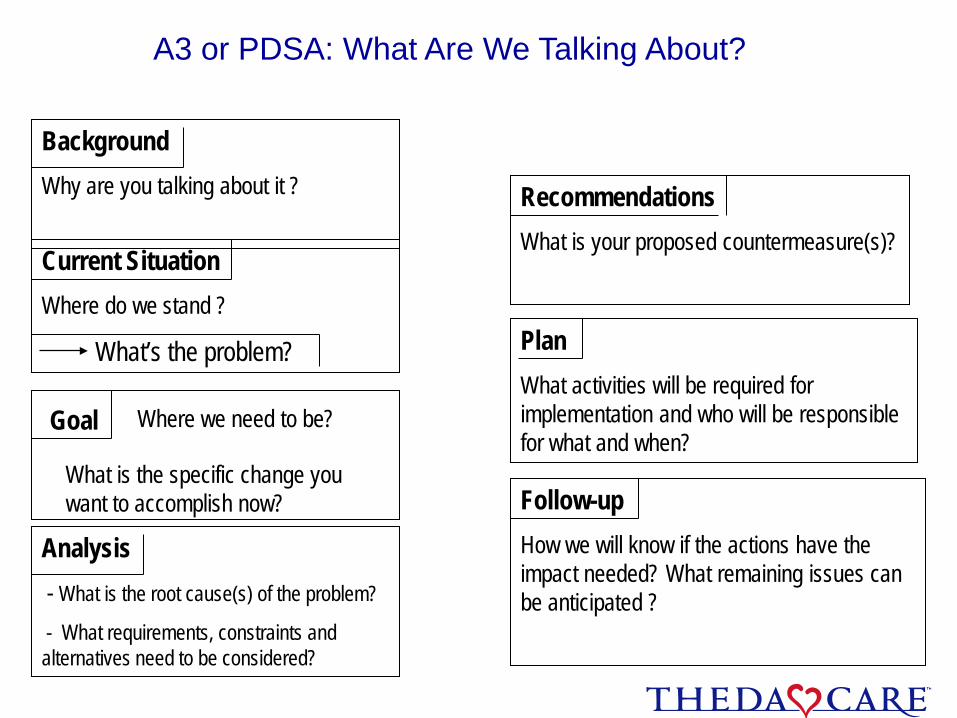
BackgroundWhy are you talking about it ?
Current SituationWhere do we stand ?
What’s the problem?
Analysis- What is the root cause(s) of the problem?
- What requirements, constraints and alternatives need to be considered?
Goal Where we need to be?
What is the specific change you want to accomplish now?
PlanWhat activities will be required for implementation and who will be responsible for what and when?
RecommendationsWhat is your proposed countermeasure(s)?
Follow-upHow we will know if the actions have the impact needed? What remaining issues can be anticipated ?
A3 or PDSA: What Are We Talking About?
12
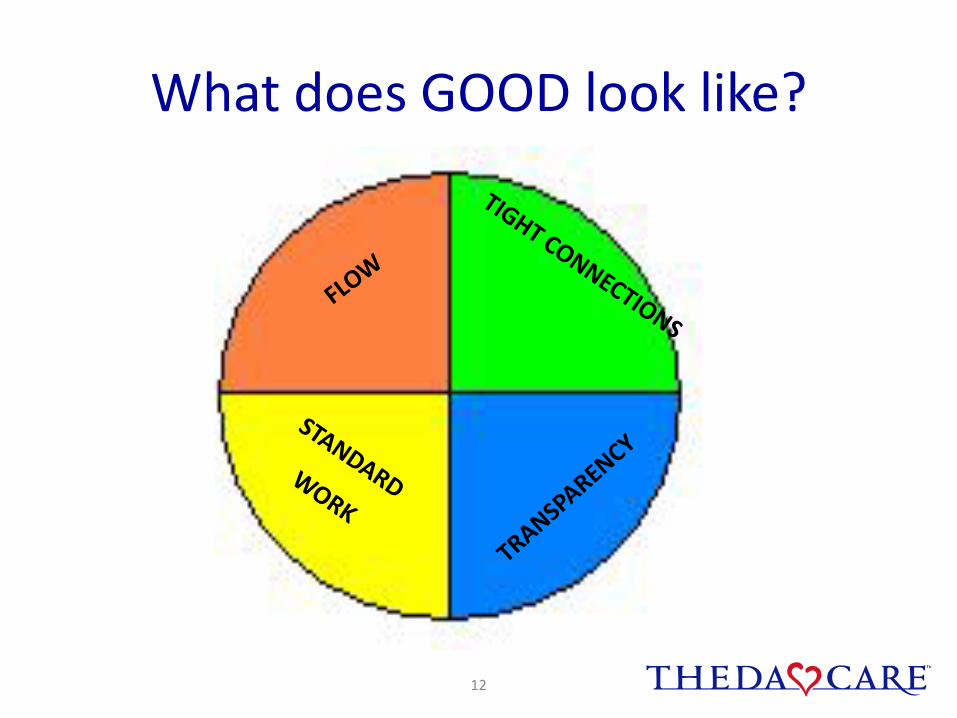
What does GOOD look like?
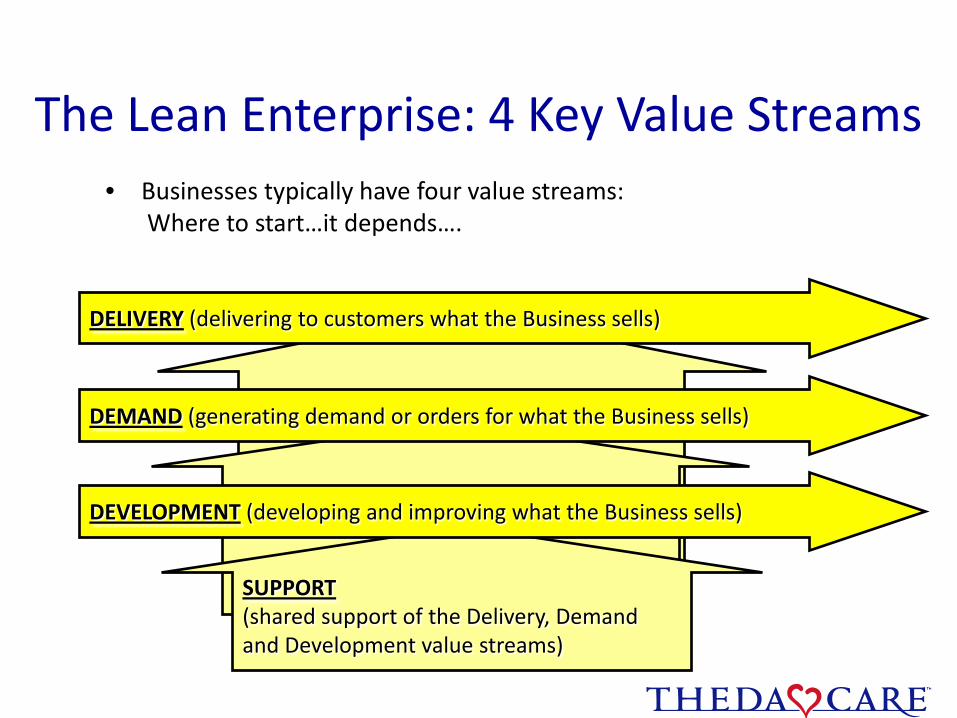
SUPPORT(shared support of the Delivery, Demandand Development value streams)
The Lean Enterprise: 4 Key Value Streams• Businesses typically have four value streams:
Where to start…it depends….
DELIVERY (delivering to customers what the Business sells)
DEMAND (generating demand or orders for what the Business sells)
DEVELOPMENT (developing and improving what the Business sells)
Wha
t is Le
an ?
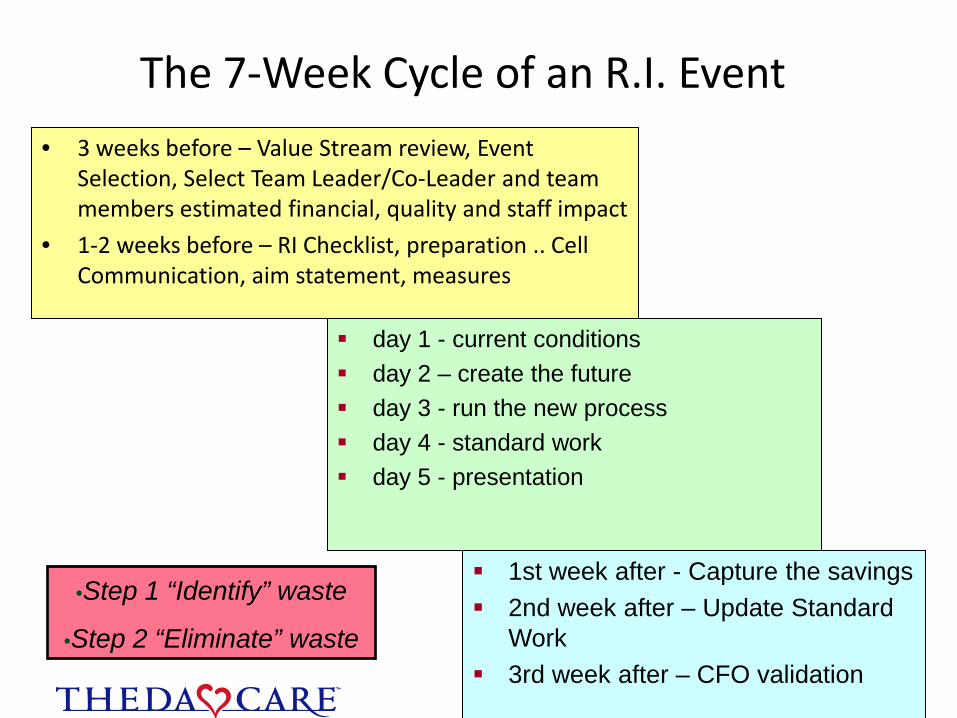
The 7-Week Cycle of an R.I. Event• 3 weeks before – Value Stream review, Event
Selection, Select Team Leader/Co-Leader and team members estimated financial, quality and staff impact
• 1-2 weeks before – RI Checklist, preparation .. Cell Communication, aim statement, measures
day 1 - current conditions day 2 – create the future day 3 - run the new process day 4 - standard work day 5 - presentation
1st week after - Capture the savings 2nd week after – Update Standard
Work 3rd week after – CFO validation
•Step 1 “Identify” waste
•Step 2 “Eliminate” waste
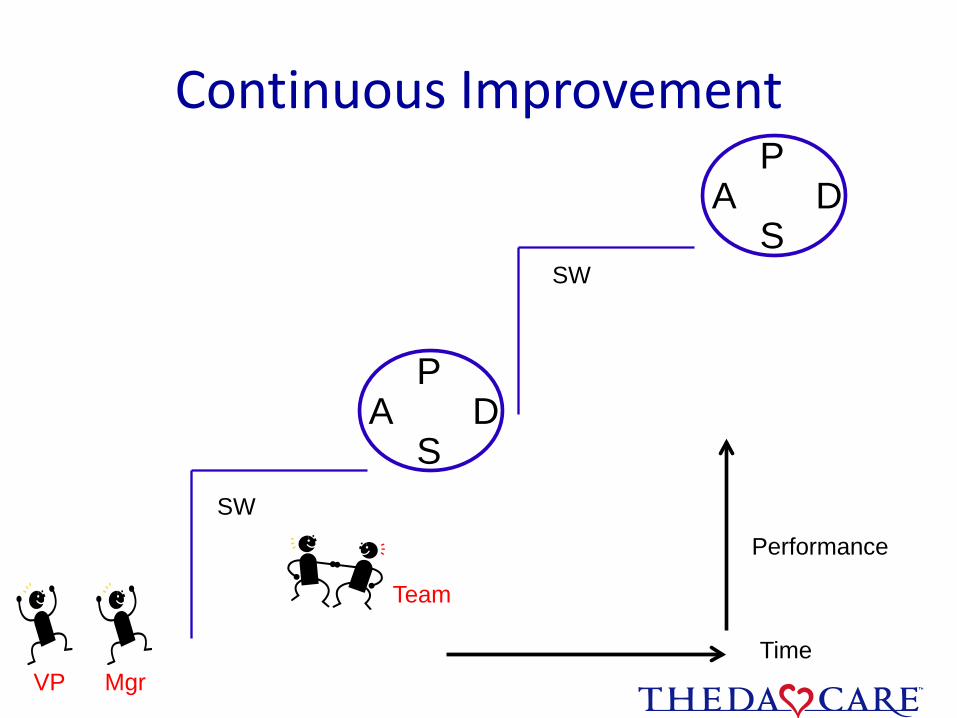
Continuous Improvement
SW
SW
DP
SA
Team
Time
Performance
DP
SA
VP Mgr

91
6552
37 3745
0
10
20
30
40
50
60
70
80
90
100
2005 2006 2007 2008 2009 2010
Min
utes
Year
AMC Code Stemi Door to Balloon 2005-2010(Goal 60 min)
CODE STEMI
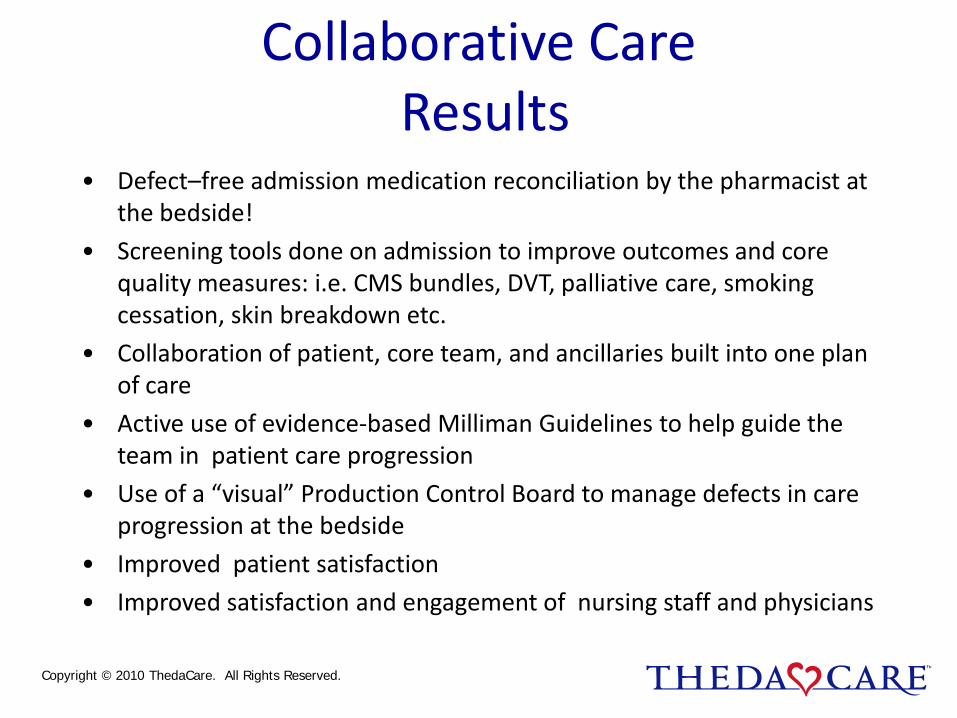
Collaborative CareResults
• Defect–free admission medication reconciliation by the pharmacist at the bedside!
• Screening tools done on admission to improve outcomes and core quality measures: i.e. CMS bundles, DVT, palliative care, smoking cessation, skin breakdown etc.
• Collaboration of patient, core team, and ancillaries built into one plan of care
• Active use of evidence-based Milliman Guidelines to help guide the team in patient care progression
• Use of a “visual” Production Control Board to manage defects in care progression at the bedside
• Improved patient satisfaction
• Improved satisfaction and engagement of nursing staff and physicians
Copyright © 2010 ThedaCare. All Rights Reserved.
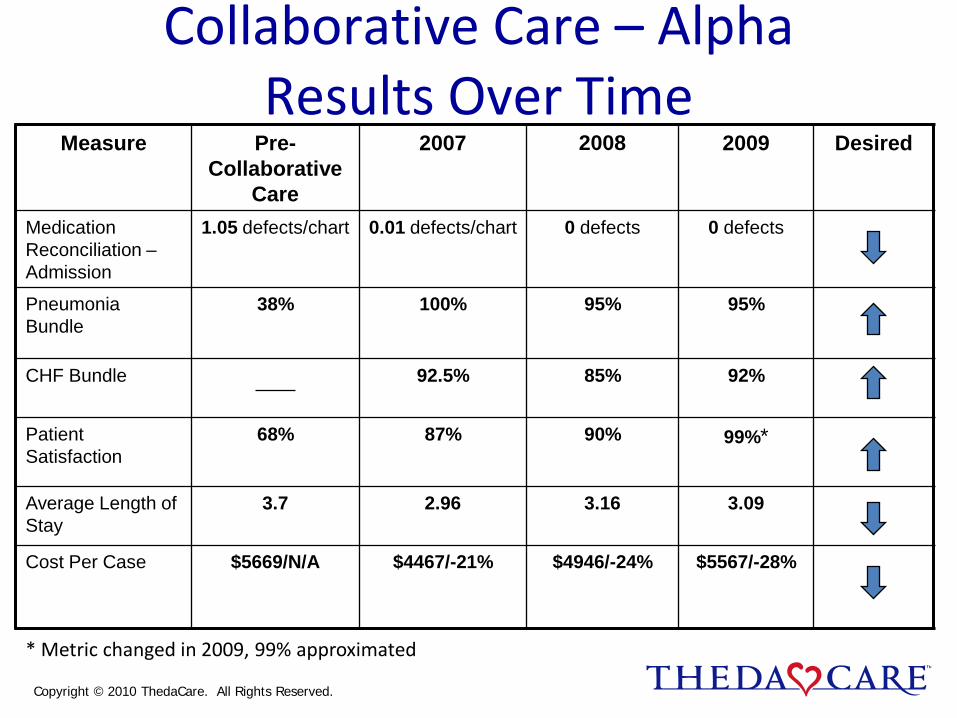
Measure Pre-Collaborative
Care
2007 2008 2009 Desired
Medication Reconciliation –Admission
1.05 defects/chart 0.01 defects/chart 0 defects 0 defects
Pneumonia Bundle
38% 100% 95% 95%
CHF Bundle 92.5% 85% 92%
Patient Satisfaction
68% 87% 90% 99%*
Average Length of Stay
3.7 2.96 3.16 3.09
Cost Per Case $5669/N/A $4467/-21% $4946/-24% $5567/-28%
Collaborative Care – AlphaResults Over Time
* Metric changed in 2009, 99% approximated
Copyright © 2010 ThedaCare. All Rights Reserved.
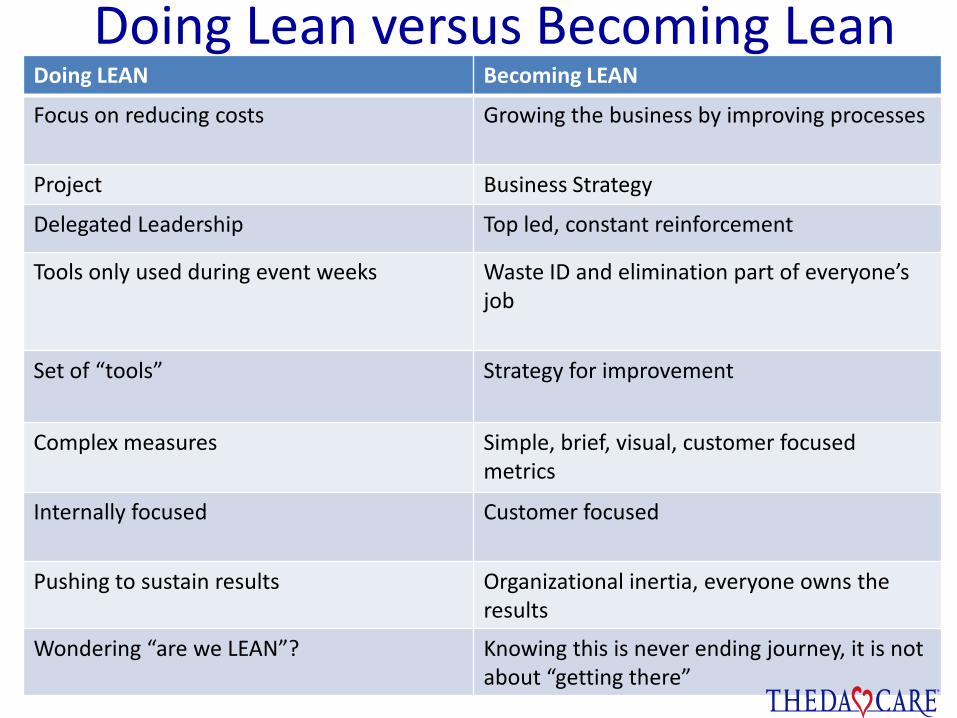
Doing Lean versus Becoming LeanSu
mm
ary
Doing LEAN Becoming LEAN
Focus on reducing costs Growing the business by improving processes
Project Business Strategy
Delegated Leadership Top led, constant reinforcement
Tools only used during event weeks Waste ID and elimination part of everyone’s job
Set of “tools” Strategy for improvement
Complex measures Simple, brief, visual, customer focused metrics
Internally focused Customer focused
Pushing to sustain results Organizational inertia, everyone owns the results
Wondering “are we LEAN”? Knowing this is never ending journey, it is not about “getting there”

On the Mend:Revolutionizing Healthcare to Save Lives and Transform
the Industry
1. Focus on the patient in order to determine the real value desired.
2. Identify the value stream providing this value to identify where value is actually created while removing massive amounts of waste
3. Reduce the time required to go from start to finish along every pathway.
4. Pursue principles 1, 2, and 3 endlessly through continuous improvement that engages everyone – doctors, nurses, technicians, managers, suppliers, and patients and their families -- touching the patient pathways.
Jim Womack, Lean Enterprise Institute, Inc; June 2010
Copyright © 2010 ThedaCare. All Rights Reserved.
Redesign of ICU
Space and Process
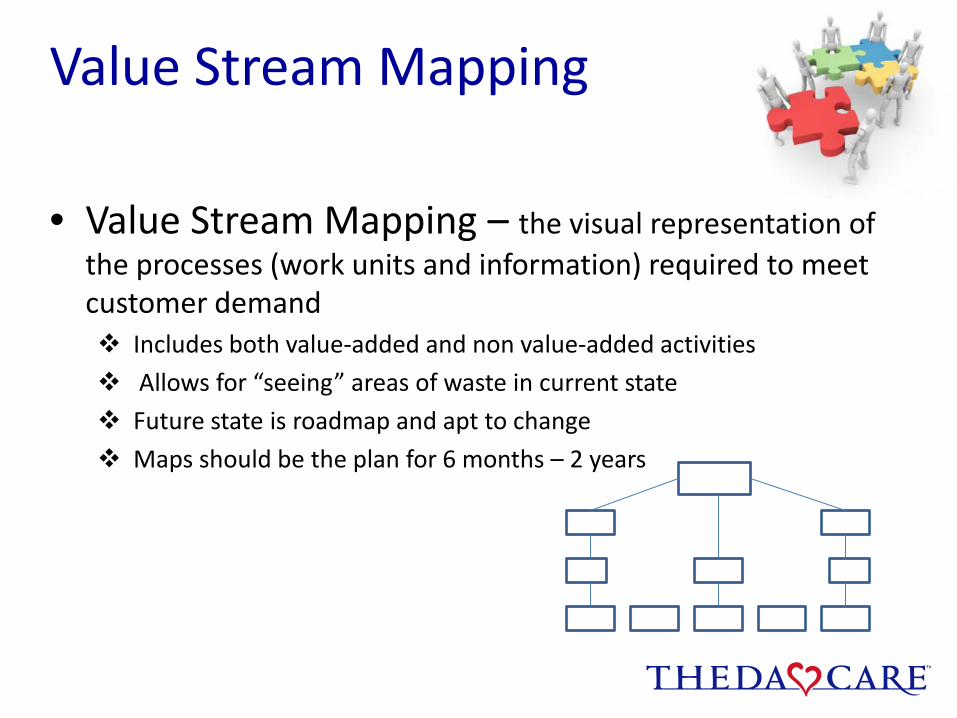
Value Stream Mapping
• Value Stream Mapping – the visual representation of the processes (work units and information) required to meet customer demand Includes both value-added and non value-added activities
Allows for “seeing” areas of waste in current state
Future state is roadmap and apt to change
Maps should be the plan for 6 months – 2 years
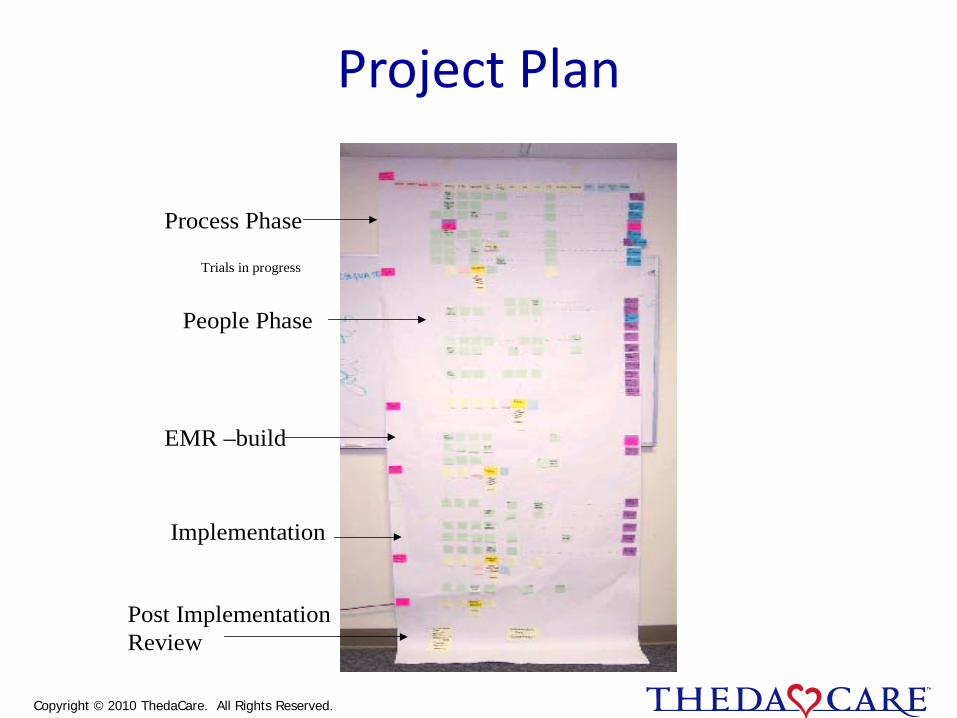
Project Plan
Process Phase
People Phase
Trials in progress
EMR –build
Implementation
Post Implementation Review
Copyright © 2010 ThedaCare. All Rights Reserved.
Intense 4 day knowledge building session
Multidisciplinary team of experts brainstorm and share information to kick-off the design process
Gain deeper understanding of cultural, process and spatial needs of project
Builds trust amongst team members
Team takes ownership
Accelerates design schedule
Facilitated by Simpler and ThedaCare Improvement System staff
The 2P (Preparation and Process)
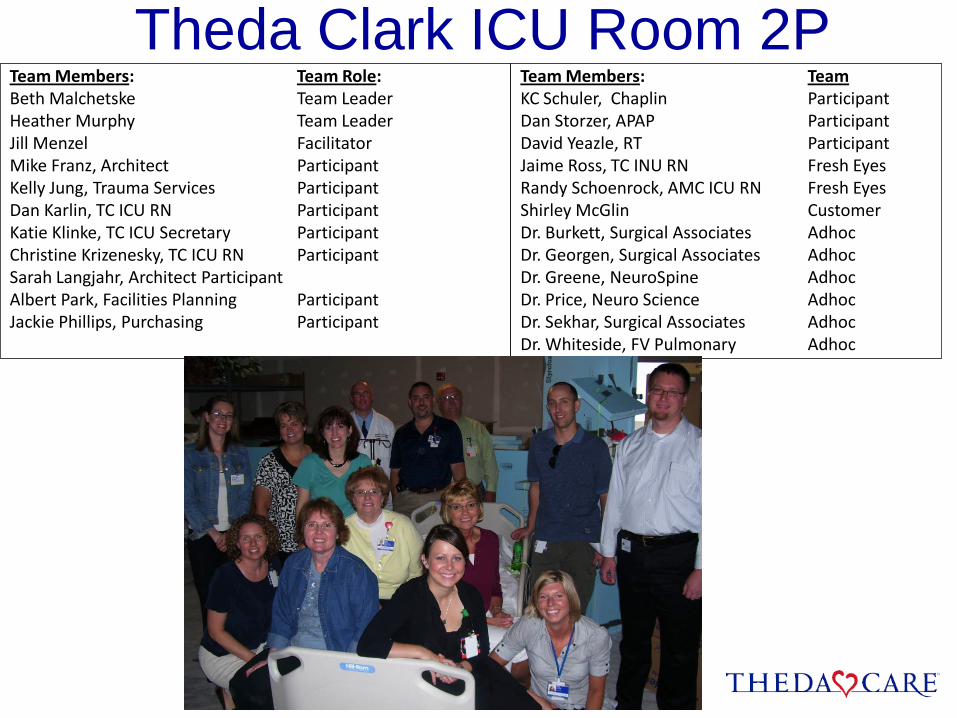
Team Members: Team Role:Beth Malchetske Team LeaderHeather Murphy Team LeaderJill Menzel FacilitatorMike Franz, Architect ParticipantKelly Jung, Trauma Services ParticipantDan Karlin, TC ICU RN ParticipantKatie Klinke, TC ICU Secretary ParticipantChristine Krizenesky, TC ICU RN ParticipantSarah Langjahr, Architect ParticipantAlbert Park, Facilities Planning ParticipantJackie Phillips, Purchasing Participant
Theda Clark ICU Room 2PTeam Members: Team KC Schuler, Chaplin ParticipantDan Storzer, APAP ParticipantDavid Yeazle, RT ParticipantJaime Ross, TC INU RN Fresh EyesRandy Schoenrock, AMC ICU RN Fresh EyesShirley McGlin CustomerDr. Burkett, Surgical Associates AdhocDr. Georgen, Surgical Associates AdhocDr. Greene, NeuroSpine AdhocDr. Price, Neuro Science AdhocDr. Sekhar, Surgical Associates AdhocDr. Whiteside, FV Pulmonary Adhoc
Reason for Action The ThedaClark ICU will be relocating to a newly designed unit on the 2nd Floor as a
part of Hospital of the Future Initiative. In order to optimize an improved room layout, the following areas need to be addressed:
• It is challenging in the current physical space to perform key patient processes
• Provider frustration due to intermediate bed capacity issues
• Lack of effective space for families to be involved in the patient progression of care
• Hunting and gathering of supplies and equipment takes care team away from patient care
Scope: Intensive Care Unit and Intermediate Care Unit Patient Rooms
Initial State The current ICU process flows are a result of the 1st Floor location which has limited space
and is not adjacent to intermediate level of care
Currently the ICU and INU are on separate floors which results in:
• A failure to optimize staff with similar skill sets
• An increase in patient transfers, handoffs, and care team changes.
• No association between units even though they provide similar services The current ICU Room Layout results in waste and defects:
• Nurses spend an average of 4.2% of their time outside the patient room looking for supplies, equipment, etc.
• The average nurse travels 197 feet per hour when treating patients
• The average respiratory therapist travels 474 feet per hour when treating patients
• Rooms are crowded when families are visiting making it difficult to provide care
• In room procedures are inefficient due to lack of supplies and equipment accessible to staff.
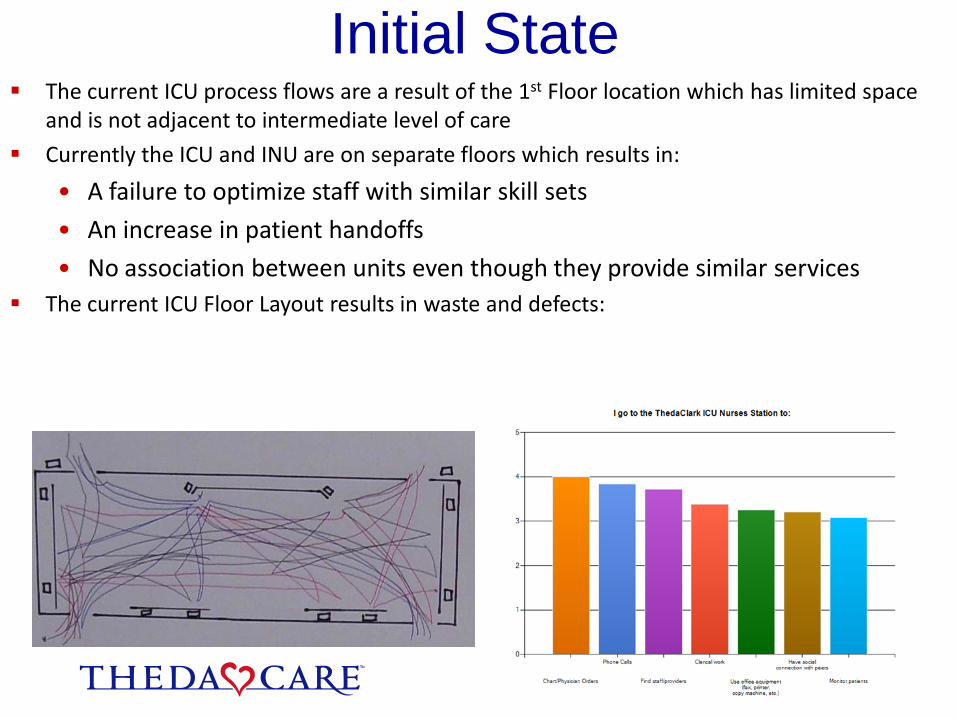
Initial State The current ICU process flows are a result of the 1st Floor location which has limited space
and is not adjacent to intermediate level of care
Currently the ICU and INU are on separate floors which results in:
• A failure to optimize staff with similar skill sets
• An increase in patient handoffs
• No association between units even though they provide similar services The current ICU Floor Layout results in waste and defects:
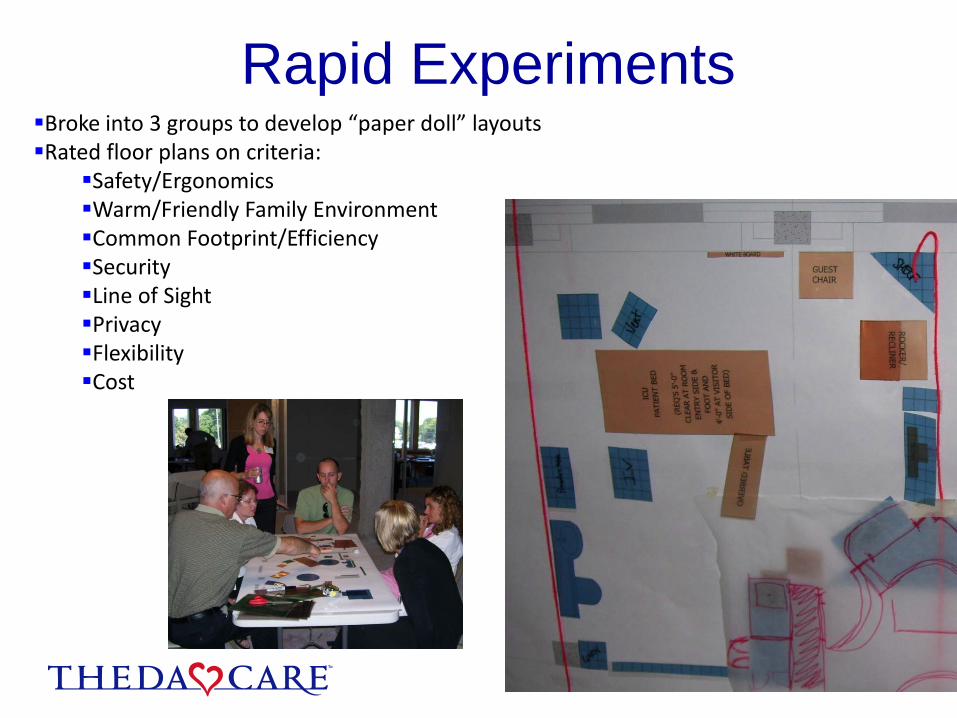
Broke into 3 groups to develop “paper doll” layoutsRated floor plans on criteria:
Safety/ErgonomicsWarm/Friendly Family Environment Common Footprint/EfficiencySecurityLine of SightPrivacyFlexibilityCost
Rapid Experiments

Target State Space that allows family to feel welcome and present for their loved one.
Intermediate Level space that have the ability to go to ICU acuity during surges
Measure Initial Target
Quality % of Patients Satisfied with ICU Family Areas 0% 90%
% of ICU Patient Rooms that are in the care team’s line of sight
38% > 90%
# Interruptions when charting in Nurses Station 5.5 times per hour 2.8 times per hour
Business # of Interruptions to Patient Care per day to search for supplies and equipment
360 times per day on the unit
120 times per day on the unit
Employee Engagement
TC ICU physical space supports a private consultation process
No Yes
Time for workforce response to team need 0-5 minutes 0-3 minutes
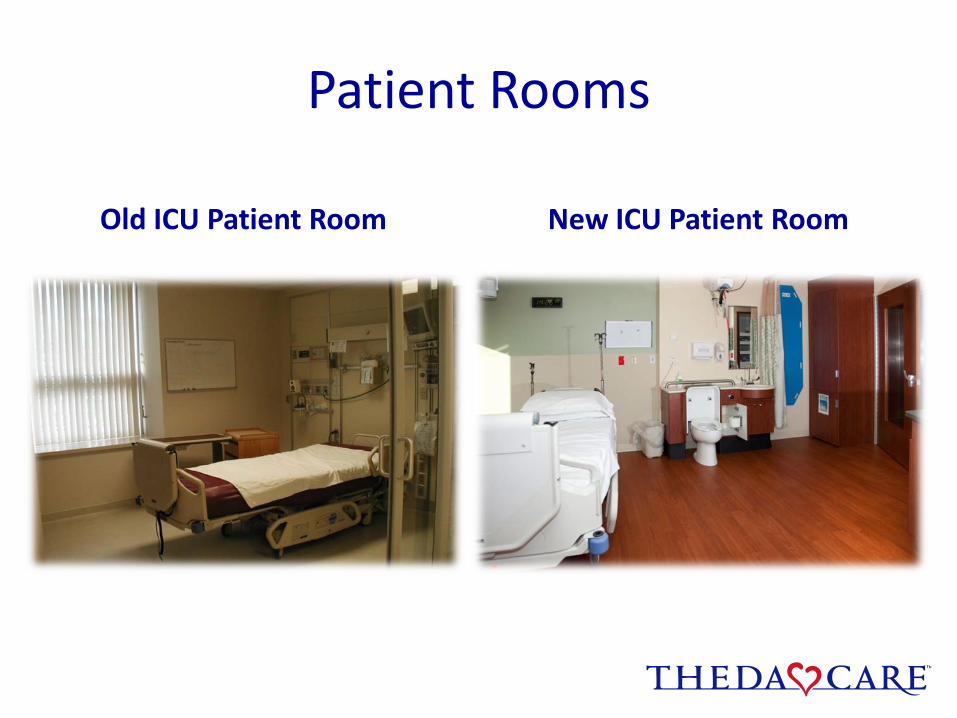
Patient Rooms
Old ICU Patient Room New ICU Patient Room
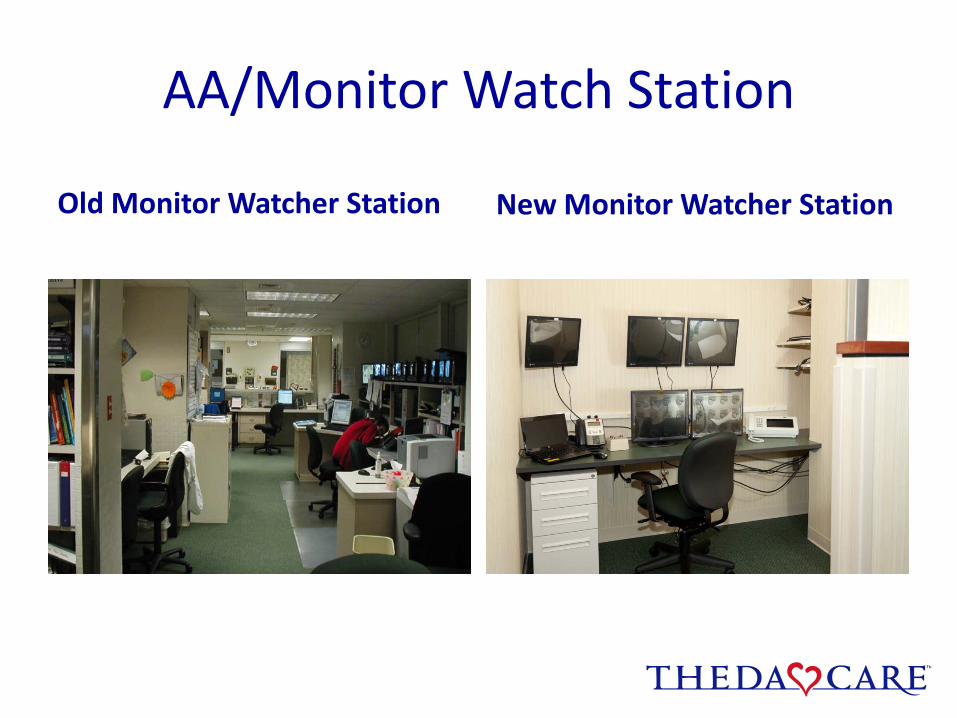
AA/Monitor Watch Station
New Monitor Watcher StationOld Monitor Watcher Station
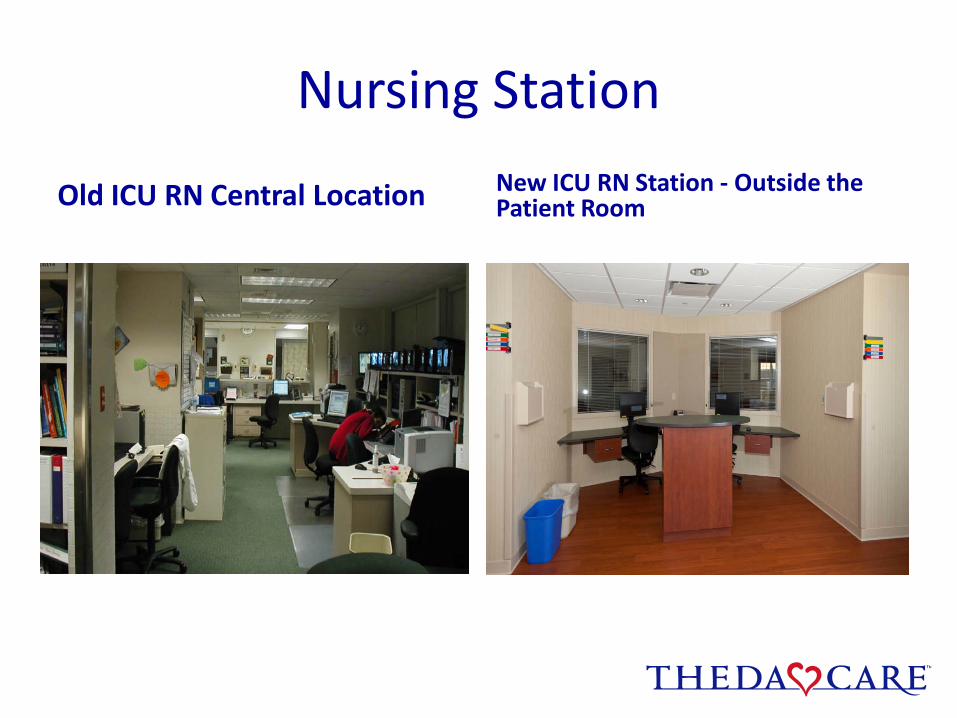
Nursing Station
Old ICU RN Central Location New ICU RN Station - Outside the Patient Room
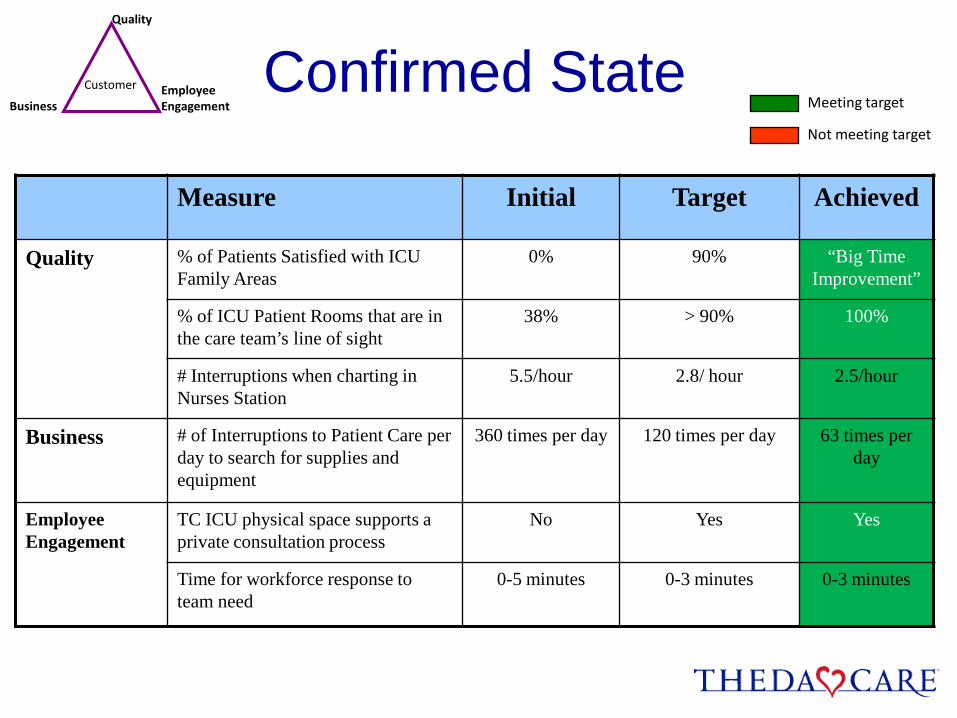
Confirmed StateQuality
Customer
BusinessEmployeeEngagement Meeting target
Not meeting target
Measure Initial Target Achieved
Quality % of Patients Satisfied with ICU Family Areas
0% 90% “Big Time Improvement”
% of ICU Patient Rooms that are in the care team’s line of sight
38% > 90% 100%
# Interruptions when charting in Nurses Station
5.5/hour 2.8/ hour 2.5/hour
Business # of Interruptions to Patient Care per day to search for supplies and equipment
360 times per day 120 times per day 63 times per day
Employee Engagement
TC ICU physical space supports a private consultation process
No Yes Yes
Time for workforce response to team need
0-5 minutes 0-3 minutes 0-3 minutes
Copyright 2010 All rights reserved
LeaderStandard
Work
Daily Stat Sheet
Daily Defect Huddle
Leadership Team
Monthly Scorecard
Monthly Performance
ReviewMeeting
PDSA and
Countermeasures
Visual Management
Leader Standard
Work
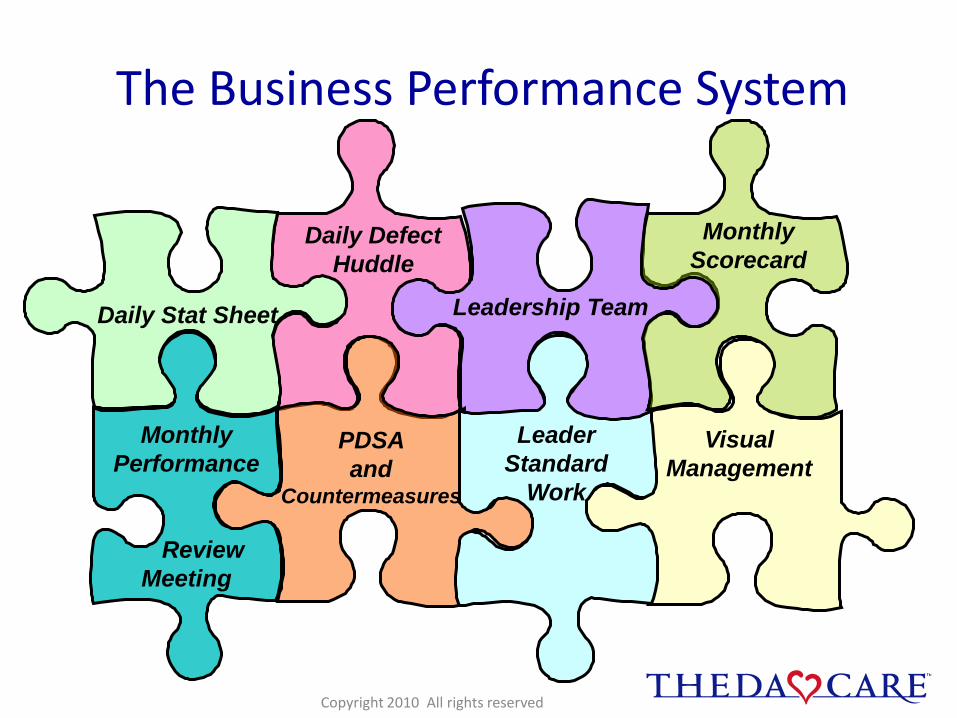
The Business Performance System

Business Performance System
• Daily Stat Sheet- Learning & Understanding the business
• Daily Performance Review Huddle – Daily Problem Solving in the work
• Leadership Team – The support to see performance, understand problems & implement responses
• Monthly Scorecard- knowing our numbers
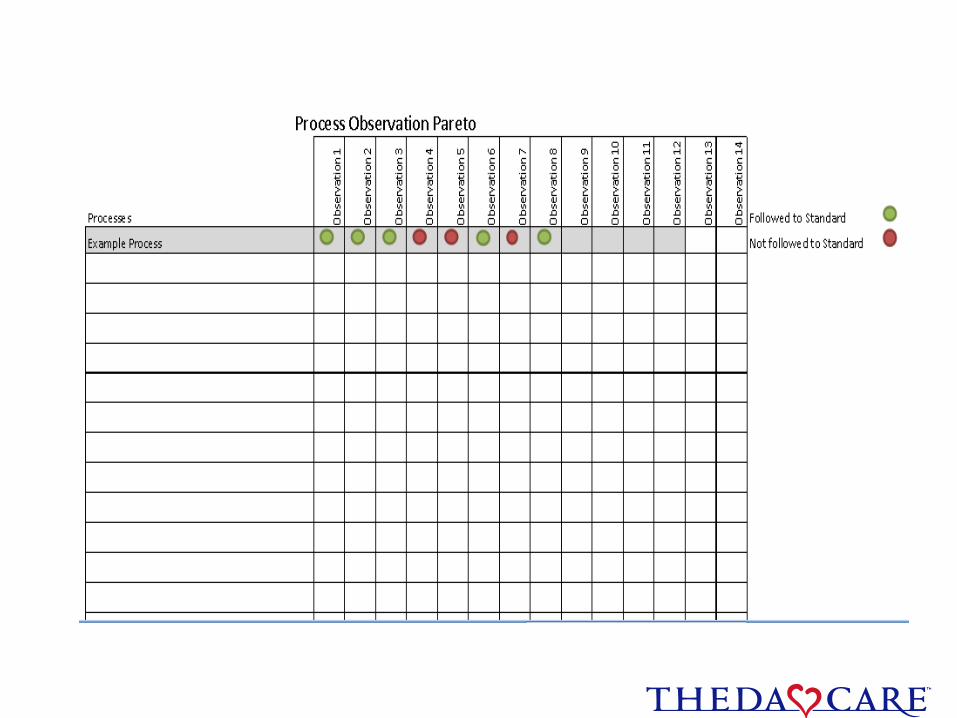
• Process observation-monitoring method for standard work processes
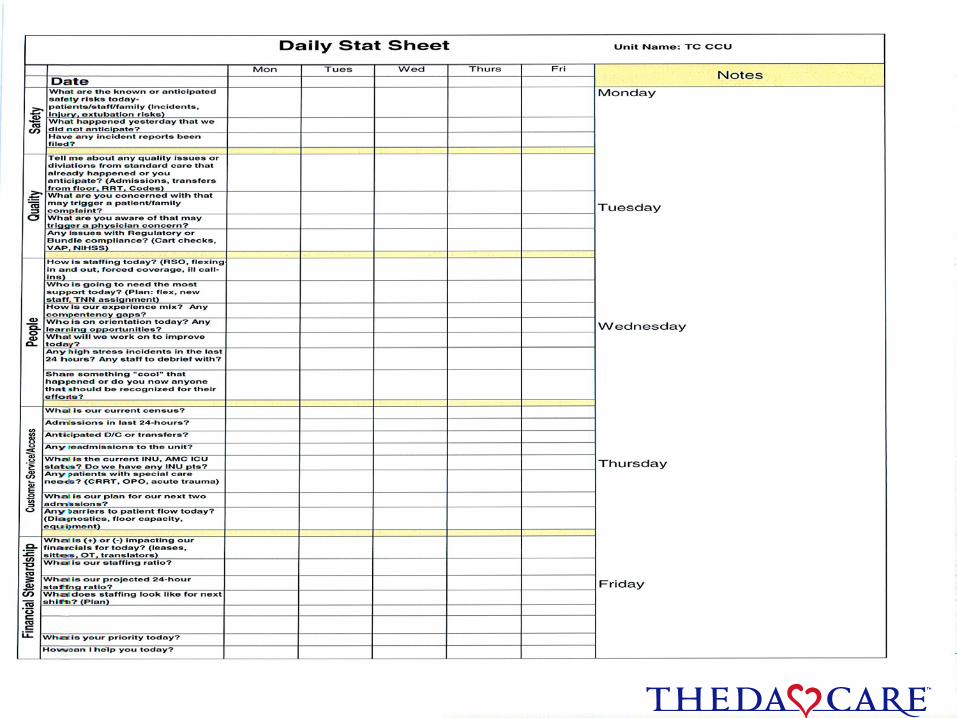
Insert stat sheet
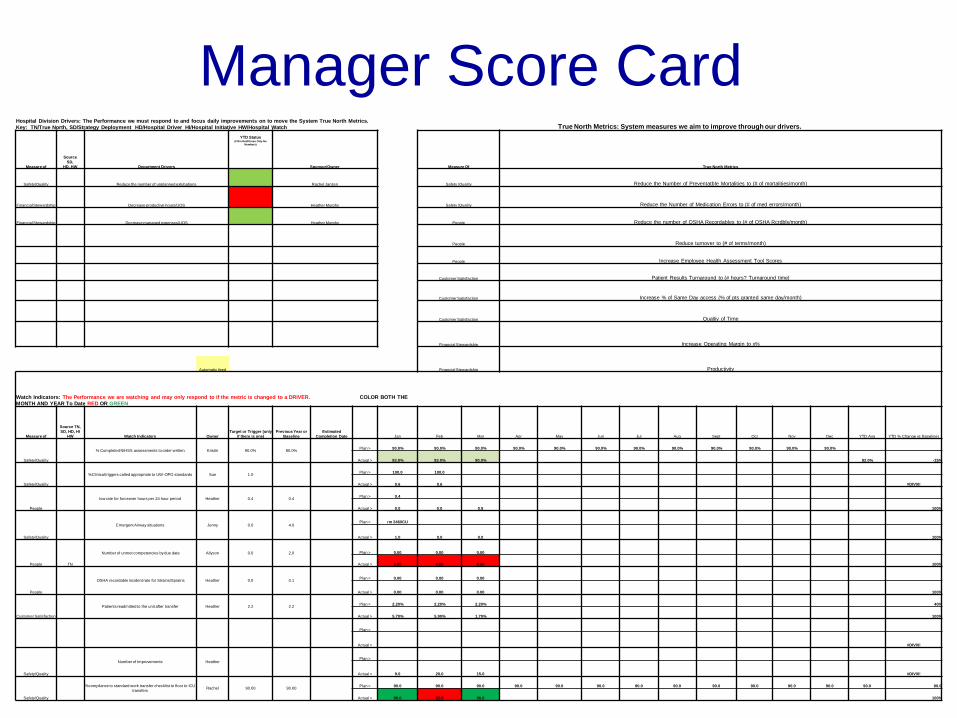
Level: Manager Score Card Owner: Heather Murphy Mgr Monthly Scorecard -(Page 2 )
Hospital Division Drivers: The Performance we must respond to and focus daily improvements on to move the System True North Metrics. Key: TN/True North, SD/Strategy Deployment HD/Hospital Driver HI/Hospital Initiative HW/Hospital Watch True North Metrics: System measures we aim to improve through our drivers.
Measure of
Source SD,
HD, HW Department Drivers
YTD Status(Fill in Red/Green Only No
Numbers)
Sponsor/Owner Measure Of True North Metrics
Safety/Quality Reduce the number of unplanned extubations Rachel Janzen Safety /Quality Reduce the Number of Preventatble Mortalities to (# of mortalities/month)
Financial Stewardship Decrease productive hours/UOS Heather Murphy Safety /Quality Reduce the Number of Medication Errors to (# of med errors/month)
Financial Stewardship Decrease managed expenses/UOS Heather Murphy People Reduce the number of OSHA Recordables to (# of OSHA Rcrdbls/month)
People Reduce turnover to (# of terms/month)
People Increase Employee Health Assessment Tool Scores
Customer Satisfaction Patient Results Turnaround to (# hours? Turnaround time)
Customer Satisfaction Increase % of Same Day access (% of pts granted same day/month)
Customer Satisfaction Qualtiy of Time
Financial Stewardship Increase Operating Margin to x%
Financial Stewardship ProductivityAutomatic feed
Watch Indicators: The Performance we are watching and may only respond to if the metric is changed to a DRIVER. COLOR BOTH THE MONTH AND YEAR To Date RED OR GREEN
Measure of
Source TN, SD, HD, HI
HW Watch Indicators OwnerTarget or Trigger (only
if there is one) Previous Year or
Baseline Estimated
Completion Date Jan Feb Mar Apr May Jun Jul Aug Sept Oct Nov Dec YTD Avg YTD % Change vs Baseline)
Safety/Quality
% Completed NIHSS assessments to order written Kristin 90.0% 80.0% Plan > 90.0% 90.0% 90.0% 90.0% 90.0% 90.0% 90.0% 90.0% 90.0% 90.0% 90.0% 90.0%
Actual > 93.0% 93.0% 90.0% 92.0% -15%
Safety/Quality
%Clinical triggers called appropriate to UW-OPO standards Sue 1.0 Plan > 100.0 100.0
Actual > 0.6 0.6 #DIV/0!
People
low rate for forceover hours per 24 hour period Heather 0.4 0.4 Plan > 0.4
Actual > 0.0 0.0 0.5 100%
Safety/Quality
Emergent Airway situations Jenny 0.0 4.0 Plan > rm 246/ICU
Actual > 1.0 0.0 0.0 100%
People TN
Number of unmet competencies by due date Allyson 0.0 2.0 Plan > 0.00 0.00 0.00
Actual > 2.00 4.00 8.00 100%
People
OSHA recordable incident rate for Strains/Sprains Heather 0.0 0.1 Plan > 0.00 0.00 0.00
Actual > 0.00 0.00 0.00 100%
Customer Satisfaction
Patients readmitted to the unit after transfer Heather 2.2 2.2 Plan > 2.20% 2.20% 2.20% 40%
Actual > 5.70% 5.90% 1.70% 100%
Plan >
Actual > #DIV/0!
Safety/Quality
Number of Improvements HeatherPlan >
Actual > 9.0 20.0 15.0 #DIV/0!
Safety/Quality
%compliance to standard work transfer checklist to floor to ICU transfers Rachel 90.00 90.00 Plan > 90.0 90.0 90.0 90.0 90.0 90.0 90.0 90.0 90.0 90.0 90.0 90.0 90.0 90.0
Actual > 90.0 82.0 96.0 100%
Manager Score Card
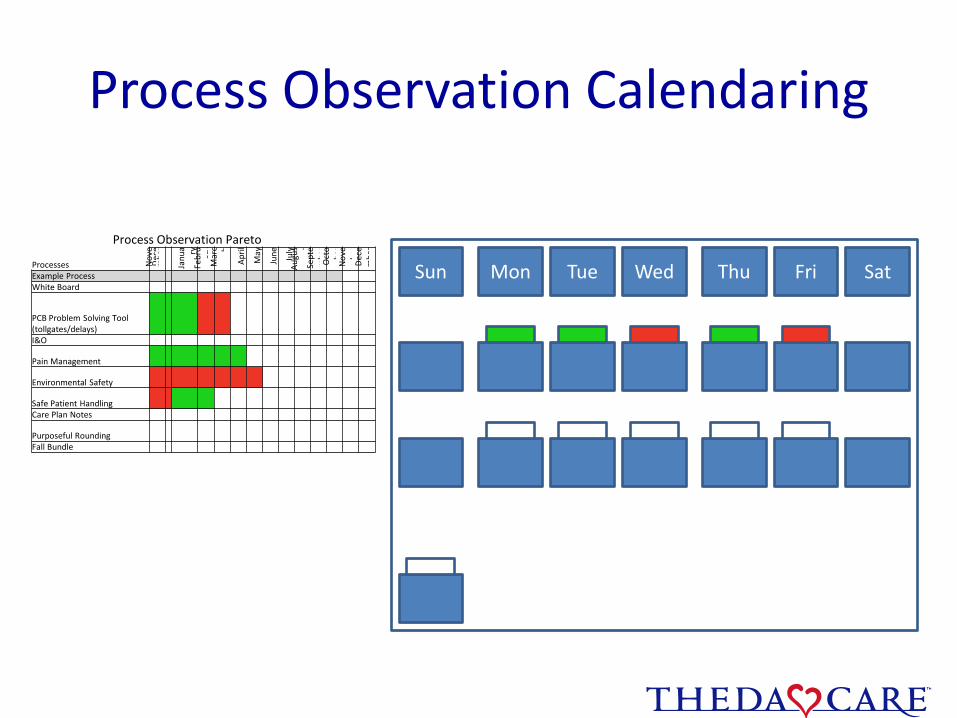
Process Observation Calendaring
Sun Mon Tue Wed Thu Fri Sat
Process Observation Pareto
Processes Nov
em
ber
Dec
e
Janu
a ryFe
bru
ary
Mar
c h
Apr
il
May
June July
Aug
ust
Sept
em
ber
Oct
obe
rN
ove
mbe
rD
ece
mbe
r
Example ProcessWhite Board
PCB Problem Solving Tool (tollgates/delays)I&O
Pain Management
Environmental Safety
Safe Patient HandlingCare Plan Notes
Purposeful RoundingFall Bundle
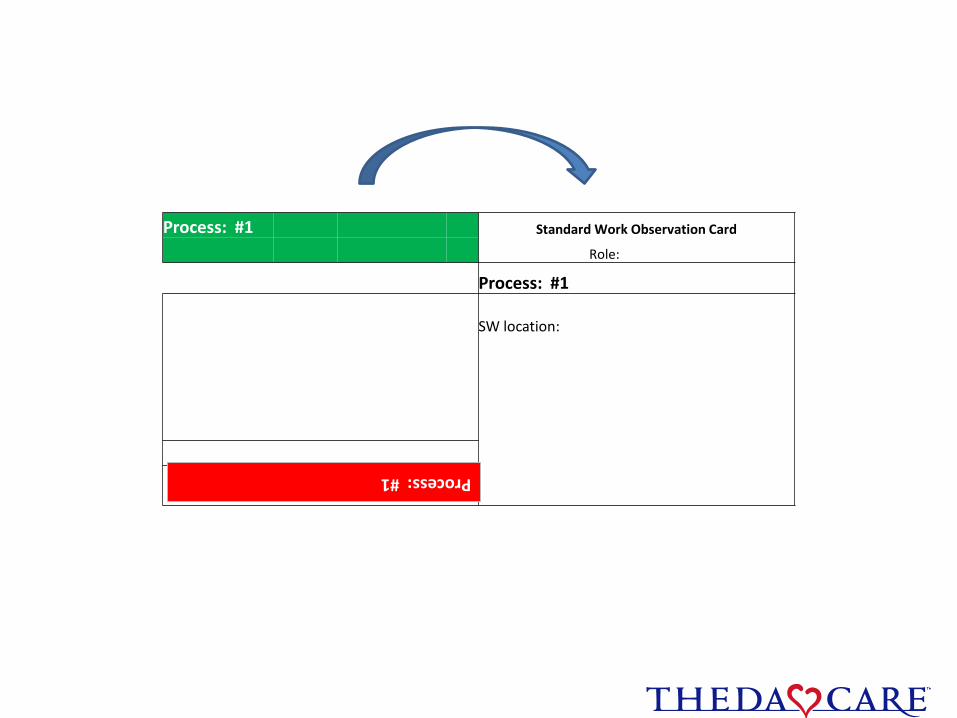
Process: #1 Standard Work Observation Card
Role:
Process: #1
SW location:
Process: #1
Observation of standard work will require coaching when the standard isn’t followed
Coaching is a leadership competency
Managers – DO NOT delegate this responsibility until you KNOW the person you are delegating to is able to coach effectively!
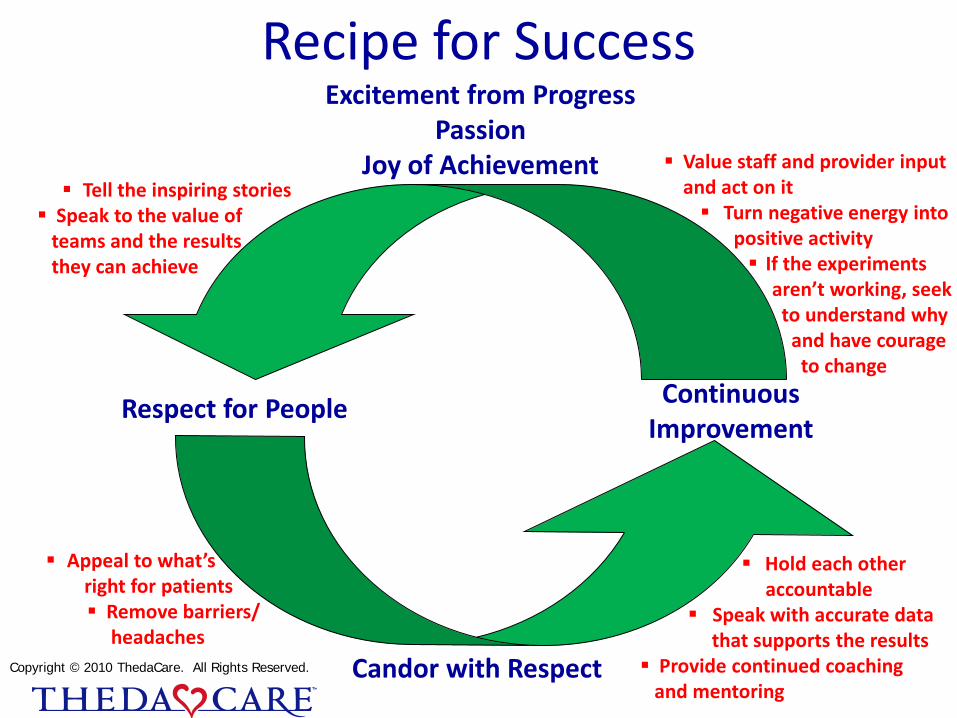
Recipe for Success
Respect for People Continuous Improvement
Excitement from ProgressPassion
Joy of Achievement
Candor with Respect
Tell the inspiring stories Speak to the value of
teams and the results they can achieve
Appeal to what’s right for patients Remove barriers/
headaches
Hold each other accountable
Speak with accurate data that supports the results
Provide continued coaching and mentoring
Value staff and provider input and act on it Turn negative energy into
positive activity If the experiments
aren’t working, seek to understand why
and have courage to change
Copyright © 2010 ThedaCare. All Rights Reserved.

Thank You,Questions?