leading a healthier century - pan-asian life insurance …...including life insurance, accident and...
TRANSCRIPT

STOCK CODE 1299ANNUAL REPORT 2018
HEALTHIER CENTURY
LEADING A

OUR VISION IS TO BE THE WORLD’S PRE-EMINENT LIFE INSURANCE PROVIDER.
OUR PURPOSE IS TO PLAY A LEADERSHIP ROLE IN DRIVING ECONOMIC AND SOCIAL DEVELOPMENT ACROSS THE REGION.
VISION & PURPOSE
HEALTHIER, LONGER, BETTER LIVESAs we position AIA for another century of growth and success, our brand promise of Healthier, Longer, Better Lives could not be more relevant.
By delivering on this promise we are able to make a substantial and positive impact on people’s lives and help build a better future for our communities all around the Asia-Pacific region.
Notes:(1) Numerous photos used throughout this report are winning images from AIA Group’s 2018 Regional Photo Competition. AIA employees
across our markets were asked to visualise what Healthier, Longer, Better Lives meant to them through their own photography.
(2) Explanations of certain terms and abbreviations used in this report are set forth in the Glossary.

1919CHINA
1990TAIWAN 1931
HONG KONG1982MACAU
1938THAILAND
2000VIETNAM
2012SRI LANKA
2001INDIA 2013
MYANMAR
2015CAMBODIA
1947PHILIPPINES
1931SINGAPORE
1957BRUNEI
1948MALAYSIA
1984INDONESIA
AIA Group Limited and its subsidiaries (collectively “AIA” or the “Group”) comprise the largest independent publicly listed pan-Asian life insurance group. It has a presence in 18 markets in Asia-Pacific – wholly-owned branches and subsidiaries in Hong Kong, Thailand, Singapore, Malaysia, China, Korea, the Philippines, Australia, Indonesia, Taiwan, Vietnam, New Zealand, Macau, Brunei, Cambodia, a 97 per cent subsidiary in Sri Lanka, a 49 per cent joint venture in India and a representative office in Myanmar.
The business that is now AIA was first established in Shanghai a century ago in 1919. It is a market leader in the Asia-Pacific region (ex-Japan) based on life insurance premiums and holds leading positions across the majority of its markets. It had total assets of US$230 billion as of 31 December 2018.
AIA meets the long-term savings and protection needs of individuals by offering a range of products and services including life insurance, accident and health insurance and savings plans. The Group also provides employee benefits, credit life and
pension services to corporate clients. Through an extensive network of agents, partners and employees across Asia-Pacific, AIA serves the holders of more than 33 million individual policies and over 16 million participating members of group insurance schemes.
AIA Group Limited is listed on the Main Board of The Stock Exchange of Hong Kong Limited under the stock code “1299” with American Depositary Receipts (Level 1) traded on the over-the-counter market (ticker symbol: “AAGIY”).
DRIVING ECONOMIC AND SOCIAL DEVELOPMENT ACROSS ASIA SINCE 1919
ABOUT AIA
PRESENCE IN

1987KOREA
1990TAIWAN
1981NEW ZEALAND1972
AUSTRALIA
1919AIA put down its corporate roots in Asia when the group founder Mr. Cornelius Vander Starr established an insurance agency in Shanghai.
1921Mr. Cornelius Vander Starr founded Asia Life Insurance Company, his first life insurance enterprise in Shanghai.
1931Mr. Cornelius Vander Starr founded International
Assurance Company, Limited (INTASCO), in Shanghai.
INTASCO established branch offices in Hong Kong and Singapore.
1947The Philippine American Life and General Insurance Company (Philam Life) was founded in the Philippines.
INTASCO moved its head office to Hong Kong.
1948INTASCO changed its name to American International Assurance Company, Limited.
1992We re-established our presence in China through a branch office in Shanghai, the first foreign-owned life business to receive a licence in the country.
1998We celebrated the return to our former headquarters building on The Bund in Shanghai.
2009We completed the reorganisation driven by AIG’s liquidity crisis in 2008, leading to the positioning of the Company for a public listing.
2010AIA Group Limited successfully listed on the Main Board of The Stock Exchange of Hong Kong Limited, the third-largest IPO ever globally at the time.
2011AIA Group Limited became a constituent stock of the Hang Seng Index.
We launched a sponsored Level 1 American Depositary Receipt programme.
2013AIA completed the full integration of the businesses of AIA and ING Malaysia.
We commenced business in Sri Lanka through the acquisition of Aviva NDB Insurance.
2014AIA and Citibank formed a landmark, long-term and exclusive bancassurance partnership that encompasses 11 markets in the Asia-Pacific region.
AIA became the Official Shirt Partner of Tottenham Hotspur Football Club to promote the role of sports as a key element of healthy living.
2015AIA became the #1 MDRT company in the world.
2016The AIA Leadership Centre opened in Bangkok.
AIA became the world’s #1 MDRT company for two consecutive years.
We increased AIA Group’s stake in Tata AIA Life Insurance Company Limited, a joint venture in India, from 26 per cent to 49 per cent.
2017AIA named #1 MDRT company in the world for third year running.
AIA presented the Hong Kong Observation Wheel and the AIA Vitality Park.

2018 AIA AND WEDOCTOR FORM LONG-TERM STRATEGIC PARTNERSHIPThrough this strategic partnership, AIA strengthened its existing leadership position in health insurance among multinational insurers in the Asia-Pacific region, further building upon our health and wellness strategy to deliver superior health outcomes through partnerships with quality healthcare providers and digitally-enabled personalised healthcare journeys.
AIA COMPLETES ITS ACQUISITION OF SOVEREIGN AND ENTERS INTO 20-YEAR STRATEGIC PARTNERSHIPAIA completed its acquisition of Sovereign, the life insurance business in New Zealand of Commonwealth Bank of Australia. The strategic bancassurance partnership with ASB Bank Limited in New Zealand became effective.
AIA LAUNCHES NEW BRAND PROMISE: HEALTHIER, LONGER, BETTER LIVESHealthier, Longer, Better Lives is a single, powerful brand promise that is an accurate and up-to-date reflection of what AIA stands for – and what we do as a company. To launch our new brand promise, we held events in Beijing and Hong Kong featuring AIA’s Global Ambassador, David Beckham.
AIA TOPS THE TABLE FOR FOURTH YEAR RUNNING AIA became the only multinational company in the world to have achieved the largest number of Million Dollar Round Table members for four consecutive years.

THE LARGEST LISTED COMPANYON THE HONG HONG STOCK EXCHANGE which is incorporated and headquartered in Hong Kong
THE LARGESTLIFE INSURER IN THE WORLD
NO.1 WORLDWIDEFOR MDRT MEMBERSThe only multinational company to top the table for four consecutive years
Provides protection to people across the region with total sum assured of
US$1.58 TRILLION
AIA AT-A-GLANCE

ANNUAL REPORT 2018 | 003
OVER 13 MILLIONBENEFIT PAYMENTS were made during 2018, helping customers and their families to cope with challenges at different life stages
Serving the holders of more than
33 MILLIONindividual policies and over
16 MILLION participating members of group insurance schemes
The only international life insurer headquartered and listed in Hong Kong and
100% FOCUSED ON ASIA-PACIFIC
CONTENTS
OVERVIEW006 Financial Highlights
008 Chairman’s Statement
010 Group Chief Executive and President’s Report
FINANCIAL AND OPERATING REVIEW019 Financial Review
036 Business Review
054 Risk Management
065 Regulatory and International Developments
066 Valuing Our People
070 Corporate Social Responsibility
CORPORATE GOVERNANCE075 Statement of Directors’
Responsibilities
076 Board of Directors
084 Executive Committee
089 Report of the Directors
099 Corporate Governance Report
112 Remuneration Report
FINANCIAL STATEMENTS129 Independent Auditor’s Report
136 Consolidated Income Statement
137 Consolidated Statement of Comprehensive Income
138 Consolidated Statement of Financial Position
140 Consolidated Statement of Changes in Equity
142 Consolidated Statement of Cash Flows
144 Notes to the Consolidated Financial Statements and Significant Accounting Policies
249 Supplementary Financial Information on a Calendar Year Basis
267 Independent Auditor’s Report on the Supplementary Embedded Value Information
271 Supplementary Embedded Value Information
ADDITIONAL INFORMATION294 Condensed Business and
Financial Review for the Thirteen Months Ended 31 December 2018
304 Information for Shareholders
307 Corporate Information
308 Glossary


| AIA GROUP LIMITED006
OVERVIEW
VALUE OF NEW BUSINESS(2)
0
1,000
500
2,000
1,500
3,500
4,000
2,500
3,000
US$ millions
3,955
2,750
2,198
3,206
1,845
2015 2016 2017 20182014
YoY (AER)YoY (CER)
+22% +23%
TOTAL ASSETS AND TOTAL LIABILITIES
ANNUALISED NEW PREMIUMS(3)
0
1,000
2,000
3,000
4,000
5,000
7,000
6,000
US$ millions
6,510
5,624
3,7003,991
5,123
2015 2016 2017 20182014
YoY (AER)YoY (CER)
+15% +16%
OPERATING PROFIT AFTER TAX(4)
0
1,000
2,000
3,000
4,000
6,000
5,000
US$ millions
5,298
3,9813,556
4,635
3,248
2015 2016 2017 20182014
YoY (AER)YoY (CER)
+13% +14%
TOTAL WEIGHTED PREMIUM INCOME(5)
0
5,000
10,000
15,000
20,000
25,000
30,000
US$ millions 30,543
26,393
19,211
22,13319,876
2015 2016 2017 20182014
YoY (AER)YoY (CER)
+14% +16%
EV EQUITY(6)
0
10,000
20,000
30,000
40,000
50,000
60,000
US$ millions
56,20352,429
43,65039,042 39,818
2015 2016 2017 20182014
YoY (AER)YoY (CER)
+9% +7%
US$ billions
169 170
219
185
230
136 138
175
150
190
2015 2016 2017 201820140
50
100
150
200
250
TOTAL LIABILITIES
+9% TOTAL ASSETS
+5%
2018 RESULTS AT-A-GLANCE(1)
Note:Percentages shown in the charts above indicate changes for twelve months ended 31 December 2018 compared with twelve months ended 31 December 2017.
The table on the right covers the financial information for the thirteen-month period from 1 December 2017 to 31 December 2018 for the current period and for the twelve-month period from 1 December 2016 to 30 November 2017 for the prior period. Balance sheet items are presented as at 31 December 2018 for the current period and as at 30 November 2017 for the prior period.
US$ millions
Thirteen-month period from 1 December 2017
to 31 December 2018
Twelve-month period from 1 December 2016
to 30 November 2017
Value of New Business(2) 4,067 3,512
Annualised New Premiums (3) 6,770 6,092
Operating Profit After Tax (4) 5,684 4,647
Total Weighted Premium Income (5) 33,109 26,147
US$ millions As at 31 December 2018 As at 30 November 2017
EV Equity (6) 56,203 51,775
Total Assets 229,806 215,691
Total Liabilities 190,400 173,319

ANNUAL REPORT 2018 | 007
OV
ER
VIE
WF
INA
NC
IAL
AN
D O
PE
RA
TIN
G R
EV
IEW
CO
RP
OR
AT
E G
OV
ER
NA
NC
EF
INA
NC
IAL
STA
TE
ME
NT
SA
DD
ITIO
NA
L IN
FO
RM
AT
ION
VALUE OF NEW BUSINESS(2)(7)
TOTAL WEIGHTED PREMIUM INCOME(5)
ANNUALISED NEW PREMIUMS(3)
OPERATING PROFIT AFTER TAX(4)
Notes:(1) Due to the change of AIA Group Limited’s financial year-end date
from 30 November to 31 December and for the purpose of enhancing the comparability of financial information, the financial information in 2018 Results at a glance and 2018 Breakdown by market segment covers a twelve-month period from 1 January 2018 to 31 December 2018 for the current period and a twelve-month period from 1 January 2017 to 31 December 2017 for the prior period. Balance sheet items are presented as at 31 December 2018 for the current period and as at 31 December 2017 for the prior period. The financial information from 2014 to 2016 is presented on the 30 November financial year-end basis.
(2) Value of new business (VONB) is the present value, measured at the point of sale, of projected after-tax statutory profits emerging in the future from new business sold in the period less the cost of holding the required capital in excess of regulatory reserves to support this business.
(3) Annualised new premiums (ANP) is a measure of new business activity that is calculated as the sum of 100 per cent of annualised first year premiums and 10 per cent of single premiums, before reinsurance ceded.
(4) Operating profit after tax (OPAT) is shown after non-controlling interests.
(5) Total weighted premium income (TWPI) consists of 100 per cent of renewal premiums, 100 per cent of first year premiums and 10 per cent of single premiums, before reinsurance ceded.
(6) Embedded value (EV) is an actuarially determined estimate of the economic value of a life insurance business based on a particular set of assumptions as to future experience, excluding any economic value attributable to future new business. EV Equity is the total of embedded value, goodwill and other intangible assets.
(7) Based on local statutory basis and before unallocated Group Office expenses, VONB by segment includes pension business.
(8) The results of our joint venture in India are accounted for using the equity method. For clarity, TWPI, ANP and VONB exclude any contribution from India.
2018 BREAKDOWN BY MARKET SEGMENT(1)
41%
23%
11%
9%
10%6%
42%
16%9%
6%
8%
19%
37%
13%13%
9%
7%
21%
34%
16%19%
10%
6%
15%
Hong Kong
China
Thailand
Singapore
Malaysia
Other Markets (8)

| AIA GROUP LIMITED008
OVERVIEW
Volatility returned to capital markets this year as a consequence of increasing concerns about the sustainability
of the global economic growth cycle and uncertainty surrounding international trade policy. Despite this, the long-
term fundamental drivers of growth for the life insurance industry in the Asia-Pacific region remain robust. AIA
continues to benefit from the powerful social, demographic and economic changes that are taking place across
our markets. Rising incomes are driving rapid growth in the middle classes and Asian consumers are transforming
the region’s economies. At the same time, the provision of social welfare remains at relatively low levels. These
structural trends are creating substantial long-term savings and financial protection needs.
The resilience of the Group as a result of these structural drivers and the execution of our growth strategy, has once
again been demonstrated through the excellent performance delivered in 2018. Value of new business (VONB)
reached US$3,955 million, a 22 per cent increase compared with 2017, and operating profit after tax (OPAT) grew
by 13 per cent to US$5,298 million, all on constant exchange rates (CER). Equity attributable to shareholders of
the Company on the embedded value basis (EV Equity) increased by US$3,774 million over the year to US$56,203
million. As at 31 December 2018, the solvency ratio for our principal regulated operating company AIA Company
Limited (AIA Co.) was 421 per cent and the Group’s free surplus above required regulatory capital was US$14,751
million, as measured under the Hong Kong Insurance Ordinance (HKIO) basis.
The board of Directors (Board) has recommended an increase in the final dividend of 14 per cent to 84.80 Hong
Kong cents per share, consistent with AIA’s established prudent, sustainable and progressive dividend policy.
The Board has also recommended a special dividend of 9.50 Hong Kong cents per share for the additional month
in the accounting period due to the change of the Company’s financial year-end date. The dividends reflect the
strength of our financial results and the Board’s continued confidence in the future prospects of the Group. The
recommended dividends are subject to shareholders’ approval at the Company’s forthcoming Annual General
Meeting (AGM).
During 2019, AIA will celebrate its centennial year. The Group traces its extraordinary heritage back to its origins
in Shanghai in 1919, and our commitment to the Asia-Pacific region is stronger than ever. This landmark year
also provides an opportunity to thank all who have contributed to our continued growth and success over the
last 100 years. AIA could not have reached this important milestone without the support of our customers and
shareholders, who every day place their trust in AIA to deliver innovative financial solutions and long-term returns.
I would also like to express the Board’s deep appreciation to AIA’s employees, agents and partners - past and
present – for the focus and commitment that have made AIA what it is today. Special thanks are due once again,
to our Group Chief Executive and President Ng Keng Hooi, along with his outstanding leadership team, who have
together led the Group through another year of strong results.
Over the eight years since AIA became a listed company, it has been an honour and a pleasure to work as a
member of a Board that is committed to maintaining the highest standards of corporate governance. All of the
Board’s non-executive directors are independent and have wide-ranging governance and executive experience.
Our approach to effective governance is underpinned by embedding a strong culture throughout the organisation
CHAIRMAN’S STATEMENT
AIA is an exceptional company and we are well-positioned to capture the significant potential that the dynamic Asia-Pacific region presents. I am very pleased to report that 2018 was another very successful year of strong growth.

ANNUAL REPORT 2018 | 009
OV
ER
VIE
WF
INA
NC
IAL
AN
D O
PE
RA
TIN
G R
EV
IEW
CO
RP
OR
AT
E G
OV
ER
NA
NC
EF
INA
NC
IAL
STA
TE
ME
NT
SA
DD
ITIO
NA
L IN
FO
RM
AT
ION
and ensuring that our risk management framework evolves to reflect the changing business and regulatory
environment. Given the rising global concerns in relation to data privacy, cybersecurity and ethical business
practices, we have also placed a greater emphasis on our practices in these areas. This is fundamental to AIA’s
sustainable development and to maintaining the confidence of all of our organisation’s stakeholders.
Finally, as we enter our Centennial year, I believe that AIA, now more than at any point in the Group’s history, is
ready, able and committed to fulfilling our Purpose in playing a leadership role in driving economic and social
development across the Asia-Pacific region. This year, we launched AIA’s new brand promise – “Healthier,
Longer, Better Lives”. This promise renews our commitment to that leadership role and serving our communities
across the region, while building sustainable relationships with our customers and employees and creating
long-term value for our shareholders.
Thank you for being with us on this journey.
Edmund Sze-Wing Tse
Independent Non-executive Chairman
15 March 2019
Mr. Edmund Sze-Wing TseIndependent Non-executive Chairman

| AIA GROUP LIMITED010
OVERVIEW
GROUP CHIEF EXECUTIVE AND PRESIDENT’S REPORT
Value of new business (VONB) grew by 22 per cent, operating profit after tax (OPAT) increased by 13 per cent
and underlying free surplus generation grew by 13 per cent on a comparable basis, all on constant exchange
rates (CER). Equity attributable to shareholders of the Company on the embedded value basis (EV Equity)
increased by US$3,774 million to reach US$56,203 million.
The board of Directors (Board) has recommended a final dividend of 84.80 Hong Kong cents per share, which
represents an increase of 14 per cent and brings the total dividend (excluding special dividend) for 2018 to
114.00 Hong Kong cents per share. This reflects the strength of AIA’s financial performance and our confidence
in the Group’s prospects. Additionally, the Board has recommended a special dividend of 9.50 Hong Kong cents
per share, which represents an additional month of full year dividend due to the change of the Company’s
financial year-end date.
Our strong operating performance reflects our focus on managing the business proactively and the execution of
our growth strategy against a challenging backdrop of financial market volatility and concerns over the global
macroeconomic environment. AIA’s success has been driven by our talented teams across the Asia-Pacific
region and the high levels of professionalism, commitment and care shown by our employees and agents
throughout the company.
The life insurance industry plays an important role in developing economies by helping to meet the social and
infrastructure challenges that arise following step changes in economic growth. Rising affluence creates both
a need and an aspiration for individuals to protect accumulated wealth and provide for dependants, and the
financial responsibility on any one breadwinner can be considerable.
Largely as a consequence of the traditional role of the extended family in the provision of welfare, government
organised social welfare safety-nets are underdeveloped and there is a general recognition amongst Asian
governments that costly, fully-comprehensive social welfare provision is unsustainable.
In our markets – developed and emerging – this creates a material “protection gap” that represents the shortfall
between a society’s need for financial provision for adversity and ill health, and the actual levels of insurance
and savings in place to cover the risk. Dependency ratios are increasing in many of our markets, creating an
emerging “retirement savings gap” – inefficient forms of savings, lack of provision for retirement and increasing
longevity are all contributing to a significant shortfall in long-term savings.
Private insurance is key to effective provision against these lifetime contingencies. The region, however,
remains significantly underinsured in terms of life protection, health insurance, pensions and annuities – this
demonstrates both the resilience of our markets and the significant potential for growth.
The expectations of Asian consumers are also evolving. Well-being, health, longevity and higher expectations
of the quality of life into old age are increasingly front of mind. At the same time, consumers are unsure of how
much cover they need and what types of products to buy.
AIA has delivered another excellent set of results in 2018 with double-digit growth across all our main financial metrics.

ANNUAL REPORT 2018 | 011
OV
ER
VIE
WF
INA
NC
IAL
AN
D O
PE
RA
TIN
G R
EV
IEW
CO
RP
OR
AT
E G
OV
ER
NA
NC
EF
INA
NC
IAL
STA
TE
ME
NT
SA
DD
ITIO
NA
L IN
FO
RM
AT
ION
Mr. Ng Keng HooiGroup Chief Executive and President

| AIA GROUP LIMITED012
OVERVIEW
AIA’s unrivalled distribution capabilities, strong brand, financial strength and ability to invest in product
innovation place us in a unique position to help meet these fundamental social and economic needs.
We remain focused on executing our clear strategic priorities that will build on these competitive advantages
to sustain our profitable growth and help safeguard the future health and financial security of our customers.
2018 PERFORMANCE HIGHLIGHTS (ON A CONSTANT EXCHANGE RATE BASIS)
Hong Kong had another very successful year with VONB up by 24 per cent to US$1,712 million. This excellent
result demonstrates the quality of our multi-channel distribution and was broad-based with growth from both
domestic and Mainland Chinese visitor customer segments. The continued success in executing our Premier
Agency strategy drove a double-digit increase in the number of active agents. We also have a significant retail
independent financial adviser (IFA) business in Hong Kong and our long-term strategic partnership with
Citibank, N.A. (Citibank) once again delivered very strong VONB growth. OPAT increased by 11 per cent to
US$1,814 million.
In China, we delivered another excellent performance with VONB up by 30 per cent to US$965 million. Our
focus on quality recruitment and best-in-class training, supported by our innovative digital platforms, produced
a double-digit increase in the number of active agents. Growth in the underlying business and favourable
insurance experience contributed to a 32 per cent increase in OPAT. In February 2019, we were delighted to
receive regulatory approvals to begin preparations for the establishment of sales and service centres in Tianjin
and Shijiazhuang, Hebei. We are looking forward to bringing AIA’s differentiated products and services to more
and more families in China over time.
Our business in Thailand returned to double-digit growth with an increase in VONB of 12 per cent to US$447
million. The success of our focus on raising the quality of our agency force saw a 36 per cent increase in
the number of Million Dollar Round Table (MDRT) qualifiers, as we continued to grow full-time, professional
active agents that provide high-quality advice to our customers. Our new partnership with Bangkok Bank Public
Company Limited (Bangkok Bank) was launched in March 2018 and we continue to lay the foundations for
future growth by expanding our product range through the bank’s in-branch insurance specialists. Underlying
business growth and improvements to in-force persistency saw OPAT grow by 9 per cent.
Singapore delivered very strong VONB growth of 18 per cent in 2018 driven by the agency channel and our
strategic partnership with Citibank. The execution of our Premier Agency strategy delivered both an increase in
the number of active agents and improved productivity levels. OPAT increased by 7 per cent.
Malaysia achieved an improved second-half performance to deliver VONB growth of 8 per cent for the full
year, amidst a market environment that has been affected by reduced consumer activity and changes to Goods
and Services Tax (GST). Our Takaful business delivered double-digit VONB growth and remains an important
strategic focus. OPAT increased by 9 per cent.
VONB grew by 13 per cent in Other Markets. Highlights included strong performances from our businesses
in Australia and New Zealand, Korea, the Philippines and Taiwan. OPAT increased by 14 per cent to US$826
million.
Our performance in 2018 is another clear demonstration of the benefits of AIA’s diversified growth portfolio
across geographical markets, products and distribution channels, and the tremendous potential for profitable
growth in the Asia-Pacific region.
GROUP CHIEF EXECUTIVE AND PRESIDENT’S REPORT

ANNUAL REPORT 2018 | 013
OV
ER
VIE
WF
INA
NC
IAL
AN
D O
PE
RA
TIN
G R
EV
IEW
CO
RP
OR
AT
E G
OV
ER
NA
NC
EF
INA
NC
IAL
STA
TE
ME
NT
SA
DD
ITIO
NA
L IN
FO
RM
AT
ION
GROUP-WIDE OVERVIEW
DISTRIBUTIONOur proprietary tied agency force is our core distribution channel and the professionalism and scale of our
agency is a significant competitive advantage for AIA. In 2018, the focused execution of our Premier Agency
strategy delivered VONB growth of 26 per cent to US$2,943 million. We believe that our agents are the most
effective means of meeting the financial protection and long-term savings needs of the mass affluent market in
Asia. Our ability to attract the highest-quality recruits and provide them with the best training and back-office
support across every aspect of agency management is an important driver of our growth. AIA is also at the
forefront of providing agents with next-generation digital tools which help to enhance both their professionalism
and productivity. The execution of our Premier Agency strategy will continue to be the cornerstone of AIA’s
future success.
MDRT membership is an important measure of the quality of our agency and AIA has over 10,000 registered
members, which is an increase of 22 per cent compared with 2017. AIA has now been the multinational with
the highest number of MDRT registered members globally for four consecutive years, a clear indicator of our
success in developing a highly professional, full-time agency distribution.
AIA’s long-term strategic partnerships broaden our access to customers across the Asia-Pacific region. VONB
from AIA’s partnership distribution business grew by 11 per cent to US$1,172 million in 2018, building on the
exceptionally strong performance from Hong Kong’s retail IFA channel in the first half of 2017, as previously
highlighted. In March 2018, we launched our new strategic partnership with Bangkok Bank, the largest bank
by total assets and with one of the largest retail banking customer bases in Thailand. This partnership offers
a significant opportunity to reinforce our market leadership position in Thailand. In July 2018, the Group
announced the completion of the transaction to acquire Sovereign Assurance Company Limited in New Zealand
and the beginning of our 20-year strategic bancassurance partnership with ASB Bank Limited (ASB).
We also look to develop non-traditional strategic partnerships with companies that have large existing
customer bases and where the arrangements make commercial sense for AIA, such as those we launched
during the year with WeDoctor in China and SK Telecom in Korea. Through our partnership with WeDoctor,
AIA has gained preferred access to WeDoctor’s services for AIA customers and AIA has become the preferred
provider of life and health insurance solutions to WeDoctor’s registered user base of over 180 million Chinese
consumers. We also launched AIA Vitality into our strategic partnership with SK Telecom, the nation’s leading
telecommunications provider by number of customers. These new partnerships represent additional growth
opportunities for AIA by providing us with broader access to new customers and enabling the provision of new
digital health and wellness services for our existing policyholders.
In addition, our scale and presence across the Asia-Pacific region place us in a strong position to take advantage
of strategic partnership opportunities as they arise. We look for opportunities that will materially extend our
distribution reach and rigorously evaluate these opportunities against strict financial and strategic criteria.
BRAND AND MARKETINGAIA’s brand promise to help our customers live Healthier, Longer, Better Lives was launched across all of our
markets in 2018. AIA is leading the way in transforming our protection business from that of a passive claims
payer to a partner that actively helps our customers improve their health and well-being. This changes the way
that customers perceive the purchase of life and health insurance and allows them to see positive, tangible
benefits early on in their relationship with AIA. Our approach is fully aligned with the rapidly evolving needs
and expectations of consumers in Asia-Pacific and offers significant potential for enhancing the quality and
frequency of engagement with our customers and our distribution.

| AIA GROUP LIMITED014
OVERVIEWGROUP CHIEF EXECUTIVE AND PRESIDENT’S REPORT
Our stated Purpose is to play a leadership role in driving economic and social development across the region
and our new brand promise represents what we stand for as a company. We are actively fostering long-term
relationships with our customers to address the protection needs created by rising personal wealth that is leading
to an increasing prevalence of lifestyle-related diseases in Asia. Our leadership position in health insurance,
integrated with wellness, is at the forefront of these developments and this is an important strategic priority for
the Group that will enable us to deliver both positive benefits for our customers and their communities, and help
AIA to sustain our long-term growth.
AIA Vitality is our comprehensive science-backed wellness programme. Since its launch in 2013, we have been
able to demonstrate positive health outcomes for our customers by encouraging and rewarding healthy lifestyle
choices. We also launched AIA Vitality into many of our bancassurance partnerships during the year and total
membership of our wellness programmes has exceeded 1.2 million people as at the end of 2018.
Our marketing and sponsorship activity is focused on associating the AIA brand with healthy lifestyles and
encouraging active participation in sport. Our Global Principal Partnership with Tottenham Hotspur Football
Club (Spurs) and our Global Ambassador, David Beckham, raise awareness among our customers, partners
and employees of our brand promise through social media campaigns, football coaching clinics, customer and
employee engagement sporting events and other media opportunities.
Environmental, Social and Governance (ESG) considerations are increasingly front-of-mind for all of our
stakeholders. As the largest pan-Asian life insurer, we have an important role to play in helping encourage greater
awareness and consideration of ESG issues. AIA supports the recommendations of the Task Force on Climate-
related Financial Disclosures (TCFD), and we also became the first Hong Kong-headquartered asset owner to join
the Principles for Responsible Investment (PRI), reflecting our commitment to sustainable investment across our
markets. In 2018, we received a “Prime” rating from ISS-oekom and are included in the FTSE4Good Index Series.
We were also pleased to be included once again in the Bloomberg Gender Equality Index.
TECHNOLOGY AND OPERATIONSTransformation through digitalisation is a key enabler across all aspects of our business. In 2018, we continued
to make significant and targeted investments to simplify back-office processes and enhance efficiency, driving
further productivity improvements and ensuring that we deliver innovative products and quality service to our
customers.
Depending on their preferences, our customers engage with our businesses both online and offline. We continue
to invest in improving our digital capabilities from online self-service for basic administration and simple policy
requests, to providing the sophisticated digital tools needed to support our market-leading agency and other
distribution partners.
Every year our customers interact with us on more than 34 million standard product-related insurance
transactions and an additional 105 million digital customer interactions through AIA Vitality. We are increasingly
looking at ways in which we can employ artificial intelligence (AI) capabilities to support our operations. AI is
employed across many of our processes including new business processing, existing customer servicing and
claims handling.
AIA’s digital point-of-sale technology continues to evolve with more than 90 per cent of new business cases across
the Group submitted digitally in 2018. Automatic underwriting rates continued to increase in 2018 with 57 per cent of
all new business underwritten at point of sale with no human intervention. We continued to enhance the applications
used by our agency across AIA’s proprietary interactive Mobile Office (iMO) platform: iRecruit improves recruitment
success and digitalises the onboarding process, while iAcademy is an e-learning platform that is deployed across our
businesses, enabling agents to continue to learn and develop wherever they want.

ANNUAL REPORT 2018 | 015
OV
ER
VIE
WF
INA
NC
IAL
AN
D O
PE
RA
TIN
G R
EV
IEW
CO
RP
OR
AT
E G
OV
ER
NA
NC
EF
INA
NC
IAL
STA
TE
ME
NT
SA
DD
ITIO
NA
L IN
FO
RM
AT
ION
We are also looking at ways to transform our business through innovation and the use of new technology. A
Group digitalisation initiative for partnership distribution has been launched to develop an end-to-end sales
and services platform for our bank partners. Our aim is to drive a step change in the experience that these
digital tools provide to both our customers and our distribution.
Cybersecurity is a critically important focus for AIA and a mounting risk to the industry and to our business.
Regular updates are provided to the Group Executive Committee and the Board to ensure that this area
receives the strongest management focus, support and governance. We continue to strengthen and invest
in our capabilities in this area and have established a new cybersecurity shared services centre to provide
additional advanced cyberthreat prevention, detection and response capabilities across the Group to support
our dedicated cybersecurity teams.
ENGAGEMENT WITH PEOPLE
Central to AIA’s success are more than 22,000 talented, professional and committed employees. It is due to
their dedication, hard work and unrelenting focus on customer service and the consistent execution of our
strategy that we are able to sustain our strong track record of growth and success.
AIA’s culture is characterised by our Operating Philosophy of “Doing the Right Thing, in the Right Way, with
the Right People... the Right Results will come”. Our corporate structure is designed to empower our local
businesses, within a strategic and risk management framework, set and monitored by the group centre, and
this encourages stronger engagement between our employees and their local markets. We believe the key to
maintaining this culture is ensuring that we attract, train and retain highly-capable employees who actively
look for the opportunities we provide for continuing professional development and who embrace AIA’s brand
promise and Purpose.
The AIA Leadership Centre (ALC) plays an important role in developing our senior executives across the
Group. The centre has a clear focus on delivering impactful leadership development programmes aligned
with AIA’s key strategic priorities. Now in its third year of operation, the ALC hosted more than 240 events
in 2018, partnering with leading business schools and consulting firms. Technical leadership and functional
leadership programmes are also provided to enhance domain-specific knowledge and skills. In recognition of
its commitment to professional education, AIA was awarded ‘Excellence in Education’ by LOMA.
We use technology to help deliver our learning and development programmes and we have launched a new
learning platform providing digitalised learning content and delivery methods including access to content
on-demand. We have also embarked on a major strategic initiative to transform our human resources information
systems to improve efficiency and people analytics capabilities.
We conducted a review of approximately 1,400 senior positions across our markets during the year, ensuring
that we have clear plans for succession and the opportunities to develop our people. It has always been a
top priority for AIA to grow leaders from within the business and we filled a majority of our senior leadership
vacancies through internal promotions during the year.
Our annual employee engagement survey is an important indicator of the success of our combined efforts
across our markets and continues to provide us with valuable insights. I am pleased to report that the employee
engagement scores for the Group place us in the top quartile of Gallup’s global financial services and insurance
industry benchmark. AIA was one of 39 companies globally and the only international life insurer to be conferred
a Great Workplace Award from Gallup in 2018.

| AIA GROUP LIMITED016
OVERVIEW
OUTLOOK
Asia’s growth fundamentals remain resilient despite recent volatility in financial markets, geopolitical uncertainty
caused by ongoing international trade tensions and concerns over the sustainability of the current economic
growth cycle. While global economic growth rates are expected to slow, the strong domestic drivers of demand
and major demographic trends in Asia provide positive structural support for the long-term prospects of AIA’s
business. US policymakers have responded by putting interest rate rises on hold for the time being and we
expect China to continue its transition towards slower but higher-quality economic growth, accompanied by
further financial reform.
Asia is expected to account for 90 per cent of the world’s next billion middle-class consumers and the region’s
middle-class population on this basis will more than double by 2025. Against the backdrop of an uncertain
global macroeconomic and geopolitical environment, the need for our insurance products continues to grow,
given low levels of private insurance penetration and social welfare coverage, and we remain focused on
executing our strategic priorities.
AIA has been in Asia for a century, operating in some of the most dynamic and attractive life and health insurance
markets in the world. As we mark our Centennial year in 2019, this is an opportunity to restate our commitment
to safeguarding the financial security of our customers. As the Group looks forward to the next 100 years, our
promise of Healthier, Longer, Better Lives is especially relevant to how we will meet the growing needs of
customers created by the unprecedented structural economic, demographic and social changes taking place
across our markets. By delivering on this promise we will make a real and positive impact on people’s lives.
After 100 years, it is rare that a company can say it is just at the beginning of its journey, but I remain as convinced
as ever that AIA has much more to offer our customers, our employees, our partners and our shareholders. Of
course, we have a lot to do to capture the opportunities that we have, but I believe we have the right strategy,
the right leadership and the best platform from which we can continue to create long-term sustainable value.
I am incredibly excited to be leading AIA into the next 100 years and I look forward to AIA leading a healthier
century across the Asia-Pacific region.
Ng Keng Hooi
Group Chief Executive and President
15 March 2019
GROUP CHIEF EXECUTIVE AND PRESIDENT’S REPORT

ANNUAL REPORT 2018 | 017
019 Financial Review
036 Business Review
054 Risk Management
065 Regulatory and International Developments
066 Valuing Our People
070 Corporate Social Responsibility
FINANCIAL AND OPERATING REVIEW
| AIA GROUP LIMITED018
FINANCIAL AND OPERATING REVIEW
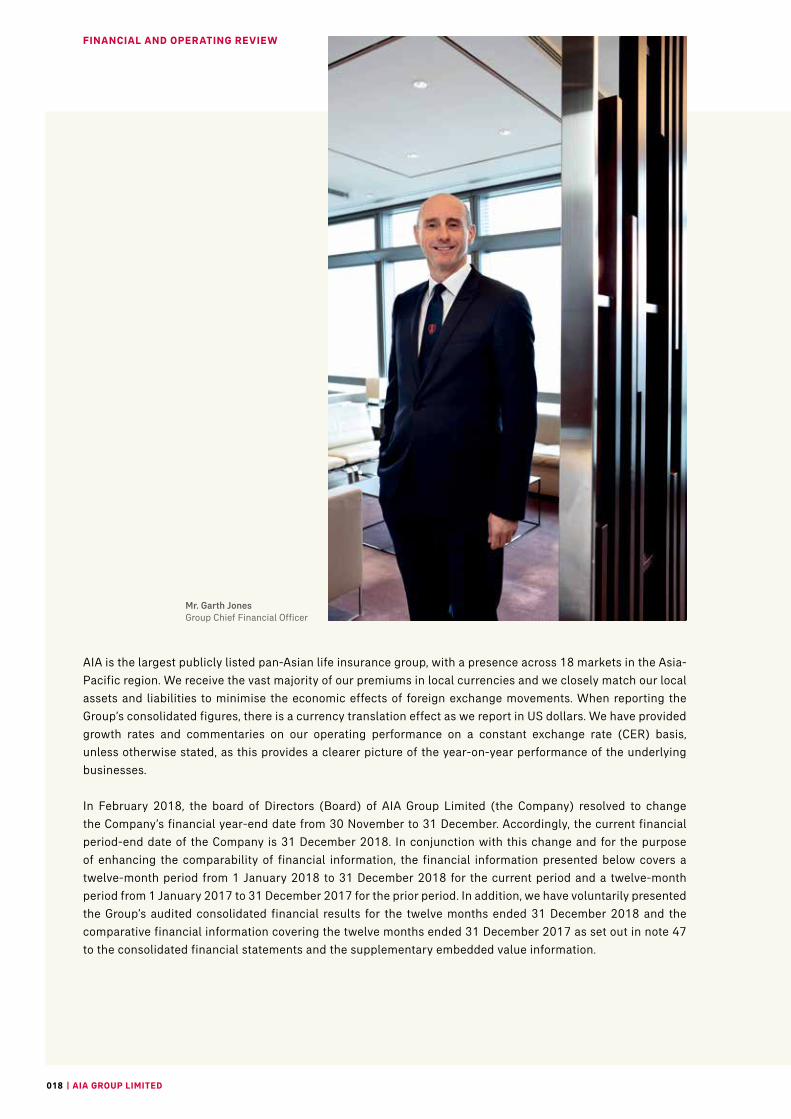
AIA is the largest publicly listed pan-Asian life insurance group, with a presence across 18 markets in the Asia-
Pacific region. We receive the vast majority of our premiums in local currencies and we closely match our local
assets and liabilities to minimise the economic effects of foreign exchange movements. When reporting the
Group’s consolidated figures, there is a currency translation effect as we report in US dollars. We have provided
growth rates and commentaries on our operating performance on a constant exchange rate (CER) basis,
unless otherwise stated, as this provides a clearer picture of the year-on-year performance of the underlying
businesses.
In February 2018, the board of Directors (Board) of AIA Group Limited (the Company) resolved to change
the Company’s financial year-end date from 30 November to 31 December. Accordingly, the current financial
period-end date of the Company is 31 December 2018. In conjunction with this change and for the purpose
of enhancing the comparability of financial information, the financial information presented below covers a
twelve-month period from 1 January 2018 to 31 December 2018 for the current period and a twelve-month
period from 1 January 2017 to 31 December 2017 for the prior period. In addition, we have voluntarily presented
the Group’s audited consolidated financial results for the twelve months ended 31 December 2018 and the
comparative financial information covering the twelve months ended 31 December 2017 as set out in note 47
to the consolidated financial statements and the supplementary embedded value information.
Mr. Garth JonesGroup Chief Financial Officer

ANNUAL REPORT 2018 | 019
OV
ER
VIE
WF
INA
NC
IAL
AN
D O
PE
RA
TIN
G R
EV
IEW
CO
RP
OR
AT
E G
OV
ER
NA
NC
EF
INA
NC
IAL
STA
TE
ME
NT
SA
DD
ITIO
NA
L IN
FO
RM
AT
ION
FINANCIAL REVIEW
SUMMARY AND KEY FINANCIAL HIGHLIGHTS
AIA has delivered another set of excellent financial results in 2018 with double-digit growth in value of new
business (VONB), operating profit after tax (OPAT), embedded value (EV) operating profit and underlying free
surplus generation as we have continued to build on our competitive advantages and make strong progress in
delivering our strategic priorities. We have also increased free surplus and maintained our resilient solvency
position while financing both our organic growth and value-enhancing inorganic opportunities.
Reflecting these financial results and our confidence in the future of AIA, the Board has recommended an increase
in the final dividend of 14 per cent to 84.80 Hong Kong cents per share. The Board has also recommended a
special dividend of 9.50 Hong Kong cents per share for the additional month in the accounting period due to the
change of the Company’s financial year-end date from 30 November 2018 to 31 December 2018.
EMBEDDED VALUEVONB grew by 22 per cent to US$3,955 million in 2018 with all our reportable market segments delivering
positive VONB growth. Agency distribution remains our main source of new business and accounted for 72 per
cent of the Group’s total VONB. The focused execution of our Premier Agency strategy has continued to drive
very strong VONB growth of 26 per cent to US$2,943 million from the agency channel. VONB from partnership
distribution delivered solid growth of 11 per cent, building on the exceptionally strong performance from Hong
Kong’s retail Independent Financial Adviser (IFA) channel in the first half of 2017 as previously highlighted.
Annualised new premiums (ANP) increased by 15 per cent to US$6,510 million and VONB margin was higher
by 3.7 pps at 60.0 per cent. The present value of new business premium (PVNBP) margin increased to 10 per
cent from 9 per cent in 2017, reflecting positive shifts in product and country mix.
EV operating profit grew by 23 per cent to US$8,278 million, reflecting strong new business growth, a higher
expected return on EV of US$3,893 million and overall positive operating variances of US$603 million resulting
from the proactive management of our in-force portfolio. This has resulted in a strong increase of 110 bps in our
operating return on EV (Operating ROEV) to 16.3 per cent compared with 2017.
Equity attributable to shareholders of the Company on the embedded value basis (EV Equity) grew by
US$3,774 million to US$56,203 million. The increase was mainly driven by EV operating profit, partly offset
by negative investment return variances of US$2,218 million reflecting the effect of short-term equity and
other capital market movements on our investment portfolio and statutory reserves compared with long-term
expected returns. The EV is shown after the payment of shareholder dividends totalling US$1,589 million. EV
Equity included goodwill and other intangible assets of US$1,686 million at 31 December 2018 compared
with US$1,650 million at 31 December 2017. The increase arose primarily from the acquisition of Sovereign
Assurance Company Limited, included as part of the acquisition of ASB Group (Life) Limited and its subsidiaries
(Sovereign), the life and health insurance businesses owned by Commonwealth Bank of Australia (CBA) in New
Zealand, which completed on 2 July 2018.

| AIA GROUP LIMITED020
FINANCIAL AND OPERATING REVIEWFINANCIAL REVIEW
FINANCIAL AND OPERATING REVIEW
IFRS EARNINGSOPAT increased by 13 per cent to US$5,298 million. All our reportable market segments delivered positive OPAT
growth in 2018 as a result of new business growth over time and the proactive management of our in-force
portfolio. The expense ratio reduced to 7.1 per cent from 7.6 per cent in 2017 as we continued to benefit from
increasing scale.
Operating margin after tax was 17.5 per cent compared with 17.7 per cent in 2017 primarily reflecting strong
total weighted premium income (TWPI) growth in 2018 and an increasing proportion of participating business
in the in-force portfolio.
Operating return on shareholders’ allocated equity (Operating ROE) increased by 40 bps to 14.5 per cent, mainly
driven by OPAT growth.
At 31 December 2018, shareholders’ allocated equity remained stable at US$36,795 million, after the payment
of shareholder dividends of US$1,589 million, reflecting the depreciation of local currencies against our US
dollar reporting currency of US$732 million and net profit of US$2,597 million, which included negative mark-
to-market movement from our equity portfolio.
CAPITAL AND DIVIDENDSFree surplus increased by US$2,165 million to US$14,751 million at 31 December 2018. This included a positive
addition to free surplus of US$1,886 million due to the subsidiarisation of AIA Korea and a deduction of US$497
million for the net effect of the acquisition of Sovereign.
Underlying free surplus generation increased to US$4,945 million, representing growth of 13 per cent on a
comparable basis before a reduction of US$263 million relating to the subsidiarisation of AIA Korea. New
business investment increased by 10 per cent to US$1,540 million, negative investment return variances and
other items were US$795 million and the payment of shareholder dividends totalled US$1,589 million.
The solvency ratio of AIA Company Limited (AIA Co.), was 421 per cent at 31 December 2018, compared with
446 per cent at 31 December 2017. Our solvency ratio remained very strong after the effect of the acquisition
of Sovereign and dividends to the Company.
Our local businesses remitted US$2,753 million to the Group Corporate Centre in 2018, including special
remittance from New Zealand post acquisition of Sovereign, compared with US$2,039 million in 2017.
The Board has recommended an increase in the final dividend of 14 per cent to 84.80 Hong Kong cents per
share, consistent with AIA’s established prudent, sustainable and progressive dividend policy. The Board
has also recommended a special dividend of 9.50 Hong Kong cents per share for the additional month in the
accounting period due to the change of the Company’s financial year-end date from 30 November 2018 to 31
December 2018. The dividends reflect the strength of our financial results and the Board’s continued confidence
in the future prospects of the Group. The recommended dividends are subject to shareholders’ approval at the
Company’s forthcoming Annual General Meeting (AGM).

ANNUAL REPORT 2018 | 021
OV
ER
VIE
WF
INA
NC
IAL
AN
D O
PE
RA
TIN
G R
EV
IEW
CO
RP
OR
AT
E G
OV
ER
NA
NC
EF
INA
NC
IAL
STA
TE
ME
NT
SA
DD
ITIO
NA
L IN
FO
RM
AT
ION
NEW BUSINESS PERFORMANCE
VONB, ANP and Margin by Segment
2018 2017 VONB Change
US$ millions, unless otherwise stated VONBVONB
Margin ANP VONBVONB
Margin ANPYoY
CERYoY
AER
Hong Kong 1,712 62.0% 2,697 1,384 53.7% 2,493 24% 24%
Thailand 447 73.1% 611 381 73.4% 519 12% 17%
Singapore 357 65.4% 547 297 69.7% 426 18% 20%
Malaysia 247 63.8% 382 215 62.5% 340 8% 15%
China 965 90.5% 1,067 725 83.1% 873 30% 33%
Other Markets 435 35.8% 1,206 395 39.9% 973 13% 10%
Subtotal 4,163 63.2% 6,510 3,397 59.4% 5,624 21% 23%
Adjustment to reflect consolidated reserving and capital requirements (56) n/m n/m (61) n/m n/m n/m n/m
After-tax value of unallocated Group Office expenses (152) n/m n/m (130) n/m n/m n/m n/m
Total 3,955 60.0% 6,510 3,206 56.0% 5,624 22% 23%
VONB grew by 22 per cent to US$3,955 million in 2018 with all our reportable market segments delivering
positive VONB growth.
ANP increased by 15 per cent to US$6,510 million and VONB margin rose by 3.7 pps to 60.0 per cent. PVNBP
margin increased to 10 per cent from 9 per cent in 2017, reflecting positive shifts in product and country mix.
Agency distribution remains our main source of new business and accounted for 72 per cent of the Group’s
total VONB. The focused execution of our Premier Agency strategy has continued to drive very strong VONB
growth of 26 per cent to US$2,943 million from the agency channel. This was delivered through strong ANP
growth of 18 per cent to US$4,179 million and a higher VONB margin of 70.4 per cent. VONB from partnership
distribution delivered solid growth of 11 per cent, building on the exceptionally strong performance from Hong
Kong’s retail IFA channel in the first half of 2017. Our bank partnerships collectively delivered VONB growth of
18 per cent.
Hong Kong delivered VONB growth of 24 per cent to US$1,712 million in 2018 with excellent performance
across both domestic and Mainland Chinese visitor customer segments. VONB margin increased by 8.3 pps to
62.0 per cent as our product mix continued to shift towards higher-margin long-term savings and protection
products.
AIA’s wholly-owned operation in China was our fastest-growing reportable market segment with VONB growth
of 30 per cent to US$965 million. This excellent performance reflects the disciplined execution of our Premier
Agency strategy, focusing on quality recruitment together with continuing productivity enhancements.
Thailand returned to VONB growth in 2018 with an increase of 12 per cent to US$447 million, mainly driven by
ANP growth of 13 per cent. Sales momentum continued in the second half of 2018 as we continued to transform
the agency through our Financial Adviser programme.
Singapore delivered very strong VONB growth of 18 per cent, mainly driven by our core agency channel and
strategic partnership with Citibank, N.A. (Citibank). VONB margin was lower at 65.4 per cent as a result of lower
profitability from our HealthShield business as previously highlighted and higher volumes of single premium
unit-linked business ahead of a regulatory change in October 2018.

| AIA GROUP LIMITED022
FINANCIAL AND OPERATING REVIEWFINANCIAL REVIEW
FINANCIAL AND OPERATING REVIEW
Despite reduced consumer activity and changes to tax regulations during the year, Malaysia’s VONB growth
improved in the second half of 2018 and was up by 8 per cent over the full year to US$247 million.
Other Markets reported VONB growth of 13 per cent to US$435 million. Highlights included strong growth from
Australia (including New Zealand), Korea, the Philippines and Taiwan.
The VONB results for the Group are reported after a deduction of US$208 million for the consolidated reserving
and capital requirements over and above local statutory requirements and for the present value of unallocated
Group Office expenses.
EV EQUITY
EV OPERATING PROFITEV operating profit increased by 23 per cent to US$8,278 million compared with 2017.
This strong performance was the result of 22 per cent growth in VONB to US$3,955 million, a higher expected
return on EV of US$3,893 million and overall positive operating variances of US$603 million. Operating
variances since our initial public offering (IPO) in 2010 have added more than US$2.0 billion to EV.
Operating ROEV increased by 110 bps to 16.3 per cent compared with 2017.
EV Operating Earnings Per Share – Basic
2018 2017YoY CER
YoY AER
EV operating profit (US$ millions) 8,278 6,654 23% 24%
Weighted average number of ordinary shares (millions) 12,021 12,002 n/a n/a
Basic EV operating earnings per share (US cents) 68.86 55.44 23% 24%
EV Operating Earnings Per Share – Diluted
2018 2017YoY CER
YoY AER
EV operating profit (US$ millions) 8,278 6,654 23% 24%
Weighted average number of ordinary shares(1) (millions) 12,056 12,039 n/a n/a
Diluted EV operating earnings per share(1) (US cents) 68.66 55.27 23% 24%
Note:(1) Diluted EV earnings per share including the dilutive effects, if any, of the awards of share options, restricted share units, restricted stock purchase units
(RSPUs) and restricted stock subscription units (RSSUs) granted to eligible directors, officers, employees and agents under the share-based compensation plans as described in note 39 to the financial statements.
EV MOVEMENTEV grew by US$3,738 million to US$54,517 million at 31 December 2018.
The increase was mainly driven by strong EV operating profit, partly offset by negative investment return
variances of US$2,218 million reflecting the effect of short-term equity and other capital market movements
on our investment portfolio and statutory reserves compared with long-term expected returns. Other non-
operating variances amounted to US$270 million, mainly from the positive effect of the subsidiarisation of
AIA Korea, partly offset by corporate transaction related costs and implementation costs of new accounting
standards. The effect of negative foreign exchange translation movements was US$1,037 million.
ANNUAL REPORT 2018 | 023
OV
ER
VIE
WF
INA
NC
IAL
AN
D O
PE
RA
TIN
G R
EV
IEW
CO
RP
OR
AT
E G
OV
ER
NA
NC
EF
INA
NC
IAL
STA
TE
ME
NT
SA
DD
ITIO
NA
L IN
FO
RM
AT
ION
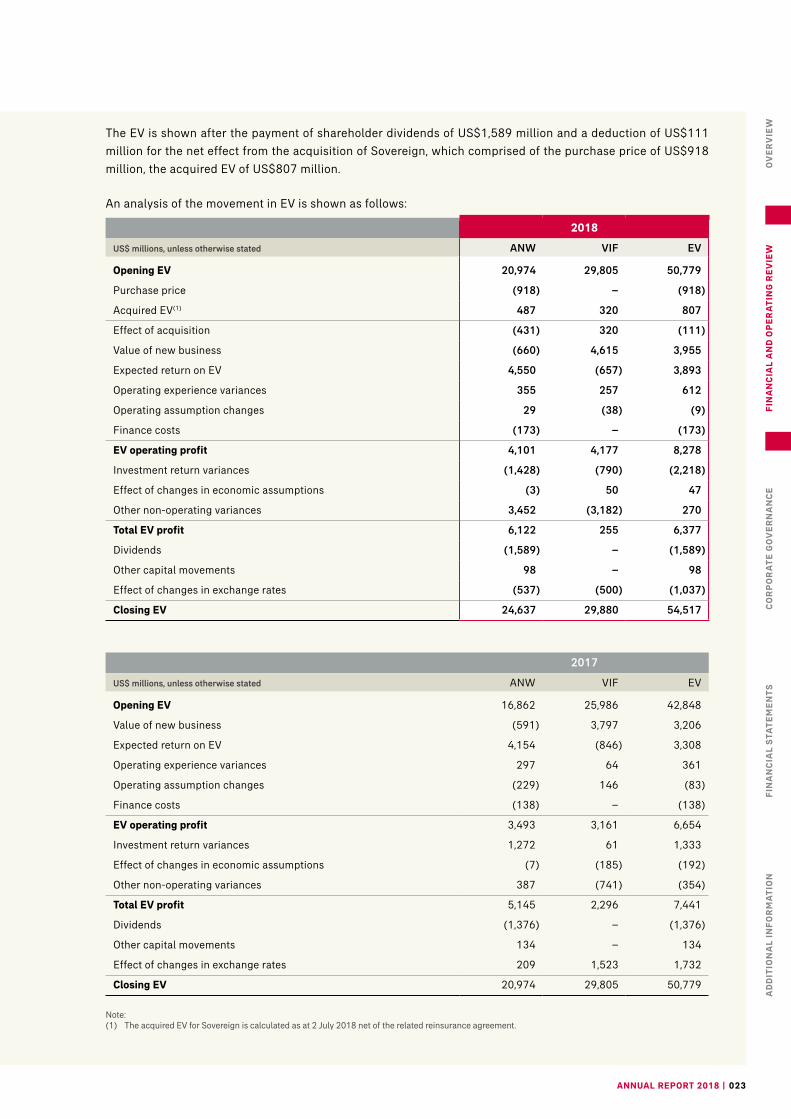
The EV is shown after the payment of shareholder dividends of US$1,589 million and a deduction of US$111
million for the net effect from the acquisition of Sovereign, which comprised of the purchase price of US$918
million, the acquired EV of US$807 million.
An analysis of the movement in EV is shown as follows:
2018
US$ millions, unless otherwise stated ANW VIF EV
Opening EV 20,974 29,805 50,779
Purchase price (918) – (918)
Acquired EV(1) 487 320 807
Effect of acquisition (431) 320 (111)
Value of new business (660) 4,615 3,955
Expected return on EV 4,550 (657) 3,893
Operating experience variances 355 257 612
Operating assumption changes 29 (38) (9)
Finance costs (173) – (173)
EV operating profit 4,101 4,177 8,278
Investment return variances (1,428) (790) (2,218)
Effect of changes in economic assumptions (3) 50 47
Other non-operating variances 3,452 (3,182) 270
Total EV profit 6,122 255 6,377
Dividends (1,589) – (1,589)
Other capital movements 98 – 98
Effect of changes in exchange rates (537) (500) (1,037)
Closing EV 24,637 29,880 54,517
2017
US$ millions, unless otherwise stated ANW VIF EV
Opening EV 16,862 25,986 42,848
Value of new business (591) 3,797 3,206
Expected return on EV 4,154 (846) 3,308
Operating experience variances 297 64 361
Operating assumption changes (229) 146 (83)
Finance costs (138) – (138)
EV operating profit 3,493 3,161 6,654
Investment return variances 1,272 61 1,333
Effect of changes in economic assumptions (7) (185) (192)
Other non-operating variances 387 (741) (354)
Total EV profit 5,145 2,296 7,441
Dividends (1,376) – (1,376)
Other capital movements 134 – 134
Effect of changes in exchange rates 209 1,523 1,732
Closing EV 20,974 29,805 50,779
Note:(1) The acquired EV for Sovereign is calculated as at 2 July 2018 net of the related reinsurance agreement.

| AIA GROUP LIMITED024
FINANCIAL AND OPERATING REVIEWFINANCIAL REVIEW
FINANCIAL AND OPERATING REVIEW
EV Equity
US$ millions, unless otherwise stated
As at 31 December
2018
As at 31 December
2017
EV 54,517 50,779
Goodwill and other intangible assets(1) 1,686 1,650
EV Equity 56,203 52,429
Note:(1) Consistent with the IFRS financial statements, net of tax, amounts attributable to participating funds and non-controlling interests.
EV AND VONB SENSITIVITIESSensitivities to EV and VONB arising from changes to central assumptions from equity price and interest rate
movements are shown below and are consistent with the prior period.
US$ millions, unless otherwise stated
EV as at 31 December
2018VONB2018
EV as at 31 December
2017VONB2017
Central value 54,517 3,955 50,779 3,206
Impact of equity price changes
10 per cent increase in equity prices 736 n/a 750 n/a
10 per cent decrease in equity prices (731) n/a (743) n/a
Impact of interest rate changes
50 basis points increase in interest rates 158 142 49 162
50 basis points decrease in interest rates (249) (184) (456) (225)
Please refer to Section 3 of the Supplementary Embedded Value Information for additional information.

ANNUAL REPORT 2018 | 025
OV
ER
VIE
WF
INA
NC
IAL
AN
D O
PE
RA
TIN
G R
EV
IEW
CO
RP
OR
AT
E G
OV
ER
NA
NC
EF
INA
NC
IAL
STA
TE
ME
NT
SA
DD
ITIO
NA
L IN
FO
RM
AT
ION
IFRS PROFIT
OPAT(1) by Segment
US$ millions, unless otherwise stated 2018 2017YoY CER
YoY AER
Hong Kong 1,814 1,627 11% 11%
Thailand 995 868 9% 15%
Singapore 558 513 7% 9%
Malaysia 320 274 9% 17%
China 870 643 32% 35%
Other Markets 826 742 14% 11%
Group Corporate Centre (85) (32) n/m n/m
Total 5,298 4,635 13% 14%
Note:(1) Attributable to shareholders of the Company only excluding non-controlling interests.
OPAT grew by 13 per cent to US$5,298 million. All our reportable market segments delivered positive OPAT growth in 2018 as a result of new business growth over time and the proactive management of our in-force portfolio.
Hong Kong delivered an OPAT increase of 11 per cent reflecting growth in our business and improved claims experience, partly offset by a shift in product mix towards participating business, as previously highlighted in our Interim Report 2018.
China achieved excellent OPAT growth of 32 per cent, primarily driven by the growing scale of our business and positive claims experience.
Thailand’s OPAT continued its positive growth momentum from the first half of 2018 and grew by 9 per cent for the full year, reflecting our business growth and improved persistency.
Singapore reported a 7 per cent increase in OPAT despite pressure on profitability from double-digit medical inflation in the market. Malaysia reported a 9 per cent increase in OPAT, in line with business growth.
Other Markets delivered a strong result with growth of 14 per cent in 2018. Highlights included strong performances from Australia (including New Zealand), the Philippines, Taiwan and Vietnam.
Operating ROE increased by 40 bps to 14.5 per cent, driven by OPAT growth partly offset by higher average shareholders’ allocated equity compared with 2017.
TWPI by Segment
US$ millions, unless otherwise stated 2018 2017YoY CER
YoY AER
Hong Kong 11,444 9,535 20% 20%
Thailand 3,895 3,559 5% 9%
Singapore 2,738 2,435 10% 12%
Malaysia 2,083 1,848 6% 13%
China 4,006 3,118 26% 28%
Other Markets 6,377 5,898 10% 8%
Total 30,543 26,393 14% 16%
TWPI increased by 14 per cent to US$30,543 million compared with 2017.

| AIA GROUP LIMITED026
FINANCIAL AND OPERATING REVIEWFINANCIAL REVIEW
FINANCIAL AND OPERATING REVIEW
IFRS Operating Profit Investment Return
US$ millions, unless otherwise stated 2018 2017YoY CER
YoY AER
Interest income 6,125 5,500 10% 11%
Expected long-term investment return for equities and real estate 1,951 1,689 14% 16%
Total 8,076 7,189 11% 12%
IFRS operating profit investment return increased by 11 per cent to US$8,076 million compared with 2017. The
growth was primarily driven by the increased size of our investment portfolio.
Operating Expenses
US$ millions, unless otherwise stated 2018 2017YoY CER
YoY AER
Operating expenses 2,171 2,019 7% 8%
Operating expenses grew by 7 per cent to US$2,171 million with a lower expense ratio of 7.1 per cent compared
with 7.6 per cent in 2017 as we continued to benefit from increasing scale.
Net Profit(1)
US$ millions, unless otherwise stated 2018 2017YoY CER
YoY AER
OPAT 5,298 4,635 13% 14%
Short-term fluctuations in investment return related to equities and real estate, net of tax(2) (2,063) 2,040 n/m n/m
Reclassification of revaluation gain for property held for own use, net of tax(2)(3) (212) (84) n/m n/m
Corporate transaction related costs, net of tax(3) (148) (25) n/m n/m
Implementation costs of new accounting standards, net of tax(3) (42) (7) n/m n/m
Other non-operating investment return and other items, net of tax(3) (236) (63) n/m n/m
Total 2,597 6,496 (60)% (60)%
Notes:(1) Attributable to shareholders of the Company only excluding non-controlling interests.
(2) Short-term fluctuations in investment return include the revaluation gain for property held for own use. This amount is then reclassified out of net profit to conform to IFRS measurement and presentation.
(3) The comparative information has been adjusted to conform to current year presentation.
IFRS NON-OPERATING MOVEMENTAIA’s IFRS net profit definition includes mark-to-market movements from our equity portfolio. IFRS net profit
decreased by 60 per cent to US$2,597 million compared with 2017. The decrease was due to negative short-term
fluctuations from equities and real estate of US$2,063 million, particularly in respect of our other participating
business with distinct portfolios, compared with positive movements of US$2,040 million in 2017. Other non-
operating items in 2018 included corporate transaction related costs of US$148 million, representing tax
expenses in relation to the subsidiarisation of AIA Korea and costs associated with the acquisition of Sovereign,
and implementation costs of new accounting standards of US$42 million.

ANNUAL REPORT 2018 | 027
OV
ER
VIE
WF
INA
NC
IAL
AN
D O
PE
RA
TIN
G R
EV
IEW
CO
RP
OR
AT
E G
OV
ER
NA
NC
EF
INA
NC
IAL
STA
TE
ME
NT
SA
DD
ITIO
NA
L IN
FO
RM
AT
ION
Movement in Shareholders’ Allocated Equity
US$ millions, unless otherwise stated 2018 2017
Opening shareholders’ allocated equity 36,413 29,653
Net profit 2,597 6,496
Purchase of shares held by employee share-based trusts (11) (10)
Dividends (1,589) (1,376)
Revaluation gains on property held for own use 8 88
Foreign currency translation adjustments (732) 1,409
Other capital movements 109 153
Total movement in shareholders’ allocated equity 382 6,760
Closing shareholders’ allocated equity 36,795 36,413
Average shareholders’ allocated equity 36,604 33,034
The movement in shareholders’ allocated equity is shown before fair value reserve movements. AIA believes
this provides a clearer reflection of the underlying movement in shareholders’ equity over the year, before the
IFRS accounting treatment of market value movements in available for sale bonds.
Average shareholders’ allocated equity increased by US$3,570 million to US$36,604 million in 2018 compared
with US$33,034 million in 2017 as a result of a higher opening position for 2018 arising from significant mark-
to-market gains in our equity portfolio during 2017.
At 31 December 2018, shareholders’ allocated equity remained stable at US$36,795 million, after the payment
of shareholder dividends of US$1,589 million, reflecting the depreciation of local currencies against our US
dollar reporting currency of US$732 million and net profit of US$2,597 million which included negative mark-
to-market movement from our equity portfolio.
Sensitivities arising from foreign exchange rate, interest rate and equity price movements are included in note
37 to the financial statements.

| AIA GROUP LIMITED028
FINANCIAL AND OPERATING REVIEWFINANCIAL REVIEW
FINANCIAL AND OPERATING REVIEW
IFRS EARNINGS PER SHARE (EPS)
Basic EPS based on IFRS OPAT attributable to shareholders increased by 12 per cent to 44.07 US cents in 2018.
Basic EPS based on IFRS net profit attributable to shareholders, including mark-to-market movements from our
equity and investment property portfolios, decreased by 60 per cent to 21.60 US cents in 2018.
IFRS EPS – Basic
Net Profit(1) OPAT(1)
2018 2017 2018 2017
Profit (US$ millions) 2,597 6,496 5,298 4,635
Weighted average number of ordinary shares (millions) 12,021 12,002 12,021 12,002
Basic earnings per share (US cents) 21.60 54.12 44.07 38.62
IFRS EPS – Diluted
Net Profit(1) OPAT(1)
2018 2017 2018 2017
Profit (US$ millions) 2,597 6,496 5,298 4,635
Weighted average number of ordinary shares(2) (millions) 12,056 12,039 12,056 12,039
Diluted earnings per share(2) (US cents) 21.54 53.96 43.94 38.50
Notes:(1) Attributable to shareholders of the Company only excluding non-controlling interests.
(2) Diluted earnings per share including the dilutive effects, if any, of the awards of share options, restricted share units, RSPUs and RSSUs granted to eligible directors, officers, employees and agents under the share-based compensation plans as described in note 39 to the financial statements.
CAPITAL
FREE SURPLUS GENERATIONThe Group’s free surplus at 31 December 2018 represented the excess of adjusted net worth over required
capital including the consolidated reserving and capital requirements.
Free surplus increased by US$2,165 million to US$14,751 million at 31 December 2018. This included a positive
addition to free surplus of US$1,886 million due to the subsidiarisation of AIA Korea and a deduction of US$497
million for the net effect of the acquisition of Sovereign.
Underlying free surplus generation, which excludes investment return variances and other items, increased
to US$4,945 million, representing growth of 13 per cent on a comparable basis before a reduction of US$263
million relating to the subsidiarisation of AIA Korea. This reflects the growing scale of our in-force business and
our focus on writing quality new business with attractive returns on capital. The amount invested in writing new
business increased by 10 per cent to US$1,540 million.
The overall effect of investment return variances and other items including regulatory developments was
negative US$795 million and the payment of shareholder dividends was US$1,589 million.

ANNUAL REPORT 2018 | 029
OV
ER
VIE
WF
INA
NC
IAL
AN
D O
PE
RA
TIN
G R
EV
IEW
CO
RP
OR
AT
E G
OV
ER
NA
NC
EF
INA
NC
IAL
STA
TE
ME
NT
SA
DD
ITIO
NA
L IN
FO
RM
AT
ION
The following table summarises the change in free surplus:
US$ millions, unless otherwise stated 2018 2017
Opening free surplus 12,586 9,940
Release of free surplus through the subsidiarisation of AIA Korea on 1 January 2018 1,886 –
Effect of acquisition (497) –
Underlying free surplus generated 4,945 4,568
Free surplus used to fund new business (1,540) (1,386)
Investment return variances and other items (795) 1,039
Unallocated Group Office expenses (170) (195)
Dividends (1,589) (1,376)
Finance costs and other capital movements (75) (4)
Closing free surplus 14,751 12,586
NET FUNDS TO GROUP CORPORATE CENTREWorking capital comprises debt and equity securities, deposits and cash and cash equivalents held at the Group
Corporate Centre. Working capital increased to US$10,296 million at 31 December 2018.
Net remittances from business units increased by US$714 million to US$2,753 million compared with US$2,039
million in 2017, mainly due to higher remittances from China and Other Markets, which largely reflected a special
remittance from New Zealand post acquisition of Sovereign. This was partly offset by a lower remittance from
Thailand in 2018 due to the timing of various required regulatory approvals, which was pending clarification of
the regulatory approval framework; subsequently Thailand remitted an additional US$319 million to the Group
Corporate Centre in January 2019.
Borrowings increased by US$1,001 million from the net proceeds of the issuance of medium-term notes of
US$1,490 million, partly offset by the redemption of medium-term notes of US$500 million upon maturity. The
total increase in working capital is reported after the payment of shareholders dividends of US$1,589 million
and the gross payment of US$918 million for the acquisition of Sovereign.
The movements in working capital are summarised as follows:
US$ millions, unless otherwise stated 2018 2017
Opening working capital 9,714 8,404
Group Corporate Centre operating results (85) (32)
Capital flows from business units
Hong Kong 1,054 952
Thailand 149 467
Singapore 267 238
Malaysia 185 192
China 542 207
Other Markets 556 (17)
Net funds remitted to Group Corporate Centre 2,753 2,039
Payment for acquisition of Sovereign (918) –
Increase in borrowings 1,001 514
Purchase of shares held by the employee share-based trusts (11) (10)
Payment of dividends (1,589) (1,376)
Change in fair value reserve and others (569) 175
Closing working capital 10,296 9,714

| AIA GROUP LIMITED030
FINANCIAL AND OPERATING REVIEWFINANCIAL REVIEW
FINANCIAL AND OPERATING REVIEW
IFRS BALANCE SHEET
Consolidated Statement of Financial Position
US$ millions, unless otherwise stated
As at 31 December
2018
As at 31 December
2017Change
AER
Assets
Financial investments 186,142 179,503 4%
Investment property 4,794 4,363 10%
Cash and cash equivalents 2,451 1,922 28%
Deferred acquisition and origination costs 24,626 21,950 12%
Other assets 11,793 10,908 8%
Total assets 229,806 218,646 5%
Liabilities
Insurance and investment contract liabilities 172,649 159,685 8%
Borrowings 4,954 3,958 25%
Other liabilities 12,797 11,447 12%
Less total liabilities 190,400 175,090 9%
Equity
Total equity 39,406 43,556 (10)%
Less non-controlling interests 400 380 5%
Total equity attributable to shareholders of AIA Group Limited 39,006 43,176 (10)%
Shareholders’ allocated equity 36,795 36,413 1%
Movement in Shareholders’ Equity
US$ millions, unless otherwise stated 2018 2017
Opening shareholders’ equity 43,176 34,555
Net profit 2,597 6,496
Fair value (losses)/gains on assets (4,552) 1,861
Purchase of shares held by employee share-based trusts (11) (10)
Dividends (1,589) (1,376)
Revaluation gains on property held for own use 8 88
Foreign currency translation adjustments (732) 1,409
Other capital movements 109 153
Total movement in shareholders’ equity (4,170) 8,621
Closing shareholders’ equity 39,006 43,176

ANNUAL REPORT 2018 | 031
OV
ER
VIE
WF
INA
NC
IAL
AN
D O
PE
RA
TIN
G R
EV
IEW
CO
RP
OR
AT
E G
OV
ER
NA
NC
EF
INA
NC
IAL
STA
TE
ME
NT
SA
DD
ITIO
NA
L IN
FO
RM
AT
ION
Total Investments
US$ millions, unless otherwise stated
As at 31 December
2018Percentage
of total
As at 31 December
2017Percentage
of total
Total policyholder and shareholder 171,337 88% 162,676 87%
Total unit-linked contracts and consolidated investment funds 23,938 12% 24,815 13%
Total investments 195,275 100% 187,491 100%
The investment mix remained stable during the year as set out below:
Unit-Linked Contracts and Consolidated Investment Funds
US$ millions, unless otherwise stated
As at 31 December
2018Percentage
of total
As at 31 December
2017Percentage
of total
Unit-linked contracts and consolidated investment funds
Debt securities 4,765 20% 4,720 19%
Loans and deposits 81 – 97 –
Equities 18,418 77% 19,522 79%
Cash and cash equivalents 672 3% 466 2%
Derivatives 2 – 10 –
Total unit-linked contracts and consolidated investment funds 23,938 100% 24,815 100%

| AIA GROUP LIMITED032
FINANCIAL AND OPERATING REVIEWFINANCIAL REVIEW
FINANCIAL AND OPERATING REVIEW
Policyholder and Shareholder Investments
US$ millions, unless otherwise stated
As at 31 December
2018Percentage
of total
As at 31 December
2017Percentage
of total
Participating funds and Other participating business with distinct portfolios(1)
Government and government agency bonds 14,121 8% 11,470 7%
Corporate bonds and structured securities 30,183 18% 28,403 18%
Loans and deposits 2,179 1% 2,245 1%
Subtotal – Fixed income investments 46,483 27% 42,118 26%
Equities 13,892 8% 12,498 8%
Investment property and property held for own use 888 1% 761 –
Cash and cash equivalents 395 – 201 –
Derivatives 148 – 82 –
Subtotal Participating funds and Other participating business with distinct portfolios 61,806 36% 55,660 34%
Other policyholder and shareholder(1)
Government and government agency bonds 49,317 29% 45,693 28%
Corporate bonds and structured securities 41,835 24% 42,583 26%
Loans and deposits 5,132 3% 5,868 4%
Subtotal – Fixed income investments 96,284 56% 94,144 58%
Equities 5,789 3% 6,059 4%
Investment property and property held for own use 5,794 4% 5,305 3%
Cash and cash equivalents 1,384 1% 1,255 1%
Derivatives 280 – 253 –
Subtotal other policyholder and shareholder 109,531 64% 107,016 66%
Total policyholder and shareholder 171,337 100% 162,676 100%
Note:(1) Presentation of Participating funds and Other participating business with distinct portfolios and Other policyholder and shareholder is consistent with
note 20 to the financial statements. The comparative information has been adjusted to conform to current year presentation. Please refer to note 20 to the financial statements for additional information.

ANNUAL REPORT 2018 | 033
OV
ER
VIE
WF
INA
NC
IAL
AN
D O
PE
RA
TIN
G R
EV
IEW
CO
RP
OR
AT
E G
OV
ER
NA
NC
EF
INA
NC
IAL
STA
TE
ME
NT
SA
DD
ITIO
NA
L IN
FO
RM
AT
ION
ASSETSParticipating business is written in a segregated statutory fund, with regulations governing the division of
surplus between policyholders and shareholders. “Other participating business with distinct portfolios” is
supported by segregated investment assets and explicit provisions for future surplus distribution though the
division of surplus between policyholders and shareholders is not defined in regulations. We have enhanced
our investment disclosures to reflect the nature and greater size of this business by grouping its assets together
with participating business. Comparative information is also shown for 31 December 2017.
Total assets increased by US$11,160 million to US$229,806 million at 31 December 2018, compared with
US$218,646 million at 31 December 2017.
Total investments including financial investments, investment property, property held for own use, and cash
and cash equivalents increased by US$7,784 million to US$195,275 million at 31 December 2018, compared
with US$187,491 million at 31 December 2017.
Of the total US$195,275 million investments at 31 December 2018, US$171,337 million were held in respect of
policyholders and shareholders and the remaining US$23,938 million were backing unit-linked contracts and
consolidated investment funds.
Fixed income investments, including debt securities, loans and term deposits held in respect of policyholders
and shareholders, totalled US$142,767 million at 31 December 2018 compared with US$136,262 million at
31 December 2017. The average credit rating of the fixed income portfolio of A remained consistent with the
position at 31 December 2017.
Government and government agency bonds represented 44 per cent of fixed income investments at 31
December 2018, compared with 42 per cent at 31 December 2017. Corporate bonds and structured securities
accounted for 50 per cent of fixed income investments at 31 December 2018, compared with 52 per cent at 31
December 2017.
Equity securities held in respect of policyholders and shareholders totalled US$19,681 million at 31 December
2018, compared with US$18,557 million at 31 December 2017. The US$1,124 million increase in carrying
value was mainly attributable to new purchases offset by negative mark-to-market movements. Within this
figure, equity securities of US$13,892 million were held in participating funds and other participating business
with distinct portfolios.
Cash and cash equivalents increased by US$529 million to US$2,451 million at 31 December 2018 compared
with US$1,922 million at 31 December 2017. The increase largely reflected positive net cash inflows from our
operating business, net proceeds of the issuances of medium-term notes totalling US$1,490 million during the
year, partly offset by the redemption of medium-term notes of US$500 million upon maturity and the payment
of shareholder dividends of US$1,589 million.
Investment property and property held for own use in respect of policyholders and shareholders totalled
US$6,682 million at 31 December 2018 compared with US$6,066 million at 31 December 2017.
Deferred acquisition and origination costs increased to US$24,626 million at 31 December 2018 compared
with US$21,950 million at 31 December 2017, largely reflecting new business growth.
Other assets increased to US$11,793 million at 31 December 2018 compared with US$10,908 million at 31
December 2017, reflecting an increase in reinsurance recoveries, accrued interest and prepayments.

| AIA GROUP LIMITED034
FINANCIAL AND OPERATING REVIEWFINANCIAL REVIEW
FINANCIAL AND OPERATING REVIEW
LIABILITIESTotal liabilities increased to US$190,400 million at 31 December 2018 from US$175,090 million at 31 December
2017.
Insurance and investment contract liabilities grew to US$172,649 million at 31 December 2018 compared with
US$159,685 million at 31 December 2017, reflecting the underlying growth of the in-force portfolio offset by
negative mark-to-market movements on equities backing unit-linked and participating policies and negative
foreign exchange translation.
Borrowings increased to US$4,954 million at 31 December 2018, due to the net proceeds of the issuances of
medium-term notes totalling US$1,490 million during the year, partly offset by the redemption of medium-term
notes of US$500 million upon maturity. Medium-term notes with a notional amount of US$500 million issued
in 2014 will mature in March 2019 as disclosed in note 29 to the financial statements. Leverage ratio, which is
defined as borrowings expressed as a percentage of total borrowings and equity, was 11.2 per cent, compared
with 8.3 per cent at 31 December 2017.
Other liabilities were US$12,797 million at 31 December 2018, compared with US$11,447 million at 31
December 2017, reflecting an increase in deferred tax liabilities and investment-related payables.
Details of commitments and contingencies are included in note 42 to the financial statements.
REGULATORY CAPITAL
Our Group supervisor is the Hong Kong Insurance Authority (HKIA). The Group’s principal operating company
is AIA Co., a Hong Kong-domiciled insurer.
At 31 December 2018, the total available capital for AIA Co., our main regulated entity, was US$9,208 million as
measured under the Hong Kong Insurance Ordinance (HKIO) basis, resulting in a solvency ratio of 421 per cent
of regulatory minimum capital compared with 446 per cent at 31 December 2017. Our solvency ratio remained
very strong after the effect of the acquisition of Sovereign and dividends to the Company.
A summary of the total available capital and solvency ratios of AIA Co. is as follows:
US$ millions, unless otherwise stated
As at 31 December
2018
As at 31 December
2017
Total available capital 9,208 8,395
Regulatory minimum capital (100%) 2,189 1,882
Solvency ratio (%) 421% 446%
The Group’s individual branches and subsidiaries are also subject to supervision, including relevant capital
requirements, in the jurisdictions in which they and their parent entity operate. The local operating units
were in compliance with the capital requirements of their respective entity and local regulators in each of our
geographical markets at 31 December 2018.

ANNUAL REPORT 2018 | 035
OV
ER
VIE
WF
INA
NC
IAL
AN
D O
PE
RA
TIN
G R
EV
IEW
CO
RP
OR
AT
E G
OV
ER
NA
NC
EF
INA
NC
IAL
STA
TE
ME
NT
SA
DD
ITIO
NA
L IN
FO
RM
AT
ION
GLOBAL MEDIUM-TERM NOTE AND SECURITIES PROGRAMME
Under our US$6 billion Global Medium-term Note (GMTN) and Securities programme, the Company issued
senior unsecured fixed rate notes with a nominal amount of US$500 million and HK$3,900 million in April 2018
and US$500 million in September 2018. The US$500 million notes issued in April 2018 bear annual interest
of 3.90 per cent and will mature in 2028. The HK$3,900 million notes issued in April 2018, which are not
listed, bear annual interest of 2.76 per cent and will mature in 2021. The US$500 million notes issued
in September 2018 bear annual interest of 3 months LIBOR rate plus 0.52 per cent and will mature in 2021.
The Company redeemed senior unsecured fixed rate notes with a nominal amount of US$500 million in March
2018. At 31 December 2018, the aggregate carrying amount of the debt issued under the GMTN and Securities
programme was US$4,954 million.
On 16 January 2019, the Group issued Hong Kong dollar-denominated fixed rate medium-term notes that are
unlisted. The offering comprised of HK$1,300 million of 3.5-year notes at an annual rate of 2.95 per cent and
HK$1,100 million of 12-year notes at an annual rate of 3.68 per cent. In aggregate the US dollar-equivalent is
approximately US$307 million.
CREDIT RATINGS
At 31 December 2018, AIA Co. has financial strength ratings of Aa2 (Very Low Credit Risk) with a stable outlook
from Moody’s; AA (Very Strong) with a stable outlook from Fitch; and AA- (Very Strong) with a stable outlook
from Standard & Poor’s.
The Company has issuer credit ratings of A2 (Low Credit Risk) with a stable outlook from Moody’s; AA- (Very High
Credit Quality) with a stable outlook from Fitch; and A (Strong) with a stable outlook from Standard & Poor’s.
DIVIDENDS
The Board has recommended an increase in the final dividend of 14 per cent to 84.80 Hong Kong cents per
share, consistent with AIA’s established prudent, sustainable and progressive dividend policy. The Board
has also recommended a special dividend of 9.50 Hong Kong cents per share for the additional month in the
accounting period due to the change of the Company’s financial year-end date from 30 November 2018 to 31
December 2018. The dividends reflect the strength of our financial results and the Board’s continued confidence
in the future prospects of the Group. The recommended dividends are subject to shareholders’ approval at the
Company’s forthcoming AGM.

| AIA GROUP LIMITED036
FINANCIAL AND OPERATING REVIEW
BUSINESS REVIEW
DISTRIBUTION
AGENCYAIA’s proprietary tied agency is our core distribution channel and a major growth engine for the Group. The
professionalism and extensive scale of our agency force are key competitive advantages for AIA. They enable
regular and personalised customer engagement while delivering our comprehensive suite of products and
services to address customer needs through different life stages.
The focused execution of our Premier Agency strategy delivered very strong VONB growth in 2018 with an
increase of 26 per cent to US$2,943 million. VONB from agency represented 72 per cent of the Group’s total
VONB. ANP grew by 18 per cent to US$4,179 million and VONB margin increased to 70.4 per cent.
AIA’s Premier Agency strategy provides our agents with best-in-class training and development programmes,
empowering them to offer high-quality advice and help our customers live Healthier, Longer, Better Lives. In
2018, we launched new digital support tools and enhanced our targeted training and development programmes
to boost the quality and professionalism of our agents and agency leaders. We also raised the minimum
performance standards in all our markets as we continued to focus on agency quality as a key differentiator for
AIA across the region.
We invest in developing digital mobile platforms across the Group to enhance the sales and service experience
for both agents and customers. More than 90 per cent of total agency new business for the Group was submitted
through our interactive Point of Sale (iPoS) technology during 2018. In 2018, we began to integrate financial
needs analysis and our propensity models into our digital tools, including iPoS, to guide our agents and better
enable them to advise our customers on the most suitable products for their needs. We also started to pilot
digital classrooms in many of our markets, which aims to create a more interactive and engaging learning
experience that is completely paperless.
Overall, our initiatives and continued focus on quality recruitment supported 7 per cent growth in the number of
active agents and a double-digit increase in active agent productivity for the Group over the year.
In 2018, AIA reported another outstanding result in Million Dollar Round Table (MDRT) membership with
over 10,000 registered members across the Group. This represents an increase of 22 per cent compared with
2017 and is a clear indicator of our strong progress in developing a professional, full-time agency force. AIA
has become the first multinational company to have the most MDRT registered members globally for four
consecutive years.

ANNUAL REPORT 2018 | 037
OV
ER
VIE
WF
INA
NC
IAL
AN
D O
PE
RA
TIN
G R
EV
IEW
CO
RP
OR
AT
E G
OV
ER
NA
NC
EF
INA
NC
IAL
STA
TE
ME
NT
SA
DD
ITIO
NA
L IN
FO
RM
AT
ION
PARTNERSHIPSAIA’s partnership distribution is complementary to our proprietary agency and accounted for 28 per cent of the
Group’s total VONB in 2018. VONB from partnership distribution increased 11 per cent to US$1,172 million,
building on the exceptionally strong performance from Hong Kong’s retail IFA channel in the first half of 2017
as previously highlighted. ANP increased by 10 per cent to US$2,331 million, while VONB margin remained
strong at 50.3 per cent.
Our long-term strategic partnerships with many of the leading multinational and local banks across our
markets are an important competitive advantage. Bancassurance for the Group reported 18 per cent VONB
growth, reflecting success from various initiatives, including joint marketing campaigns customised for specific
customer segments, analytics-backed digital leads generation and bespoke sales management programmes.
Over the course of the year, we launched new long-term strategic partnerships with Bangkok Bank Public
Company Limited (Bangkok Bank) in Thailand and ASB Bank Limited (ASB) in New Zealand. We also introduced
AIA Vitality to our existing bancassurance partnerships in many of our markets to further differentiate AIA’s
products and services from our competitors. For example, sales of Vitality integrated products accounted for
nearly two-thirds of total products able to be sold together with the wellness programme in our partnership
with the Bank of the Philippine Islands (BPI).
Our intermediated channels, including IFAs, brokers, private banks and specialist advisers, delivered strong
VONB growth in the second half of 2018 and positive growth for the full year, building on the exceptional result
in the first half of 2017. We maintained our leadership position in our key markets with a service support model
that is both highly differentiated and tailored for our major partners.
VONB results for our direct marketing business benefited from strong growth in Korea as we continued to
strengthen engagement with our partners and the new business mix shifted towards higher-margin protection
products.
In 2018, AIA also launched new non-traditional partnerships with technology companies and telecommunication
providers, including WeDoctor in China and SK Telecom in Korea. These partnerships represent a significant
additional opportunity for AIA, providing broader customer access and enabling us to offer new digital health
and wellness services in these markets as part of our brand promise.

03
04
01
02
| AIA GROUP LIMITED038
FINANCIAL AND OPERATING REVIEWBUSINESS REVIEW
01 Since its launch in 2013, AIA Vitality has driven a step change in customer engagement. The AIA Vitality Park in Hong Kong is a vibrant and active place for people celebrating health and well-being.
02 Our Global Principal Partnership with Spurs continued to play an important role in linking AIA with healthy lifestyles and encouraging active participation in sport.
03 In 2018, we launched our new purpose-led brand promise across all our markets: Healthier, Longer, Better Lives.
04 In 2018, 10 of our markets ran football training sessions with Spurs for 25,000 children, parents and employees.

ANNUAL REPORT 2018 | 039
OV
ER
VIE
WF
INA
NC
IAL
AN
D O
PE
RA
TIN
G R
EV
IEW
CO
RP
OR
AT
E G
OV
ER
NA
NC
EF
INA
NC
IAL
STA
TE
ME
NT
SA
DD
ITIO
NA
L IN
FO
RM
AT
ION
MARKETING
Our long history in Asia, since establishing a presence in Shanghai 100 years ago, means that AIA is one of the
most trusted and recognised brands in the region. In 2018, we launched our new purpose-led brand promise
across all our markets: Healthier, Longer, Better Lives. This is what we stand for as a company, expressing the
value we provide to our customers and our intent to play a role in combatting the dramatic rise of lifestyle-related
diseases in Asia. This brand promise is the focus of all of our marketing activity but also is at the heart of actions
we take as a company to help our customers live Healthier, Longer, Better Lives.
CUSTOMER ENGAGEMENTWith more than 33 million individual policies and over 16 million participating members of group insurance
schemes, the scale and footprint of AIA’s customer base presents a huge growth opportunity as we actively
engage and nurture long-term relationships with our customers. We continue to enrich our customer data
and increasingly employ enhanced machine learning to better understand their needs and create meaningful
customer segmentation to help deliver individually-tailored product and service offerings. Propensity modelling
provides insights into customer characteristics and behaviours that influence their decision to buy insurance.
The resulting targeted sales campaigns, in collaboration with our bank partners, have generated up to three
times the closing rate compared with campaigns where no propensity models were used for lead selection.
The Asian markets in which we operate continue to witness exceptional growth in mobile and internet usage.
Our customers engage with our businesses both online and offline, and we continue to invest in improving our
capabilities to satisfy their preferences: from online self-service for simple solutions to holistic planning and
support from our market-leading, professional agents.
Our Global Ambassador, David Beckham, took part in large-scale AIA events in Indonesia, China, Hong Kong,
Australia and Thailand during the year, promoting our brand to tens of millions of people. This helped to raise
awareness of our brand promise among our customers and other stakeholders and the importance of taking
small steps towards a healthier life. The second phase of the #WhatsYourWhy campaign featuring David was
launched across our markets with children, often people’s greatest motivator, asking about healthy living. To
date, we have recorded over 56 million views of the video supporting the campaign and there have been over
two million visitors to the campaign webpages.
Our Global Principal Partnership with Tottenham Hotspur Football Club (Spurs) continued to play an important
role in linking AIA with healthy lifestyles and encouraging active participation in sport. In 2018, 10 of our
markets ran football training sessions with Spurs for 25,000 children, parents and employees.
PRODUCT INNOVATIONSince its launch in 2013, AIA Vitality has driven a step change in customer engagement, rewarding healthier
behaviour and generating positive health outcomes where it has been adopted. In 2018, we continued to refine
our mobile platform providing our customers with an expanded wellness proposition, enhanced functionality
and an improved user experience.
During 2018, we launched 20 new products integrated with AIA Vitality, including the first such product in the
Korean market, bringing the total to 85 integrated products across the Group. Based on the health assessments
provided by AIA Vitality members in six markets, the proportion of members who have moved from an unhealthy
to a healthy range in blood pressure and cholesterol levels has reached 56 per cent and 38 per cent respectively.
Across Asia, AIA Vitality members engage with AIA 16 times more frequently than our other customers.

| AIA GROUP LIMITED040
FINANCIAL AND OPERATING REVIEWBUSINESS REVIEW
To date, more than three million health assessments and two million body mass index (BMI) readings have been
uploaded to our platform by AIA Vitality members, and each day more than 600,000 workouts are submitted
through fitness trackers. Total membership in our wellness programmes has exceeded 1.2 million.
Health and wellness is increasingly core to our customer propositions, reflecting our brand promise. In 2018,
AIA Malaysia introduced an innovative medical plan, A-Plus Health, which provides a “health wallet” based
on customer behaviour and claims history that can be spent on recovery and preventative health benefits or
enhanced policy benefits. We have also developed a new critical illness plan that helps protect our customers’
physical and mental health in Singapore. In the event of a critical illness or mental illness, the plan not only
supports our customers financially but also gives them access to personalised medical support. Our exclusive
partnership with Medix was extended and now provides first-of-its-kind, personal medical case management
services to our customers in Singapore as well as Hong Kong.
TECHNOLOGY AND OPERATIONS
A key enabler of our Group’s strategic priorities is the transformation of our technology systems and business
processes through digitalisation. During the year, we made significant investments in relevant technology to
enhance back-office processes and systems, driving further productivity improvements across all distribution
channels and using innovation to improve customer experience and the products we offer.
Information security is critical for an insurer and in 2018 we established a new cybersecurity shared services
centre to provide additional advanced cyberthreat detection and response capabilities. We have also enhanced
our ability to detect cyberthreats by implementing artificial intelligence (AI) capabilities on our devices. We
now continuously analyse system behaviour for suspicious activity and use advanced e-mail threat detection to
protect our business against phishing threats. Our dedicated cybersecurity team has made significant progress
in strengthening AIA’s business continuity capabilities by successfully testing our technology readiness across
all critical applications.
INCREASING EFFICIENCY THROUGH DIGITALISATIONEvery year our customers interact with us on more than 34 million standard product-related insurance
transactions and an additional 105 million digital customer interactions through AIA Vitality. Digitalisation
of our back office has enabled greater operational efficiencies across the Group and supports the delivery
of excellent customer service. Increased digitalisation of customer services has helped productivity with an
increase in transactions per employee of 25 per cent across the Group in 2018.
Increasingly we employ AI capabilities to support our operations, enhancing the choice and convenience we
offer to customers and distributors. AI supports new business processes in many ways, including intelligent
application tools, servicing powered by chatbots, and using advanced analytics within claims handling to make
efficiency improvements and identify potential fraud. In China, online tools and an AI-enabled service bot for
agent servicing allowed us to rationalise our call centres in the fourth quarter of 2018.
In 2018, we completed the migration of the Group’s back office to a dedicated “private cloud” environment,
ensuring business continuity across all of our markets. AIA has built strategic partnerships with IBM and BT as
we progress our data centre modernisation project. During 2018, we also expanded our strategic relationship
with Microsoft and built the operational capabilities to deliver a “hybrid multi-cloud” strategy which supports
our business transformation.

ANNUAL REPORT 2018 | 041
OV
ER
VIE
WF
INA
NC
IAL
AN
D O
PE
RA
TIN
G R
EV
IEW
CO
RP
OR
AT
E G
OV
ER
NA
NC
EF
INA
NC
IAL
STA
TE
ME
NT
SA
DD
ITIO
NA
L IN
FO
RM
AT
ION
We also established a Robotic Process Automation centre of excellence in our shared services centre based in
Malaysia, using both Nice and Automation Anywhere. We have already seen improvements in processing time
of up to 50 per cent for some transactions, enabling us to refocus resources on more complex, high-value tasks.
DRIVING PRODUCTIVITY AND SERVICE EXCELLENCEAIA’s digital point-of-sale technology continues to evolve and its impact is growing: more than 90 per cent of
new business across the Group was submitted digitally in 2018. Automatic underwriting rates continued to
increase in 2018 with 57 per cent of all new business applications across the Group underwritten through our
rules engine at the point of sale with no human intervention.
The combination of front-end digitalisation and back-end automation is delivering tangible results for customers
across the Group with dramatically shorter turnaround times. End-to-end straight-through-processing rates
reached 70 per cent on new business in AIA China by the end of 2018. Turnaround times for these transactions
are now minutes instead of days.
We continued to expand the suite of applications in our agency interactive Mobile Office (iMO) platform. iRecruit
improves the quality of our recruitment and the success of our new recruit onboarding, while iAcademy is an
e-learning platform deployed across our businesses, enabling agents to learn at their own pace.
MyPage, our next generation customer platform, is operational in all of our major markets, linking our customers
with our products and services in a single portal.
PROMOTING INNOVATION AND ENHANCED CUSTOMER EXPERIENCEAIA is building core innovation capabilities in key areas such as AI and blockchain while developing a growing
network of expertise in emerging technologies. Our strategy is to apply innovative technology to enable the
transformation and enhancement of our business, deepening customer engagement and supporting sustainable
growth.
We are focused on digital health and wellness as we develop our ecosystems to significantly improve customer
experience. In Malaysia, A-Plus Health includes an innovative “health wallet” and AIA Thailand launched
“Connected Claims”, a digital health claim service which enables a much-improved cashless claims experience
for our customers. Our partnership with WeDoctor provides customers of AIA China with preferred access to its
technology-enabled healthcare solutions.
We established a blockchain lab in Vietnam with our partner FPT Software in 2018, which has allowed us
to leverage IBM’s Hyperledger technology. AIA is also a member of the R3 blockchain consortium and we
have participated in global trials including the Know Your Customer application, which is built on the Corda
open-source blockchain platform.
Transformational technologies such as cognitive AI provide additional capacity that can help our highly-trained
staff to deliver around-the-clock services to our agents and customers as well as achieve greater back office
efficiencies. Examples include self-service chatbot capabilities for employees, agents and customers. Our
operations in Hong Kong and Singapore also became the first insurance companies in their markets to introduce
humanoid robots in their customer service centres.

| AIA GROUP LIMITED042
FINANCIAL AND OPERATING REVIEW
FINANCIAL HIGHLIGHTSAIA Hong Kong delivered excellent VONB growth across both domestic and Mainland Chinese visitor customer
segments, once again demonstrating the outstanding quality of our multi-channel distribution. VONB increased
by 24 per cent to US$1,712 million and ANP grew 8 per cent to US$2,697 million as we maintained our focus
on executing our Premier Agency strategy and driving sustainable growth across our partnership distribution
channel. Our product mix continued to shift towards higher-margin long-term savings and protection products
which supported an increase in VONB margin to 62.0 per cent. OPAT increased by 11 per cent to US$1,814
million as a result of strong underlying business growth and better claims experience, partly offset by an
increasing proportion of participating business in the in-force portfolio.
BUSINESS HIGHLIGHTSOur Premier Agency strategy in Hong Kong is focused on quality recruitment by attracting young, high-calibre
recruits and developing them into MDRT agents and future leaders. Our comprehensive recruitment and training
platforms, AIA Premier Academy and AIA Premier Leaders Academy, are supported by a broad suite of digital
tools that enable our agents to better engage and connect with customers. In 2018, our focused execution of
these initiatives drove a double-digit increase in the number of active agents and further productivity gains,
which sustained very strong VONB growth over the year.
Our long-term strategic partnership with Citibank also delivered very strong VONB growth. We collaborated
closely with the bank to launch marketing campaigns targeted at specific customer needs and to further
integrate life insurance advice and solutions into the bank’s proprietary wealth management platform. The
retail IFA channel reported solid VONB growth for the full year as sales remained steady between the first and
second half of the year.
AIA Hong Kong is committed to meeting its customers’ protection and long-term savings needs through active
engagement and enhanced customer experience, particularly by investing in new digital tools. During 2018, we
launched a mobile application that provides customers with a single portal to manage all of their AIA products
and services. We also enhanced our iPoS platform with optical character recognition and AI technology to
simplify identity document verification and further streamline on-boarding procedures for new customers.
AIA Vitality remains a key enabler for more frequent customer engagement as membership of the programme
increased by more than 40 per cent and VONB from integrated product sales doubled in 2018.
BUSINESS REVIEW • GEOGRAPHICAL MARKETS
HONG KONG

ANNUAL REPORT 2018 | 043
OV
ER
VIE
WF
INA
NC
IAL
AN
D O
PE
RA
TIN
G R
EV
IEW
CO
RP
OR
AT
E G
OV
ER
NA
NC
EF
INA
NC
IAL
STA
TE
ME
NT
SA
DD
ITIO
NA
L IN
FO
RM
AT
ION
V O N B (1) V O N B M A R G I N (2)
2017
1,3842017
53.7%
2018
1,712
HONG KONG
2018
62.0%YoY (CER)
24%YoY (CER)
8.3ppsYoY (AER)
24%YoY (AER)
8.3pps
A N P T W P I2017
2,4932017
9,5352018
2,6972018
11,444YoY (CER)
8%YoY (CER)
20%YoY (AER)
8%YoY (AER)
20%
2017
1,6272018
1,814
O PAT
YoY (CER)
11%YoY (AER)
11%US$ MILLIONS, UNLESS OTHERWISE STATED

| AIA GROUP LIMITED044
FINANCIAL AND OPERATING REVIEWBUSINESS REVIEW • GEOGRAPHICAL MARKETS
FINANCIAL HIGHLIGHTSAIA Thailand delivered a strong performance in 2018 and returned to double-digit VONB growth with an
increase of 12 per cent to US$447 million. ANP increased 13 per cent, despite a decline across the industry
overall, while VONB margin remained strong at 73.1 per cent. Sales growth was mainly driven by accelerating
momentum in our agency channel. OPAT increased by 9 per cent to US$995 million as a result of underlying
business growth and improvements in persistency.
BUSINESS HIGHLIGHTSOur Thailand business continued to drive wholesale agency transformation through our Financial Adviser
programme, which aims to improve the overall quality and productivity of our nationwide agency force. Aimed
at selected high-potential candidates, our enhanced training and development programmes helped our newly
recruited Financial Advisers achieve an activity ratio of more than double that of other new agents, while active
new agent productivity was also significantly higher.
Our Financial Advisers’ ANP grew by 37 per cent and we continued to raise the minimum standards across our
agency to further reduce the number of less productive agents. Our focus on executing our strategy saw a 36
per cent increase in the number of MDRT qualifiers, and we continued to lead the industry in terms of registered
members.
In March 2018, we launched our partnership with Bangkok Bank with an initial focus on recruiting and training
the bank’s in-branch insurance specialists. During the second half, we expanded the product range and piloted
new sales models for protection and long-term savings products across the bank’s different customer segments.
AIA is the market leader for protection business in Thailand. During the year, we expanded our range of
critical illness products, which contributed to a 18 per cent increase in ANP for protection products. AIA is
committed to enhancing customer experience through digitalisation, and in 2018 we rolled out MyPage, a web
and mobile-enabled customer self-service portal, through which customers can access policy information
and update their personal details. In August, we also launched an e-payment tool that facilitates electronic
verification and enables direct benefits payments into our customers’ bank accounts.
THAILAND

ANNUAL REPORT 2018 | 045
OV
ER
VIE
WF
INA
NC
IAL
AN
D O
PE
RA
TIN
G R
EV
IEW
CO
RP
OR
AT
E G
OV
ER
NA
NC
EF
INA
NC
IAL
STA
TE
ME
NT
SA
DD
ITIO
NA
L IN
FO
RM
AT
ION
V O N B (1) V O N B M A R G I N (2)
T W P I
OPAT
2017
381
2017
519
2017
73.4%
2017
3,559
2018
447
2018
611
2018
73.1%
2018
3,895
YoY (CER)
12%YoY (CER)
(0.4)pps
YoY (CER)
13%YoY (CER)
5%
YoY (AER)
17%YoY (AER)
(0.3)pps
YoY (AER)
18%YoY (AER)
9%
2017
8682018
995YoY (CER)
9%YoY (AER)
15%US$ MILLIONS, UNLESS OTHERWISE STATED
A N P
THAILAND

| AIA GROUP LIMITED046
FINANCIAL AND OPERATING REVIEWBUSINESS REVIEW • GEOGRAPHICAL MARKETS
FINANCIAL HIGHLIGHTSAIA Singapore delivered very strong VONB growth of 18 per cent in 2018, mainly driven by the agency channel
and our strategic partnership with Citibank. ANP grew by 26 per cent, while VONB margin decreased primarily
due to lower profitability from our HealthShield business as previously highlighted and higher volumes of single
premium unit-linked business ahead of a regulatory change in October 2018. OPAT increased by 7 per cent to
US$558 million despite pressure on profitability from double-digit medical inflation in the market.
BUSINESS HIGHLIGHTSAIA Singapore maintained its market leadership position in agency distribution and delivered very strong
growth in VONB through this core distribution channel. Focused execution of our Premier Agency strategy
drove increases in both the number of active agents and productivity, as our professional agents continued to
concentrate on meeting customer needs with an emphasis on regular premium protection products.
In 2018, we developed several innovative digital tools including a new mobile application integrated with our
propensity models that helps our agents engage with customers more effectively to better meet their needs. The
introduction of these tools and our targeted recruitment and training programmes drove active agent growth of
16 per cent and a double-digit increase in productivity.
Our strategic partnership with Citibank delivered excellent VONB growth, with a focus on recruiting and
enhancing the productivity of the bank’s insurance specialists to address our customers’ protection needs. AIA
Singapore also remained a market leader in the group insurance market where we secured several new and
sizeable corporate client cases during the year.
Throughout 2018, we continued to dedicate significant efforts to deliver high-quality and sustainable healthcare
services to our customers within a very competitive health insurance market. We further expanded our AIA
Quality Healthcare Partners network, increased the number of participating hospitals with pre-approval claims
services and offered more medical plan options to our customers. We also launched an exclusive partnership
with Medix that provides first-of-its-kind, personal medical case management services to our customers.
AIA Singapore also continued to invest in our award-winning AIA Vitality wellness programme. We added new
reward benefits, launched a new AIA Vitality mobile application and integrated the programme across more
insurance products. Overall membership of AIA Vitality increased by over 40 per cent with 70 per cent growth
in the number of corporate members compared with 2017.
SINGAPORE

ANNUAL REPORT 2018 | 047
OV
ER
VIE
WF
INA
NC
IAL
AN
D O
PE
RA
TIN
G R
EV
IEW
CO
RP
OR
AT
E G
OV
ER
NA
NC
EF
INA
NC
IAL
STA
TE
ME
NT
SA
DD
ITIO
NA
L IN
FO
RM
AT
ION
V O N B (1) V O N B M A R G I N (2)
OPAT
2017
2972017
69.7%
2018
3572018
65.4%YoY (CER)
18%YoY (CER)
(4.3)ppsYoY (AER)
20%YoY (AER)
(4.3)pps
2017
5132018
558YoY (CER)
7%YoY (AER)
9%US$ MILLIONS, UNLESS OTHERWISE STATED
T W P I2017
4262017
2,4352018
5472018
2,738YoY (CER)
26%YoY (CER)
10%YoY (AER)
28%YoY (AER)
12%
A N P
SINGAPORE

| AIA GROUP LIMITED048
FINANCIAL AND OPERATING REVIEWBUSINESS REVIEW • GEOGRAPHICAL MARKETS
FINANCIAL HIGHLIGHTSDespite reduced consumer activity and changes to tax regulations during the year, AIA Malaysia delivered an
8 per cent increase in VONB for the full year to US$247 million as growth improved in the second half. ANP
increased by 5 per cent to US$382 million, and VONB margin remained strong at 63.8 per cent as we launched
several new flagship unit-linked and health propositions. Driven by underlying business growth, OPAT increased
by 9 per cent to US$320 million.
BUSINESS HIGHLIGHTSAIA Malaysia’s agency remains focused on selective recruitment and continued development of our training
capabilities, which supported an increase in agent productivity. The Takaful segment also continues to be an
important area of strategic focus for AIA Malaysia and our Takaful agency delivered solid VONB growth in 2018.
In the first half of 2018, we launched the AIA Life Planner App, our proprietary digital tool for agency sales
activity management. We then introduced a series of upgrades and new functionality for both agents and
agency leaders in the second half of the year. Response to the platform has been very positive, with usage
reaching more than 80 per cent.
Our strategic partnership with Public Bank Berhad delivered double-digit VONB growth as we continued to
drive greater penetration of the bank’s affluent customer base, which was helped by the launch of a bespoke
high sum assured regular premium unit-linked product. AIA also retained our position as the clear leader in
Malaysia’s group insurance market.
In the second half of 2018, AIA Malaysia became the first insurer in the country to offer unit-linked products that
are compliant with the new Minimum Allocation Rate regulation in advance of the formal regulatory deadline.
We also launched a new health rider for these products, which is integrated with our AIA Vitality programme.
This rider offers first-to-market healthcare and wellness features designed to encourage healthy living and
provide recovery support following treatment.
MALAYSIA

ANNUAL REPORT 2018 | 049
OV
ER
VIE
WF
INA
NC
IAL
AN
D O
PE
RA
TIN
G R
EV
IEW
CO
RP
OR
AT
E G
OV
ER
NA
NC
EF
INA
NC
IAL
STA
TE
ME
NT
SA
DD
ITIO
NA
L IN
FO
RM
AT
ION
V O N B (1) V O N B M A R G I N (2)
OPAT
2017
2152017
62.5%
2018
2472018
63.8%YoY (CER)
8%YoY (CER)
1.4ppsYoY (AER)
15%YoY (AER)
1.3pps
2017
2742018
320YoY (CER)
9%YoY (AER)
17%US$ MILLIONS, UNLESS OTHERWISE STATED
T W P I2017
3402017
1,8482018
3822018
2,083YoY (CER)
5%YoY (CER)
6%YoY (AER)
12%YoY (AER)
13%
A N P
MALAYSIA

| AIA GROUP LIMITED050
FINANCIAL AND OPERATING REVIEWBUSINESS REVIEW • GEOGRAPHICAL MARKETS
FINANCIAL HIGHLIGHTSAIA China delivered another excellent performance with VONB up by 30 per cent to US$965 million. ANP grew
by 19 per cent to US$1,067 million and VONB margin increased by 7.1 pps to 90.5 per cent, reflecting our
commitment to selling regular premium protection and long-term savings products, as well as the benefit
of further scale economies. Growth in the underlying business and sustained favourable claims experience
contributed to a 32 per cent increase in OPAT.
BUSINESS HIGHLIGHTSThe sustained execution of AIA China’s Premier Agency strategy is underpinned by our focus on quality
recruitment and support from innovative digital platforms. We continued to prioritise agency quality through
our stringent selection criteria, robust interview process, best-in-class training and advanced agency leader
development programmes.
Our digital platforms include comprehensive functions for customer acquisition and nurturing, needs-based
advice, selling and servicing. These functions help our agents to provide high-quality advice and deliver a
seamless customer experience. In 2018, we launched Master Planner, a new digital tool that further enhances our
agency leaders’ professionalism and expertise by supporting them with new agent development, performance
evaluations and team activity management.
AIA China’s progress in executing its strategic priorities for the agency channel delivered strong double-digit
growth in the number of active agents, while our focus on quality recruitment enabled us to increase new agent
productivity by 17 per cent.
In 2018, we further differentiated our protection-focused customer propositions. Membership of our wellness
programme in China more than doubled over the year and we began to offer engagement activities tailored to
specific customer segments through the programme’s mobile customer app. In May 2018, we formed a long-term
strategic partnership with WeDoctor, China’s leading technology-enabled healthcare solution platform, which
provides our customers with preferred access to WeDoctor’s services.
We also leveraged emerging technology to launch AIA Xiao You, AIA China’s first AI-enabled service bot, in
the second half of the year. This service bot is deployed on social media platforms and provides instant and
interactive 24/7 enquiry services to both agents and customers across a wide range of topics. In the coming
year, we will continue to expand the service’s capabilities and enhance its linkage with our online customer
portal and agency digital platforms.
In February 2019, we received approval from the China Banking and Insurance Regulatory Commission (CBIRC)
Tianjin Bureau and Hebei Bureau to begin preparations for the establishment of sales and service centres in
Tianjin and Shijiazhuang, Hebei. This approval is received in accordance with the existing regulatory policy
and pilot programme on promoting insurance integration under the Beijing-Tianjin-Hebei Integration Plan. We
will commence operations in Tianjin and Hebei province once we receive final regulatory approval upon the
completion of our preparatory work.
CHINA

ANNUAL REPORT 2018 | 051
OV
ER
VIE
WF
INA
NC
IAL
AN
D O
PE
RA
TIN
G R
EV
IEW
CO
RP
OR
AT
E G
OV
ER
NA
NC
EF
INA
NC
IAL
STA
TE
ME
NT
SA
DD
ITIO
NA
L IN
FO
RM
AT
ION
V O N B (1) V O N B M A R G I N (2)
OPAT
2017
7252017
83.1%
2018
9652018
90.5%YoY (CER)
30%YoY (CER)
7.1ppsYoY (AER)
33%YoY (AER)
7.4pps
2017
6432018
870YoY (CER)
32%YoY (AER)
35%US$ MILLIONS, UNLESS OTHERWISE STATED
T W P I2017
8732017
3,1182018
1,0672018
4,006YoY (CER)
19%YoY (CER)
26%YoY (AER)
22%YoY (AER)
28%
A N P
CHINA

| AIA GROUP LIMITED052
FINANCIAL AND OPERATING REVIEWBUSINESS REVIEW • GEOGRAPHICAL MARKETS
OTHER MARKETS
AIA’s Other Markets include Australia (including New Zealand), Cambodia, Indonesia, Korea, the Philippines,
Sri Lanka, Taiwan, Vietnam and India.
The financial results from our 49 per cent shareholding in Tata AIA Life, our joint venture with the Tata Group
in India, are accounted for using the equity method. For clarity, VONB, ANP and TWPI exclude any contribution
from India.
FINANCIAL HIGHLIGHTSOther Markets delivered 13 per cent VONB growth to US$435 million in 2018. ANP grew by 27 per cent to
US$1,206 million and VONB margin was 35.8 per cent. Full-year VONB growth for the segment was 14 per
cent excluding the effect of large group schemes in Australia that were previously highlighted in our Interim
Report 2018. OPAT increased by 14 per cent to US$826 million, mainly from underlying business growth and
the inclusion of Sovereign’s results in the second half.
BUSINESS HIGHLIGHTSAustralia: AIA Australia and New Zealand delivered strong VONB growth in 2018. The results reflect our leading
position in the Australian life protection market and include the contribution from Sovereign. AIA is now the
leading life insurer in the New Zealand protection market by new business premiums.
AIA Vitality remains a key differentiator for AIA in the Australian market and has helped our retail IFA business
deliver double-digit VONB growth in 2018, despite lower new business volumes for the overall industry. We
more than doubled the number of AIA Vitality members and expanded the programme to a major corporate
client in September 2018. Our group insurance business also delivered strong year-on-year VONB growth as we
renewed several key schemes in 2018 and secured a new large scheme in March 2018.
Cambodia: AIA’s Cambodian business continued to build scale through our multi-channel distribution strategy.
We expanded our agency as we maintained our focus on recruiting and developing professional agents. New
partners in our bancassurance network, including the affluent banking segment of Cambodian Public Bank,
have significantly broadened our customer reach.
Indonesia: Total VONB for our Indonesian business declined as volatility and uncertainty in the local equity
markets impacted demand for unit-linked products in the second half. AIA Indonesia’s focus on quality
recruitment in our agency channel enabled us to deliver an increase in active agent numbers and positive VONB
growth for the channel, which was offset by lower VONB from the bancassurance channel.
Korea: Our Korean business recorded very strong VONB growth, primarily driven by our direct marketing
channel, which was helped by double-digit growth in the number of telesales representatives and an increase in
quality customer leads. VONB margin increased due to a positive shift in product mix. During the second half of
2018, AIA Korea became the first company to receive regulatory approval for an integrated wellness insurance
product. We also launched our strategic partnership with SK Telecom, the nation’s leading telecommunication
provider by number of customers, to offer AIA Vitality to its customers.

ANNUAL REPORT 2018 | 053
OV
ER
VIE
WF
INA
NC
IAL
AN
D O
PE
RA
TIN
G R
EV
IEW
CO
RP
OR
AT
E G
OV
ER
NA
NC
EF
INA
NC
IAL
STA
TE
ME
NT
SA
DD
ITIO
NA
L IN
FO
RM
AT
ION
Philippines: Our business in the Philippines delivered strong VONB growth in 2018. In the agency channel,
our focus on quality recruitment led to a double-digit increase in the number of active agents. We increased
the number of active in-branch insurance specialists by more than 30 per cent in our joint venture with BPI,
which helped to deliver excellent VONB growth. Following the launch of new protection products and customer
engagement campaigns, VONB from Vitality integrated products more than trebled in 2018.
Sri Lanka: AIA Sri Lanka’s VONB decreased in 2018 as political and economic uncertainty weighed on
consumer sentiment. VONB margin was impacted by a change in tax regulations that took effect in April 2018
as previously highlighted. Despite these challenges, ANP growth in 2018 was positive as we continued to
strengthen engagement with our key bancassurance partners and launched new protection and retirement
savings solutions.
Taiwan: AIA Taiwan delivered excellent VONB growth in 2018. Strong sales growth in both the IFA and
bancassurance channels was supported by our insurance solutions designed to meet customer needs in
legacy planning and retirement, effective sales promotion and comprehensive sales support for our distribution
partners.
Vietnam: Our business in Vietnam reported double-digit VONB growth. Agency remained the largest contributor
to VONB as we continued to focus on executing our strategic initiatives to enhance our agents’ activity and
productivity. Contribution from our partnerships increased significantly, as our exclusive partnership with
Vietnam Prosperity Joint Stock Commercial Bank and other domestic bank partnerships achieved excellent
VONB growth in 2018.
Notes:Throughout the Distribution section:VONB and VONB margin by distribution channel are based on local statutory reserving and capital requirements and exclude pension business.
Throughout the Geographical Markets section:(1) VONB figures shown in the tables are based on local statutory reserving and capital requirements and include pension business.
(2) VONB margin excludes pension business to be consistent with the definition of ANP used within the calculation.
V O N B (1) V O N B M A R G I N (2)
OPAT
2017
3952017
39.9%
2018
4352018
35.8%YoY (CER)
13%YoY (CER)
(4.1)ppsYoY (AER)
10%YoY (AER)
(4.1)pps
A N P T W P I2017
9732017
5,8982018
1,2062018
6,377YoY (CER)
27%YoY (CER)
10%YoY (AER)
24%YoY (AER)
8%
2017
7422018
826YoY (CER)
14%YoY (AER)
11%US$ MILLIONS, UNLESS OTHERWISE STATED
OTHER MARKETS

| AIA GROUP LIMITED054
FINANCIAL AND OPERATING REVIEW
OVERVIEW
The Group recognises the importance of sound risk management in every aspect of our business and for all
stakeholders. For our policyholders it provides the security of knowing that we will always be there for them. For
investors it is key to protecting and enhancing the long-term value of their investment. Finally, for regulators,
sound risk management supports industry growth and enhances the public’s trust in the industry.
While effective risk management is vital to any organisation, it goes to the core of a life insurance business where
it is a fundamental driver of value. The Group’s Risk Management Framework (RMF) does not seek to eliminate all
risks but rather to identify, understand and manage them within acceptable limits in order to support the creation
of long-term value.
The Group’s RMF is built around developing an appropriate and mindful risk culture at every level of the organisation
in support of our strategic objectives. The RMF provides business units with appropriate tools, processes and
capabilities for the identification, assessment and, where required, upward referral of identified material risks for
further evaluation.
The Group’s RMF consists of the following key components:
• Risk Culture;
• Risk Management Process;
• Risk Governance;
• Risk Appetite; and
• Risk Landscape.
RISK MANAGEMENT
Risk
Governance
Risk
Appetite
Risk
Culture
Risk
Landscape
Risk
Management
Process
STRATEGICOBJECTIVES

ANNUAL REPORT 2018 | 055
OV
ER
VIE
WF
INA
NC
IAL
AN
D O
PE
RA
TIN
G R
EV
IEW
CO
RP
OR
AT
E G
OV
ER
NA
NC
EF
INA
NC
IAL
STA
TE
ME
NT
SA
DD
ITIO
NA
L IN
FO
RM
AT
ION
RISK CULTURE
The RMF recognises the importance of risk culture in the effective management of risks. Risk culture defines the
Group’s attitude to risks and ensures its remuneration structure promotes the right behaviour.
ACCOUNTABILITYA key component of the Group’s risk culture is accountability. The First Line of Defence (First Line) generally
consists of business unit management and is responsible for managing risks associated with their businesses. The
Risk Management and Compliance Function makes up our Second Line of Defence (Second Line) and is headed
by the Group Chief Risk Officer (CRO) who has overall accountability for the Risk & Compliance function across
the Group. Within each business unit, the business unit CRO is a senior position with a primary reporting line into
the Group CRO and a secondary reporting line to the local Chief Executive Officer (CEO). This structure ensures
independence of the Second Line while ensuring that business unit CROs have full access to local business
discussions so as to provide risk management perspectives and insights. The Group CRO is a member of the
Group Executive Committee while business unit CROs are, in most cases, also members of their respective local
Executive Committees.
The Risk & Compliance organisational structure is shown below:
REMUNERATIONThe Company’s executive remuneration structure ensures appropriate consideration of the RMF within a strong
performance-oriented culture. This is supported by a performance management system where all staff are
measured on ‘how’ as well as ‘what’ they deliver. This structure places significant emphasis on conduct as well as
achievement, and is consistent with our fundamental Operating Philosophy of “Doing the Right Thing, in the Right
Way, with the Right People... Right Results will come”.
Group Chief Executiveand President
Group CRO
Business Unit CROsGroup Risk & Compliance

| AIA GROUP LIMITED056
FINANCIAL AND OPERATING REVIEWRISK MANAGEMENT
RISK MANAGEMENT PROCESS
The Group has a robust Risk Management Process that provides sufficient information, capability and tools to
manage its key risks. To that end, the Group has developed the following key processes to identify, quantify,
manage and monitor the risk exposures.
IDENTIFICATIONTimely and complete identification of risks is an essential first step to the risk management process. The Risk &
Compliance function has developed a systematic process to identify existing and emerging risks in the business
units.
QUANTIFICATIONQuantification of risk is important in establishing the level of exposure and in determining the appropriate
management actions within the Group’s Risk Appetite. Specific risk metrics adopted to support the quantification
process are detailed in the Risk Landscape section of this report.
ESCALATION AND MITIGATIONFollowing the risk quantification process, the executives working in the First Line are responsible for the timely
identification and escalation of material risk developments and for the implementation of risk mitigation actions,
as appropriate.
REPORTING AND MONITORING[In addition to providing advice, guidance, support and challenge to the First Line,] the Second Line is responsible
for monitoring First Line activities and reporting to the appropriate Risk Committees the performance of the
First Line against risk metrics and limits defined in the Risk Appetite. In addition, to ensure the effectiveness of
the Risk Management Process, an Own Risk and Solvency Assessment is reported to the Risk Committees for
annual review.

ANNUAL REPORT 2018 | 057
OV
ER
VIE
WF
INA
NC
IAL
AN
D O
PE
RA
TIN
G R
EV
IEW
CO
RP
OR
AT
E G
OV
ER
NA
NC
EF
INA
NC
IAL
STA
TE
ME
NT
SA
DD
ITIO
NA
L IN
FO
RM
AT
ION
RISK GOVERNANCE
THREE LINES OF DEFENCEThe Group’s Risk Governance framework is built on the “Three Lines of Defence” model. With regard to risk
management, the objective is to ensure that an appropriate framework is in place, including an independent
system of checks and balances, to provide assurance that risks are identified, assessed, managed and governed
properly. The framework clearly defines roles and responsibilities for the management of risk between the
Executive Management (First Line), Risk & Compliance (Second Line) and Internal Audit (Third Line) functions.
While each line of defence is independent from the others, they work closely to ensure effective oversight.
The First Line is made up of the business decision-takers who are responsible for ensuring that effective and
appropriate processes are in place at all times to effectively identify, assess and manage risk in a manner consistent
with the RMF. In particular, the amount of risk taken at each level of the organisation must be consistent with both
the Risk Appetite of the Group and the relevant business unit.
Initial identification, assessment and management of risk is the responsibility of executives operating in the
First Line. Decisions regarding activities deemed to have significant risks attached or that are outside the limits
delegated to a given level of management are referred to a senior Group executive or, where appropriate, through
the Group Chief Executive and President to the Risk Committee of the Board and, where appropriate, to the full
Board of Directors.
The Second Line consists of the Risk & Compliance function. This function (under a Group CRO who reports directly
to the Group Chief Executive and President) is independent of but works closely with the First Line to ensure that
risks are being managed appropriately within the Group’s Risk Appetite. The Second Line is also responsible for
overseeing First Line activities and ensuring the Group adheres to its own high standards.
The Third Line of Defence (Third Line) is the Group Internal Audit (GIA) function, which reports to the Audit
Committee of the Board. GIA is responsible for providing independent assurance over the effectiveness of risk
management and key internal controls and makes recommendations based on the audit findings.
The Three Lines of Defence converge at the Board, which retains overall responsibility for the Group’s RMF.
Group and Business Units Risk & Compliance
Group and Business Units Functions
First Line of Defence
Executive Management
Second Line of Defence
Risk Oversight
Third Line of Defence
Independent Assurance
AIA Group Limited Board
Group Internal Audit

| AIA GROUP LIMITED058
FINANCIAL AND OPERATING REVIEWRISK MANAGEMENT
AIA Group Limited Board
Risk Committee
Nomination Committee
RemunerationCommittee
Audit Committee
Operational Risk Committee
Financial Risk Committee
RISK COMMITTEE STRUCTUREThe Group’s Risk Committee structure is designed to:
• ensure consistent application of the RMF across the Group;
• provide streamlined processes for the timely identification, assessment and escalation of risk issues;
• provide objective analysis of risk issues enabling informed decision-making; and
• ensure discussion and challenge in relation to risk issues in suitable forums leading to optimal outcomes.
The BoardThe Board retains overall responsibility for oversight of the Group’s risk management activities. In this regard the
Board sets the Group’s Risk Appetite, approves the RMF (including amendments or refinements from time to time)
and monitors material Group-wide risks. In fulfilling these responsibilities, the Board is supported and advised by
the Risk Committee.
Risk CommitteeThe Risk Committee oversees risk management across the Group and advises the Board on all risk-related
issues requiring Board attention. The members of the Risk Committee are all Board directors, with the majority
of members including the Committee Chairman being Independent Non-executive Directors. The Risk Committee
meets at least four times a year.
Operational Risk (ORC) and Financial Risk (FRC) CommitteesThe Risk Committee is supported by two Executive Risk Committees which, between them, oversee the
management of all risks. The ORC is chaired by the Group Chief Financial Officer and oversees risks associated
with failure in internal processes, personnel and systems or from external events. The FRC is chaired by the Group
Chief Executive and President and oversees risks associated with Financial, Insurance and Investment activities.
The FRC and ORC each meet at least four times a year.
The above committee structures are replicated at the business unit level where applicable.

ANNUAL REPORT 2018 | 059
OV
ER
VIE
WF
INA
NC
IAL
AN
D O
PE
RA
TIN
G R
EV
IEW
CO
RP
OR
AT
E G
OV
ER
NA
NC
EF
INA
NC
IAL
STA
TE
ME
NT
SA
DD
ITIO
NA
L IN
FO
RM
AT
ION
RISK APPETITE
The Group’s Risk Appetite is the foundation of its RMF. It establishes the quantum and nature of risks the Group is
prepared to take to achieve its strategic objectives.
• The Risk Appetite Statement (RAS) is an overarching statement on the enterprise’s attitude to risk;
• Risk Principles and Risk Tolerances are qualitative statements and quantitative metrics that expand and
validate the RAS; and
• Risk Controls and Risk Limits are used to manage specific risks.
The Group has adopted the following RAS:
“The amount of risk taken by AIA in the ordinary course of its business will be sufficient to meet its customers’
reasonable requirements for protection and benefits while ensuring that the level and volatility of shareholder
returns are in line with a broadly-based risk profile appropriate to an Asia-Pacific ex-Japan-focused life insurance
company.”
The RAS is supported by five Risk Principles:
Risk Principles
Regulatory Capital “AIA has no appetite for regulatory non-compliance and as such will ensure that we hold sufficient capital to meet our current statutory minimum solvency in all but the most extreme market conditions.”
Financial Strength “AIA will ensure the Group’s ability to meet all future commitments to our customers, both financial obligations and in terms of the promises we make to them. We will maintain sufficient capital to support a Financial Strength Rating that meets our business needs.”
Liquidity “AIA will maintain sufficient liquidity to meet our expected financial commitments as they fall due.”
Earnings Volatility “AIA will seek to deliver reported operating earnings consistent with expectations and will implement policies, limits and controls to contain operational risks, risk concentrations and insurance risks within reasonable tolerances.”
Business Practice “AIA will uphold high ethical standards and will implement sound internal controls to minimise the downside risk from the impact of any operational failures within reasonable tolerances.”
Risk Principles and Risk Tolerances
Risk Controls and Risk Limits
Risk Appetite Statement

| AIA GROUP LIMITED060
FINANCIAL AND OPERATING REVIEWRISK MANAGEMENT
RISK LANDSCAPE
The Group maintains a detailed risk taxonomy to ensure all risks are identified and systematically managed. The
principal risks and their definitions are summarised below:
Risks Definition
Investment Investment risk is the risk arising from the Group’s investment portfolio due to (i) counterparties defaulting on obligations - “Credit Risk”; (ii) market movements – “Market Risk”; or (iii) reduced liquidity in markets.
Insurance Insurance risk is the risk arising from changes in claims experience as well as more general exposure relating to the acquisition and persistency of insurance business. This also includes changes to actuarial assumptions regarding future experience for these risks.
Asset-Liability Mismatch (ALM)
ALM risk is the risk arising from the difference in duration between the Group’s assets and liabilities. This mismatch is mainly caused by differences in timing and size of the respective asset and liability cash flows.
Operational Operational risk is the risk arising from internal processes, personnel and systems or from external events which may result in direct or indirect business impact.
Strategic Strategic risk is the risk arising from the potential impact of the business strategy on the Group’s earnings, capital and reputation. This also takes into consideration the wider social, economic, political, regulatory, competitive or technological trends that could impact the business strategy within a set time period.
Financial Risks
Strategic Risks
Operational Risks
Distribution
ProductManagement
Third Party
Investment
Credit
Equity Price
Property Price
Credit Spread
InvestmentLiquidity
BusinessInterruption
Interest Rate
ForeignExchange Rate
FinancialLiquidity
ALM
InformationTechnology
Finance &Actuarial
Operations
Insurance
Lapse
Expense
Morbidity
Mortality Key Projects
InformationSecurity
Fraud & FinancialCrime
InvestmentOperations
Legal & Regulatory
People

ANNUAL REPORT 2018 | 061
OV
ER
VIE
WF
INA
NC
IAL
AN
D O
PE
RA
TIN
G R
EV
IEW
CO
RP
OR
AT
E G
OV
ER
NA
NC
EF
INA
NC
IAL
STA
TE
ME
NT
SA
DD
ITIO
NA
L IN
FO
RM
AT
ION
FINANCIAL RISKS – INVESTMENTCreditThe risk arising from the uncertainty of third parties meeting their obligations to the Group when they fall due.
Although the primary source of credit risk is the Group’s investment portfolio, such risk can also arise through
reinsurance and treasury activities. The Group performs a detailed analysis of each counterparty and recommends
a rating, which will be updated from time to time. This rating then forms the basis for the quantum of exposure that
the Group is willing to take with such counterparties. The Group’s Risk Management function manages the Group’s
internal ratings framework and reviews these recommendations and, where appropriate, makes recommendations
for revisions from time to time.
Equity PriceThe risk arising from changes in the market value of equity securities.
Equity price risk is managed through the individual investment mandates which define benchmarks and any
tracking error targets. Equity limits are also applied to contain individual exposures. Equity exposures are included
in the aggregate credit exposure reports on individual counterparties to monitor total concentration levels.
Property PriceThe risk arising from the volatility of real estate market value due to general or specific factors.
Property price risk can be driven by broader economic and social factors, notably tenant supply and demand,
liquidity of individual assets, evolving infrastructure or government actions that may directly or indirectly influence
the market. It can also be driven by the characteristics of specific holdings: their location within an area, the
competitiveness of their facilities and their physical condition.
Any material property investment is individually reviewed by the Group to ensure it does not give rise to an
unacceptable concentration of exposure and that it does not compromise the financial flexibility of the relevant
business unit.
Credit SpreadThe risk arising from changes in the market value of securities as a result of a change in perception as to their
likelihood of repayment.
The Group invests in non-government securities in a number of its portfolios for yield purposes, and the primary
intention is to hold these to maturity. The Group manages its credit spread risk carefully, focusing on overall
portfolio quality and diversification and seeking to avoid excessive volatility in the mark-to-market value of its
investment portfolios.
Investment LiquidityThe risk arising from the Group’s ability to buy and sell investments subject to market availability and pricing.
Investment liquidity risk is managed in the first instance through the size of the Group’s individual holdings
relative to market volume, complemented by the quality of the investments which are primarily in government and
high-quality corporate bonds with good liquidity profile. The Group also maintains a minimum liquidity threshold
on its investments in listed equities.

| AIA GROUP LIMITED062
FINANCIAL AND OPERATING REVIEWRISK MANAGEMENT
FINANCIAL RISKS – INSURANCELapseLapse risk is the risk that the rate of policy termination deviates from the Group’s expectation.
Ensuring that customers only buy products that match their needs is central to the Group’s Operating Philosophy.
Through effective implementation of the Business Quality Framework, comprehensive sales training programmes
and active monitoring of sales activities and persistency, the Group seeks to ensure that appropriate products
are sold by qualified sales representatives and that standards of service consistently meet our customers’ needs.
ExpenseExpense risk is the risk that the cost of selling new business and of administering the in-force book exceeds the
assumptions made in pricing and/or reserving.
Daily operations follow a disciplined budgeting and control process that allows for the management of expenses
based on the Group’s very substantial experience within the markets in which we operate.
Morbidity and MortalityMorbidity and mortality risk is the risk that the occurrence and/or amounts of medical/death claims are higher
than the assumptions made in pricing or reserving.
The Group adheres to well-defined market-oriented underwriting and claims guidelines and practices that have
been developed based on extensive historical experience and with the assistance of professional reinsurers.
The Group’s actuarial teams conduct regular experience studies of all the insurance risk factors in its in-force
book. These internal studies together with external data are used to identify emerging trends which can then be
used to inform product design, pricing, underwriting, claims management and reinsurance needs.
Through monitoring the development of both local and global trends in medical technology, health and wellness,
the impact of legislation and general social, political and economic conditions, the Group seeks to anticipate and
respond promptly to potential adverse experience impacts on its products. Environmental risk, including climate
change, forms part of our overall insurance risk profile through its role in the frequency and intensity of certain
diseases and the health and mortality impacts of natural disasters.
Reinsurance is used to reduce concentration and volatility risk, especially with large policies or new risks, and
as protection against catastrophic events such as pandemics or natural disasters. We assess the overall level
of insurance risk by taking into consideration a range of diverse risk factors across the many categories in our
product range. This diversity of risk, combined with our reinsurance programme and broad geographic footprint
helps us to distribute risk and provide protection against the impact of catastrophic events and short-term
environmental impacts.
Recent initiatives to manage morbidity risk and improve claims management include the promotion of wellness
programmes such as AIA Vitality and the establishment of a dedicated Healthcare team to improve customer
healthcare experience.

ANNUAL REPORT 2018 | 063
OV
ER
VIE
WF
INA
NC
IAL
AN
D O
PE
RA
TIN
G R
EV
IEW
CO
RP
OR
AT
E G
OV
ER
NA
NC
EF
INA
NC
IAL
STA
TE
ME
NT
SA
DD
ITIO
NA
L IN
FO
RM
AT
ION
FINANCIAL RISKS – ALMInterest RateThe risk arising from the impact of interest rate movements on the value of future asset and liability cash flows.
Exposure to interest rate risk predominantly arises from any difference between the duration of the Group’s assets
and liabilities.
The Group manages its interest rate risk primarily on an economic basis to determine the durations of both assets
and liabilities. Interest rate risk on the local solvency basis is also taken into consideration for business units where
local solvency regimes deviate from the economic basis. Furthermore, for products with discretionary benefits,
additional modelling of interest rate risk is performed to guide determination of appropriate management actions.
Management also takes into consideration the asymmetrical impact of interest rate movements when evaluating
products with options and guarantees.
Exposure to interest rate risk is summarised in note 36 to the financial statements, which shows the split of
financial assets and liabilities between variable, fixed and non-interest bearing investments.
Foreign Exchange RateThe risk arising from foreign exchange rate movements on the value of future asset and liability cash flows, and
the translation of business units’ balance sheets to the Group’s reporting currency.
Assets, liabilities and all regulatory and stress capital in each business unit are currency matched within set
limits with the exception of holdings of equities denominated in currencies other than the local currency. Any
expected capital movements due within one year are required to be hedged. The balance sheet values of the
Group’s business units are not hedged to the Group’s reporting currency of US dollar.
Financial LiquidityThe risk arising from the availability of cash resources to meet payment obligations to counterparties as they
fall due.
As disclosed in note 19 to the financial statements, most of the Group’s investments are in the form of marketable
securities and can be readily converted into cash should the need arise.
Another financial liquidity risk arises from the availability of collateral in derivative and repo trades. This risk is
managed by determining appropriate limits and assessing the ability of the business units to withstand extreme
market events. The Group also supports its liquidity needs through committed bank facilities and maintaining
access to debt markets via the Group’s Global Medium-term Note and Securities programme.
Note 36 to the financial statements provides a maturity analysis of the Group’s financial assets and its financial
liabilities and insurance contract liabilities.

| AIA GROUP LIMITED064
FINANCIAL AND OPERATING REVIEWRISK MANAGEMENT
OPERATIONAL RISKSThe risk arising from internal processes, personnel and systems or from external events which may result in direct
or indirect business impact.
Operational risk is categorised into a common taxonomy which is adopted across the Group. The Group’s operational
risks arise in the following key areas:
• Distribution Risk – This involves intermediary misconduct such as churning, mis-selling/product suitability,
fraud and other market conduct-related issues;
• Regulatory Compliance Risk – This concerns compliance with the relevant laws and regulations;
• Financial and Operational Process Risk – This involves the controls in key processes in business functions
such as product management, investment, finance, actuarial, underwriting, claims, and policy administration;
and
• Systems and Information Security Risk – This includes system performance, disaster recovery, and cyber and
information security standards.
Each operational risk is assessed against four defined impacts that such risk could have on the business, namely
Financial Loss, Regulatory Breach, Reputation Damage and Business Disruption. This assessment allows the
Group to monitor its exposure against the newly defined Business Practice Risk Principle and Risk Tolerance
stated earlier in the Risk Appetite section.
The Group uses various techniques to manage operational risks, including:
• Appointment of First Line Risk Owners and Risk Champions;
• Risk and Control Assessments (RCAs) for each key operational risk;
• Key Risk Indicators (KRIs) monitoring;
• Internal Incidents reporting; and
• Operational risk checklists for material projects and key processes such as product management.
The Group also protects itself against financial losses by purchasing insurance cover against a range of operational
loss events including business disruption, property damage and internal fraud. The coverage is determined after
taking into consideration the Group’s operational risk profile.
STRATEGIC RISKSStrategic risk is identified as part of the business plan process and is defined as the potential impact of the
business strategy on the Group’s earnings, capital and reputation. This also takes into consideration the wider
social, economic, political, regulatory, competitive or technological trends that could impact the business strategy
within a set time period.

ANNUAL REPORT 2018 | 065
OV
ER
VIE
WF
INA
NC
IAL
AN
D O
PE
RA
TIN
G R
EV
IEW
CO
RP
OR
AT
E G
OV
ER
NA
NC
EF
INA
NC
IAL
STA
TE
ME
NT
SA
DD
ITIO
NA
L IN
FO
RM
AT
ION
REGULATORY AND INTERNATIONAL DEVELOPMENTS
Internationally, the regulatory environment facing life insurers has continued to evolve. In particular, the
International Association of Insurance Supervisors (IAIS) continues a multi-year review of certain Insurance
Core Principles with the longer-term aim of developing and implementing an updated common framework for
the international regulation of insurance companies.
Regulators across AIA’s span of operations are in the midst of a variety of initiatives intended to align their
respective regulatory frameworks with the broad principles recommended by the IAIS including in relation
to application to risk-based capital frameworks. AIA continues to be involved in these initiatives across the
region, and is an active participant in the international industry dialogue on a host of relevant issues, including
formulation by the IAIS of an Insurance Capital Standard (ICS). Field testing for the ICS is expected to be
completed in 2019 with implementation of the ICS to be conducted in two phases. Under the first phase, ICS
will be used for confidential reporting to group-wide supervisors in a monitoring period lasting five years. The
second phase will be implementation of the ICS as a group-wide prescribed capital requirement.
In 2016, Bermuda’s prudential framework for insurance was deemed to be equivalent to the regulatory
standards applied to European insurers in accordance with the requirements of the Solvency II Directive. Under
the enhanced commercial prudential return regime, the Bermuda Monetary Authority has instituted a number
of changes to its statutory and prudential reporting requirements, including the need for commercial insurers
to prepare an economic balance sheet. These new regulatory requirements were first applied to AIA’s financial
year ended 30 November 2017 and AIA continues to participate in the development and refinement of these
initiatives.
Following the establishment of the HKIA on 26 June 2017 as the regulator of Hong Kong insurance companies, it
is anticipated that the HKIA will also begin directly regulating intermediaries in 2019. A multi-year consultation
process is also underway to develop a risk-based capital regime for Hong Kong insurers. AIA continues to be
closely and constructively engaged in these developments.
On 16 May 2017, the HKIA and the China Banking and Insurance Regulatory Commission (formerly the China
Insurance Regulatory Commission) signed the Equivalence Assessment Framework Agreement on the Solvency
Regulatory Regime. As a transitional arrangement, AIA will report under the HKIO the capital position of its
China branches based on the China local regulatory solvency basis progressively over a 4-year phase-in period
to full implementation on 31 March 2022.
On 18 May 2017, the International Accounting Standards Board (IASB) published International Financial
Reporting Standard (IFRS) 17, Insurance Contracts (previously IFRS 4 Phase II) which will replace the current
IFRS 4, Insurance Contracts. IFRS 17 includes some fundamental differences to current accounting in both
insurance contract measurement and profit recognition. On 12 December 2017, the Hong Kong Institute of
Certified Public Accountants (HKICPA) approved the issuance of Hong Kong Financial Reporting Standard
(HKFRS) 17, Insurance Contracts. The Group is conducting a detailed assessment of the new standards and
preparing for their implementation. At its meeting in November 2018, the IASB voted to defer the effective
date of IFRS 17 for one year, meaning the standards will become mandatorily effective for financial periods
beginning on or after 1 January 2022.

| AIA GROUP LIMITED066
FINANCIAL AND OPERATING REVIEW
We are proud of our people and the culture at the heart of our Company.
At AIA, equipping our employees for success is vital to serving our customers and enabling our communities to
live Healthier, Longer, Better Lives.
Our vision to be the world’s pre-eminent life insurance provider is supported by over 22,000 employees and many
thousands of agents. Guided by our Operating Philosophy of “Doing the Right Thing, in the Right Way, with the
Right People… the Right Results will come”, we focus on recruiting, developing and retaining capable, engaged
and high-performing employees who can continuously learn and grow while delivering their best work. These
are people who thrive in our customer-centric culture, embrace AIA’s brand promise and exhibit our leadership
characteristics.
DEVELOPING OUR LEADERS
Our AIA Leadership Centre (ALC) based in Bangkok is a world-class learning facility offering various programmes
to our senior executives, top agency leaders and key partner executives. With a clear focus on AIA’s strategic
and governance priorities, the ALC continues to deliver impactful leadership development programmes, including
those focusing on:
• Executive Leadership – Targeting AIA’s current and future executives, our programmes are designed to
accelerate executive leadership as well as management capabilities. Our Enterprise Leadership Programme
continues to be our signature programme offering to all markets.
• Technical Leadership – Designed to develop technical and professional capabilities within our core functions
to promote operational excellence.
• Distribution Leadership – Designed for AIA’s senior distribution leaders, senior agents and partners, these
programmes develop the sales leadership and technical skills required to produce consistent best in class
results.
The ALC has now entered its third year of operation. In 2018 it hosted more than 240 events and delivered more
than 20 customised leadership programmes, partnering with world renowned business schools and consulting
firms.
At AIA, we make it a top priority to develop our people and their leadership and functional capabilities. We
believe in growing our leaders from within and in 2018, we closed a large proportion of our senior management
positions through internal progression. Committed to having a strong pipeline of senior leaders, we conduct a
comprehensive Group-wide people review process annually to identify and plan for the succession of key roles.
In 2018, we reviewed approximately 1,400 senior positions across the Group, ensuring we consider succession
planning from a holistic perspective.
VALUING OUR PEOPLE

ANNUAL REPORT 2018 | 067
OV
ER
VIE
WF
INA
NC
IAL
AN
D O
PE
RA
TIN
G R
EV
IEW
CO
RP
OR
AT
E G
OV
ER
NA
NC
EF
INA
NC
IAL
STA
TE
ME
NT
SA
DD
ITIO
NA
L IN
FO
RM
AT
ION
03
01
0201 To support our employees to live Healthier, Longer, Better Lives, we offer a wide array of wellness programmes throughout the year.
03 We embarked on a strategic initiative across all markets to standardise, optimise, and streamline towards a more customer-centric service for our employees, increasing efficiencies, business reporting and people analytics capabilities.
02 AIA Sri Lanka was recognised as a “Great Place to Work” and “Best Workplace for Women” and received a Bronze award in the Large Sized Enterprise category by The Great Place to Work Institute.

| AIA GROUP LIMITED068
FINANCIAL AND OPERATING REVIEWVALUING OUR PEOPLE
FOSTERING A CULTURE OF PEOPLE DEVELOPMENT
We foster a robust learning culture at AIA that empowers our people to develop critical capabilities for their current
roles and career aspirations. AIA’s enterprise-wide development framework aligns our people development with
our business strategy and talent needs. Core development modules for senior employees such as the People
Manager Accelerator Programme and the AIA Manager Series remain foundational curriculum items offered
throughout the year. These core modules are complemented with a wide variety of skills-based training to target
individual development needs as well.
In 2018 we expanded the digitisation of learning content and delivery methods with the launch of a new learning
platform that centrally houses an extensive range of content. This platform provides employees with flexibility
regarding the subject matter they would like to develop while addressing some key principles of modern learning
– access to content is on-demand, anytime and anywhere.
As we transform our functional operating model, we have also outlined capability roadmaps to provide our leaders
and employees with key knowledge, skills and behaviours required for their success in future roles. We offer
internal mobility opportunities in other teams, functions and markets to broaden our employees’ perspectives and
present new career experiences.
RECOGNISING AND REWARDING OUR PEOPLE
Our total rewards policies and programmes play an important role in supporting the execution of AIA’s strategy
and the delivery of AIA’s performance. Using a combination of market competitive financial and non-financial
rewards, our policies and programmes are designed to attract, engage and retain high-calibre employees and
motivate them to help AIA execute its short and long-term business goals.
Our remuneration programmes are tied to our Performance Development Dialogue, which is designed to enable
line managers to assess the performance and behaviours of their staff, and recommend development activities
to help meet defined career objectives. We strive to recognise and reward our workforce and to drive desired
behaviours that comply with our risk management framework.
An important element of our total rewards framework is our recognition, benefits and wellness programmes that
work together to enhance employee well-being both in and outside of work. We appreciate the evolving and varied
needs of our diverse workforce. For example, we have piloted flexible benefits in some of our businesses to provide
more choices to our employees.
To support our employees to live Healthier, Longer, Better Lives, we also offer a wide array of wellness programmes
throughout the year. These programmes include AIA Vitality memberships, wellness themed activity days, team
challenges and health check-ups.
We are proud to offer our employees the opportunity to become AIA shareholders through our Employee Share
Purchase Plan (ESPP). This year the percentage of eligible employees and the number of participating employees
in the plan grew to their highest levels to date. We rolled out the plan in Cambodia for the first time in 2018,
resulting in a total of 17 of our markets providing employees the opportunity to invest in AIA’s future.

ANNUAL REPORT 2018 | 069
OV
ER
VIE
WF
INA
NC
IAL
AN
D O
PE
RA
TIN
G R
EV
IEW
CO
RP
OR
AT
E G
OV
ER
NA
NC
EF
INA
NC
IAL
STA
TE
ME
NT
SA
DD
ITIO
NA
L IN
FO
RM
AT
ION
EMBRACING DIGITAL TRANSFORMATION
In 2018, we embarked on a strategic initiative to deliver greater business insights, operational efficiencies and
line manager empowerment. It includes replacing the current human resources information system and thereby
redefining the human resources service delivery model. Over the next 18 months, we plan to work closely across all
our markets to standardise, optimise and streamline towards a more customer-centric service for our employees,
increasing efficiencies, business reporting and people analytics capabilities.
ENGAGING OUR PEOPLE
Our annual employee engagement survey continues to provide us with valuable insights into our culture, workplace
environment and employee needs. In 2018, approximately 97 per cent of our people responded to the survey and
the employee engagement scores for the Group placed us in the top quartile of Gallup’s global financial services
and insurance industry benchmark.
AIA Group was one of 39 companies globally and the only international life insurer to be conferred a Great
Workplace Award from Gallup in 2018. In addition, several of our markets won prestigious local and regional
awards, including the following:
• In recognition of its commitment to professional education, our Group Office received the “Excellence in
Education Award” by LOMA.
• AIA won Aon’s 2018 “Best Employers” Asia Pacific Regional Award for the second consecutive year.
• AIA China also won Aon’s 2018 “Best Employers” China Award for the fourth consecutive year, along with
winning a “Top Employer China” award by Top Employers Institute.
• AIA Singapore won GTI Media’s “Most Popular Graduate Employer 2017” in the Insurance and Risk Management
Sector, and was recognised as one of “Singapore’s 100 Leading Graduate Employers in 2017”.
• GTI Media recognised AIA Malaysia Shared Services within the “Most Popular Graduate Employer of the Year
2018” for the BPO & Shared Services Sector.
• Both AIA Sri Lanka and AIA Vietnam were recognised as a “Great Place to Work” by The Great Place to Work
Institute.
• Additionally, AIA Sri Lanka was recognised as a “Best Workplace for Women” and received a Bronze award in
the Large Sized Enterprise category by The Great Place to Work Institute.
• AIA Taiwan was one of the winners of “Taiwan’s Best Companies to Work for in Asia 2018” by HR Asia.
• Tata AIA won Aon’s “Best Employers” India Award for the third time since 2016.
• AIA Group became the first insurance company in the world to be accredited under the Institute and Faculty of
Actuaries Quality Assurance Scheme.

| AIA GROUP LIMITED070
FINANCIAL AND OPERATING REVIEW
AIA is committed to helping people in our communities live Healthier, Longer, Better Lives. We believe that we
can achieve this both through the operation of our business and through a host of programmes delivered in the
communities in which we operate.
ENCOURAGING PHYSICAL EXERCISE
In Malaysia, AIA launched the “Active Park AIA Vitality” in Kepong Metropolitan Park in north Kuala Lumpur.
AIA collaborated with Fitness First to provide exercise machines at “Active Park AIA Vitality”, designed to
encourage more people to get outdoors and stay active.
AIA continued to support a number of landmark running events across the region. In April 2018, “The Music
RunTM by AIA 2018” returned to Singapore for the fourth year, with 10,000 attendees running, dancing and
partying to the beat at Palawan Green in Sentosa. In Thailand, over 50,000 people joined AIA’s flagship
“AIA Sharing a Life Charity Run” in September 2018. The run took place across 10 provinces in Thailand,
encouraging people from rural Thailand to stay active and lead a healthy lifestyle. AIA also donated outdoor
workout facilities to all 10 participating provinces in the name of “AIA Vitality Workout”.
For the fourth consecutive year, AIA was the principal sponsor of “Oxfam Trailwalker” in Hong Kong. This event,
which has become a tradition in Hong Kong, saw 13,000 people participate this year. In addition to acting as
a sponsor, AIA fielded the largest number of corporate teams – 47 in total, comprising 188 employees and
financial planners. AIA raised HK$1.9 million to become the Overall Fund Raising Champion. The funds are
intended to support Oxfam’s efforts to alleviate poverty both in Hong Kong and internationally.
AIA was also the principal sponsor of the “Oxfam Tower-Run” in Macau in October 2018. Approximately 250 AIA
employees and financial planners joined over a hundred members of the public in this race.
In September 2018, AIA hosted the 10km “2018 Easy Run by AIA” in Shanghai, China, which attracted more
than 5,000 runners from over 20 countries.
Back by popular demand, “FitnessFest by AIA 2018” returned to Singapore in May 2018 for its second edition.
Nearly 6,000 fitness enthusiasts participated in the 12-hour “Fitathon”, which offered sports ranging from yoga
to boxing.
PROMOTING FOOTBALL IN ASIA
In 2018, AIA’s commitment to community football training and health education continued as part of AIA’s
partnership with Spurs. Throughout the year, two dedicated Spurs coaches stationed with AIA in Hong Kong
have conducted training camps and coaching clinics in 10 AIA markets across the Asia-Pacific region. These
programmes are designed to encourage youth participation and also provide much needed education around
the benefits of a healthy diet and regular exercise. In 2018, more than 25,000 children, parents and employees
took part in these programmes.
As part of our partnership with the China Youth Development Foundation, AIA conducted the AIA China Youth
Football Development Programme for the fifth year. In 2018, AIA supported 45 undergraduates who are sports
education majors to receive professional football training from Spurs coaches. The student volunteers then
CORPORATE SOCIAL RESPONSIBILITY

ANNUAL REPORT 2018 | 071
OV
ER
VIE
WF
INA
NC
IAL
AN
D O
PE
RA
TIN
G R
EV
IEW
CO
RP
OR
AT
E G
OV
ER
NA
NC
EF
INA
NC
IAL
STA
TE
ME
NT
SA
DD
ITIO
NA
L IN
FO
RM
AT
ION
03
conducted a 2-month football training programme for elementary schools in Shanxi, Yunnan, Hainan and
Guangdong. With the goal of supporting football education and promoting healthy living, AIA also organised
football training camps in Guangdong and Jiangsu, with over 1,200 children participating in the training sessions.
In September 2018, AIA hosted its first “AIA Family Fest in Sentosa” creating a holistic wellness experience
for children in Singapore. More than 3,000 families enjoyed a wide range of family and wellness activities,
including kickabout sessions with Spurs football coaches as well as games and activities for participants of all
ages to encourage full family participation. AIA Singapore also invited 39 children and their families from its
charity partner Children’s Wishing Well to attend the event as part of its commitment to supporting children
from all backgrounds.
01 In 2018, more than 25,000 children, parents and employees took part in training programmes conducted by the AIA Spurs coaches.
02 Nearly 6,000 fitness enthusiasts participated in the 12-hour “Fitathon” at “FitnessFest by AIA 2018” in Singapore.
03 David Beckham visited the Great Wall of China and took part in an event supporting AIA’s work with our CSR partner China Youth Development Foundation.
01
02

| AIA GROUP LIMITED072
FINANCIAL AND OPERATING REVIEW
In New Zealand, AIA engaged 55,000 school children and their families from over 500 schools through the
Healthiest Schools Challenge. The objective was to inspire children and families to make healthy choices and
to lead Healthier, Longer, Better lives. Participants logged their activity levels to move avatars of themselves
through a virtual tour of the world, receiving various health and wellness messages along the way. The initiative
was supported by the AIA Spurs coaches, who ran football skill sessions with more than 4,000 participants
during a nationwide tour in October and November.
AIA’s Global Ambassador, David Beckham participated in the first “AIA Soccer for the Nation” event in Jakarta
in March. David supported AIA in providing football equipment and launching a development initiative that
included 1,600 children. David also visited the Great Wall of China and took part in an event supporting AIA’s
work with our CSR partner China Youth Development Foundation. The event included a variety of media events
promoting the CSR initiatives of China Youth Development Foundation and AIA and a football training session
with 36 children.
SUPPORTING EDUCATION
In Thailand, AIA has been contributing to school libraries since 2005 to promote education, literacy and a love
of reading. In December 2018, AIA Thailand was proud to sponsor another AIA School Library for a school in
Ranong, the 36th such library since the inception of the programme.
In Vietnam, more than 200,000 children drop out of school each year, primarily because of the long distance
they need to travel to and from school each day. Since 2014, AIA has raised funds to provide bicycles for
children through the Li’v Journey Programme to encourage them to continue their education. In 2018, the
Programme saw AIA donate nearly 3,000 bicycles to individual children in 36 locations nationwide.
In the Philippines, the Philam Foundation, the CSR arm of Philam Life, has launched a financial literacy
programme for students, parents and teachers to promote the value of saving and being prudent. In recognition
of this programme, launched in July 2017, and its broader work across the Philippines, the Philam Foundation
was honoured at the Asia Responsible Entrepreneurship Awards.
HEALTHY COMMUNITIES
To coincide with the launch of our brand promise to help people live Healthier, Longer, Better Lives, we held
a week-long, large-scale, free-to-all health and wellness event at Hong Kong’s AIA Vitality Park in September
2018. Sixty activities were held for the community during the week, featuring yoga, a number of football games,
healthy cooking demonstrations, music performances, kids sports and health talks attracting nearly 40,000
participants in total.
In Korea, AIA partnered with “Weconnect”, a social enterprise that employs working mothers and women on
career breaks, to support potential start-ups in the area of healthcare and insure-tech. A total of 92 participants
benefited from the programme from May to December 2018.
In collaboration with the Philippine College of Surgeons and Philippine College of Physicians, the Philam
Foundation took the lead to form the Alliance for Philippines’ Health and Advocacy (ALPHA) in December 2017.
Among other ALPHA initiatives, in partnership with Cancer Registry Philippines, the Alliance established a
hospital-based cancer registry programme, with the goal of gathering data on cancer in the Philippines to help
improve care and long-term outcomes. In 2018, a total of 20 hospitals signed up for the programme and doctors
from participating hospitals were trained to use the registry application.
CORPORATE SOCIAL RESPONSIBILITY

ANNUAL REPORT 2018 | 073
OV
ER
VIE
WF
INA
NC
IAL
AN
D O
PE
RA
TIN
G R
EV
IEW
CO
RP
OR
AT
E G
OV
ER
NA
NC
EF
INA
NC
IAL
STA
TE
ME
NT
SA
DD
ITIO
NA
L IN
FO
RM
AT
ION
In Thailand, AIA has worked with the Office of the Insurance Commission to campaign for road safety for
4 years. In 2018, AIA gave 2,500 helmets to students and other members of the community nationwide to help
reduce the number of injuries and fatalities.
In support of World Blood Donor Day, AIA Hong Kong worked with Red Cross Hong Kong in a marathon blood
drive over six days in May and June 2018. A total of 318 donations were provided by employees and financial
planners. In September, more than 200 agents and employees from AIA Vietnam participated in AIA Blood
Donation Day.
In June 2018, the Hong Kong Observation Wheel, presented by AIA, celebrated its one millionth visitor. AIA
supports this initiative by subsidising the entry fee and ridership has increased dramatically as a result. Since
its re-opening in December 2017, the Wheel and the adjacent AIA Vitality Park has drawn two million local and
international visitors and has become an iconic landmark and family attraction in Hong Kong that is genuinely
available to everyone in Hong Kong.
For the fifth year, the “AIA Carnival” held from December 2018 to February 2019, sponsored by AIA in Hong
Kong, has been a popular outdoor event during the festive season. The event enabled us to deliver our healthy
living message to close to one million attendees. Through partnerships with 11 local charities, we also helped
ensure that a wide spectrum of community groups are able to access and enjoy this event.
01 In 2018, AIA in Vietnam donated nearly 3,000 bicycles to individual children in 36 locations nationwide through the Li’v Journey Programme.
02 Over 50,000 people joined AIA’s flagship “AIA Sharing a Life Charity Run” in September 2018 which took place across 10 provinces in Thailand.
03 In addition to acting as the principal sponsor, AIA fielded the largest number of corporate teams in the “Oxfam Trailwalker” in Hong Kong in 2018 and raised HK$1.9 million to become the Overall Fund Raising Champion.
03
01
02

| AIA GROUP LIMITED074
075 Statement of Directors’ Responsibilities
076 Board of Directors
084 Executive Committee
089 Report of the Directors
099 Corporate Governance Report
112 Remuneration Report
CORPORATE GOVERNANCE

ANNUAL REPORT 2018 | 075
OV
ER
VIE
WF
INA
NC
IAL
AN
D O
PE
RA
TIN
G R
EV
IEW
CO
RP
OR
AT
E G
OV
ER
NA
NC
EF
INA
NC
IAL
STA
TE
ME
NT
SA
DD
ITIO
NA
L IN
FO
RM
AT
ION
STATEMENT OF DIRECTORS’ RESPONSIBILITIES
The Directors are responsible for preparing the Company’s consolidated financial statements in accordance with
applicable laws and regulations.
In preparing the consolidated financial statements of the Company, the Directors are required to:
• select suitable accounting policies and apply them consistently;
• make judgments and estimates that are reasonable and prudent;
• state whether the financial statements have been prepared in accordance with HKFRS and IFRS; and
• prepare the financial statements on a going concern basis, unless it is inappropriate to presume that the Group
will continue in business.
The Directors are responsible for keeping proper accounting records that give a true and fair view of the state of
the Company’s affairs and explain its transactions.
The Directors are responsible for taking reasonable steps to safeguard the assets of the Group and to prevent and
detect fraud and other irregularities. The Directors are also responsible for preparing a Report of the Directors and
the Corporate Governance Report on pages 89 to 111 of this Annual Report.
The Directors confirm that to the best of their knowledge:
1. the consolidated financial statements of the Company, prepared in accordance with Hong Kong Financial
Reporting Standards and International Financial Reporting Standards, give a true and fair view of the assets,
liabilities, financial position, cash flows and results of the Company and its undertakings included in the
consolidated financial statements taken as a whole; and
2. the section headed “Financial and Operating Review” included in this Annual Report presents a fair review
of the development and performance of the business and the position of the Company and its undertakings
included in the consolidated financial statements taken as a whole, together with a description of the principal
risks and uncertainties that the Group faces.

| AIA GROUP LIMITED076
CORPORATE GOVERNANCE
BOARD OF DIRECTORS
Mr. Mohamed Azman Yahya
Mr. John Barrie Harrison
Dr. Narongchai Akrasanee
Mr. Jack Chak-Kwong So
Mr. Edmund Sze-Wing Tse
Mr. Ng Keng Hooi

ANNUAL REPORT 2018 | 077
OV
ER
VIE
WF
INA
NC
IAL
AN
D O
PE
RA
TIN
G R
EV
IEW
CO
RP
OR
AT
E G
OV
ER
NA
NC
EF
INA
NC
IAL
STA
TE
ME
NT
SA
DD
ITIO
NA
L IN
FO
RM
AT
IONMr. George
Yong-Boon YeoMr. Chung-Kong Chow
Ms. Swee-Lian Teo
Professor Lawrence Juen-Yee Lau
Mr. Cesar Velasquez Purisima

| AIA GROUP LIMITED078
CORPORATE GOVERNANCEBOARD OF DIRECTORS
INDEPENDENT NON-EXECUTIVE CHAIRMAN AND INDEPENDENT NON-EXECUTIVE DIRECTOR
Mr. Edmund Sze-Wing TseAged 81, is the Independent Non-executive Chairman and an Independent Non-executive Director of the
Company. He was appointed Non-executive Director of the Company on 27 September 2010 and elected
Non-executive Chairman on 1 January 2011. He was re-designated as the Independent Non-executive Chairman
and an Independent Non-executive Director of the Company on 23 March 2017. Mr. Tse is also the Chairman of the
Nomination Committee and a member of the Remuneration Committee and the Risk Committee of the Company.
He is a director of AIA Foundation. Mr. Tse’s appointments during almost 58 years with the Group and its predecessor,
AIG Group, include serving as Honorary Chairman of AIA Co. from July 2009 to December 2010, Chairman and
Chief Executive Officer from 2000 to June 2009 and President and Chief Executive Officer from 1983 to 2000.
He also served as Chairman of The Philippine American Life and General Insurance (PHILAM LIFE) Company from
2005 to 2015. Mr. Tse is a non-executive director of PCCW Limited (listed on the Hong Kong Stock Exchange) and
a director of Bridge Holdings Company Limited. He served as a non-executive director of PineBridge Investments
Limited from 2012 to 2014 and a non-executive director of PICC Property and Casualty Company Limited (listed
on the Hong Kong Stock Exchange) from 2004 to July 2014. In recognition of his outstanding contributions to
the development of Hong Kong’s insurance industry, Mr. Tse was awarded the Gold Bauhinia Star by the HKSAR
Government in 2001. Mr. Tse received an honorary fellowship and an honorary degree of Doctor of Social Sciences
from The University of Hong Kong in 1998 and 2002, respectively. He also received an honorary degree of Doctor
of Business Administration from Lingnan University in 2018. In 2003, he was elected to the prestigious Insurance
Hall of Fame and in 2017, Mr. Tse was awarded the first ever Lifetime Achievement Award at the Pacific Insurance
Conference in recognition of his outstanding contribution to the insurance industry.
EXECUTIVE DIRECTOR AND GROUP CHIEF EXECUTIVE AND PRESIDENT
Mr. Ng Keng HooiAged 64, is an Executive Director and the Group Chief Executive and President of the Company, having been
appointed on 1 June 2017. Mr. Ng is also a member of the Risk Committee of the Company. He joined the Group
in October 2010 and has over 38 years of experience in Asian life insurance having spent his entire career in
the sector. Prior to his current role, he was Group Chief Executive and President Designate from March 2017
and was a Regional Chief Executive for the Group since his initial appointment in 2010. During that time, he was
responsible for a number of the Company’s businesses, including those operating in Mainland China, Thailand,
Indonesia, Singapore, Brunei and Taiwan as well as for the Group’s Agency Distribution channel. He is a director of
various companies within the Group including acting as Chairman and Chief Executive Officer for both AIA Co. and
AIA International. Prior to joining the Group, he was Group Chief Executive Officer and Director of Great Eastern
Holdings Limited from December 2008 to 2010. Mr. Ng worked for Prudential plc from 1989 to 2008, serving as
a Managing Director of Insurance of Prudential Corporation Asia Limited from 2005 to 2008, responsible for its
operations in Malaysia, Singapore, Indonesia and the Philippines. Mr. Ng began his career in life insurance at AIA
Malaysia in 1980. He has been a board member of the Financial Services Professional Board in Kuala Lumpur
since 24 September 2014 and has been a Fellow of the Society of Actuaries (U.S.) since 1985. He received his
Bachelor of Science degree in Mechanical Engineering from Lafayette College (Pennsylvania, USA) in 1979.

ANNUAL REPORT 2018 | 079
OV
ER
VIE
WF
INA
NC
IAL
AN
D O
PE
RA
TIN
G R
EV
IEW
CO
RP
OR
AT
E G
OV
ER
NA
NC
EF
INA
NC
IAL
STA
TE
ME
NT
SA
DD
ITIO
NA
L IN
FO
RM
AT
ION
INDEPENDENT NON-EXECUTIVE DIRECTORS
Mr. Jack Chak-Kwong SoAged 74, is an Independent Non-executive Director of the Company. He was appointed a Non-executive Director
of the Company on 28 September 2010 and re-designated as an Independent Non-executive Director of the
Company on 26 September 2012. He is also the Chairman of the Remuneration Committee and a member of
the Audit Committee and the Nomination Committee of the Company. From August 2007 to September 2010,
Mr. So served as an independent non-executive director of AIA Co. He is currently an independent non-executive
director of China Resources Power Holdings Co. Ltd. (listed on the Hong Kong Stock Exchange) and the Chairman
of Airport Authority Hong Kong. He is also an independent senior advisor to Credit Suisse, Greater China and
a non-official member of the Chief Executive’s Council of Advisers on Innovation and Strategic Development.
Mr. So was Chairman of the Consultative Committee on Economic and Trade Co-operation between Hong Kong
and Mainland China from October 2013 to December 2015. Mr. So was awarded the Gold Bauhinia Star and the
Grand Bauhinia Medal by the HKSAR Government in 2011 and 2017, respectively. Mr. So served as an executive
director of the Hong Kong Trade Development Council from 1985 to 1992 and served as its Chairman from 2007
to 2015. He was an independent non-executive director of Cathay Pacific Airways Limited (listed on the Hong
Kong Stock Exchange) from 2002 to 2015, a non-executive director of The Hongkong and Shanghai Banking
Corporation Limited from 2000 to 2007, the Chairman of the Hong Kong Film Development Council from 2007 to
2013 and a member of the Chinese People’s Political Consultative Conference from 2008 to 2018.
Mr. Chung-Kong ChowAged 68, is an Independent Non-executive Director of the Company, having been appointed on 28 September
2010. He is also the Chairman of the Risk Committee and a member of the Nomination Committee of the Company.
Mr. Chow was appointed a non-official member of the Executive Council of the HKSAR on 1 July 2012 and was
further appointed for a new term of office from 1 July 2017. Mr. Chow was also appointed as the Chairman of the
Advisory Committee on Admission of Quality Migrants and Professionals of the HKSAR from 1 July 2016, a director
of the Community Chest of Hong Kong from 19 June 2017, a member of the Financial Leaders Forum set up by the
HKSAR Government from 18 August 2017, a non-official member of the Human Resources Planning Commission
of the HKSAR Government from 1 April 2018 and a member of the InnoHK Steering Committee from 4 February
2019. He has also been a Steward of The Hong Kong Jockey Club since March 2011. Mr. Chow was knighted in the
United Kingdom for his contribution to industry in 2000 and was awarded the Gold Bauhinia Star by the HKSAR
Government in 2015. Mr. Chow was the Chairman of the Advisory Committee on Corruption of the Independent
Commission Against Corruption from 2013 to 2018, the Chairman of Hong Kong Exchanges and Clearing Limited
(listed on the Hong Kong Stock Exchange) from 2012 to 2018, Chief Executive Officer of MTR Corporation Limited
(listed on the Hong Kong Stock Exchange) from 2003 to 2011, Chief Executive Officer of Brambles Industries
plc, a global support services company, from 2001 to 2003, and Chief Executive of GKN plc, a leading industrial
company based in the United Kingdom, from 1997 to 2001. He was an independent non-executive director of
Anglo American plc from 2008 to 2014, independent non-executive director of Standard Chartered plc from 1997
to 2008 and the Chairman of the Hong Kong General Chamber of Commerce from 2012 to June 2014.

| AIA GROUP LIMITED080
CORPORATE GOVERNANCEBOARD OF DIRECTORS
Mr. John Barrie HarrisonAged 62, is an Independent Non-executive Director of the Company, having been appointed on 1 July 2011. He is
also the Chairman of the Audit Committee and a member of the Nomination Committee and the Risk Committee of
the Company. Mr. Harrison is an independent non-executive director of Cathay Pacific Airways Limited (listed on
the Hong Kong Stock Exchange). He is also an independent non-executive director of BW Group Limited and has
been Vice Chairman of BW LPG Limited since 2013. Mr. Harrison is also an independent non-executive director
and the Chairman of the audit committee of Grosvenor Asia Pacific Limited since 1 December 2017. He was
appointed an Honorary Court Member of The Hong Kong University of Science and Technology with effect from
20 September 2016. He was an independent non-executive director of Hong Kong Exchanges and Clearing Limited
(listed on the Hong Kong Stock Exchange) from 20 April 2011 to 26 April 2017, The London Metal Exchange
Limited from 6 December 2012 to 26 April 2017 and LME Clear Limited from 16 December 2013 to 26 April 2017.
From 2008 to 2010, Mr. Harrison was Deputy Chairman of KPMG International. In 2003, he was elected Chairman
and Chief Executive Officer of KPMG, China and Hong Kong and Chairman of KPMG Asia Pacific. Mr. Harrison
began his career with KPMG in London in 1977, becoming a partner of KPMG Hong Kong in 1987. From 2012
to May 2015, he was also a member of the Asian Advisory Committee of AustralianSuper Pty Ltd. Mr. Harrison
received an honorary fellowship from The Hong Kong University of Science and Technology in 2017. Mr. Harrison
is a Fellow of the Institute of Chartered Accountants in England and Wales and a member of the Hong Kong
Institute of Certified Public Accountants.
Mr. George Yong-Boon YeoAged 64, is an Independent Non-executive Director of the Company, having been appointed on 2 November 2012.
He is also a member of the Audit Committee, the Nomination Committee and the Remuneration Committee of the
Company. Mr. Yeo is the Chairman of Kerry Logistics Network Limited (listed on the Hong Kong Stock Exchange)
and a director of Kerry Holdings Limited. Mr. Yeo is an independent director of Pinduoduo Inc. (listed on the
Nasdaq Global Select Market) and New Yangon Development Company Limited. He has been a member of the
International Advisory Committee of Mitsubishi Corporation since June 2014. He is a member of the International
Advisory Board of the Berggruen Institute on Governance. In March 2018, he became a senior advisor to Brunswick
Group LLP for its Geopolitical Initiative. In 2013, he was appointed a member of the Pontifical Commission for
Reference on the Economic-Administrative Structure of the Holy See. He became a member of the Vatican Council
for the Economy in February 2014. In 2012, Mr. Yeo was presented with the Order of Sikatuna by the Philippines
Government and the Padma Bhushan by the Indian Government, and became an Honorary Officer of the Order
of Australia. From 1988 to 2011, Mr. Yeo was a member of the Singapore Parliament and held various Cabinet
positions, including Minister for Foreign Affairs, Minister for Trade and Industry, Minister for Health, Minister for
Information and the Arts and Minister of State for Finance. From 1972 to 1988, Mr. Yeo served in the Singapore
Armed Forces and attained the rank of Brigadier-General in 1988 when he was Director of Joint Operations and
Planning in the Ministry of Defence.

ANNUAL REPORT 2018 | 081
OV
ER
VIE
WF
INA
NC
IAL
AN
D O
PE
RA
TIN
G R
EV
IEW
CO
RP
OR
AT
E G
OV
ER
NA
NC
EF
INA
NC
IAL
STA
TE
ME
NT
SA
DD
ITIO
NA
L IN
FO
RM
AT
ION
Mr. Mohamed Azman Yahya (alias: Mohamed Azman bin Yahya)Aged 55, is an Independent Non-executive Director of the Company, having been appointed on 24 February 2014.
He is also a member of the Nomination Committee and the Remuneration Committee of the Company. Mr. Yahya is
the Executive Chairman of Symphony Life Berhad, the Independent Non-executive Chairman of Ranhill Holdings
Berhad and an independent non-executive director of Sime Darby Berhad, all of which are listed on the Main
Market of Bursa Malaysia Securities Berhad (Bursa Malaysia). Mr. Yahya is a director and Chairman of various
companies, including Symphony House Sdn Bhd (formerly known as Symphony House Berhad) and Sepang
International Circuit Sdn Bhd. He also sits on the board of Ekuiti Nasional Berhad, a government linked private
equity fund management company. He started his career at KPMG in London and thereafter worked in a variety of
roles in investment banking, ultimately being named chief executive of Amanah Merchant Bank. In 1998, he was
tasked by the Malaysian Government to set-up and head Danaharta, the national asset management company.
He was also the Chairman of the Corporate Debt Restructuring Committee, set up by Bank Negara Malaysia to
mediate and assist in debt restructuring programmes of viable companies. He was also a director of Khazanah
Nasional Berhad, the Malaysian government investment arm from 2004 to 2018. Mr. Yahya was the Non-executive
Chairman of Ranhill Holdings Berhad before his re-designation as Independent Non-executive Chairman with
effective from 2 February 2019. Mr. Yahya received his BSc Economics (First Class) from the London School of
Economics and Political Science in 1985 and is a member of the Institute of Chartered Accountants in England
and Wales, the Malaysian Institute of Accountants and a fellow of the Institute of Bankers Malaysia.
Professor Lawrence Juen-Yee LauAged 74, is an Independent Non-executive Director of the Company, having been appointed on 18 September
2014. He is also a member of the Nomination Committee and the Risk Committee of the Company. Professor Lau
currently serves as an independent non-executive director of CNOOC Limited and Semiconductor Manufacturing
International Corporation (both listed on the Hong Kong Stock Exchange and the New York Stock Exchange).
He is also an independent non-executive director of Hysan Development Company Limited (listed on the Hong Kong
Stock Exchange) and Far EasTone Telecommunications Company Limited (listed on the Taiwan Stock Exchange).
He has been serving as the Ralph and Claire Landau Professor of Economics at The Chinese University of Hong
Kong (CUHK) since 2007 and the Chairman of the Council of Shenzhen Finance Institute of CUHK, Shenzhen
since 12 January 2017. He currently serves as a member of the Exchange Fund Advisory Committee of the HKSAR,
Chairman of its Governance Sub-committee and a member of its Currency Board Sub-committee and Investment
Sub-committee. In addition, he serves as a member and Chairman of the Prize Recommendation Committee for
the LUI Che Woo Prize Limited, Vice-Chairman of the Our Hong Kong Foundation, Vice-Chairman of China Center
for International Economic Exchanges, Beijing, as well as a member of the Hong Kong Trade Development Council
Belt and Road Committee. He was awarded the Gold Bauhinia Star by the HKSAR Government in 2011. From
2004 to 2010, Professor Lau served as Vice-Chancellor (President) of CUHK. He was appointed Chairman of CIC
International (Hong Kong) Co., Limited, a wholly-owned subsidiary of China Investment Corporation, in September
2010 and retired from the position in September 2014. He was a member of the 12th National Committee of the
Chinese People’s Political Consultative Conference and a Vice-Chairman of its Sub-committee of Economics from
2013 to 2018. He received his B.S. degree (with Great Distinction) in Physics from Stanford University in 1964
and his M.A. and Ph.D. degrees in Economics from the University of California at Berkeley in 1966 and 1969,
respectively. He joined the faculty of the Department of Economics at Stanford University in 1966, becoming its
Professor of Economics in 1976 and the first Kwoh-Ting Li Professor in Economic Development in 1992. From
1992 to 1996, he served as a Co-Director of the Asia-Pacific Research Center at Stanford University, and from
1997 to 1999 as the Director of the Stanford Institute for Economic Policy Research. He became its Kwoh-Ting Li
Professor in Economic Development, Emeritus, upon his retirement from Stanford University in 2006.

| AIA GROUP LIMITED082
CORPORATE GOVERNANCEBOARD OF DIRECTORS
Ms. Swee-Lian TeoAged 59, is an Independent Non-executive Director of the Company, having been appointed on 14 August 2015.
She is also a member of the Nomination Committee and the Risk Committee of the Company. Ms. Teo currently
serves as a non-executive and independent director and a member of the corporate governance and nominations
committee and executive resource and compensation committee and chairs the risk committee of Singapore
Telecommunications Limited (listed on the Singapore Exchange). She is also a non-executive director and chairs
the audit and risk committee of Avanda Investment Management Pte Ltd., a Singapore-based fund management
company. Ms. Teo is a member of the board of directors of the Dubai Financial Services Authority and a director
of Clifford Capital Pte. Ltd. Ms. Teo has over 27 years of experience with Monetary Authority of Singapore (MAS).
During her time at the MAS, she worked in foreign reserves management, financial sector development, strategic
planning and financial supervision. She was the Deputy Managing Director in charge of Financial Supervision,
overseeing the regulation and supervision of the banking, insurance and capital markets industries and
macroeconomic surveillance, and also represented the MAS on various international fora, including the Basel
Committee on Banking Supervision, and on various committees and working groups of the Financial Stability
Board. She retired from the MAS as Special Advisor in the Managing Director’s office in June 2015. In addition
to the MAS, Ms. Teo also served on the board of the Civil Aviation Authority of Singapore from 2002 to 2010.
Ms. Teo received her B.Sc. (First) in Mathematics from the Imperial College of Science and Technology, University
of London in 1981 and her M.Sc. in Applied Statistics from the University of Oxford in 1982. She was also awarded
the Public Administration Medal (Gold) (Bar) at the Singapore National Day Awards in 2012.
Dr. Narongchai AkrasaneeAged 73, is an Independent Non-executive Director of the Company, having been appointed on 15 January 2016.
He is also a member of the Audit Committee and the Nomination Committee of the Company and the Chairman
of advisory board of AIA Thailand. Dr. Narongchai was previously an Independent Non-executive Director of
the Company from 21 November 2012 to 31 August 2014. He is the former Minister of Energy and Minister
of Commerce for the Kingdom of Thailand, and served as a Senator. Dr. Narongchai served as Chairman of
the Export-Import Bank of Thailand from December 2005 to June 2010, a Director of the Office of the Insurance
Commission of Thailand from October 2007 to August 2012, a Director of the National Economic and Social
Development Board for the period from July 2009 to July 2013 and a member of the Monetary Policy Committee
of the Bank of Thailand from November 2011 to September 2014. He is currently the Chairman of the Steering
Committee and Vice-Chairman of the Council of Mekong Institute, the Chairman of the Thailand National
Committee for the Pacific Economic Cooperation Council and the Chairman of the Khon Kaen University Council in
Thailand. Dr. Narongchai also acts as the Chairman and an independent director of three entities listed on the Stock
Exchange of Thailand, namely MFC Asset Management Public Company Limited, Ananda Development Public
Company Limited and Thai-German Products Public Company Limited. He is the Chairman and an independent
director of The Brooker Group Public Company Limited, which is listed on the Stock Exchange of Thailand’s Market
for Alternative Investment. Dr. Narongchai is also the Chairman of the Seranee Group of companies. He previously
served as an independent director of each of Malee Sampran Public Company Limited and ABICO Holdings
Public Company Limited and as the Vice-Chairman and an independent director of Thai-German Products Public
Company Limited, all of which are listed on the Stock Exchange of Thailand. Dr. Narongchai received his Bachelor’s
degree in Economics with Honours from the University of Western Australia and a M.A. and Ph.D. in Economics
from Johns Hopkins University.

ANNUAL REPORT 2018 | 083
OV
ER
VIE
WF
INA
NC
IAL
AN
D O
PE
RA
TIN
G R
EV
IEW
CO
RP
OR
AT
E G
OV
ER
NA
NC
EF
INA
NC
IAL
STA
TE
ME
NT
SA
DD
ITIO
NA
L IN
FO
RM
AT
ION
Mr. Cesar Velasquez PurisimaAged 58, is an Independent Non-executive Director of the Company, having been appointed on 1 September
2017. He is also a member of the Nomination Committee of the Company. Mr. Purisima currently serves as an
independent director of Ayala Land, Inc. and Universal Robina Corporation (both listed on The Philippine Stock
Exchange, Inc.). He is also a member of the Global Advisory Council of Sumitomo Mitsui Banking Corporation.
Mr. Purisima served in the government of the Republic of the Philippines (the Philippines) as Secretary of the
Department of Finance from July 2010 to June 2016 and as Secretary of the Department of Trade and Industry
from January 2004 to February 2005. He also previously served on the boards of a number of government
institutions, including as a member of Monetary Board of the Bangko Sentral ng Pilipinas (Central Bank of the
Philippines), Governor of the World Bank Group for the Philippines, Governor of the Asian Development Bank
for the Philippines, Alternate Governor of the International Monetary Fund for the Philippines and Chairman
of Land Bank of the Philippines. He was conferred the Chevalier dans l’Ordre national de la Légion d’Honneur
(Knight of the National Order of the Legion of Honour) by the President of the French Republic in 2017, the Order
of Lakandula, Rank of Grand Cross (Bayani) by the President of the Philippines in 2016 and the Chevalier de
l’Ordre national du Mérite (Knight of the National Order of Merit) by the President of the French Republic in 2001.
Mr. Purisima is a certified public accountant. He has extensive experience in public accounting both in the
Philippines and abroad. He was Chairman and Managing Partner of SyCip, Gorres, Velayo & Co. (a member firm
of Andersen Worldwide until 2002 when it became a member firm of Ernst & Young Global Limited) from 1999
until 2004. During the period, Mr. Purisima was also the Asia-Pacific Area Managing Partner for Assurance and
Business Advisory Services of Andersen Worldwide from 2001 to 2002 and Regional Managing Partner for the
ASEAN Practice of Andersen Worldwide from 2000 to 2001. Mr. Purisima obtained his Bachelor of Science in
Commerce (Majors in Accounting & Management of Financial Institutions) degree from De La Salle University
(Manila) in 1979, Master of Management degree from J. L. Kellogg Graduate School of Management, Northwestern
University in 1983 and Doctor of Humanities honoris causa degree from Angeles University Foundation (the
Philippines) in 2012.

| AIA GROUP LIMITED084
CORPORATE GOVERNANCE
EXECUTIVE COMMITTEE
Jacky ChanDaisuke Iwase Cara Ang Garth JonesBiswa Misra Stuart A. Spencer Mark Konyn William Lisle Ng Keng Hooi

ANNUAL REPORT 2018 | 085
OV
ER
VIE
WF
INA
NC
IAL
AN
D O
PE
RA
TIN
G R
EV
IEW
CO
RP
OR
AT
E G
OV
ER
NA
NC
EF
INA
NC
IAL
STA
TE
ME
NT
SA
DD
ITIO
NA
L IN
FO
RM
AT
ION
Mitchell New Mark SaundersJohn Cai Jon Nielsen

| AIA GROUP LIMITED086
CORPORATE GOVERNANCEEXECUTIVE COMMITTEE
Mr. Ng Keng HooiMr. Ng’s biography is set out above.
Mr. Garth JonesAged 56, is the Group Chief Financial Officer responsible for leading the Group in all aspects of capital and
financial management, as well as managing relationships with key external stakeholders, including independent
auditors and actuaries, rating agencies and international accounting and regulatory bodies. He is a director of
various companies within the Group, including AIA Co. and AIA International. He joined the Group in April 2011.
Prior to joining the Group, Mr. Jones was the Executive Vice President of China Pacific Life Insurance Co., Ltd.,
the life insurance arm of China Pacific Insurance (Group) Co., Ltd. He also held a number of senior management
positions during 12 years with Prudential Corporation Asia Limited, including Chief Financial Officer of the Asian
life insurance operations. Prior to joining Prudential, Mr. Jones led the development of Swiss Re’s Asia life business.
Mr. Jones is a Fellow of the Institute of Actuaries in the United Kingdom. On 1 June 2016, he was appointed a
member of the industry advisory committee on long term business, which advises the Independent Insurance
Authority in Hong Kong. Mr. Jones is also a member of the IFRS Advisory Council of the IASB.
Mr. William LisleAged 53, is the Regional Chief Executive responsible for the Group’s businesses operating in Thailand, Korea,
Australia and New Zealand, India and Sri Lanka as well as Group Partnership Distribution. Mr. Lisle was
Chief Executive Officer of AIA’s operation in Malaysia from December 2012 to May 2015, including leading the
large- scale and successful integration of ING Malaysia after its acquisition by the Group in 2012. He is a director of
various companies within the Group, including AIA Co., AIA Australia Limited and Sovereign Assurance Company.
He is also a director of Tata AIA Life Insurance Company Limited, a joint venture between the Group and Tata Sons
Limited in India. Mr. Lisle joined the Group in January 2011 as Group Chief Distribution Officer. Prior to joining
the Group, Mr. Lisle was the Managing Director, South Asia for Aviva from May 2009 until 2010. Prior to joining
Aviva, Mr. Lisle held a number of senior positions at Prudential Corporation Asia Limited, including Chief Executive
Officer in Malaysia from 2008 to 2009, Chief Executive Officer in Korea from 2005 to 2008, Chief Agency Officer
for ICICI Prudential from 2002 to 2004 and Director of Agency Development, South Asia in 2001.
Mr. John CaiAged 51, is the Regional Chief Executive responsible for the Group’s businesses operating in China, Malaysia,
Vietnam, Taiwan and Myanmar. Mr. Cai is a director of various companies within the Group, including AIA Co.
and AIA (Vietnam) Life Insurance Company Limited. He joined the Group in July 2009. Mr. Cai has over 27 years’
experience in the insurance industry, both in Asia and the United States. Prior to becoming Regional Chief Executive,
since 2009, he was Chief Executive Officer of AIA China, which became AIA’s second-largest and fastest growing
business during his tenure. Before joining the Group, Mr. Cai was Chief Executive Officer at AXA Hong Kong, having
originally been appointed Chief Agency Officer in 2003. Mr. Cai graduated from Xi’an Jiaotong University in 1989.
He is also a Chartered Financial Consultant (ChFC), a Chartered Life Underwriter and a Certified Financial Planner.
Mr. Jacky ChanAged 55, is the Regional Chief Executive responsible for the Group’s businesses operating in Hong Kong, Macau,
Singapore, Brunei, Indonesia, the Philippines, and Cambodia as well as Group Agency Distribution. He is a director
of various companies within the Group, including AIA Co. and AIA International. Mr. Chan has extensive experience
having worked at AIA for the past 31 years. Prior to becoming a Regional Chief Executive, Mr. Chan was Chief
Executive Officer of AIA Hong Kong and Macau since 2009. Previously, he held several senior positions including
the Country Head of AIA China, Executive Vice President – Distribution & Marketing of Nan Shan Life Insurance
of Taiwan and Senior Vice President & Head of Life Profit Centre of AIA - Asia (ex-Japan & Korea). Mr. Chan holds
a Bachelor of Science Degree from The University of Hong Kong. He is a Fellow of the Society of Actuaries (FSA),
a member of American Academy of Actuaries (MAAA) and a Fellow of the Canadian Institute of Actuaries (CIA).

ANNUAL REPORT 2018 | 087
OV
ER
VIE
WF
INA
NC
IAL
AN
D O
PE
RA
TIN
G R
EV
IEW
CO
RP
OR
AT
E G
OV
ER
NA
NC
EF
INA
NC
IAL
STA
TE
ME
NT
SA
DD
ITIO
NA
L IN
FO
RM
AT
ION
Mr. Mitchell NewAged 55, is the Group General Counsel and Company Secretary responsible for the provision of legal services and
company secretarial services for the Group and providing leadership to legal and corporate governance functions
within country operations. He is a director of various companies within the Group including AIA International, AIA
Singapore Private Limited and AIA Reinsurance Limited. He joined the Group in April 2011. Prior to joining the
Group, Mr. New was a member of the law firm Fasken Martineau and occupied various senior roles with Manulife
Financial, including Senior Vice President and Chief Legal Officer for Asia, based in Hong Kong and Senior Vice
President and General Counsel to Manulife’s Canadian division. He is a qualified barrister and solicitor and member
of the Law Society of Upper Canada and holds a Bachelor of Commerce Degree and Master’s Degree in Business
Administration from McMaster University and a Bachelor of Laws Degree from the University of Western Ontario.
Mr. Mark SaundersAged 55, is the Group Chief Strategy and Corporate Development Officer responsible for strategy and corporate
transactions for the Group. He is also responsible for the Group’s Corporate Solutions and Healthcare businesses.
He joined the Group in April 2014 and is a director of various companies within the Group. He previously served
as Group Chief Strategy and Marketing Officer. Prior to joining the Group, Mr. Saunders was Managing Director
of Towers Watson for the Asia-Pacific Insurance Sector, as well as Managing Director for the firm’s Hong Kong
business and a board member of various entities. Prior to his time at Towers Watson, he was Asian Regional
Leader, Hong Kong Chief Executive Officer and Executive Director and Board Member of the Isle of Man-based
international life insurance operations of Clerical Medical and its joint venture life insurer in Korea (Coryo-CM).
He is a Fellow of the Institute and Faculty of Actuaries and Fellow of five other professional actuarial bodies.
Dr. Mark KonynAged 57, is the Group Chief Investment Officer responsible for providing oversight to the management of the
investment portfolios of the Group as well as supervising and supporting the many investment professionals
throughout the Group. He is a director of various companies within the Group including Chairman of AIA Investment
Management Private Limited. He joined the Group in September 2015. Dr. Konyn joined AIA from Cathay Conning
Asset Management, where he was Chief Executive Officer responsible for the company’s investment business
and strategic expansion in the region. He had held senior positions at Allianz Global Investors (where he was
Asia-Pacific CEO for RCM Global Investors), Fidelity Investments and Prudential UK. He is a Fellow of the Royal
Statistical Society, and holds a Diploma from the London Business School in Investment Management, having
previously completed his Ph.D. in Operational Research sponsored by the UK Government.
Ms. Cara AngAged 50, is the Group Chief Human Resources Officer responsible for the development of overall human capital
strategies and their implementation across the Group, as well as leading and providing support to the human
resources functions in country market operations. She joined the Group as the Chief Human Resources Officer for
AIA Singapore in May 2016. Prior to joining AIA, Ms. Ang was the Head of Human Resources of Standard Chartered
Bank Singapore. During her time with Standard Chartered, she spent more than 10 years in a variety of country,
regional and global HR leadership roles based in Singapore and Thailand. Prior to joining Standard Chartered
Bank Singapore, Ms. Ang was the Senior Vice President and Head of Human Resources for Marsh Asia.

| AIA GROUP LIMITED088
CORPORATE GOVERNANCEEXECUTIVE COMMITTEE
Mr. Biswa MisraAged 41, is the Group Chief Technology and Operations Officer responsible for providing leadership to the Group’s
technology, operations and innovation areas and leading all Group Office technology resources. He is a director
of various companies within the Group. He joined the Group in June 2013. Prior to joining the Group, Mr. Misra
served as the Regional Chief Technology Officer for ING Insurance Asia Pacific. Previously, he spent six years with
information technology consulting firm Capgemini, leading the company’s insurance practice for Asia. Mr. Misra
holds a degree in electrical engineering from the National Institute of Technology, Surat, India.
Mr. Stuart A. SpencerAged 53, is the Group Chief Marketing Officer of AIA, responsible for the Group’s marketing initiatives, customer
propositions and AIA Vitality. He is a director of various companies within the Group. Mr. Spencer re-joined AIA
in May 2017 from Zurich Insurance Group, where he was most recently the interim CEO, Asia Pacific. Prior to
that he was Chief Executive Officer, General Insurance, Asia Pacific for Zurich Insurance from 2013 to 2016.
Mr. Spencer was with the American International Group from 1996 to 2009, during which time he held a number
of senior positions including leading their Accident & Health General Insurance operations in Latin America and
the Caribbean and President – Accident and Health Worldwide. Mr. Spencer was also the Global Head and COO,
Worldwide Life, Accident & Health, for Chubb Insurance. Mr. Spencer is an alumnus of the Harvard Business
School, The Fletcher School of Law and Diplomacy and Brandeis University.
Mr. Jon NielsenAged 46, is the Group Chief Risk Officer responsible for the Group’s risk and compliance functions. He is also a
director of various companies within the Group. Mr. Nielsen has been with AIA for 11 years. He was appointed the
Group’s Regional Chief Financial Officer in 2010, overseeing the Group’s financial planning, reporting and analysis,
financial systems and operations, treasury and tax functions. Prior to joining AIA, Mr. Nielsen served as Deputy
Head of Accounting Policy for Allianz Group for three years. Previously, he spent over eight years with Deloitte &
Touche primarily serving insurance clients. He received a Master of Professional Accountancy and a Bachelor of
Science in Business Administration from the University of Nebraska and is a Certified Public Accountant.
Mr. Daisuke IwaseAged 42, is the Group Chief Digital Officer responsible for the Group’s digital innovation initiatives. Mr. Iwase joined
AIA in July 2018 from Lifenet Insurance Company (Lifenet), a listed digital direct life insurance company in Japan,
where he was most recently the Representative Director and President. Mr. Iwase co-founded Lifenet in 2006 and
took the company public on the Tokyo Stock Exchange in 2012. Prior to co-founding Lifenet, Mr. Iwase started his
career as a strategy consultant with The Boston Consulting Group in Tokyo before establishing the Tokyo office
of a US-based technology venture capital firm and later working in an international private equity firm. He holds
an MBA with High Distinction from Harvard Business School and an LLB from The University of Tokyo. In 2010,
he was nominated as a Young Global Leader by the World Economic Forum.

ANNUAL REPORT 2018 | 089
OV
ER
VIE
WF
INA
NC
IAL
AN
D O
PE
RA
TIN
G R
EV
IEW
CO
RP
OR
AT
E G
OV
ER
NA
NC
EF
INA
NC
IAL
STA
TE
ME
NT
SA
DD
ITIO
NA
L IN
FO
RM
AT
ION
The Board is pleased to present this report and the audited consolidated financial statements of the Company for
the thirteen-month period ended 31 December 2018.
PRINCIPAL ACTIVITIES
The Group is a life insurance based financial services provider operating in 18 markets throughout the Asia-Pacific
region. The Group’s principal activities are the writing of life insurance business, providing life insurance, accident
and health insurance and savings plans throughout Asia, and distributing related investment and other financial
services products to its customers.
Details of the activities and other particulars of the Company’s principal subsidiaries are set out in note 43 to the
financial statements.
CHANGE OF FINANCIAL YEAR-END DATE
In February 2018, the Board resolved to change the Company’s financial year-end date from 30 November to
31 December.
RESULTS
The results of the Group for the thirteen-month period ended 31 December 2018 and the state of the Group’s
affairs at that date are set out in the financial statements on pages 136 to 266 of this Annual Report.
BUSINESS REVIEW
The review of the business of the Group for the thirteen-month period ended 31 December 2018, including a
description of its principal risks and uncertainties and an indication of likely future developments as required
by Schedule 5 to the Hong Kong Companies Ordinance, is contained in the Financial Review (pages 19 to 35),
Business Review (pages 36 to 53), Risk Management (pages 54 to 64), Valuing Our People (pages 66 to 69), and
Corporate Social Responsibility (pages 70 to 73) sections under Financial and Operating Review, note 42 and
note 44 to the financial statements as well as Condensed Business and Financial Review for the Thirteen Months
Ended 31 December 2018 (pages 294 to 303). These discussions form part of this report.
AIA takes a proactive approach to understanding the impacts posed to our business by the environment, while also
mitigating our own environmental footprint. The Group issued its first Climate Change Statement in 2018, outlining
the initiatives we have taken to understand and address the risks posed to our business by climate change. We
also voiced our support for the Paris Agreement by becoming a signatory to the Task Force on Climate-related
Financial Disclosures. In accordance with the Group’s Environmental Policy, we continue to measure and report
on our emissions and energy footprint.
REPORT OF THE DIRECTORS

| AIA GROUP LIMITED090
CORPORATE GOVERNANCEREPORT OF THE DIRECTORS
AIA monitors environmental regulation and opportunities in the area of green finance, and in 2018 became a
founding member of the Hong Kong Green Finance Taskforce, which aims to contribute to the development of
green finance regulation locally.
Customer privacy is of paramount importance to the Group. We continue to upgrade and invest in physical,
administrative and technical measures to protect personal and business data. This includes programmes to
educate and raise awareness among our people regarding sound and proper cybersecurity and data protection
practices.
In line with recent revisions to our Code of Conduct, we have updated our Supplier Code of Conduct to better
integrate sustainability issues within our supply chain and to encourage optimal ESG practices among our suppliers.
To understand more about our ESG initiatives and the progress we have made, please refer to our Environmental,
Social and Governance Report which will be published on the websites of both the Hong Kong Stock Exchange and
the Company together with this Annual Report.
The Group is licensed to conduct insurance business and subject to extensive local regulatory oversight in each
of the geographical markets in which its branches and subsidiaries operate. While the extent of regulation
varies from jurisdiction to jurisdiction, it typically includes laws and regulations regarding corporate governance,
solvency/capital adequacy, investment management, financial reporting and distribution. The Group dedicates
substantial resources and appropriate personnel to support compliance with relevant laws and regulations. In
particular, during the thirteen-month period ended 31 December 2018, the Group complied with all material
laws and regulations applicable to it including the solvency and capital adequacy requirements applied by its
regulators, details of which are contained in note 36 to the financial statements.
Please see the Corporate Governance Report for a discussion on the Company’s commitment to high standards of
corporate governance and the Board’s responsibility for compliance with statutory obligations.
Details of significant events affecting the Group that have occurred since 31 December 2018 are set out in note
44 to the financial statements.
DIVIDENDS
An interim dividend of 29.20 Hong Kong cents per share for the seven-month period ended 30 June 2018 (for
the six-month period ended 31 May 2017: 25.62 Hong Kong cents per share) was paid on 28 September 2018.
The Board has recommended an increase in the payment of a final dividend of 14 per cent to 84.80 Hong Kong
cents per share for the thirteen-month period ended 31 December 2018 (for the twelve-month period ended
30 November 2017: 74.38 Hong Kong cents per share), consistent with AIA’s established prudent, sustainable
and progressive dividend policy. The Board has also recommended the payment of a special dividend of 9.50
Hong Kong cents per share for the additional month in the accounting period due to the change of the Company’s
financial year-end date from 30 November 2018 to 31 December 2018. The dividends reflect the strength of our
financial results and the Board’s continued confidence in the future prospects of the Group.

ANNUAL REPORT 2018 | 091
OV
ER
VIE
WF
INA
NC
IAL
AN
D O
PE
RA
TIN
G R
EV
IEW
CO
RP
OR
AT
E G
OV
ER
NA
NC
EF
INA
NC
IAL
STA
TE
ME
NT
SA
DD
ITIO
NA
L IN
FO
RM
AT
ION
Under the trust deed of the Company’s Restricted Share Unit Scheme (RSU Scheme), shares of the Company are
held by the trustee in either of two trust funds. These shares are held against the future entitlements of scheme
participants. Provided the shares of the Company are held by the trustee and no beneficial interest in those shares
has been vested in any beneficiary, the trustee shall waive any right to dividend payments or other distributions in
respect of those shares (unless the Company determines otherwise).
As of 28 September 2018 (being the payment date of the interim dividend), the trustee held 49,036,565 shares.
The amount of interim dividend payments waived was approximately US$2 million. Pursuant to the trust deed,
the trustee will waive the right to final dividend and special dividend payments if a final dividend and a special
dividend are declared.
Subject to shareholders’ approval at the AGM, the final dividend and the special dividend will be payable on
Thursday, 6 June 2019 to shareholders whose names appear on the register of members of the Company at the
close of business on Wednesday, 22 May 2019, being the record date for determining the entitlements to the final
dividend and the special dividend.
DIRECTORS
The Directors of the Company during the thirteen-month period under review and up to the date of this report are
as follows:
Independent Non-executive Chairman and Independent Non-executive Director
Mr. Edmund Sze-Wing Tse
Executive Director
Mr. Ng Keng Hooi (Group Chief Executive and President)
Independent Non-executive Directors
Mr. Jack Chak-Kwong So
Mr. Chung-Kong Chow
Mr. John Barrie Harrison
Mr. George Yong-Boon Yeo
Mr. Mohamed Azman Yahya
Professor Lawrence Juen-Yee Lau
Ms. Swee-Lian Teo
Dr. Narongchai Akrasanee
Mr. Cesar Velasquez Purisima
In accordance with Article 100 of the Company’s Articles of Association, Ms. Swee-Lian Teo, Dr. Narongchai
Akrasanee and Mr. George Yong-Boon Yeo will retire from office by rotation and, being eligible, offer themselves
for re-election at the AGM.

| AIA GROUP LIMITED092
CORPORATE GOVERNANCEREPORT OF THE DIRECTORS
CHANGES IN DIRECTORS’ INFORMATION
Changes in the Directors’ information which are required to be disclosed pursuant to Rule 13.51B(1) of the Listing
Rules are set out below:
Name of Director Change
Mr. Chung-Kong Chow • Ceased to be the Chairman of the Advisory Committee on Corruption of the Independent Commission Against Corruption with effect from 31 December 2018
• Appointed as member of the InnoHK Steering Committee with effect from 4 February 2019
All Independent Non-executive Directors • The Board membership fee (exclusive of Board committee membership or chair fee) has been increased from US$160,000 to US$168,000 per annum with effect from 1 January 2019
Mr. Edmund Sze-Wing Tse • The Board Chairman fee (inclusive of Board membership fee but exclusive of Board committee membership or chair fee) has been increased from US$485,000 to US$542,500 per annum with effect from 1 January 2019, and will be further increased to US$600,000 per annum with effect from 1 January 2020
Mr. Mohamed Azman Yahya • Re-designated as the Independent Non-executive Chairman of Ranhill Holdings Berhad with effect from 2 February 2019
Save as disclosed above, there is no other information required to be disclosed pursuant to Rule 13.51B(1) of the
Listing Rules.
DIRECTORS’ SERVICE CONTRACTS
No Director proposed for re-election at the AGM has a service contract with the Company which is not determinable
by the Company within one year without payment of compensation (other than statutory compensation).
DIRECTORS OF SUBSIDIARIES
The names of all directors who have served on the boards of the subsidiaries of the Company during the
thirteen-month period under review and up to the date of this report are available on the Company’s website at
www.aia.com under the sub-section headed “Board of Directors” of “Corporate Governance” in the section headed
“Investor Relations”.
PERMITTED INDEMNITY PROVISION
Pursuant to the Company’s Articles of Association, subject to the relevant statutes, every Director shall be
indemnified out of the assets of the Company against all costs, charges, expenses, losses and liabilities which he/
she may sustain or incur in or about the execution of his/her office or which may attach thereto. The Company has
taken out insurance against the liabilities and costs associated with proceedings which may be brought against
directors of the Group.

ANNUAL REPORT 2018 | 093
OV
ER
VIE
WF
INA
NC
IAL
AN
D O
PE
RA
TIN
G R
EV
IEW
CO
RP
OR
AT
E G
OV
ER
NA
NC
EF
INA
NC
IAL
STA
TE
ME
NT
SA
DD
ITIO
NA
L IN
FO
RM
AT
ION
DIRECTORS’ AND THE CHIEF EXECUTIVE’S INTERESTS AND SHORT POSITIONS IN SHARES AND UNDERLYING SHARES
As at 31 December 2018, the Directors’ and the Chief Executive’s interests and short positions in the shares,
underlying shares and debentures of the Company and its associated corporations (within the meaning of Part XV
of the SFO) as recorded in the register required to be kept under Section 352 of the SFO, or as otherwise notified
to the Company and the Hong Kong Stock Exchange pursuant to the Model Code, are as follows:
Interests and short positions in the shares and underlying shares of the Company:
Name of Director
Number of shares or
underlying shares
Long Position (L) Class
Percentage of the total number of
shares in issue(1) Capacity
Mr. Ng Keng Hooi 7,901,583(L)61,200(L)
(2)
(3)
Ordinary 0.06<0.01
Beneficial ownerInterest of spouse(4)
Mr. Edmund Sze-Wing Tse 3,460,400(L)100,000(L)
(3)
(3)
Ordinary 0.02<0.01
Beneficial ownerInterest of controlled
corporation(5)
Mr. Chung-Kong Chow 86,000(L)(3) Ordinary < 0.01 Beneficial owner
Mr. Jack Chak-Kwong So 260,000(L)(3) Ordinary < 0.01 Interest of controlled corporation(6)
Mr. John Barrie Harrison 75,000(L)(3) Ordinary < 0.01 Beneficial owner
Mr. George Yong-Boon Yeo 100,000(L)(3) Ordinary < 0.01 Beneficial owner
Professor Lawrence Juen-Yee Lau 60,000(L)100,000(L)
(3)
(3)
Ordinary < 0.01< 0.01
Beneficial ownerInterest of spouse(7)
Notes:(1) Based on 12,077,063,781 shares of the Company in issue as at 31 December 2018.
(2) The interests included 2,349,596 shares of the Company, 4,309,630 share options under the Share Option Scheme (SO Scheme), 1,240,152 restricted share units under the RSU Scheme and 2,205 matching restricted stock purchase units under the ESPP.
(3) The interests were in the shares of the Company.
(4) The 61,200 shares were held by Ms. Leong Seet Lan, the spouse of Mr. Ng Keng Hooi, as beneficial owner.
(5) The 100,000 shares were held by Edmund & Peggy Tse Foundation Limited, one-third interest of which is beneficially held by Mr. Edmund Sze-Wing Tse.
(6) The 260,000 shares were held by Cyber Project Developments Limited, a company beneficially wholly owned by Mr. Jack Chak-Kwong So.
(7) The 100,000 shares were held by Ms. Ayesha Abbas Macpherson, the spouse of Professor Lawrence Juen-Yee Lau, as beneficial owner.
Save as disclosed above, as at 31 December 2018, neither any Director nor the Chief Executive of the Company
had any interest or short position in the shares, underlying shares or debentures of the Company or its associated
corporations (within the meaning of Part XV of the SFO) as recorded in the register required to be kept under
Section 352 of the SFO, or as otherwise notified to the Company and the Hong Kong Stock Exchange pursuant to
the Model Code.

| AIA GROUP LIMITED094
CORPORATE GOVERNANCEREPORT OF THE DIRECTORS
INTERESTS AND SHORT POSITIONS IN SHARES AND UNDERLYING SHARES OF PERSONS OTHER THAN THE DIRECTORS OR THE CHIEF EXECUTIVE
As at 31 December 2018, the following persons, other than the Directors or the Chief Executive of the Company,
had interests and short positions in the shares and underlying shares of the Company as recorded in the register
required to be kept under Section 336 of the SFO:
Name of Shareholder
Number of shares or underlying shares
(Note 1) Long Position(L)
Short Position(S)Lending Pool(P) Class
Percentage of the total number
of shares in issue (Note 2) Capacity
JPMorgan Chase & Co. 1,088,254,932(L)19,556,741(S)
737,449,866(P)
Ordinary 9.010.166.10
Note 3
The Bank of New York Mellon Corporation 1,071,693,611(L)280,300,460(S)748,065,678(P)
Ordinary 8.872.326.19
Note 4
The Capital Group Companies, Inc. 984,372,860(L) Ordinary 8.15 Interest of controlled
corporations
Citigroup Inc. 743,672,359(L)4,243,480(S)
732,874,388(P)
Ordinary 6.150.036.06
Note 5
BlackRock, Inc. 629,705,868(L)2,007,714(S)
Ordinary 5.210.01
Interest of controlled
corporations
Notes:(1) The interests or short positions include underlying shares as follows:
Name of Shareholder
Long Position Short Position
Physically settled
listed equity derivatives
Cash settled
listed equity derivatives
Physically settled
unlisted equity derivatives
Cash settled
unlisted equity derivatives
Physically settled
listed equity derivatives
Cash settled
listed equity derivatives
Physically settled
unlisted equity derivatives
Cash settled
unlisted equity derivatives
JPMorgan Chase & Co. 4,623,648 1,556,000 491,200 6,687,175 1,082,000 10,685,300 1,725,066 5,889,375
The Bank of New York Mellon Corporation
– – – – – – 280,300,460 –
The Capital Group Companies, Inc.
– – 3,593,080 – – – – –
Citigroup Inc. 4,224,852 – 926,370 96,400 300,000 – 879,080 3,064,400
BlackRock, Inc. – – – 182,000 – – – 818,114
(2) Based on 12,077,063,781 shares in issue as at 31 December 2018.
(3) JPMorgan Chase & Co. held the interests and short positions in the following capacities:
Capacity
Number of shares or underlying shares
(Long Position)
Number of shares or underlying shares
(Short Position)
Beneficial owner 100,979,108 19,556,741
Investment manager 249,550,900 –
Trustee 275,058 –
Custodian corporation / Approved lending agent 737,449,866 –

ANNUAL REPORT 2018 | 095
OV
ER
VIE
WF
INA
NC
IAL
AN
D O
PE
RA
TIN
G R
EV
IEW
CO
RP
OR
AT
E G
OV
ER
NA
NC
EF
INA
NC
IAL
STA
TE
ME
NT
SA
DD
ITIO
NA
L IN
FO
RM
AT
ION
(4) The Bank of New York Mellon Corporation held the interests and short positions in the following capacities:
Capacity
Number of shares or underlying shares
(Long Position)
Number of shares or underlying shares
(Short Position)
Interest of controlled corporation 1,071,693,611 280,300,460
(5) Citigroup Inc. held the interests and short positions in the following capacities:
Capacity
Number of shares or underlying shares
(Long Position)
Number of shares or underlying shares
(Short Position)
Person having a security interest in shares 2,800 –
Interest of controlled corporations 10,795,171 4,243,480
Approved lending agent 732,874,388 –
Save as disclosed above, as at 31 December 2018, no person, other than the Directors or the Chief Executive of
the Company, whose interests are set out in the section entitled “Directors’ and the Chief Executive’s Interests and
Short Positions in Shares and Underlying Shares”, had any interest or short position in the shares or underlying
shares of the Company as recorded in the register required to be kept under Section 336 of the SFO.
DIRECTORS’ RIGHTS TO ACQUIRE SHARES OR DEBENTURES
Under his service contract, Mr. Ng Keng Hooi, an Executive Director and the Group Chief Executive and President,
is entitled to an annual discretionary earned incentive award, which includes payment in the form of shares of the
Company. Details of Mr. Ng Keng Hooi’s incentive awards are set out in the Remuneration Report.
DIRECTORS’ INTERESTS IN TRANSACTIONS, ARRANGEMENTS OR CONTRACTS
No transactions, arrangements or contracts of significance to which the Company or any of its subsidiaries was
a party, and in which any Director of the Company or his/her connected entity has a material interest, directly or
indirectly, subsisted as at 31 December 2018 or at any time during the thirteen-month period under review.
RESERVES
As at 31 December 2018, the aggregate amount of reserves available for distribution to shareholders of the
Company, as calculated under the provisions of Part 6 of the Hong Kong Companies Ordinance, was US$6,488
million (30 November 2017: US$3,315 million).
CHARITABLE DONATIONS
Charitable donations made by the Group during the thirteen-month period ended 31 December 2018 amounted to
US$6 million (for the twelve-month period ended 30 November 2017: US$3 million).

| AIA GROUP LIMITED096
CORPORATE GOVERNANCEREPORT OF THE DIRECTORS
MAJOR CUSTOMERS AND SUPPLIERS
During the thirteen-month period ended 31 December 2018, the percentage of the aggregate purchases
attributable to the Group’s five largest suppliers was less than 30 per cent of the Group’s total value of purchases
and the percentage of the aggregate sales attributable to the Group’s five largest customers was less than 30 per
cent of the Group’s total value of sales.
SHARES ISSUED
Details of the shares issued during the thirteen-month period ended 31 December 2018 are set out in note 34 to
the financial statements.
DEBENTURES ISSUED
Details of the debentures issued during the thirteen-month period ended 31 December 2018 are set out in
note 29 to the financial statements.
EQUITY-LINKED AGREEMENTS
During the thirteen-month period ended 31 December 2018, the Company did not enter into any equity-linked
agreements and there did not subsist any equity-linked agreement entered into by the Company as at
31 December 2018, save for the restricted share units, outstanding share options and restricted stock purchase
units awarded to employees under the RSU Scheme, the SO Scheme and the ESPP, respectively, and the restricted
stock subscription units awarded to agents under the Agency Share Purchase Plan (ASPP), each described below
and in the Remuneration Report and note 39 to the financial statements.
RSU SCHEMEDuring the thirteen-month period ended 31 December 2018, 11,617,538 restricted share units were awarded by
the Company under the RSU Scheme adopted by the Company on 28 September 2010 (as amended). Details of
the scheme are set out in the Remuneration Report and note 39 to the financial statements.
SO SCHEMEDuring the thirteen-month period ended 31 December 2018, 4,601,313 share options were awarded by the
Company under the SO Scheme adopted by the Company on 28 September 2010 (as amended). 1,355,304 share
options were exercised during the thirteen-month period under review and the Company issued 1,355,304 new
shares accordingly. The proceeds received amounted to approximately US$7 million. A summary of the terms
of the SO Scheme is set out in the Remuneration Report and further details of the SO Scheme are set out in the
Remuneration Report and note 39 to the financial statements.

ANNUAL REPORT 2018 | 097
OV
ER
VIE
WF
INA
NC
IAL
AN
D O
PE
RA
TIN
G R
EV
IEW
CO
RP
OR
AT
E G
OV
ER
NA
NC
EF
INA
NC
IAL
STA
TE
ME
NT
SA
DD
ITIO
NA
L IN
FO
RM
AT
ION
ESPPDuring the thirteen-month period ended 31 December 2018, 1,409,739 restricted stock purchase units were
awarded by the Company and 841,108 matching restricted stock purchase units were vested under the ESPP
adopted by the Company on 25 July 2011 (as amended). No new shares have been issued pursuant to the ESPP
since its adoption. Details of the plan are set out in the Remuneration Report and note 39 to the financial statements.
ASPPThe Company adopted the ASPP on 23 February 2012 (ASPP Adoption Date). Under the ASPP, certain agents
and agency leaders of the Group were selected to participate in the plan. Those agents selected for participation
may elect to purchase the Company’s shares and, after having been in the plan for a period of three years, receive
one matching share for each two shares purchased through the award of matching restricted stock subscription
units (RSSUs). Each eligible agent’s participation level is capped at a maximum purchase in any plan year of
US$15,000. Upon vesting of the matching RSSUs, those agents who remain as agents of the Group will receive
one matching share for each RSSU which he or she holds. The aggregate number of shares which can be issued
by the Company under the ASPP during the 10-year period shall not exceed 2.5 per cent of the number of shares
in issue on the ASPP Adoption Date.
During the thirteen-month period ended 31 December 2018, 1,439,468 matching RSSUs were awarded, 1,167,021
matching RSSUs were vested, and 1,167,021 new shares (Awarded Shares) were issued for RSSUs vested pursuant
to the ASPP. The Awarded Shares were issued at the subscription price of US$1.00 each to Computershare Hong
Kong Trustees Limited (being the plan trustee) to hold the same on trust for certain eligible agents upon vesting
of their matching RSSUs. The closing price of the Company’s shares on 27 April 2018 (being the date on which
the aforesaid matching RSSUs were vested) was HK$69.00. The proceeds received amounted to approximately
US$1.17 million which had been used to fund the administration expenses of the ASPP. From the ASPP Adoption
Date and up to 31 December 2018, a cumulative total of 4,173,047 new shares were issued under the ASPP,
representing approximately 0.035 per cent of the shares in issue as at the ASPP Adoption Date.
NON-EXEMPT CONNECTED TRANSACTIONS
During the thirteen-month period ended 31 December 2018, the Group had not entered into any connected
transactions which are not exempt from the annual reporting requirement under Chapter 14A of the Listing Rules.
RELATED PARTY TRANSACTIONS
Details of the related party transactions undertaken by the Group during the thirteen-month period ended
31 December 2018 in the ordinary course of business are set out in note 41 to the financial statements. Such
related party transactions are all exempt connected transactions under Chapter 14A of the Listing Rules.

| AIA GROUP LIMITED098
CORPORATE GOVERNANCEREPORT OF THE DIRECTORS
PURCHASE, SALE OR REDEMPTION OF THE COMPANY’S LISTED SECURITIES
Save for the purchase of 1,409,735 shares of the Company under the ESPP at a total consideration of approximately
US$12 million, neither the Company nor any of its subsidiaries purchased, sold or redeemed any of the Company’s
listed securities during the thirteen-month period ended 31 December 2018. These purchases were made by
the trustees of the relevant scheme/plan on the Hong Kong Stock Exchange. These shares are held on trust for
participants of the relevant scheme/plan and therefore were not cancelled. Please refer to note 39 to the financial
statements for details.
PUBLIC FLOAT
Based on information that is publicly available to the Company and within the knowledge of the Directors, the
Company has maintained the amount of public float as approved by the Hong Kong Stock Exchange and permitted
under the Listing Rules as at the date of this report.
AUDITOR
PricewaterhouseCoopers was re-appointed auditor of the Company in 2018.
PricewaterhouseCoopers will retire and, being eligible, offer itself for re-appointment at the AGM. A resolution for
the re-appointment of PricewaterhouseCoopers as auditor of the Company will be proposed at the AGM.
By Order of the Board
Edmund Sze-Wing Tse
Independent Non-executive Chairman
15 March 2019

ANNUAL REPORT 2018 | 099
OV
ER
VIE
WF
INA
NC
IAL
AN
D O
PE
RA
TIN
G R
EV
IEW
CO
RP
OR
AT
E G
OV
ER
NA
NC
EF
INA
NC
IAL
STA
TE
ME
NT
SA
DD
ITIO
NA
L IN
FO
RM
AT
ION
CORPORATE GOVERNANCE REPORT
CORE PRINCIPLES
The Board believes that strong corporate governance is essential both to the delivery of sustainable value and to
maintaining a culture of business integrity, which in turn supports investor confidence. The Board is ultimately
responsible for the performance of the Group, including the consistent achievement of business plans and
compliance with statutory as well as corporate obligations. The Board is also responsible for the development
and implementation of the Group’s corporate governance practices. This Corporate Governance Report explains
the Company’s corporate governance principles and practices, including how the Board manages the business to
deliver long-term shareholder value and to promote the development of the Group.
As a company listed on the Main Board of the Hong Kong Stock Exchange, the Company is committed to high
standards of corporate governance and sees the maintenance of good corporate governance practices as essential
to its sustainable growth. It is vital that Board members, in aggregate, have the requisite skills and expertise
and are supported by a structure that enables appropriate delegation between the Board, its committees and
management, whilst ensuring that the Board retains overall control. To promote effective governance across all
of our operations, the Board has approved a governance framework, which maps out internal approval processes
including those matters that may be delegated.
In this Corporate Governance Report, the Board seeks to set out the Company’s corporate governance structure
and policies, inform shareholders of the corporate governance undertakings of the Company and demonstrate to
shareholders the value of such practices.
Throughout the thirteen-month period ended 31 December 2018, the Company complied with all applicable code
provisions set out in the Corporate Governance Code.
BOARD OF DIRECTORS
ROLES AND RESPONSIBILITIES The Board is accountable to shareholders for the affairs of the Company. It meets these obligations by ensuring
the maintenance of high standards of governance in all aspects of the Company’s business, setting the strategic
direction for the Group and maintaining appropriate levels of review, challenge and guidance in its relationship
with Group management. It is also the ultimate decision-making body for all matters considered material to the
Group and is responsible for ensuring that, as a collective body, Board members have the appropriate skills,
knowledge and experience to perform their roles effectively.

| AIA GROUP LIMITED100
CORPORATE GOVERNANCECORPORATE GOVERNANCE REPORT
In these matters, the Board provides leadership to management in respect of operational issues through the Group
Chief Executive, who is authorised to act on behalf of the Board in the operational management of the Company.
Any responsibilities not so delegated by the Board to the Group Chief Executive remain the responsibility of
the Board.
The Board has also adopted and/or updated various policies as recommended by the Audit Committee and the
Risk Committee for better corporate governance.
During the thirteen-month period under review, the Board reviewed the Company’s compliance with the Corporate
Governance Code, including the necessary disclosures in its reports to shareholders.
The Board discharges the following responsibilities either by itself or through delegation to the Audit Committee,
the Nomination Committee, the Remuneration Committee and the Risk Committee:
(a) the development and review of the Company’s policies and practices on corporate governance;
(b) the review and monitoring of the training and continuous professional development of Directors and senior
management;
(c) the review and monitoring of the Company’s policies and practices on compliance with legal and regulatory
requirements;
(d) the development, review and monitoring of the Code of Conduct applicable to all officers and employees of the
Group; and
(e) the review of the Company’s compliance with the Corporate Governance Code and disclosure in this Corporate
Governance Report.
The Company has also adopted its own Directors’ and Chief Executives’ Dealing Policy (Dealing Policy) on terms
no less exacting than those set out in the Model Code in respect of dealings by the Directors in the securities of the
Company. All of the Directors confirmed, following specific enquiry by the Company, that they have complied with
the required standards set out in the Model Code and the Dealing Policy throughout the thirteen-month period
ended 31 December 2018.
BOARD EVALUATIONThe Board undertakes annually a formal evaluation of its own performance and that of its committees and individual
Directors to ensure the Board and its committees continue to perform effectively. The evaluation is conducted
either by way of internal assessment or through independent external consultants. A tailored questionnaire is
used to collect views and comments from Board members. Findings are reviewed and considered by the Board to
formulate appropriate follow-up actions.

ANNUAL REPORT 2018 | 101
OV
ER
VIE
WF
INA
NC
IAL
AN
D O
PE
RA
TIN
G R
EV
IEW
CO
RP
OR
AT
E G
OV
ER
NA
NC
EF
INA
NC
IAL
STA
TE
ME
NT
SA
DD
ITIO
NA
L IN
FO
RM
AT
ION
BOARD COMPOSITIONAs of 31 December 2018 and up to the date of this Corporate Governance Report, the Board consists of eleven
members, comprising one Executive Director and ten Independent Non-executive Directors. All Directors are
expressly identified by reference to such categories in all corporate communications that disclose their names. The
composition of the Board is well balanced with each Director having sound board level experience and expertise
relevant to the business operations and development of the Group. The Board is comprised of members with
extensive business, financial, government, regulatory and policy experience from a variety of backgrounds. There
is diversity of nationality, ethnicity, educational background, functional expertise, gender, age and experience.
Biographies of the Directors are set out on pages 78 to 83 of this Annual Report.
BOARD INDEPENDENCEOver 90 per cent (10 out of 11) of the Board are Independent Non-executive Directors. Save as disclosed below
in respect of Mr. Tse, each of the Independent Non-executive Directors of the Company meets the independence
guidelines set out in Rule 3.13 of the Listing Rules and has provided to the Company the requisite annual
confirmation as to his or her independence. Mr. Tse, save for being currently a director of AIA Foundation (a
subsidiary of the Company) and previously a Non-executive Director of the Company from 27 September 2010
to 22 March 2017 until his re-designation as an Independent Non-executive Director, has met the independence
guidelines set out in Rule 3.13 of the Listing Rules. The Company has satisfied itself that Mr. Tse is independent
pursuant to Rule 3.13 of the Listing Rules on the basis that since his appointment as a Non-executive Director of
the Company on 27 September 2010, Mr. Tse has not held any executive or management role or function in the
Company or any of its subsidiaries, and at no time during that period has he been employed by the Company or any
of its subsidiaries. He has not taken part in the day-to-day management of the Company or its subsidiaries beyond
his attendance at and participation in board and committee meetings of the Group.
Save as disclosed herein, none of the Independent Non-executive Directors has any business with or significant
financial interests in the Company or its subsidiaries and therefore all the Independent Non-executive Directors
continue to be considered by the Company to be independent.
BOARD PROCESSBoard meetings are held at least four times a year to determine overall strategies, receive management updates,
approve business plans as well as interim and annual results, and to consider other significant matters. At these
meetings, senior management also provides regular updates to the Board with respect to the business activities
and development of the Group, together with regulatory and policy updates.
Directors are empowered under the relevant terms of reference to request further information from management
whenever they think fit.
During the thirteen-month period under review, there were seven scheduled Board meetings, all of which were
convened in accordance with the Articles of Association of the Company and attended by the Directors either in
person or through electronic means of communication.

| AIA GROUP LIMITED102
CORPORATE GOVERNANCECORPORATE GOVERNANCE REPORT
The attendance of individual Directors at the Board meetings, committees’ meetings and the 2018 annual general
meeting of the Company (2018 AGM) held during the thirteen-month period under review are as follows:
No. of Meetings Attended / No. of Meetings Held
Name of Director BoardAudit
CommitteeNomination Committee
Remuneration Committee
Risk Committee 2018 AGM
Independent Non-executive Chairman and Independent Non-executive Director
Mr. Edmund Sze-Wing Tse 7/7 – 1/1 4/4 4/4 1/1
Executive Director, Group Chief Executive and President
Mr. Ng Keng Hooi 7/7 – – – 4/4 1/1
Independent Non-executive Directors
Mr. Jack Chak-Kwong So 3/7 3/4 1/1 4/4 – 1/1
Mr. Chung-Kong Chow 6/7 – 1/1 – 4/4 1/1
Mr. John Barrie Harrison 7/7 4/4 1/1 – 4/4 1/1
Mr. George Yong-Boon Yeo 6/7 4/4 1/1 3/4 – 1/1
Mr. Mohamed Azman Yahya 7/7 – 1/1 4/4 – 1/1
Professor Lawrence Juen-Yee Lau 7/7 – 1/1 – 4/4 1/1
Ms. Swee-Lian Teo 7/7 – 1/1 – 4/4 1/1
Dr. Narongchai Akrasanee 7/7 4/4 1/1 – – 1/1
Mr. Cesar Velasquez Purisima 6/7 – 1/1 – – 1/1
Minutes of the meetings of and circular resolutions passed by the Board and all committees are kept by the
Company Secretary. These minutes and resolutions are open for inspection on reasonable notice by any Director.
CHAIRMAN AND GROUP CHIEF EXECUTIVEMr. Edmund Sze-Wing Tse, Independent Non-executive Chairman of the Company, plays a critical role of leading
the Board in fulfilling its responsibilities. With the support of the Group Chief Executive and President and senior
management, Mr. Tse seeks to ensure that all Directors are properly briefed on issues arising at Board meetings
and that they receive adequate and reliable information in a timely manner. He is also responsible for making sure
that good corporate governance practices and procedures are followed.
Mr. Ng Keng Hooi, Group Chief Executive and President of the Company, reports to the Board and is responsible
for the overall leadership, strategic and executive management and profit performance of the Group, including
all operations and administration. Mr. Ng attends Board meetings as the sole Executive Director and, in his
capacity as Group Chief Executive and President, ensures that the Board is updated at least monthly in respect of
material aspects of the Company’s performance. Mr. Ng discharges his responsibilities within the framework of
the Company’s policies, reserved powers and routine reporting requirements and is advised and assisted by the
senior management of the Group.

ANNUAL REPORT 2018 | 103
OV
ER
VIE
WF
INA
NC
IAL
AN
D O
PE
RA
TIN
G R
EV
IEW
CO
RP
OR
AT
E G
OV
ER
NA
NC
EF
INA
NC
IAL
STA
TE
ME
NT
SA
DD
ITIO
NA
L IN
FO
RM
AT
ION
The segregation ensures a clear distinction between the Chairman’s responsibility to manage the Board and the
Group Chief Executive and President’s responsibility to manage the Group’s business.
The roles and responsibilities of the Board, the Chairman of the Board and the Group Chief Executive are set out in
the Board Charter of the Company, which is available on the Company’s website at www.aia.com.
APPOINTMENT OF DIRECTORSThe Company uses a formal and transparent procedure for the appointment of new Directors. The Board receives
recommendations for the appointment of new Directors from the Nomination Committee, which considers the
background of the proposed new Directors. The Board then deliberates over such recommendations prior to
approval. To promote greater transparency in this respect, the Directors’ Nomination Policy was adopted by the
Board on 14 March 2019. A summary of the Directors’ Nomination Policy is set out in the sub-section headed
“Nomination Committee” of “Committees of the Board” section in this report.
All Directors (including Non-executive Directors) are subject to retirement by rotation once every three years and
are subject to re-election at the general meetings of the Company in accordance with the Articles of Association
of the Company and the Corporate Governance Code.
INDUCTION AND ONGOING DEVELOPMENTThe Company provides each Director with personalised induction, training and development. On appointment,
each Director receives a comprehensive and tailored induction covering, amongst other things, the role of the
Board and its key committees, group structure, governance structure and the duties and responsibilities of a
director under applicable laws and regulations.
Directors receive detailed briefings on the Group’s principal businesses, the markets in which it operates and the
overall competitive environment. Other areas addressed include legal and compliance issues affecting directors
of financial services companies, the Group’s governance arrangements, the principal basis of accounting for
the Group’s results, the internal audit and risk management functions, its investor relations programme and
remuneration policies. The Directors are continually updated on the Group’s business and the latest developments
to the Listing Rules and other applicable statutory requirements to ensure compliance and continuous good
corporate governance practice.
During the thirteen-month period under review, the Company organised a Board Strategy Day and provided a
number of briefings to the Directors to update them on the implementation of the Group’s strategies to capture
future business opportunities and the latest developments in the Group’s principal businesses and major products.
In December 2018, the Board visited Ho Chi Minh City, Vietnam, where Directors had an in-depth review of the
Group’s local operations. The visit also provided an opportunity for the Directors to gain new insights into the
insurance sector in Vietnam and its prospects for continued growth.

| AIA GROUP LIMITED104
CORPORATE GOVERNANCECORPORATE GOVERNANCE REPORT
All Directors are encouraged to participate in continuous professional development to extend and refresh their
knowledge and skills, and are required to provide their training records to the Company. The training received by
the Directors during the thirteen-month period under review is summarised as follows:
Name of Director
Types of Training
Reading or attending briefings / seminars / conferences
relevant to regulatory and governance updates
Attending corporate events / Board visits / executive
briefings relevant to the Group’s business
Independent Non-executive Chairman and Independent Non-executive Director
Mr. Edmund Sze-Wing Tse √ √
Executive Director, Group Chief Executive and President
Mr. Ng Keng Hooi √ √
Independent Non-executive Directors
Mr. Jack Chak-Kwong So √ √
Mr. Chung-Kong Chow √ √
Mr. John Barrie Harrison √ √
Mr. George Yong-Boon Yeo √ √
Mr. Mohamed Azman Yahya √ √
Professor Lawrence Juen-Yee Lau √ √
Ms. Swee-Lian Teo √ √
Dr. Narongchai Akrasanee √ √
Mr. Cesar Velasquez Purisima √ √
COMMITTEES OF THE BOARD
The Company’s corporate governance is implemented through a structured hierarchy, which includes the
Board and four committees established by the Board, namely, the Audit Committee, the Nomination Committee,
the Remuneration Committee and the Risk Committee. The memberships and terms of reference of all Board
committees are available on the websites of both the Hong Kong Stock Exchange and the Company. In addition
to the four Board committees, a number of management committees have been established including, among
others, an Executive Committee, the Group Operational Risk Committee and the Group Financial Risk Committee.
AUDIT COMMITTEEThe Audit Committee consists of four members, all of whom are Independent Non-executive Directors. They are Mr.
Harrison, who serves as chairman of the Audit Committee, Mr. So, Mr. Yeo and Dr. Narongchai. The duties performed
by the Audit Committee during the thirteen-month period under review included overseeing the Group’s financial
reporting system, reviewing risk management and internal control systems and review of change of financial
year-end date; monitoring the integrity of the preparation of the Company’s financial information, including
quarterly business highlights and interim and annual results of the Group; reviewing the Group’s financial and
accounting policies and practices as well as its whistle-blowing arrangements; and monitoring the adequacy
of resources for and effectiveness of the internal audit function. Details of how the Audit Committee reviews
the effectiveness of the risk management and internal control systems are set out in the Risk Management and
Internal Control section of this report.

ANNUAL REPORT 2018 | 105
OV
ER
VIE
WF
INA
NC
IAL
AN
D O
PE
RA
TIN
G R
EV
IEW
CO
RP
OR
AT
E G
OV
ER
NA
NC
EF
INA
NC
IAL
STA
TE
ME
NT
SA
DD
ITIO
NA
L IN
FO
RM
AT
ION
The Audit Committee also provided oversight for and management of the relationship with the Group’s external
auditor, including reviewing and monitoring the external auditor’s independence and objectivity, and the
effectiveness of the audit process in accordance with applicable standards.
The Audit Committee held four meetings during the thirteen-month period ended 31 December 2018. The
attendance records of the Audit Committee members are set out on page 102 of this Annual Report.
NOMINATION COMMITTEEThe Nomination Committee consists of ten members, including the Independent Non-executive Chairman, Mr. Tse,
who serves as chairman of the Nomination Committee, and the remaining nine Independent Non-executive
Directors, Mr. So, Mr. Chow, Mr. Harrison, Mr. Yeo, Mr. Yahya, Professor Lau, Ms. Teo, Dr. Narongchai and Mr. Purisima.
The duties performed by the Nomination Committee during the thirteen-month period under review included
reviewing and making recommendations to the Board on the structure, size and composition of the Board, including
the skills, knowledge, experience and diversity of background and experience of its members, overseeing the
identification and assessment of potential candidates for directorship, providing oversight and direction in respect
of the succession planning for directors and determining the composition of the Board committees.
To promote greater transparency on the Nomination Committee’s processes and criteria for selecting and making
recommendation to the Board on the appointment, election or re-election of Directors, the Directors’ Nomination
Policy was adopted by the Board on 14 March 2019 upon the recommendation of the Nomination Committee.
A summary of the Directors’ Nomination Policy is set out below:
• In assessing the suitability of a candidate proposed for appointment, election or re-election as a Director, the
Nomination Committee shall consider the candidate on the basis of the selection criteria set out in the Directors’
Nomination Policy, which includes, amongst other things, whether his/her skills, knowledge, experience and
background can complement and enhance those of the existing Board members with due regards to the
benefits of diversity perspectives set out in the Board Diversity Policy; his/her character, reputation, integrity
and standard of competence; and the ability to devote sufficient time to discharge his/her duties as a Director.
For candidate proposed for nomination as an Independent Non-executive Director, the satisfaction of the
independence requirement under Rule 3.13 of the Listing Rules is also required.
• For appointment or election of a new Director, the Nomination Committee shall take the lead in identifying
candidates suitably qualified to become a Director. It may consider referrals from existing Director, using open
advertising or the services of external advisers to facilitate the search based on the selection criteria set out
in the Directors’ Nomination Policy. Shareholders may also propose a person for election as a Director of the
Company at a general meeting, relevant procedures of which are set out on the website of the Company. The
Nomination Committee shall evaluate the suitability of a candidate through interviews, background checks,
third party reference checks, and/or any process as it deems necessary and appropriate.
• For re-election of a retiring Director, the Nomination Committee will review the overall past contribution of the
retiring Director to the Company, and determine whether he/she continues to meet the selection criteria set
out in the Directors’ Nomination Policy.
These processes aim to ensure that every Director has the requisite character, experience and integrity, and that
he/she is able to demonstrate a standard of competence which commensurate with his/her position as a Director.

| AIA GROUP LIMITED106
CORPORATE GOVERNANCECORPORATE GOVERNANCE REPORT
Furthermore, the Board Diversity Policy adopted by the Board in 2013, which describes the Company’s approach
to ensuring adequate diversity, a summary of which is set out below:
• Consideration and selection of candidates for appointment to the Board will be based on merit which
shall include a review of any candidate’s integrity, experience, educational background, industry or related
experience and more general experience;
• Within that overriding emphasis on merit, the Nomination Committee shall seek to address Board vacancies
by actively considering candidates that bring a diversity of background and opinion from amongst those
candidates with the appropriate background and industry or related expertise and experience. The Nomination
Committee’s considerations shall include achieving an appropriate level of diversity having regard to factors
such as race, gender, age, nationality, cultural and educational background;
• The Nomination Committee will (a) in reviewing the Board composition, consider the benefits of all aspects
of diversity including, but not limited to, those described above, in order to maintain an appropriate range and
balance of skills, experience, knowledge and character on the Board; and (b) as part of the performance evaluation
of the Board, consider the balance of skills, experience, knowledge and independence of the Board; and
• As part of the Nomination Committee’s annual review of the structure, size and composition of the Board, the
Nomination Committee will expressly consider and include commentary to the Board on the subject of the
Board’s diversity.
The Nomination Committee held one meeting during the thirteen-month period ended 31 December 2018. The
attendance records of the Nomination Committee members are set out on page 102 of this Annual Report.
REMUNERATION COMMITTEEThe Remuneration Committee consists of four members, all of whom are Independent Non-executive Directors.
They are Mr. So, who serves as chairman of the Remuneration Committee, Mr. Yeo, Mr. Yahya and Mr. Tse. The
duties of the Remuneration Committee are to make recommendations to the Board on the remuneration policy
covering the Directors and senior management of the Group and to review and approve remuneration offered to
the Executive Director and senior management of the Group.
The Remuneration Committee held four meetings during the thirteen-month period ended 31 December 2018.
The attendance records of the Remuneration Committee members are set out on page 102 of this Annual Report.
Details of the key activities performed by the Remuneration Committee during the thirteen-month period under
review have been set out in the Remuneration Report, which forms part of this Corporate Governance Report.
RISK COMMITTEEThe Risk Committee consists of six members, five of whom are Independent Non-executive Directors, including
Mr. Chow, who serves as chairman of the Risk Committee, Mr. Harrison, Professor Lau, Ms. Teo, Mr. Tse and
Mr. Ng, the sole Executive Director. The duties performed by the Risk Committee during the thirteen-month period
under review included providing advice to the Board on the risk profile and risk management strategy of the
Group; considering and reviewing disclosures in interim and annual reports, risk management-related policies
and guidelines, statutory solvency positions, risk appetite and metrics; overseeing the risk management and
compliance framework; reviewing the risk management and internal control systems; endorsing the Company’s
risk governance structure; and reviewing major risks. Details of how the Risk Committee reviews the effectiveness
of the risk management and internal control systems are set out in the Risk Management and Internal Control
section of this report.
The Risk Committee held four meetings during the thirteen-month period ended 31 December 2018. The
attendance records of the Risk Committee members are set out on page 102 of this Annual Report.

ANNUAL REPORT 2018 | 107
OV
ER
VIE
WF
INA
NC
IAL
AN
D O
PE
RA
TIN
G R
EV
IEW
CO
RP
OR
AT
E G
OV
ER
NA
NC
EF
INA
NC
IAL
STA
TE
ME
NT
SA
DD
ITIO
NA
L IN
FO
RM
AT
ION
EXTERNAL AUDITOR
The external auditor of the Company is PricewaterhouseCoopers. The Audit Committee is responsible for making
recommendations to the Board on the external auditor’s appointment, re-appointment and removal, which are
subject to approval by the Board and by the shareholders at a general meeting of the Company. In assessing the
external auditor, the Audit Committee will take into account relevant experience, performance, objectivity and
independence of the external auditor. The Board has adopted policies on nomination and appointment of and
services performed by the external auditor to enhance related governance practices.
The Audit Committee also reviews the non-audit services provided by the external auditor and its remuneration
on a regular basis. For the thirteen-month period ended 31 December 2018, the total estimated remuneration
payable by the Group to PricewaterhouseCoopers was US$23.0 million (for the twelve-month period ended
30 November 2017: US$20.0 million), an analysis of which is set out below:
US$ millions 2018 2017
Audit services(Note) 16.7 16.0
Non-audit services, including:
Audit-related services(Note) 2.0 2.3
Tax services 1.7 0.9
Other services 2.6 0.8
Total 23.0 20.0
Note:Expenses for audit services include the audit of the Supplementary Embedded Value Information which was reported as part of audit-related services in prior period. The comparative information has been adjusted to conform to current period presentation.
In addition to those fees disclosed above, audit fees of US$0.8 million for the thirteen-month period ended
31 December 2018 (for the twelve-month period ended 30 November 2017: US$0.8 million) were payable to
PricewaterhouseCoopers by funds for which the Group is the investment adviser, manager or administrator.
ACCOUNTABILITY AND AUDIT
FINANCIAL REPORTINGThe annual results of the Company and other financial information were published in accordance with the
requirements of the Listing Rules and other applicable regulations and industry best practice. When preparing the
Company’s financial reports, the Board endeavours to present this information in a comprehensible, informative
and user-friendly manner.
The Directors acknowledge their responsibility for preparing the Company’s consolidated financial statements
and ensuring that the preparation of the Company’s consolidated financial statements is in accordance with the
relevant requirements and applicable standards.
The statement of the Company’s auditor concerning its reporting responsibilities on the Company’s consolidated
financial statements is set out in the Independent Auditor’s Report on pages 129 to 135 of this Annual Report.
RISK MANAGEMENT AND INTERNAL CONTROLThe Board, assisted by its committees, is responsible for overseeing the Group’s risk management and internal
control systems on an ongoing basis. The Board reviews the effectiveness of risk management and internal control
systems on an annual basis.

| AIA GROUP LIMITED108
CORPORATE GOVERNANCECORPORATE GOVERNANCE REPORT
The Group’s RMF does not seek to eliminate all risks but rather to identify, understand and manage them within
acceptable limits in order to support the sustainability of the business and the creation of long-term value, and
can only provide reasonable and not absolute assurance against material misstatement or loss. The main features
and other information on the RMF and the process used to identify, evaluate and manage significant risks are set
out in the Risk Management section of this Annual Report.
The Company has an internal audit function (Internal Audit). The key features of the Company’s internal control
system include independent reviews and testing of internal controls, taking a risk-based approach and developing
an annual audit plan presented to the Audit Committee. Reports of significant audit findings are prepared and
communicated to management and the Audit Committee and where control weaknesses or defects are identified,
recommendations are provided to resolve them. This includes issues formally identified from internal audits,
forensic investigations, regulatory reports and special projects. Management is responsible for the design,
implementation and evaluation of the internal control system, including ongoing mitigation, across the business
and processes.
The Board has, through the Risk Committee and Audit Committee, reviewed the adequacy and effectiveness
of the Group’s risk management and internal control systems (covering all material controls such as financial,
operational and compliance controls), including:
• the adequacy of resources, staff qualifications and experience, training programmes and the budget of the
Group’s accounting, internal audit and financial reporting functions;
• areas of risk identified by management as well as the quality and scope of management’s ongoing monitoring
of risks and the risk management system;
• the changes in the nature and extent of significant risks since the previous review and the Group’s ability to
respond to changes in the external environment and its business;
• the quality and scope of the internal control system implemented by management and the work and
effectiveness of Internal Audit as well as any significant risks reported by Internal Audit;
• the extent and frequency of communication of monitoring results to the Board and its committees, to enable
the assessment of the effectiveness of the Group’s risk management and internal control systems;
• the incidence of any significant control failings or weaknesses that have been identified during the year and
the extent to which they have resulted in a material impact on the Group’s financial performance or condition;
• the effectiveness of the Group’s processes in relation to financial reporting and regulatory compliance;
• the scope of work performed by both internal and external auditors and any significant issues arising from
internal and external audit reports; and
• the results of management’s control self-assessment exercises.
The annual review of the Group’s risk management and internal control systems was supported by an internal
certification process performed by management (at both the Company’s and subsidiaries’ levels), the Risk &
Compliance function and Internal Audit of the Company.
Management has confirmed to the Board that the Group’s risk management and internal control systems are
adequate and effective. Based on the review result and management’s confirmation, the Board considered the
Group’s risk management and internal control systems to be adequate and effective for the thirteen-month period
ended 31 December 2018.

ANNUAL REPORT 2018 | 109
OV
ER
VIE
WF
INA
NC
IAL
AN
D O
PE
RA
TIN
G R
EV
IEW
CO
RP
OR
AT
E G
OV
ER
NA
NC
EF
INA
NC
IAL
STA
TE
ME
NT
SA
DD
ITIO
NA
L IN
FO
RM
AT
ION
INSIDE INFORMATIONThe Company has implemented proper procedures and internal controls for the handling and dissemination of
inside information:
• The Company has established a policy on the disclosure of inside information to ensure that all current and
prospective investors of the Company, market participants and the public are provided with appropriate
information relating to the Group in a timely and simultaneous manner. The policy has been communicated to
all relevant staff and related training has also been provided to them; and
• A written communications protocol has also been established to implement a control process within the
Group for the management of communications with various internal and external stakeholders. Such protocol
identifies a list of spokespersons who are authorised to provide information about the Group to the relevant
stakeholders. The Company’s Code of Conduct (which was updated in the period under review) further contains
a strict prohibition on the unauthorised use of confidential or non-public information.
COMPANY SECRETARY
All the Directors have access to the advice and services of the Company Secretary at any time in respect of
their duties and the effective operation of the Board and Board committees. The Company Secretary advises the
Board on all corporate governance matters; facilitates the induction and professional development of Directors;
and ensures good information flows and communications within the Board and its committees, and between
management and the Non-executive Directors. The Company Secretary also plays an important role in ensuring
that Board and Board committee policies and procedures are followed and the Board’s obligations to shareholders
pursuant to the Listing Rules are discharged. During the thirteen-month period under review, the Company
Secretary undertook at least 15 hours of relevant continuing professional education.
ENGAGEMENT WITH SHAREHOLDERS
The Board recognises the importance of maintaining an ongoing dialogue with the Company’s shareholders and
does so through general meetings, press releases, announcements and corporate communications such as the
annual report, interim report and circulars. The Board is committed to the timely disclosure of information. The
latest information regarding the Group’s activities, announcements, results presentations, webcasts and corporate
communications is made available on the Company’s website at www.aia.com in a timely manner. The financial
calendar highlighting the key dates for shareholders is set out on page 304 of this Annual Report.
The Investor Relations function oversees the Company’s engagement with investors. The Company’s institutional
shareholder base is geographically diversified and the Company is also extensively covered by research analysts
from a wide range of broker houses. An active and open dialogue with institutional investors is maintained through
regular investor interactions, including meetings, investment conferences and roadshows. Investor feedback and
analysts’ reports on the Company are circulated to the Board and the Executive Committee on a regular and
systematic basis to promote an understanding of external views on the Company’s performance.
The Board has adopted a Shareholders’ Communication Policy and such policy will be reviewed on a regular
basis to ensure its effectiveness. The Board welcomes views, questions and concerns from shareholders and
other stakeholders. Shareholders and other stakeholders may send their enquiries and concerns to the Board. The
contact details are set out on page 305 of this Annual Report.

| AIA GROUP LIMITED110
CORPORATE GOVERNANCECORPORATE GOVERNANCE REPORT
2018 ANNUAL GENERAL MEETINGThe most recent general meeting of the Company was the 2018 AGM which was held at the Grand Ballroom, 2/F,
New World Millennium Hong Kong Hotel, 72 Mody Road, Tsim Sha Tsui East, Kowloon, Hong Kong on 18 May 2018.
The Chairman and all other members of the Board at that time, together with the Group’s senior management
and external auditor, attended the 2018 AGM. The poll voting results are available on the websites of both the
Company and the Hong Kong Stock Exchange. The matters resolved at the 2018 AGM are summarised below:
• Receipt of the audited consolidated financial statements of the Company, the Report of the Directors and the
Independent Auditor’s Report for the year ended 30 November 2017;
• Declaration of a final dividend of 74.38 Hong Kong cents per share for the year ended 30 November 2017;
• Re-election, by separate ordinary resolutions, of Mr. Ng as Executive Director of the Company and Mr. Purisima,
Professor Lau, Mr. Chow and Mr. Harrison as Independent Non-executive Directors of the Company;
• Re-appointment of PricewaterhouseCoopers as auditor of the Company until the conclusion of the next annual
general meeting and authorising the Board to fix its remuneration;
• General mandate to Directors to cause the Company to issue additional shares of the Company, not exceeding
10 per cent of the aggregate number of shares of the Company in issue on the date of the 2018 AGM, and the
discount for any shares to be issued not exceeding 10 per cent to the benchmarked price;
• General mandate to Directors to cause the Company to buy back shares of the Company, not exceeding 10 per
cent of the aggregate number of shares of the Company in issue on the date of the 2018 AGM; and
• General mandate to Directors to cause the Company to issue shares of the Company under the RSU Scheme,
not exceeding 2.5 per cent of the number of shares of the Company in issue on the date of the listing of the
Company’s shares on the Hong Kong Stock Exchange.
The forthcoming annual general meeting of the Company will be held on Friday, 17 May 2019. Further details will
be set out in the circular to the shareholders of the Company to be sent together with this Annual Report.
SHAREHOLDERS’ RIGHTS
GENERAL MEETINGShareholder(s) representing at least 5 per cent of the total voting rights of all the shareholders of the Company
having a right to vote at general meetings, may request to call a general meeting. If such request is made, a general
meeting must be called. Such request, either in hard copy form or in electronic form and being authenticated by
the person or persons making it, must be deposited at the registered office of the Company at 35/F, AIA Central,
No. 1 Connaught Road Central, Hong Kong or sent by email to [email protected] for the attention of the Company
Secretary. Shareholder(s) of the Company should make reference to the provisions under Sections 566 to 568 of
the Hong Kong Companies Ordinance for calling a general meeting.

ANNUAL REPORT 2018 | 111
OV
ER
VIE
WF
INA
NC
IAL
AN
D O
PE
RA
TIN
G R
EV
IEW
CO
RP
OR
AT
E G
OV
ER
NA
NC
EF
INA
NC
IAL
STA
TE
ME
NT
SA
DD
ITIO
NA
L IN
FO
RM
AT
ION
MOVING A RESOLUTION AT AN ANNUAL GENERAL MEETINGShareholder(s) of the Company may request the Company to give notice of a resolution and move such resolution
at an annual general meeting. Such notice of resolution must be given by the Company if it has received such
request from:
(a) shareholder(s) of the Company representing at least 2.5 per cent of the total voting rights of all the shareholders
of the Company who have a right to vote on the resolution at the annual general meeting to which the request
relates; or
(b) at least 50 shareholders of the Company who have a right to vote on the resolution at the annual general
meeting to which the request relates.
Such a request must identify the resolution of which notice is to be given, be either in hard copy form or in electronic
form and be authenticated by the person or persons making it, and be received by the Company not later than
six weeks before the annual general meeting to which the request relates or, if later, the time at which notice is
given of that meeting. The request must be deposited at the registered office of the Company at 35/F, AIA Central,
No. 1 Connaught Road Central, Hong Kong or sent by email to [email protected] for the attention of the Company
Secretary. Shareholder(s) of the Company should make reference to Sections 615 and 616 of the Hong Kong
Companies Ordinance for the relevant procedures to move a resolution at an annual general meeting.
PROPOSING A PERSON FOR ELECTION AS A DIRECTORShareholders can propose a person (other than a retiring Director himself/herself) for election as a Director at a
general meeting of the Company. Relevant procedures are available on the Company’s website at www.aia.com.
CONSTITUTIONAL DOCUMENTS
The Company’s Articles of Association (in both English and Chinese) is available on the websites of both the
Company and the Hong Kong Stock Exchange. During the thirteen-month period under review, there has been no
change to the Articles of Association of the Company.
By Order of the Board
Mitchell New
Company Secretary
15 March 2019

| AIA GROUP LIMITED112
CORPORATE GOVERNANCE
REMUNERATION REPORT
STATEMENT OF THE CHAIRMAN OF THE REMUNERATION COMMITTEE
It gives me great pleasure to present the Report on Remuneration for Directors and Key Management Personnel for the thirteen-month period ended 31 December 2018.
The Remuneration Committee’s work in the thirteen-month period ended 31 December 2018 focused on ensuring
the remuneration arrangements for our senior executives and employees continue to support the Group’s strategic
priorities and allow us to attract, motivate and retain high calibre talent.
Similar to prior years, the Remuneration Committee undertook a rigorous process in reviewing the Group’s
executive remuneration, taking into account market practice, our regulatory environment, AIA’s risk management
framework and the interests of our shareholders.
• In the first quarter of 2018, the Remuneration Committee reviewed and subsequently approved the
remuneration package to be provided to the Group Chief Digital Officer, a new member of the Group Executive
Committee.
• In the second half of 2018, the Remuneration Committee and the Board reviewed the financial performance
measures used in the short-term incentive plan. Following the review, the Board approved the introduction of
Underlying Free Surplus Generation, in place of Excess Embedded Value Growth, as one of the measures in
the short-term incentive plan for 2019 and future years. Adjustments to the performance measures and their
weightings will enhance our focus on capital and cash generation in support of our prudent, sustainable and
progressive shareholder dividend policy, while maintaining our emphasis on growth, earnings and quality of
in-force business.
• The Remuneration Committee also reviewed the fees for the Board Chairman and Non-executive Directors
and subsequently proposed adjustments to the Board for approval. The change in fees has taken effect from
1 January 2019. Further details of Board Chairman and Non-executive Director fees can be found on pages
126 and 127 of this report.
• Finally, the Remuneration Committee monitored the regulatory environment and corporate governance best
practices in 2018 and will continue to do so in the future.

ANNUAL REPORT 2018 | 113
OV
ER
VIE
WF
INA
NC
IAL
AN
D O
PE
RA
TIN
G R
EV
IEW
CO
RP
OR
AT
E G
OV
ER
NA
NC
EF
INA
NC
IAL
STA
TE
ME
NT
SA
DD
ITIO
NA
L IN
FO
RM
AT
ION
The overall remuneration structure for our senior executives remained unchanged in 2018 and will
continue to apply in 2019. As in prior years, a significant proportion of total remuneration awarded in 2018
is subject to multi-year performance-based vesting conditions which ensure that our executives’ interests
are closely aligned with those of our shareholders over the long term.
Overall, the Remuneration Committee believes that the Group’s current remuneration arrangements
should be maintained in 2019 and trusts that this report provides clear and detailed information regarding
our policies and practices.
Speaking for the Remuneration Committee, I would like to express our deepest appreciation to you all
for your continued trust and support in remuneration-related matters and look forward to continuing our
dialogue in the years to come.
Jack Chak-Kwong So
Chairman, Remuneration Committee
15 March 2019

| AIA GROUP LIMITED114
CORPORATE GOVERNANCEREMUNERATION REPORT
REMUNERATION GOVERNANCE
ROLE OF THE REMUNERATION COMMITTEEThe Remuneration Committee is responsible for determining the specific remuneration packages of the Group
Chief Executive and President (who is also the sole Executive Director) and Key Management Personnel (the
members of the Group’s Executive Committee who, by the nature and accountabilities of their respective positions,
participate directly in the development, monitoring and reporting of the overall business strategies of the Group),
and making recommendations to the Board on the remuneration policy and structure to be applied for the
Chairman and Non-executive Directors.
The Remuneration Committee is also responsible for establishing formal and transparent procedures for developing
remuneration policies and structures. In making its determinations and recommendations, the Remuneration
Committee considers such factors as the responsibilities of the Group Chief Executive and President and Key
Management Personnel, the remuneration paid by comparable companies, remuneration levels within the Group
and the application of performance-based remuneration programmes.
The Remuneration Committee also oversees the design and operation of the Company’s share schemes and other
Group incentive schemes, recommending share-based employee awards for approval by the Board as well as
reviewing and, where appropriate, amending the terms of the schemes as may be required.
The Remuneration Committee is authorised by the Board to discharge its duties as outlined in its Terms of
Reference. It is also authorised to seek any remuneration information it requires from the Group Chief Executive
and President and/or Key Management Personnel and may obtain external independent professional advice
if necessary.
The full Terms of Reference of the Remuneration Committee can be accessed at www.aia.com.
MEMBERS AND MEETINGSAs at 31 December 2018, the Remuneration Committee consisted of four Independent Non-executive Directors,
being Mr. Jack Chak-Kwong So, who is the Chairman of the Remuneration Committee, Mr. George Yong-Boon Yeo,
Mr. Mohamed Azman Yahya and Mr. Edmund Sze-Wing Tse.
The Remuneration Committee held four meetings during the thirteen-month period ended 31 December 2018.
The attendance records of the Remuneration Committee members are set out on page 102 of this Annual Report.

ANNUAL REPORT 2018 | 115
OV
ER
VIE
WF
INA
NC
IAL
AN
D O
PE
RA
TIN
G R
EV
IEW
CO
RP
OR
AT
E G
OV
ER
NA
NC
EF
INA
NC
IAL
STA
TE
ME
NT
SA
DD
ITIO
NA
L IN
FO
RM
AT
ION
ACTIVITIES OF THE REMUNERATION COMMITTEEThe Remuneration Committee has performed the following major activities during the thirteen-month ended
31 December 2018.
Area Summary of activities
Remuneration decisions for the Group Chief Executive and President and Key Management Personnel
• Reviewed and approved the remuneration packages at the start of the year or on appointment for the Group Chief Executive and President and Key Management Personnel
• Recommended the 2018 long-term incentive award for the Group Chief Executive and President for approval by the Independent Non-executive Directors of the Board
• Reviewed the executive benchmarking results ahead of the 2018/19 annual review cycle
Design and operation of the Group’s incentive schemes
• Reviewed and approved the short-term incentive plan pay-out and the vesting of the performance based restricted share units
• Reviewed and approved the long-term incentive awards granted in 2018
• Reviewed and approved the performance measures and targets to be used in the 2019 short-term incentive plan and the 2019 long-term incentive award
Remuneration governance and disclosure
• Reviewed and approved the 2017 Remuneration Report
• Provided the Risk Committee with a summary of considerations undertaken by the Remuneration Committee in ensuring that the Group’s remuneration and benefits arrangements align with stakeholders’ interests and avoid excessive risk-taking
• Reviewed the regulatory and corporate governance environment impacting executive remuneration in Hong Kong, Asia Pacific and other markets
• Reviewed the emerging remuneration trends for AIA’s global insurance peers and for Asia Pacific and other regions
Board Chairman and Non-executive Director fees
• Reviewed Non-executive Director and Board Chairman fee benchmarking results
• Proposed adjustments to Non-executive Director and Board Chairman fees to the Board for approval

| AIA GROUP LIMITED116
CORPORATE GOVERNANCEREMUNERATION REPORT
OUR EXECUTIVE REMUNERATION POLICY
OBJECTIVES OF OUR REMUNERATION POLICYThe Company’s executive remuneration policy is based on the principle of providing an equitable, motivating and
competitive remuneration package to foster a strong performance-oriented culture within an appropriate risk
management framework.
The policy aims to ensure that rewards and incentives relate directly to the performance of individuals, the
operations and functions in which they work or for which they are responsible, and the overall performance of
the Group. The compensation and benefits arrangements designed under the policy provide incentives that are
consistent with the interests of the Company’s stakeholders and do not encourage executives to take excessive
risks that may threaten the value of the Group.

ANNUAL REPORT 2018 | 117
OV
ER
VIE
WF
INA
NC
IAL
AN
D O
PE
RA
TIN
G R
EV
IEW
CO
RP
OR
AT
E G
OV
ER
NA
NC
EF
INA
NC
IAL
STA
TE
ME
NT
SA
DD
ITIO
NA
L IN
FO
RM
AT
ION
COMPONENTS OF OUR EXECUTIVE REMUNERATION POLICYThe table below summarises the Company’s remuneration policies regarding the elements of the remuneration
structure applied to the Group Chief Executive and President and the Key Management Personnel for the
thirteen-month period ended 31 December 2018. The policies will continue to apply in 2019.
Element Purpose Basis of determination Notes on practices
Basic salary Basic salary is the fixed cash element of remuneration to recruit and retain talent
Basic salary is determined with reference to the specific roles and responsibilities of the position, internal relativities, market practice, individual experience, performance and other factors to attract and retain employees with required capabilities to achieve the Group’s business objectives
The Remuneration Committee reviews salaries annually against AIA’s global insurance peers and wider market levels
Salary increases, where applicable, typically take effect from 1 March
Short-term incentive
Short-term incentives are delivered in the form of a performance-based cash award to recognise and reward achievement of the Group’s objectives and individual contribution
Short-term incentive target and maximum opportunities are determined with reference to roles and responsibilities of the individual and market competitiveness of variable and total compensation
Pay-out of short-term incentives is based on the achievement of the Group’s financial performance targets as well as individual contribution
Long-term incentive
Long-term incentives are delivered in the form of restricted share units and share options
Both types of award are used to align the interests of executives with those of shareholders, and to reward and motivate participants who have made important contributions or are expected to play a significant role in the future
Long-term incentive grant values are determined with reference to roles and responsibilities as well as performance and potential of the individual, and also market competitiveness of variable and total compensation
A significant proportion of the packages of the Group Chief Executive and President and Key Management Personnel are provided in the form of long-term incentives awards
Long-term incentive awards are discretionary and participation is determined on an annual basis
Awards are made in restricted share units and share options to deliver a balanced mix of ownership and incentives, and generally vest after a three-year period
The restricted share units are subject to pre-defined performance requirements
Benefits and allowances
Benefits form part of the long-term employment relationship and contribute to the value of total remuneration
Allowances may be provided where necessary
The benefits programme is designed to be market competitive and fully compliant with local regulations
Allowances may be provided to align with local practices and to ensure market competitiveness
The Group Chief Executive and President and Key Management Personnel participate in retirement schemes and receive, for example, medical and life insurance
Employee share purchase plan
The employee share purchase plan provides employees with a share investment opportunity with matching offer to facilitate and encourage AIA share ownership
The plan is open to all employees who have completed probation and is subject to a maximum contribution indicated as a percentage of basic salary or the plan maximum limit
Participants receive matching shares for shares purchased subject to an investment limit approved by the Remuneration Committee
Matching shares vest after three years
Further details on the operation of our short and long-term incentives, along with the employee share purchase
plan are provided on the following pages.

| AIA GROUP LIMITED118
CORPORATE GOVERNANCEREMUNERATION REPORT
INCENTIVE AND SHARE-BASED PLANS
SHORT-TERM INCENTIVE PLAN2018 Short-term Incentive Plan 2018 short-term incentive target and maximum opportunities were determined by the Remuneration Committee
and communicated to the Group Chief Executive and President and Key Management Personnel at the beginning
of the financial period ended 31 December 2018.
2018 Performance Measures and AwardsFor 2018, performance measures for short-term incentives did not change from 2017 and were as follows:
Value of New Business (VONB)
10% WEIGHTING
30% WEIGHTING
60% WEIGHTING
Consistent with prior years, an individual’s performance contribution was also considered when determining the amounts to be paid to the Group Chief Executive and President and Key Management Personnel
Excess Embedded Value Growth (EEV Growth)
Operating Profit after Tax (OPAT)
VONB is an estimate of the economic value of one year’s sales as published by the Company
EEV Growth is the operating experience variance (current year performance against the operating assumptions for calculating embedded value or EV) in the EV operating profit
OPAT is based on the IFRS results published by the Company
Group 2018 Short-term Incentive Measures
As a result of the change in financial year-end date from 30 November to 31 December, the short-term incentive
awards in respect of the 2017 financial year, along with a payment covering the month of December 2017 were
paid in March 2018 and based on the level of achievement of the performance targets. Short-term incentive
awards in respect of the twelve-month period ended 31 December 2018 will be paid in March 2019 according to
the level of achievement of performance measures over the 12-month period ended 31 December 2018.
For the thirteen-month period ended 31 December 2018 the total value of short-term incentive awards that had
been and will be paid to Mr. Ng Keng Hooi and the Key Management Personnel is US$14,925,211.
The short-term incentive amounts for the thirteen-month period ended 31 December 2018 are included in note 40
to the financial statements as “Bonuses” for Mr. Ng Keng Hooi, and as part of the “Salaries and other short-term
employee benefits” for the Key Management Personnel.

ANNUAL REPORT 2018 | 119
OV
ER
VIE
WF
INA
NC
IAL
AN
D O
PE
RA
TIN
G R
EV
IEW
CO
RP
OR
AT
E G
OV
ER
NA
NC
EF
INA
NC
IAL
STA
TE
ME
NT
SA
DD
ITIO
NA
L IN
FO
RM
AT
ION
2019 Short-term Incentive Plan In 2018, the Remuneration Committee and the Board reviewed the operation of the Group’s short-term incentive
plan in light of the Group’s strategy, the key performance indicators that drive value for our shareholders and
market practice. The Remuneration Committee and the Board concluded that changes should be made to further
align the plan with the Group’s strategy and our shareholders’ interest, and that the following changes will be
made to the operation of the Group’s 2019 short-term incentive plan for the Group Chief Executive and President
and Key Management Personnel.
• EEV Growth will be replaced by Underlying Free Surplus Generation (UFSG) with a 15 per cent weighting.
UFSG is the free surplus generated by the business excluding the free surplus invested in new business,
investment return variances and other items.
• The weighting for OPAT will be changed from 30 per cent to 25 per cent.
For the 2019 short-term incentive plan, the weightings for VONB, OPAT and UFSG are 60 per cent, 25 per cent and
15 per cent respectively.
The adjustment to the performance measures and weightings will enhance our focus on capital and cash
generation in support of our prudent, sustainable and progressive shareholder dividend policy, while maintaining
our emphasis on growth, earnings and the quality of in-force business. Further details of the operation of the 2019
short-term incentive plan will be provided in the Company’s Annual Report 2019.
LONG-TERM INCENTIVE PLANSThe RSU Scheme and the SO Scheme were both adopted by the Company on 28 September 2010 and are effective
for a period of 10 years from the date of adoption, summaries of which are provided later in this section and in
note 39 to the financial statements. These schemes are designed to motivate and reward participants who have
not only made an important contribution to AIA’s success, but are expected to play a significant role in the future.
Awards made under these schemes are discretionary and are determined on an annual basis with reference to an
individual’s overall variable remuneration, total remuneration package competitiveness, role and responsibilities,
as well as performance and potential.
The schemes operate through the award of restricted share units and share options to deliver a balanced mix of
incentives and ownership. The awards made are subject to eligibility criteria and generally vest after a three-year
period.
As applicable to other remuneration payments, long-term incentive vesting is subject to the Remuneration
Committee’s approval. These schemes are reviewed regularly to ensure their design, process, structure and
governance work together to balance risk and incentives.
The RSU Scheme and the SO Scheme will both expire on 27 September 2020. In advance of expiry, the
Remuneration Committee will review the Group’s long-term incentive arrangements, in conjunction with the
Group’s remuneration policy, during 2019.

| AIA GROUP LIMITED120
CORPORATE GOVERNANCEREMUNERATION REPORT
RESTRICTED SHARE UNIT SCHEMEThe objectives of the RSU Scheme are to retain participants, align their interests with those of the Company’s
shareholders and reward the creation of sustainable value through the award of restricted share units to
participants.
Under the RSU Scheme, the Company may award restricted share units to employees, directors (excluding
independent non-executive directors) or officers of the Company or any of its subsidiaries.
During the thirteen-month period ended 31 December 2018, the Company awarded 11,617,538 restricted
share units under the RSU Scheme. Since the adoption of the RSU Scheme on 28 September 2010 and up to
31 December 2018, a cumulative total of 74,681,122 restricted share units vested under the RSU Scheme,
representing approximately 0.620 per cent of the shares in issue as at the Company’s listing date. No new shares
have been issued under the RSU Scheme since its adoption.
2018 RSU Performance MeasuresConsistent with prior years, vesting of the performance-based restricted share unit awards during 2018 is
contingent on the extent of achievement of three-year performance targets for the following three performance
measures:
Notes:(1) VONB and EV Equity performance considered in determining incentive awards will be based on Group VONB and Group EV Equity results as
published by the Company.
(2) TSR peer companies for the 2018 performance-based RSUs include 19 life and health or multi-line insurance companies identified within the Dow Jones Insurance Titans 30 index (DJTINN) at the start of the performance period.
(3) For the performance-based RSUs granted in 2016 and 2017, performance will be measured against all companies in DJTINN.
Value of New Business (VONB)
Equity Attributable to Shareholders of the Company on
the Embedded Value Basis (EV Equity)
Relative Total Shareholder Return (TSR)
Performance Measures for 2018 Performance-based RSUs
1/3 WEIGHTING
1/3 WEIGHTING
1/3 WEIGHTING
VONB is an estimate of the economic value of one year’s sales as published by the Company (1)
EV Equity is the total of embedded value, goodwill and other intangible assets as published by the Company. Embedded value is an estimate of the economic value of in-force life insurance business, including the net worth on the Group’s balance sheet but excluding any economic value attributable to future new business (1)
TSR is the compound annual return from the ownership of a share over a period of time measured by calculating the change in the share price and the gross value of dividends received (and reinvested) during that period. Relative TSR compares AIA’s TSR with the TSR of the peer companies (2) (3) over the performance period

ANNUAL REPORT 2018 | 121
OV
ER
VIE
WF
INA
NC
IAL
AN
D O
PE
RA
TIN
G R
EV
IEW
CO
RP
OR
AT
E G
OV
ER
NA
NC
EF
INA
NC
IAL
STA
TE
ME
NT
SA
DD
ITIO
NA
L IN
FO
RM
AT
ION
The performance-based RSUs are tested against pre-defined performance targets at the end of a three-year
performance period. Achievement of each performance measure will independently determine the vesting of
one-third of the award.
• Threshold performance levels (for TSR, 25th percentile relative performance measured against the TSR of the
peer companies) are required for restricted share units to vest.
• At target performance levels (for TSR, median relative performance measured against the TSR of the peer
companies), 50 per cent of the restricted share units will vest.
• At maximum performance levels (for TSR, 75th percentile or above relative performance measured against the
TSR of the peer companies), the full allocation of restricted share units will vest.
The 2018 restricted share unit award performance measures will be assessed over a three-year period starting
1 January 2018.
Vesting of 2015 RSU AwardsIn February 2018, after assessing the performance of the Company against the pre-determined performance
targets for the VONB, EV Equity and relative TSR measures over the three-year period from 1 December 2014 to
30 November 2017, the Remuneration Committee approved the vesting of the 2015 performance based restricted
share unit awards at 96.17 per cent of the maximum level. The 2015 performance based restricted share unit
awards vested on 12 March 2018.
The final vesting results for the 2016 performance-based restricted share unit awards to vest in March 2019 will
be disclosed in the Remuneration Report in the Company’s Annual Report 2019.
2019 RSU AwardsThe Remuneration Committee will grant performance-based restricted share units to selected participants after
the Company’s year-end financial results announcement. Details of the grant will be disclosed in the Company’s
Annual Report 2019.
Consistent with prior years, VONB, EV Equity and relative TSR targets will continue to be used to assess the
performance outcomes of the restricted share unit awards that will be granted in 2019. The three performance
measures will continue to be equally weighted and will be assessed over a three-year period starting 1 January
2019.
Similar to the 2018 performance-based restricted share units, for relative TSR assessment, the DJTINN
companies that are considered life and health or multi-line insurance companies will be selected as peers
(19 companies).

| AIA GROUP LIMITED122
CORPORATE GOVERNANCEREMUNERATION REPORT
RSU Movements During the Thirteen-month Period Ended 31 December 2018The table below summarises the movements in restricted share unit awards during the thirteen-month period
ended 31 December 2018.
Group Chief Executive and President, Key Management Personnel and other eligible employees and participants
Date of grant
(day / month /
year) (2)
Vesting date(s)
(day / month /
year) (3)
Restricted share units
outstanding as at
1 December 2017 (8)
Restricted share units
awarded during the 13-month period ended 31 December
2018
Restricted share units
vested during the 13-month period ended 31 December
2018
Restricted share units cancelled /
lapsed / reclassified
during the 13-month
period ended 31 December
2018 (8)
Restricted share units
outstanding as at
31 December 2018 (9)
Group Chief Executive and PresidentMr. Ng Keng Hooi
12/3/2015 12/3/2018 (4) 283,490 – (272,633) (10,857) –
9/3/2016 9/3/2019 (4) 320,071 – – – 320,071
10/3/2017 10/3/2020 (4) 267,659 – – – 267,659
31/7/2017 1/6/2020 (4) 213,164 – – – 213,164
15/3/2018 15/3/2021 (4) – 439,258 – – 439,258
Key Management Personnel (excluding the Group Chief Executive and President)
12/3/2015 12/3/2018 (4) 1,284,096 – (924,739) (359,357) –
1/9/2015 See note (5) 169,688 – (169,688) – –
9/3/2016 9/3/2019 (4) 1,661,968 – – (364,163) 1,297,805
1/8/2016 1/8/2019 (4) 41,249 – – – 41,249
10/3/2017 10/3/2020 (4) 1,441,875 – – (304,526) 1,137,349
31/7/2017 1/6/2020 (4) 311,947 – – – 311,947
15/3/2018 15/3/2021 (4) – 1,070,214 – – 1,070,214
12/9/2018 12/9/2021 (4) – 61,010 – – 61,010
Other eligible employees and participants (including the Retired Group Chief Executive and President) (1)
12/3/2015 12/3/2018 (4) 10,916,765 – (10,309,414) (607,351) –
1/9/2015 1/9/2018 (4) 20,316 – (19,538) (778) –
9/3/2016 9/3/2019 (4) 13,327,726 – (100,739) (1,224,764) 12,002,223
1/8/2016 1/8/2019 (4) 34,621 – – – 34,621
17/10/2016 1/8/2019 (6) 101,217 – – – 101,217
17/10/2016 See Note (7) 41,875 – (20,937) – 20,938
10/3/2017 10/3/2020 (4) 12,134,441 – (46,184) (1,192,358) 10,895,899
31/7/2017 1/6/2020 (4) 28,519 – – – 28,519
15/3/2018 15/3/2021 (4) – 9,815,954 (8,120) (480,755) 9,327,079
29/6/2018 15/3/2021 (4) – 108,956 – – 108,956
12/9/2018 15/3/2021 (4) – 122,146 – – 122,146
Notes:(1) Include restricted share units outstanding as at 1 December 2017 for the retired Group Chief Executive and President, Mr. Mark Edward Tucker.
(2) The measurement dates (i.e. the dates used to determine the value of the awards for accounting purposes) for awards made during the year ended 30 November 2015 were determined to be 12 March 2015 and 1 September 2015. The measurement dates for awards made during the year ended 30 November 2016 were determined to be 9 March 2016, 1 August 2016 and 17 October 2016. The measurement dates for awards made during the year ended 30 November 2017 were determined to be 10 March 2017 and 31 July 2017. The measurement dates for awards made during the thirteen months ended 31 December 2018 were determined to be 15 March 2018, 29 June 2018 and 12 September 2018. These measurement dates were determined in accordance with IFRS 2.
(3) The date of vesting is subject to applicable dealing restrictions.
(4) The vesting of these restricted share units is subject to the achievement of performance measures shown on pages 120 and 121 of this Report.
(5) The vesting of these restricted share units is service-based only (meaning there are no further conditions attached). Three-quarters of restricted share units vested on 1 September 2017 and one-quarter (representing all of the outstanding share units as at 1 December 2017) vested on 1 September 2018.

ANNUAL REPORT 2018 | 123
OV
ER
VIE
WF
INA
NC
IAL
AN
D O
PE
RA
TIN
G R
EV
IEW
CO
RP
OR
AT
E G
OV
ER
NA
NC
EF
INA
NC
IAL
STA
TE
ME
NT
SA
DD
ITIO
NA
L IN
FO
RM
AT
ION
(6) The vesting of these restricted share units is service-based only (meaning there are no further conditions attached). All restricted share units will vest on 1 August 2019.
(7) The vesting of these restricted share units is service-based only (meaning there are no further conditions attached). One-third of restricted share units vested on 1 August 2017, one-third (representing half of the outstanding restricted share units as at 1 December 2017) vested on 1 August 2018 and one-third (representing half of the outstanding restricted share units as at 1 December 2017) will vest on 1 August 2019.
(8) These restricted share units lapsed or were reclassified during the thirteen months ended 31 December 2018. The reclassification of restricted share units was a result of two executives who were previously categorised as “Key Management Personnel” becoming “Other eligible employees and participants” during this period. There were no cancelled restricted share units during the thirteen months ended 31 December 2018.
(9) Include restricted share units outstanding as at 31 December 2018 that, in accordance with the RSU Scheme rules, may lapse on or before the respective vesting date.
SHARE OPTION SCHEMEThe objective of the SO Scheme is to align the interests of participants with those of the Company’s shareholders
by allowing eligible participants to share in the value created for our shareholders.
Under the SO Scheme, the Company may award share options to employees, directors (excluding independent
non-executive directors) or officers of the Company or any of its subsidiaries. No amount is payable by the eligible
participants on the acceptance of a share option.
During the thirteen-month period ended 31 December 2018, the Company awarded 4,601,313 share options under
the SO Scheme to a Director and certain employees and officers of the Company and a number of its subsidiaries.
The formula for determining the exercise price of such share options is, as set out in the SO scheme rules, at least
the highest of (i) the closing price of the shares on the date of grant, (ii) the average closing price of the shares
for the five business days immediately preceding the date of grant and (iii) the nominal value of a share. Since the
adoption of the SO Scheme on 28 September 2010 and up to 31 December 2018, a cumulative total of 28,890,733
new shares were issued under the SO Scheme, representing approximately 0.240 per cent of the shares in issue
as at the Company’s listing date.
The total number of shares available for issue for all outstanding share options and share options that can be
awarded under the scheme is 272,209,267, representing approximately 2.25 per cent of the number of shares
in issue as at the date of this report. Unless shareholders’ approval is obtained in accordance with the relevant
procedural requirements under the Listing Rules, the maximum number of shares under option that may be
awarded to any eligible participant in any 12-month period up to and including a proposed date of grant is
0.25 per cent of the number of shares in issue as of the proposed date of grant.
No share options have been awarded to substantial shareholders or in excess of the individual limit.
According to the SO Scheme rules, the minimum holding period of a share option is six months from date of
acceptance, and a share option shall have a maximum life of 10 years before expiry. Generally, share options
granted by the Company become exercisable three years after the date of grant and remain exercisable for another
seven years, subject to the participants’ continued employment in good standing or retirement.
There are no performance conditions attached to the vesting of share options. Each share option entitles the
eligible participant to subscribe for one ordinary share. Benefits are realised only to the extent that share price
exceeds exercise price.
The SO Scheme will expire on 27 September 2020 and hence has a remaining life of approximately 1.5 years.
Notwithstanding the SO Scheme’s expiry in 2020, the share options awarded prior to the Scheme expiry date will
remain valid in accordance with the SO Scheme rules and Listing Rules.

| AIA GROUP LIMITED124
CORPORATE GOVERNANCEREMUNERATION REPORT
2018 Share Option AwardsThe share options awarded in 2018 will vest in 2021. Details of the valuation of the share options are set out in
note 39 to the financial statements.
Vesting of 2015 Share Option AwardsAll share options awarded in 2015 became exercisable on 12 March 2018.
2019 Share Option AwardsThe Remuneration Committee will grant share options to selected participants after the Company’s year-end
financial results announcement. Details of these awards will be disclosed in the Company’s Annual Report 2019.
Share Option Movements During the Thirteen-Month Period Ended 31 December 2018The table below summarises the movements in share option awards during the thirteen-month period ended
31 December 2018.
Group Chief Executive and President, Key Management Personnel and other eligible employees and participants
Date of grant
(day / month /
year) (2)
Period during which share options
are exercisable (day / month / year)
Share options
outstanding as at
1 December 2017
Share options
awarded during the 13- month
period ended 31 December
2018
Share options vested
during the 13- month
period ended 31 December
2018
Share options
cancelled / lapsed /
reclassified during the 13- month
period ended 31 December
2018 (15)
Share options
exercised during the 13- month
period ended 31 December
2018
Exercise price
(HK$)
Share options
outstanding as at
31 December 2018 (16)
Weighted average
closing price of shares
immediately before the
dates on which share
options were exercised
(HK$)
Group Chief Executive and President Mr. Ng Keng Hooi
5/3/2014 5/3/2017 - 4/3/2024 (3) 602,486 – – – – 37.56 602,486 n/a
12/3/2015 12/3/2018 - 11/3/2025 (4) 541,692 – 541,692 – – 47.73 541,692 n/a
9/3/2016 9/3/2019 - 8/3/2026 (5) 851,026 – – – – 41.90 851,026 n/a
10/3/2017 10/3/2020 - 9/3/2027 (6) 732,574 – – – – 50.30 732,574 n/a
31/7/2017 1/6/2020 - 30/7/2027 (7) 476,786 – – – – 61.55 476,786 n/a
15/3/2018 15/3/2021 - 14/3/2028 (8) – 1,105,066 – – – 67.15 1,105,066 n/a
Key Management Personnel (excluding the Group Chief Executive and President)
1/6/2011 1/4/2014 - 31/5/2021 (9) 472,746 – – – (45,467) 27.35 427,279 69.00
1/6/2011 1/4/2014 - 31/5/2021 (10) 547,738 – – – (106,820) 27.35 440,918 69.00
15/3/2012 15/3/2015 - 14/3/2022 (11) 519,012 – – – – 28.40 519,012 n/a
11/3/2013 11/3/2016 - 10/3/2023 (12) 792,680 – – (229,513) – 34.35 563,167 n/a
5/3/2014 5/3/2017 - 4/3/2024 (3) 941,583 – – (277,793) – 37.56 663,790 n/a
14/4/2014 14/4/2017 - 13/4/2024 (13) 332,282 – – – – 39.45 332,282 n/a
12/3/2015 12/3/2018 - 11/3/2025 (4) 2,035,310 – 1,419,013 (616,297) (435,169) 47.73 983,844 67.15
9/3/2016 9/3/2019 - 8/3/2026 (5) 3,737,698 – – (968,262) – 41.90 2,769,436 n/a
10/3/2017 10/3/2020 - 9/3/2027 (6) 3,246,812 – – (833,479) – 50.30 2,413,333 n/a
31/7/2017 1/6/2020 - 30/7/2027 (7) 697,732 – – – – 61.55 697,732 n/a
15/3/2018 15/3/2021 - 14/3/2028 (8) – 2,692,372 – – – 67.15 2,692,372 n/a
12/9/2018 12/9/2021 - 11/9/2028 (14) – 161,951 – – – 63.64 161,951 n/a
Other eligible employees and participants (including the Retired Group Chief Executive and President) (1)
1/6/2011 1/4/2014 - 31/5/2021 (9) 668,366 – – – – 27.35 668,366 n/a
1/6/2011 1/4/2014 - 31/5/2021 (10) 631,097 – – – (200,000) 27.35 431,097 68.55
15/3/2012 15/3/2015 - 14/3/2022 (11) 755,175 – – – (77,483) 28.40 677,692 66.92
11/3/2013 11/3/2016 - 10/3/2023 (12) 672,849 – – 229,513 (279,106) 34.35 623,256 67.72
5/3/2014 5/3/2017 - 4/3/2024 (3) 2,636,920 – – 277,793 (76,874) 37.56 2,837,839 66.10
12/3/2015 12/3/2018 - 11/3/2025 (4) 2,461,745 – 2,670,779 209,034 (134,385) 47.73 2,536,394 67.23
9/3/2016 9/3/2019 - 8/3/2026 (5) 2,988,827 – – 213,847 – 41.90 3,202,674 n/a
10/3/2017 10/3/2020 - 9/3/2027 (6) 1,769,098 – – 64,546 – 50.30 1,833,644 n/a
15/3/2018 15/3/2021 - 14/3/2028 (8) – 641,924 – (23,688) – 67.15 618,236 n/a

ANNUAL REPORT 2018 | 125
OV
ER
VIE
WF
INA
NC
IAL
AN
D O
PE
RA
TIN
G R
EV
IEW
CO
RP
OR
AT
E G
OV
ER
NA
NC
EF
INA
NC
IAL
STA
TE
ME
NT
SA
DD
ITIO
NA
L IN
FO
RM
AT
ION
Notes:(1) Include share options outstanding as at 1 December 2017 for the retired Group Chief Executive and President, Mr. Mark Edward Tucker.
(2) The measurement date (i.e. the date used to determine the value of the awards for accounting purposes) for awards made during the year ended 30 November 2011 was determined to be 15 June 2011. The measurement date for awards made during the year ended 30 November 2012 was determined to be 15 March 2012. The measurement date for awards made during the year ended 30 November 2013 was determined to be 11 March 2013. The measurement dates for awards made during the year ended 30 November 2014 were determined to be 5 March 2014 and 14 April 2014. The measurement date for awards made during the year ended 30 November 2015 was determined to be 12 March 2015. The measurement date for awards made during the year ended 30 November 2016 was determined to be 9 March 2016. The measurement dates for awards made during the year ended 30 November 2017 were determined to be 10 March 2017 and 31 July 2017. The measurement dates for awards made during the thirteen months ended 31 December 2018 were determined to be 15 March 2018 and 12 September 2018. These measurement dates were determined in accordance with IFRS 2.
(3) The vesting of share options is service-based only. All share options vested on 5 March 2017.
(4) The vesting of share options is service-based only. All share options vested on 12 March 2018.
(5) The vesting of share options is service-based only. All share options vested on 9 March 2019.
(6) The vesting of share options is service-based only. All share options will vest on 10 March 2020.
(7) The vesting of share options is service-based only. All share options will vest on 1 June 2020.
(8) The closing price of the Company’s shares immediately before the date on which share options were awarded was HK$67.00. The vesting of share options is service-based only. All share options will vest on 15 March 2021.
(9) The vesting of share options is service-based only. All share options vested on 1 April 2014.
(10) The vesting of share options is service-based only. One-third of share options vested on 1 April 2014, one-third vested on 1 April 2015, and one third vested on 1 April 2016.
(11) The vesting of share options is service-based only. All share options vested on 15 March 2015.
(12) The vesting of share options is service-based only. All share options vested on 11 March 2016.
(13) The vesting of share options is service-based only. All share options vested on 14 April 2017.
(14) The closing price of the Company’s shares immediately before the date on which share options were awarded was HK$62.00. The vesting of share options is service-based only. All share options will vest on 12 September 2021.
(15) These share options lapsed or were reclassified during the thirteen months ended 31 December 2018. The reclassification of share options was a result of two executives who were previously categorised as “Key Management Personnel” becoming “Other eligible employees and participants” during this period. There were no cancelled share options during the thirteen months ended 31 December 2018.
(16) Include share options outstanding as at 31 December 2018 that, in accordance with the SO Scheme rules, will lapse on or before the end of the respective periods during which the share options are exercisable.
EMPLOYEE SHARE PURCHASE PLANThe Company adopted the Employee Share Purchase Plan (ESPP) on 25 July 2011 (ESPP Adoption Date). The
ESPP is designed to facilitate and encourage AIA share ownership by employees.
Under the ESPP, eligible employees of the Group may elect to purchase the Company’s shares and, after having
been in the plan for three years, receive one matching share for two shares purchased through the award of
matching restricted stock purchase units (RSPUs). Each eligible employee’s participation level is capped at a
maximum purchase in any plan year of 8 per cent of his or her base salary or HK$9,750 (or local equivalent) per
calendar month, whichever is lower.
Upon vesting of the matching RSPUs, those employees who are still in employment with the Group will receive
one matching share for each RSPU which he or she holds. The matching shares can either be purchased on
market by the trustee of the ESPP or provided to recipients through the issuance by the Company of new shares.
The aggregate number of shares which can be issued by the Company under the ESPP during the 10-year period
shall not exceed 2.5 per cent of the number of shares in issue on the ESPP Adoption Date. No new shares have
been issued under the ESPP since its adoption. For further information on the ESPP, please refer to note 39 to the
financial statements.

| AIA GROUP LIMITED126
CORPORATE GOVERNANCEREMUNERATION REPORT
During the thirteen-month period ended 31 December 2018, 1,409,739 matching RSPUs were awarded, 841,108
matching RSPUs vested and no new shares were issued for the RSPUs pursuant to the ESPP. Since the ESPP
Adoption Date and up to 31 December 2018, a cumulative total of 3,479,304 matching RSPUs vested under the
ESPP, representing approximately 0.029 per cent of the shares in issue as at the ESPP Adoption Date.
DIRECTORS AND KEY MANAGEMENT PERSONNEL EMOLUMENTS
EXECUTIVE DIRECTORSIn the role of Group Chief Executive and President, Mr. Ng Keng Hooi received remuneration exclusively for his
role and received no separate fees for his role as a Board Director or for acting as a director of any subsidiary
companies.
The table below provides details of annual target level of remuneration, excluding benefits and allowances for the
Group Chief Executive and President and the retired Group Chief Executive and President Mr. Mark Edward Tucker.
Annual Target Pay Opportunity (1)
US$ thousands
2018Mr. Ng Keng Hooi
2017Mr. Ng Keng Hooi
2017Mr. Mark Edward Tucker
Basic Salary (2) 1,030 993 1,608
Target short-term incentive 1,800 1,500 2,412
Target long-term incentive 3,600 3,000 6,834
Total Annual Target Pay Opportunity 6,430 5,493 10,854
Notes: (1) The target remuneration levels shown in the table above exclude benefits and allowances and the 2017 levels shown for Mr. Ng Keng Hooi are the
annualised amounts. In both years, Mr. Ng Keng Hooi also received an annual housing allowance of HK$3,000,000, which was prorated in 2017 from 1 June 2017 upon his appointment.
(2) Mr. Ng Keng Hooi’s basic salary is paid in Hong Kong Dollars. For 2017 the basic salary figure represents the annualised amount from appointment on 1 June 2017 while the 2018 figure represents the annualised amount from 1 March 2018 (being the 2018 annual review salary effective date). Values indicated in the table above have been converted to U.S. dollars using exchange rates as of the end of each year.
Details of the actual remuneration costs incurred by the Company during the thirteen-month period ended 31 December
2018 in relation to the Group Chief Executive and President are included in note 40 to the financial statements.
NON-EXECUTIVE DIRECTORSRemuneration for the Independent Non-executive Directors was paid during the thirteen-month period ended
31 December 2018 and included fees for their services provided to the Board Committees. All remuneration of the
Independent Non-executive Directors was on a flat annual fee basis, with no variable component linked to either
corporate or individual performance.
Details of the Non-executive Directors’ remuneration cost incurred by the Company during the thirteen-month period
ended 31 December 2018 are included in note 40 to the financial statements.
Board ChairmanDuring 2018, the Remuneration Committee reviewed the fees for the Board Chairman and Non-executive Directors and
subsequently proposed adjustments to the Board for approval.
To reflect the unique scope, contribution and time commitment of the Board Chairman role, and to ensure competitiveness
against our global insurance peers, Board Chairman Basic Fees, inclusive of Board Membership fee, will be increased
from US$485,000 to US$542,500 per annum effective 1 January 2019, and to US$600,000 per annum effective
1 January 2020. The Chairman abstained from discussion and voting on the fee increase.

ANNUAL REPORT 2018 | 127
OV
ER
VIE
WF
INA
NC
IAL
AN
D O
PE
RA
TIN
G R
EV
IEW
CO
RP
OR
AT
E G
OV
ER
NA
NC
EF
INA
NC
IAL
STA
TE
ME
NT
SA
DD
ITIO
NA
L IN
FO
RM
AT
ION
Non-executive DirectorsBoard Membership fees for the Non-executive Directors will be increased from US$160,000 to US$168,000 per annum
effective 1 January 2019 to more closely align with the fee levels provided by our global insurance peers.
Additional annual fees for Committee Membership and Chair positions are also provided to the Non-executive Directors
and will remain unchanged as follows:
• Audit Committee Chair US$55,000
• Audit Committee Member US$40,000
• Nomination Committee Chair US$25,000
• Nomination Committee Member US$15,000
• Remuneration Committee Chair US$45,000
• Remuneration Committee Member US$30,000
• Risk Committee Chair US$45,000
• Risk Committee Member US$30,000
KEY MANAGEMENT PERSONNELThe total remuneration cost charged to the consolidated income statement for the Key Management Personnel during
the thirteen-month period ended 31 December 2018 was US$45,555,663.
Details of remuneration provided during the thirteen-month period ended 31 December 2018 are included in note 40 to
the financial statements.

| AIA GROUP LIMITED128
FINANCIAL STATEMENTS
129 Independent Auditor’s Report
136 Consolidated Income Statement
137 Consolidated Statement of Comprehensive Income
138 Consolidated Statement of Financial Position
140 Consolidated Statement of Changes in Equity
142 Consolidated Statement of Cash Flows
144 Notes to the Consolidated Financial Statements and Significant Accounting Policies
1. Corporate information
2. Significant accounting policies
3. Critical accounting estimates and judgements
4. Exchange rates
5. Change in Group Composition
6. Operating profit after tax
7. Total weighted premium income and
annualised new premiums
8. Segment information
9. Revenue
10. Expenses
11. Income tax
12. Earnings per share
13. Dividends
14. Intangible assets
15. Investments in associates and joint venture
16. Property, plant and equipment
17. Investment property
18. Reinsurance assets
19. Deferred acquisition and origination costs
20. Financial investments
21. Derivative financial instruments
22. Fair value measurement
23. Other assets
24. Impairment of financial assets
25. Cash and cash equivalents
26. Insurance contract liabilities
27. Investment contract liabilities
28. Effect of changes in assumptions and estimates
29. Borrowings
30. Obligations under repurchase and
securities lending agreements
31. Offsetting of financial assets and
financial liabilities
32. Provisions
33. Other liabilities
34. Share capital and reserves
35. Non-controlling interests
36. Group capital structure
37. Risk management
38. Employee benefits
39. Share-based compensation
40. Remuneration of directors and
key management personnel
41. Related party transactions
42. Commitments and contingencies
43. Subsidiaries
44. Events after the reporting period
45. Statement of financial position of the Company
46. Statement of changes in equity of the Company
47. Supplementary financial information
on a calendar year basis
267 Independent Auditor’s Report on the Supplementary Embedded Value Information
271 Supplementary Embedded Value Information

129
INDEPENDENT AUDITOR’S REPORT
TO THE SHAREHOLDERS OF AIA GROUP LIMITED(incorporated in Hong Kong with limited liability)
OpinionWhat we have audited
The consolidated financial statements of AIA Group Limited (the “Company”) and its subsidiaries
(the “Group”) set out on pages 136 to 266, which comprise:
• the consolidated statement of financial position as at 31 December 2018;
• the consolidated income statement for the thirteen months period ended 31 December 2018;
• the consolidated statement of comprehensive income for the thirteen months period ended
31 December 2018;
• the consolidated statement of changes in equity for the thirteen months period ended 31
December 2018;
• the consolidated statement of cash flows for the thirteen months period ended 31 December
2018; and
• the notes to the consolidated financial statements, which include a summary of significant
accounting policies.
Our opinion
In our opinion, the consolidated financial statements give a true and fair view of the consolidated
financial position of the Group as at 31 December 2018, and of its consolidated financial
performance and its consolidated cash flows for the thirteen months period ended 31 December
2018 in accordance with Hong Kong Financial Reporting Standards (“HKFRSs”) issued by the
Hong Kong Institute of Certified Public Accountants (“HKICPA”) and with International Financial
Reporting Standards (“IFRSs”) issued by the International Accounting Standards Board (“IASB”)
and have been properly prepared in compliance with the Hong Kong Companies Ordinance.
Basis for OpinionWe conducted our audit in accordance with Hong Kong Standards on Auditing (“HKSAs”) issued
by the HKICPA. Our responsibilities under those standards are further described in the Auditor’s
Responsibilities for the Audit of the Consolidated Financial Statements section of our report.
We believe that the audit evidence we have obtained is sufficient and appropriate to provide a
basis for our opinion.
IndependenceWe are independent of the Group in accordance with the HKICPA’s Code of Ethics for Professional
Accountants (“the Code”), and we have fulfilled our other ethical responsibilities in accordance
with the Code.
ANNUAL REPORT 2018 |
OV
ER
VIE
WF
INA
NC
IAL
AN
D O
PE
RA
TIN
G R
EV
IEW
CO
RP
OR
AT
E G
OV
ER
NA
NC
EF
INA
NC
IAL
STA
TE
ME
NT
SA
DD
ITIO
NA
L IN
FO
RM
AT
ION
FINANCIAL STATEMENTS

130
Key Audit MattersKey audit matters are those matters that, in our professional judgement, were of most significance
in our audit of the consolidated financial statements of the current period. These matters were
addressed in the context of our audit of the consolidated financial statements as a whole, and in
forming our opinion thereon, and we do not provide a separate opinion on these matters.
The key audit matters identified relate to the valuation of insurance contract liabilities and the
amortisation of deferred acquisition costs (“DAC”).
Key audit matter How our audit addressed the key audit matter
a) Valuation of insurance contract liabilities
Refer to the following notes in the consolidated financial statements: Note 2.4 for related accounting policies, Note 3 for critical accounting estimates and judgements, Note 26 and Note 28.
As at 31 December 2018 the Group has insurance contract liabilities of US$164,764 million.
The Director’s valuation of these insurance contract liabilities involves significant judgement about uncertain future outcomes, including mortality, morbidity, persistency, expense, investment return, valuation interest rates and provision for adverse deviation, as well as complex valuation methodologies.
The liabilities for traditional participating life assurance policies with discretionary participation features and non-participating life assurance policies, annuities and policies related to other protection products are substantially determined by a net level premium valuation method using best estimate assumptions at policy inception adjusted for adverse deviation. These assumptions remain locked in thereafter, subject to meeting a liability adequacy test which compares the liabilities with a valuation on current best estimate assumptions.
We performed the following audit procedures to address this matter:
• We understood the valuation methodologies used, identified changes in methodologies from previous valuation and assessed the reasonableness and impact for material changes identified, by applying our industry knowledge and experience to compare whether the methodologies and changes to those are consistent with recognised actuarial practices and expectation derived from market experience.
• We assessed the reasonableness of the key assumptions including those for mortality, morbidity, persistency, expense, investment return and valuation interest rates as well as provision for adverse deviation. Our assessment of the assumptions included:
• Obtaining an understanding of, and testing, the controls in place to determine the assumptions;
• Examining the approach used by management to derive the assumptions by applying our industry knowledge and experience;
| AIA GROUP LIMITED
FINANCIAL STATEMENTS

131
Key audit matter How our audit addressed the key audit matter
a) Valuation of insurance contract liabilities (continued)
Insurance contract liabilities for universal life and unit-linked policies are substantially based on the value of the account balance together with liabilities for unearned revenue and additional insurance benefits which are dependent upon operating assumptions and future investment return assumptions that are reassessed at each reporting period.
As part of our consideration of assumptions, we have focused on those insurance contracts where the assumptions are reassessed at each reporting date as well as how assumptions are set at policy inception dates.
We have, in relation to valuation methodologies used, focused on changes in methodologies from the previous valuation as well as methodologies applied to material new product types (as applicable).
• Challenging the key assumptions used by management against past experience, market observable data (as applicable) and our experience of market practice.
• We checked the calculation of the liability adequacy test and assessed the related results in order to ascertain whether the insurance contract liabilities used for the inforce business are adequate in the context of a valuation on current best estimate assumptions.
Based upon the work performed, we found the methodologies and assumptions used by management to be appropriate, including those used in the liability adequacy test.
b) Amortisation of DAC
Refer to the following notes in the consolidated financial statements: Note 2.4.1 for related accounting policies, Note 3.3 for critical accounting estimates and judgements and Note 19.
As at 31 December 2018, the Group has reported DAC of US$24,626 million.
The amortisation of DAC for traditional life insurance policies and annuities are amortised over the expected life of the policies as a constant percentage of premiums and involve less judgement by the Directors compared to universal life and unit-linked policies. Expected premiums are estimated at the date of policy issue.
We performed the following audit procedures to address this matter:
• Reviewed and challenged the basis of amortisation of DAC in the context of the Group’s accounting policy and the appropriateness of the assumptions used in determining the estimated gross profits used for amortisation for universal life and unit-linked policies. This included those for mortality, morbidity, persistency, expense and investment returns by comparing against past experience, market observable data (as applicable) and our experience of market practice.
Key Audit Matters (continued)
ANNUAL REPORT 2018 |
OV
ER
VIE
WF
INA
NC
IAL
AN
D O
PE
RA
TIN
G R
EV
IEW
CO
RP
OR
AT
E G
OV
ER
NA
NC
EF
INA
NC
IAL
STA
TE
ME
NT
SA
DD
ITIO
NA
L IN
FO
RM
AT
ION
INDEPENDENT AUDITOR’S REPORT

132
Key audit matter How our audit addressed the key audit matter
b) Amortisation of DAC (continued)
The amortisation of DAC for universal life and unit-linked policies involves greater judgement by the Directors. For these contracts, DAC is amortised over the expected life of the contracts based on a constant percentage of the present value of estimated gross profits expected to be realised over the life of the contract or on a straight-line basis. Estimated gross profits are revised regularly and significant judgement is exercised in making appropriate estimates of gross profits.
As part of our audit we have focused on DAC related to universal life and unit-linked policies where the assumptions are reassessed at each reporting date.
Based upon the work performed, we found the assumptions used in relation to the amortisation of DAC for universal life and unit-linked policies to be appropriate.
Other InformationThe Directors of the Company are responsible for the other information. The other information comprises the Group Chief Executive and President’s Report, Financial Review, Business Review, Regulatory and International Developments, Supplementary Embedded Value Information and our auditor’s report thereon, Condensed Business and Financial Review for the Thirteen Months ended 31 December 2018 and Glossary (but does not include the consolidated financial statements and our auditor’s report thereon), which we obtained prior to the date of this auditor’s report, and the Financial Highlights, Chairman’s Statement, Risk Management, Valuing Our People, Corporate Social Responsibility, Statement of Directors’ Responsibilities, Board of Directors, Executive Committee, Report of the Directors, Corporate Governance Report, Remuneration Report, Information for Shareholders and Corporate Information, which are expected to be made available to us after that date.
Our opinion on the consolidated financial statements does not cover the other information and we do not and will not express any form of assurance conclusion thereon.
In connection with our audit of the consolidated financial statements, our responsibility is to read the other information identified above and, in doing so, consider whether the other information is materially inconsistent with the consolidated financial statements or our knowledge obtained in the audit, or otherwise appears to be materially misstated.
If, based on the work we have performed on the other information that we obtained prior to the date of this auditor’s report, we conclude that there is a material misstatement of this other information, we are required to report that fact. We have nothing to report in this regard.
Key Audit Matters (continued)
| AIA GROUP LIMITED
FINANCIAL STATEMENTS

133
Other Information (continued)
When we read the Financial Highlights, Chairman’s Statement, Risk Management, Valuing Our
People, Corporate Social Responsibility, Statement of Directors’ Responsibilities, Board of
Directors, Executive Committee, Report of the Directors, Corporate Governance Report,
Remuneration Report, Information for Shareholders and Corporate Information, if we conclude
that there is a material misstatement therein, we are required to communicate the matter to those
charged with governance and take appropriate action considering our legal rights and obligations.
Other MatterThe Group has prepared Supplementary Embedded Value Information as at and for the year
ended 31 December 2018 in accordance with the embedded value basis of preparation set out in
Sections 4 and 5 of the Supplementary Embedded Value Information, on which we issued a
separate auditor’s report to the Board of Directors of the Company dated 15 March 2019.
Responsibilities of Directors and Those Charged with Governance for the Consolidated Financial StatementsThe Directors of the Company are responsible for the preparation of the consolidated financial
statements that give a true and fair view in accordance with HKFRSs issued by the HKICPA and
with IFRSs issued by the IASB and the Hong Kong Companies Ordinance, and for such internal
control as the Directors determine is necessary to enable the preparation of consolidated financial
statements that are free from material misstatement, whether due to fraud or error.
In preparing the consolidated financial statements, the Directors are responsible for assessing
the Group’s ability to continue as a going concern, disclosing, as applicable, matters related to
going concern and using the going concern basis of accounting unless the Directors either intend
to liquidate the Group or to cease operations, or have no realistic alternative but to do so.
Those charged with governance are responsible for overseeing the Group’s financial reporting
process.
Auditor’s Responsibilities for the Audit of the Consolidated Financial StatementsOur objectives are to obtain reasonable assurance about whether the consolidated financial
statements as a whole are free from material misstatement, whether due to fraud or error, and to
issue an auditor’s report that includes our opinion. We report our opinion solely to you, as a body,
in accordance with Section 405 of the Hong Kong Companies Ordinance and for no other purpose.
We do not assume responsibility towards or accept liability to any other person for the contents
of this report. Reasonable assurance is a high level of assurance, but is not a guarantee that an
audit conducted in accordance with HKSAs will always detect a material misstatement when it
exists. Misstatements can arise from fraud or error and are considered material if, individually or
in the aggregate, they could reasonably be expected to influence the economic decisions of users
taken on the basis of these consolidated financial statements.
ANNUAL REPORT 2018 |
OV
ER
VIE
WF
INA
NC
IAL
AN
D O
PE
RA
TIN
G R
EV
IEW
CO
RP
OR
AT
E G
OV
ER
NA
NC
EF
INA
NC
IAL
STA
TE
ME
NT
SA
DD
ITIO
NA
L IN
FO
RM
AT
ION
INDEPENDENT AUDITOR’S REPORT

134
Auditor’s Responsibilities for the Audit of the Consolidated Financial Statements (continued)
As part of an audit in accordance with HKSAs, we exercise professional judgement and maintain
professional scepticism throughout the audit. We also:
• Identify and assess the risks of material misstatement of the consolidated financial statements,
whether due to fraud or error, design and perform audit procedures responsive to those risks,
and obtain audit evidence that is sufficient and appropriate to provide a basis for our opinion.
The risk of not detecting a material misstatement resulting from fraud is higher than for one
resulting from error, as fraud may involve collusion, forgery, intentional omissions,
misrepresentations, or the override of internal control.
• Obtain an understanding of internal control relevant to the audit in order to design audit
procedures that are appropriate in the circumstances, but not for the purpose of expressing an
opinion on the effectiveness of the Group’s internal control.
• Evaluate the appropriateness of accounting policies used and the reasonableness of
accounting estimates and related disclosures made by the Directors.
• Conclude on the appropriateness of the Directors’ use of the going concern basis of accounting
and, based on the audit evidence obtained, whether a material uncertainty exists related to
events or conditions that may cast significant doubt on the Group’s ability to continue as a
going concern. If we conclude that a material uncertainty exists, we are required to draw
attention in our auditor’s report to the related disclosures in the consolidated financial
statements or, if such disclosures are inadequate, to modify our opinion. Our conclusions are
based on the audit evidence obtained up to the date of our auditor’s report. However, future
events or conditions may cause the Group to cease to continue as a going concern.
• Evaluate the overall presentation, structure and content of the consolidated financial
statements, including the disclosures, and whether the consolidated financial statements
represent the underlying transactions and events in a manner that achieves fair presentation.
• Obtain sufficient appropriate audit evidence regarding the financial information of the entities
or business activities within the Group to express an opinion on the consolidated financial
statements. We are responsible for the direction, supervision and performance of the group
audit. We remain solely responsible for our audit opinion.
| AIA GROUP LIMITED
FINANCIAL STATEMENTS

135
Auditor’s Responsibilities for the Audit of the Consolidated Financial Statements (continued)
We communicate with those charged with governance regarding, among other matters, the
planned scope and timing of the audit and significant audit findings, including any significant
deficiencies in internal control that we identify during our audit.
We also provide those charged with governance with a statement that we have complied with
relevant ethical requirements regarding independence, and to communicate with them all
relationships and other matters that may reasonably be thought to bear on our independence, and
where applicable, related safeguards.
From the matters communicated with those charged with governance, we determine those
matters that were of most significance in the audit of the consolidated financial statements of the
current period and are therefore the key audit matters. We describe these matters in our auditor’s
report unless law or regulation precludes public disclosure about the matter or when, in extremely
rare circumstances, we determine that a matter should not be communicated in our report
because the adverse consequences of doing so would reasonably be expected to outweigh the
public interest benefits of such communication.
The engagement partner on the audit resulting in this independent auditor’s report is Lars
Christian Jordy Nielsen.
PricewaterhouseCoopers
Certified Public Accountants
Hong Kong
15 March 2019
ANNUAL REPORT 2018 |
OV
ER
VIE
WF
INA
NC
IAL
AN
D O
PE
RA
TIN
G R
EV
IEW
CO
RP
OR
AT
E G
OV
ER
NA
NC
EF
INA
NC
IAL
STA
TE
ME
NT
SA
DD
ITIO
NA
L IN
FO
RM
AT
ION
INDEPENDENT AUDITOR’S REPORT

136
CONSOLIDATED INCOME STATEMENT
US$m Notes
Thirteen months ended 31 December
2018
Twelve months ended 30 November
2017
REVENUE
Premiums and fee income 33,881 26,986
Premiums ceded to reinsurers (1,968) (1,497)
Net premiums and fee income 31,913 25,489
Investment return 9 4,077 12,622
Other operating revenue 9 307 219
Total revenue 36,297 38,330
EXPENSES
Insurance and investment contract benefits 26,383 26,108
Insurance and investment contract benefits ceded (1,787) (1,267)
Net insurance and investment contract benefits 24,596 24,841
Commission and other acquisition expenses 4,136 3,455
Operating expenses 2,366 1,969
Finance costs 228 183
Other expenses 801 567
Total expenses 10 32,127 31,015
Profit before share of profit from associates and joint ventures 4,170 7,315
Share of profit from associates and joint ventures – –
Profit before tax 4,170 7,315
Income tax credit/(expense) attributable to policyholders’ returns 51 (128)
Profit before tax attributable to shareholders’ profits 4,221 7,187
Tax expense 11 (944) (1,128)
Tax attributable to policyholders’ returns (51) 128
Tax expense attributable to shareholders’ profits (995) (1,000)
Net profit 3,226 6,187
Net profit attributable to:
Shareholders of AIA Group Limited 3,163 6,120
Non-controlling interests 63 67
EARNINGS PER SHARE (US$)
Basic 12 0.26 0.51
Diluted 12 0.26 0.51
| AIA GROUP LIMITED
FINANCIAL STATEMENTS

137
CONSOLIDATED STATEMENT OF COMPREHENSIVE INCOME
US$m
Thirteen months ended 31 December
2018
Twelve months ended 30 November
2017
Net profit 3,226 6,187
OTHER COMPREHENSIVE INCOME
Items that may be reclassified subsequently to profit or loss:
Fair value (losses)/gains on available for sale financial assets (net of tax of: thirteen months ended 31 December 2018: US$(177)m; twelve months ended 30 November 2017: US$297m) (4,174) 1,197
Fair value losses/(gains) on available for sale financial assets transferred to income on disposal and impairment (net of tax of: thirteen months ended 31 December 2018: US$18m; twelve months ended 30 November 2017: US$19m) 26 (161)
Foreign currency translation adjustments (510) 1,028
Cash flow hedges 16 (11)
Share of other comprehensive expenses from associates and joint ventures (45) (24)
Subtotal (4,687) 2,029
Items that will not be reclassified subsequently to profit or loss:
Revaluation gains on property held for own use (net of tax of: thirteen months ended 31 December 2018: US$(10)m; twelve months ended 30 November 2017: US$(14)m) 11 78
Effect of remeasurement of net liability of defined benefit schemes (net of tax of: thirteen months ended 31 December 2018: US$(7)m; twelve months ended 30 November 2017: nil) 1 18
Subtotal 12 96
Total other comprehensive (expense)/income (4,675) 2,125
Total comprehensive (expense)/income (1,449) 8,312
Total comprehensive (expense)/income attributable to:
Shareholders of AIA Group Limited (1,484) 8,250
Non-controlling interests 35 62
ANNUAL REPORT 2018 |
OV
ER
VIE
WF
INA
NC
IAL
AN
D O
PE
RA
TIN
G R
EV
IEW
CO
RP
OR
AT
E G
OV
ER
NA
NC
EF
INA
NC
IAL
STA
TE
ME
NT
SA
DD
ITIO
NA
L IN
FO
RM
AT
ION
FINANCIAL STATEMENTS

138
CONSOLIDATED STATEMENT OF FINANCIAL POSITION
US$m Notes
As at31 December
2018
As at 30 November
2017
ASSETS
Intangible assets 14 1,970 1,864
Investments in associates and joint ventures 15 610 642
Property, plant and equipment 16 1,233 1,213
Investment property 17 4,794 4,365
Reinsurance assets 18 2,887 2,481
Deferred acquisition and origination costs 19 24,626 21,847
Financial investments: 20, 22
Loans and deposits 7,392 7,973
Available for sale
Debt securities 112,485 105,466
At fair value through profit or loss
Debt securities 27,736 25,702
Equity securities 38,099 36,716
Derivative financial instruments 21 430 363
186,142 176,220
Deferred tax assets 11 26 9
Current tax recoverable 164 131
Other assets 23 4,903 4,630
Cash and cash equivalents 25 2,451 2,289
Total assets 229,806 215,691
LIABILITIES
Insurance contract liabilities 26 164,764 148,897
Investment contract liabilities 27 7,885 8,082
Borrowings 29 4,954 3,958
Obligations under repurchase and securities lending agreements 30 1,683 1,883
Derivative financial instruments 21 243 361
Provisions 32 168 234
Deferred tax liabilities 11 4,187 3,595
Current tax liabilities 532 421
Other liabilities 33 5,984 5,888
Total liabilities 190,400 173,319
| AIA GROUP LIMITED
FINANCIAL STATEMENTS

139
US$m Notes
As at31 December
2018
As at 30 November
2017
EQUITY
Share capital 34 14,073 14,065
Employee share-based trusts 34 (258) (297)
Other reserves 34 (11,910) (11,948)
Retained earnings 35,661 34,087
Fair value reserve 34 2,211 6,336
Foreign currency translation reserve 34 (1,301) (751)
Property revaluation reserve 34 538 527
Others (8) (25)
Amounts reflected in other comprehensive income 1,440 6,087
Total equity attributable to:
Shareholders of AIA Group Limited 39,006 41,994
Non-controlling interests 35 400 378
Total equity 39,406 42,372
Total liabilities and equity 229,806 215,691
Approved and authorised for issue by the Board of Directors on 15 March 2019.
Ng Keng Hooi Edmund Sze-Wing Tse
Director Director
ANNUAL REPORT 2018 |
OV
ER
VIE
WF
INA
NC
IAL
AN
D O
PE
RA
TIN
G R
EV
IEW
CO
RP
OR
AT
E G
OV
ER
NA
NC
EF
INA
NC
IAL
STA
TE
ME
NT
SA
DD
ITIO
NA
L IN
FO
RM
AT
ION
CONSOLIDATED STATEMENT OF FINANCIAL POSITION

140
CONSOLIDATED STATEMENT OF CHANGES IN EQUITY
Other comprehensive income
US$m NoteShare
capital
Employee share-based trusts
Otherreserves
Retained earnings
Fair value
reserve
Foreign currency
translation reserve
Property revaluation
reserve Others
Non-controlling
interestsTotal
equity
Balance at 1 December 2017 14,065 (297) (11,948) 34,087 6,336 (751) 527 (25) 378 42,372
Net profit – – – 3,163 – – – – 63 3,226
Fair value losses on available for sale financial assets – – – – (4,151) – – – (23) (4,174)
Fair value losses on available for sale financial assets transferred to income on disposal and impairment – – – – 26 – – – – 26
Foreign currency translation adjustments – – – – – (505) – – (5) (510)
Cash flow hedges – – – – – – – 16 – 16
Share of other comprehensive expenses from associates and joint ventures – – – – – (45) – – – (45)
Revaluation gains on property held for own use – – – – – – 11 – – 11
Effect of remeasurement of net liability of defined benefit schemes – – – – – – – 1 – 1
Total comprehensive income/(expense) for the period – – – 3,163 (4,125) (550) 11 17 35 (1,449)
Dividends 13 – – – (1,589) – – – – (20) (1,609)
Shares issued under share option scheme and agency share purchase plan 8 – – – – – – – – 8
Capital contributions from non-controlling interests – – – – – – – – 7 7
Share-based compensation – – 82 – – – – – – 82
Purchase of shares held by employee share-based trusts – (12) – – – – – – – (12)
Transfer of vested shares from employee share-based trusts – 51 (51) – – – – – – –
Others – – 7 – – – – – – 7
Balance at 31 December 2018 14,073 (258) (11,910) 35,661 2,211 (1,301) 538 (8) 400 39,406
| AIA GROUP LIMITED
FINANCIAL STATEMENTS

141
Other comprehensive income
US$m NoteShare
capital
Employee share-based trusts
Other reserves
Retained earnings
Fair value
reserve
Foreign currency
translation reserve
Property revaluation
reserve Others
Non-controlling
interestsTotal
equity
Balance at 1 December 2016 13,998 (351) (11,954) 29,334 5,352 (1,812) 449 (32) 326 35,310
Net profit – – – 6,120 – – – – 67 6,187
Fair value gains/(losses) on available for sale financial assets – – – – 1,202 – – – (5) 1,197
Fair value gains on available for sale financial assets transferred to income on disposal – – – – (161) – – – – (161)
Foreign currency translation adjustments – – – – – 1,028 – – – 1,028
Cash flow hedges – – – – – – – (11) – (11)
Share of other comprehensive (expenses)/income from associates and joint ventures – – – – (57) 33 – – – (24)
Revaluation gains on property held for own use – – – – – – 78 – – 78
Effect of remeasurement of net liability of defined benefit schemes – – – – – – – 18 – 18
Total comprehensive income for the year – – – 6,120 984 1,061 78 7 62 8,312
Dividends 13 – – – (1,376) – – – – (14) (1,390)
Shares issued under share option scheme and agency share purchase plan 67 – – – – – – – – 67
Capital contributions from non-controlling interests – – – – – – – – 4 4
Share-based compensation – – 79 – – – – – – 79
Purchase of shares held by employee share-based trusts – (10) – – – – – – – (10)
Transfer of vested shares from employee share-based trusts – 64 (64) – – – – – – –
Others – – (9) 9 – – – – – –
Balance at 30 November 2017 14,065 (297) (11,948) 34,087 6,336 (751) 527 (25) 378 42,372
ANNUAL REPORT 2018 |
OV
ER
VIE
WF
INA
NC
IAL
AN
D O
PE
RA
TIN
G R
EV
IEW
CO
RP
OR
AT
E G
OV
ER
NA
NC
EF
INA
NC
IAL
STA
TE
ME
NT
SA
DD
ITIO
NA
L IN
FO
RM
AT
ION
CONSOLIDATED STATEMENT OF CHANGES IN EQUITY

142
CONSOLIDATED STATEMENT OF CASH FLOWS
US$m Notes
Thirteen months ended 31 December
2018
Twelve months ended 30 November
2017
CASH FLOWS FROM OPERATING ACTIVITIES
Profit before tax 4,170 7,315
Adjustments for:
Financial investments (14,998) (18,413)
Insurance and investment contract liabilities, and deferred acquisition and origination costs 14,037 14,312
Obligations under repurchase and securities lending agreements 30 (177) (219)
Receipt of upfront reinsurance commission related to acquisition of subsidiaries 5 482 –
Other non-cash operating items, including investment income and the effect of exchange rate changes on certain operating items (8,095) (7,242)
Operating cash items:
Interest received 6,718 5,627
Dividends received 782 703
Interest paid (44) (50)
Tax paid (855) (582)
Net cash provided by operating activities 2,020 1,451
CASH FLOWS FROM INVESTING ACTIVITIES
Payments for intangible assets 14 (92) (151)
Contribution to a joint venture 15 (3) (6)
Net payments for investment property and property, plant and equipment 16, 17 (127) (84)
Acquisition of subsidiaries, net of cash acquired 5 (606) –
Net cash used in investing activities (828) (241)
CASH FLOWS FROM FINANCING ACTIVITIES
Issuance of medium-term notes 29 1,490 497
Redemption of medium-term notes 29 (500) –
Proceeds from other borrowings 29 2,603 –
Repayment of other borrowings (2,603) (1)
Interest paid on medium-term notes (168) (136)
Capital contributions from non-controlling interests 7 4
Dividends paid during the period (1,609) (1,390)
Purchase of shares held by employee share-based trusts (12) (10)
Shares issued under share option scheme and agency share purchase plan 8 67
Net cash used in financing activities (784) (969)
Net increase in cash and cash equivalents 408 241
Cash and cash equivalents at beginning of the financial period 1,787 1,482
Effect of exchange rate changes on cash and cash equivalents (49) 64
Cash and cash equivalents at end of the financial period 2,146 1,787
| AIA GROUP LIMITED
FINANCIAL STATEMENTS

143
Cash and cash equivalents in the above consolidated statement of cash flows can be further analysed as follows:
US$m Note
As at31 December
2018
As at30 November
2017
Cash and cash equivalents in the consolidated statement of financial position 25 2,451 2,289
Bank overdrafts (305) (502)
CASH AND CASH EQUIVALENTS IN THE CONSOLIDATED STATEMENT OF CASH FLOWS 2,146 1,787
ANNUAL REPORT 2018 |
OV
ER
VIE
WF
INA
NC
IAL
AN
D O
PE
RA
TIN
G R
EV
IEW
CO
RP
OR
AT
E G
OV
ER
NA
NC
EF
INA
NC
IAL
STA
TE
ME
NT
SA
DD
ITIO
NA
L IN
FO
RM
AT
ION
CONSOLIDATED STATEMENT OF CASH FLOWS

144
NOTES TO THE CONSOLIDATED FINANCIAL STATEMENTS AND SIGNIFICANT ACCOUNTING POLICIES
1. CORPORATE INFORMATIONAIA Group Limited (the “Company”) was established as a company with limited liability incorporated in Hong Kong on 24
August 2009. The address of its registered office is 35/F, AIA Central, No. 1 Connaught Road Central, Hong Kong.
AIA Group Limited is listed on the Main Board of The Stock Exchange of Hong Kong Limited under the stock code “1299”
with American Depositary Receipts (Level 1) being traded on the over-the-counter market (ticker symbol: “AAGIY”).
AIA Group Limited and its subsidiaries (collectively “AIA” or the “Group”) is a life insurance based financial services provider
operating in 18 markets throughout the Asia-Pacific region. The Group’s principal activity is the writing of life insurance
business, providing life insurance, accident and health insurance and savings plans throughout Asia, and distributing
related investment and other financial services products to its customers.
2. SIGNIFICANT ACCOUNTING POLICIES2.1 Basis of preparation and statement of complianceThe consolidated financial statements have been prepared in accordance with all applicable Hong Kong Financial
Reporting Standards (HKFRS), International Financial Reporting Standards (IFRS) and the Hong Kong Companies
Ordinance. IFRS is substantially consistent with HKFRS and the accounting policy selections that the Group has made in
preparing these consolidated financial statements are such that the Group is able to comply with both HKFRS and IFRS.
References to IFRS, International Accounting Standards (IAS) and Interpretations developed by the IFRS Interpretations
Committee (IFRS IC) in these consolidated financial statements should be read as referring to the equivalent HKFRS, Hong
Kong Accounting Standards (HKAS) and Hong Kong (IFRIC) Interpretations (HK(IFRIC) – Int) as the case may be.
Accordingly, there are not any differences of accounting practice between HKFRS and IFRS affecting these consolidated
financial statements.
The consolidated financial statements have been approved for issue by the Board of Directors on 15 March 2019.
The consolidated financial statements have been prepared using the historical cost convention, as modified by the
revaluation of available for sale financial assets, certain financial assets and liabilities designated at fair value through
profit or loss, derivative financial instruments, property held for own use and investment properties, all of which are carried
at fair value.
Items included in the consolidated financial statements of each of the Group’s entities are measured in the currency of the
primary economic environment in which that entity operates (the functional currency). The Company’s functional currency
and the presentation currency of the Company and the Group is the US dollar. The consolidated financial statements are
presented in millions of US dollars (US$m) unless otherwise stated.
The accounting policies adopted are consistent with those of the previous financial year, except as described as follows.
| AIA GROUP LIMITED
FINANCIAL STATEMENTS

145
2. SIGNIFICANT ACCOUNTING POLICIES (continued)
2.1 Basis of preparation and statement of compliance (continued)
(a) The following relevant new amendments to standards have been adopted for the first time for the financial period
ended 31 December 2018 and have no material impact to the Group:
• Amendments to IAS 7, Disclosure Initiative;
• Amendments to IAS 12, Recognition of Deferred Tax Assets for Unrealised Losses; and
• Amendments to IFRS 12, Clarification of the Scope of the Standard.
(b) The following relevant new standards, interpretation and amendments to standards have been issued but are not
effective for the financial period ended 31 December 2018 and have not been early adopted (the financial years for
which the adoption is required for the Group are stated in parentheses). The Group has assessed the impact of these
new standards on its financial position and results of operations and they are not expected to have a material impact
on the financial position or results of operations of the Group but may require additional disclosures:
• IFRIC 22, Foreign Currency Transactions and Advance Consideration (2019);
• IFRIC 23, Uncertainty Over Income Tax Treatments (2019);
• Amendments to IAS 1 and IAS 8, Definition of Material (2020);
• Amendments to IAS 12, Income Tax Consequences of Payments on Instruments Classified as Equity (2019);
• Amendments to IAS 19, Plan Amendment, Curtailment or Settlement (2019);
• Amendments to IAS 23, Borrowing Costs Eligible for Capitalisation (2019);
• Amendments to IAS 28, Measuring an Associate or Joint Venture at Fair Value (2019);
• Amendments to IAS 28, Long-term Interests in Associates and Joint Ventures (2019);
• Amendments to IAS 40, Transfers of Investment Property (2019);
• IFRS 15, Revenue from Contracts with Customers and amendments thereto (2019);
• IFRS 16, Leases (2019);
• Amendments to IFRS 2, Classification and Measurement of Share-based Payment Transactions (2019);
• Amendments to IFRS 3, Business Combinations and IFRS 11, Joint Arrangements – Remeasurement of Previously
Held Interests (2019); and
• Amendments to IFRS 3, Definition of a Business (2020).
ANNUAL REPORT 2018 |
OV
ER
VIE
WF
INA
NC
IAL
AN
D O
PE
RA
TIN
G R
EV
IEW
CO
RP
OR
AT
E G
OV
ER
NA
NC
EF
INA
NC
IAL
STA
TE
ME
NT
SA
DD
ITIO
NA
L IN
FO
RM
AT
ION
NOTES TO THE CONSOLIDATED FINANCIAL STATEMENTS AND SIGNIFICANT ACCOUNTING POLICIES

146
2. SIGNIFICANT ACCOUNTING POLICIES (continued)
2.1 Basis of preparation and statement of compliance (continued)
(c) The following relevant new standards and requirements have been issued but are not effective for the financial period
ended 31 December 2018 and have not been early adopted:
• IFRS 9, Financial Instruments, addresses the classification, measurement and recognition of financial assets and
financial liabilities. IFRS 9 requires financial assets to be classified into separate measurement categories: those
measured as at fair value with changes either recognised in profit or loss or in other comprehensive income and
those measured at amortised cost. The determination is made at initial recognition depending on the entity’s
business model for managing its financial instruments and the contractual cash flow characteristics of the
instrument. In addition, a revised expected credit losses model will replace the incurred loss impairment model in
IAS 39. The Group is yet to fully assess the impact of the standard on its financial position and results of operations.
For financial liabilities, the standard retains most of the IAS 39 requirements. The main change is that, in cases
where the fair value option is taken for financial liabilities, part of the fair value change due to an entity’s own credit
risk is recorded in other comprehensive income rather than profit or loss, unless this creates an accounting
mismatch. In addition, the new standard revises the hedge accounting model to more closely align with the entity’s
risk management strategies. The IASB made further changes to two areas of IFRS 9. Financial assets containing
prepayment features with negative compensation can be measured at amortised cost or at fair value through other
comprehensive income if the cash flow represents solely payments of principal and interest. Non-substantial
modifications or exchange of financial liabilities that do not result in derecognition will be required to be recognised
in profit or loss. The Group is yet to fully assess the impact of the above new requirements and changes.
The standard is mandatorily effective for financial periods beginning on or after 1 January 2018 (except for
prepayment features with negative compensation and modifications or exchange of financial liabilities that do not
result in derecognition which will become effective for financial periods beginning on or after 1 January 2019), but
the Group qualifies for a temporary exemption as explained below.
• On 12 September 2016, the IASB issued amendments to IFRS 4, Insurance Contracts, Applying IFRS 9 Financial
Instruments with IFRS 4, which provides two alternative measures to address the different effective dates of IFRS
9 and IFRS 17, Insurance Contracts. These measures include a temporary option for companies whose activities are
predominantly connected with insurance to defer the effective date of IFRS 9 until the earlier of the effective date
of IFRS 17 and financial reporting periods beginning on or after 1 January 2021 (please note below that the IASB
is proposing to defer the effective date of IFRS 17 to 1 January 2022), as well as an approach that allows an entity
to remove from profit or loss the effects of certain accounting mismatches that may occur before IFRS 17 is applied.
Based on the amendments to IFRS 4, the Group is eligible for and will elect to apply the temporary option to defer
the effective date of IFRS 9 in order to implement the changes in parallel with IFRS 17, Insurance Contracts.
| AIA GROUP LIMITED
FINANCIAL STATEMENTS

147
2. SIGNIFICANT ACCOUNTING POLICIES (continued)
2.1 Basis of preparation and statement of compliance (continued)
(c) The following relevant new standards and requirements have been issued but are not effective for the financial period
ended 31 December 2018 and have not been early adopted: (continued)
• IFRS 17, Insurance Contracts (previously IFRS 4 Phase II) will replace the current IFRS 4, Insurance Contracts. IFRS
17 includes fundamental differences to current accounting in both insurance contract measurement and profit
recognition. The general model is based on a discounted cash flow model with a risk adjustment and deferral of
unearned profits. A separate approach applies to insurance contracts that are linked to returns on underlying items
and meet certain requirements. Additionally, IFRS 17 requires more granular information and a new presentation
format for the statement of comprehensive income as well as extensive disclosures. On 12 December 2017, the
Hong Kong Institute of Certified Public Accountants (“HKICPA”) approved the issuance of HKFRS 17, Insurance
Contracts. The Group is in the midst of conducting a detailed assessment of the new standards. The standards are
currently mandatorily effective for financial periods beginning on or after 1 January 2021, however in November
2018, IASB proposed to defer IFRS 17 and temporary IFRS 9 exemption available to insurers until the financial
period beginning on or after 1 January 2022. The proposed deferral is subject to public consultation, which is
expected in 2019. HKICPA has not yet made any announcements related to IASB proposed deferral for IFRS 17.
The significant accounting policies adopted in the preparation of the Group’s consolidated financial statements are set out
below. These policies have been applied consistently in all periods presented.
2.2 Operating profitThe long-term nature of much of the Group’s operations means that, for management’s decision-making and internal
performance management purposes, the Group evaluates its results and its operating segments using a financial
performance measure referred to as “operating profit”. Operating profit includes among others the expected long-term
investment returns for investments in equities and real estate based on the assumptions applied by the Group in the
Supplementary Embedded Value Information. The Group defines operating profit after tax as net profit excluding the
following non-operating items:
• short-term fluctuations between expected and actual investment returns related to equities and real estate;
• other investment return (including short-term fluctuations due to market factors); and
• other significant items that management considers to be non-operating income and expenses.
The Group considers that the presentation of operating profit enhances the understanding and comparability of its
performance and that of its operating segments. The Group considers that trends can be more clearly identified without
the fluctuating effects of these non-operating items, many of which are largely dependent on market factors.
Operating profit is provided as additional information to assist in the comparison of business trends in different reporting
periods on a consistent basis and enhance overall understanding of financial performance.
ANNUAL REPORT 2018 |
OV
ER
VIE
WF
INA
NC
IAL
AN
D O
PE
RA
TIN
G R
EV
IEW
CO
RP
OR
AT
E G
OV
ER
NA
NC
EF
INA
NC
IAL
STA
TE
ME
NT
SA
DD
ITIO
NA
L IN
FO
RM
AT
ION
NOTES TO THE CONSOLIDATED FINANCIAL STATEMENTS AND SIGNIFICANT ACCOUNTING POLICIES

148
2. SIGNIFICANT ACCOUNTING POLICIES (continued)
2.3 Basis of consolidationSubsidiaries
Subsidiaries are all entities (including structured entities) over which the Group has control. A structured entity is an entity
that has been designed so that voting or similar rights are not the dominant factor in deciding who controls the entity, such
as when any voting rights relate to administrative tasks only, and the relevant activities are directed by means of contractual
arrangements. The Group has determined that the investment funds and structured securities, such as collateralised debt
obligations, mortgage-backed securities and other asset-backed securities that the Group has interest are structured
entities.
The Group controls an entity when the Group is exposed to, or has rights to, variable returns from its involvement with the
entity and has the ability to affect those returns through its power over the entity. Subsidiaries are consolidated from the
date on which control is transferred to the Group and are excluded from consolidation from the date at which the Group no
longer has control. Intercompany transactions are eliminated.
The Group utilises the acquisition method of accounting to account for the acquisition of subsidiaries, unless the acquisition
forms part of the Group reorganisation of entities under common control. Under this method, the cost of an acquisition is
measured as the fair value of consideration payable, shares issued or liabilities assumed at the date of acquisition. The
excess of the cost of acquisition over the fair value of the net assets of the subsidiary acquired is recorded as goodwill (see
2.10 below). The Group recognises, separately from goodwill, the identifiable assets acquired, the liabilities assumed and
any non-controlling interest in the subsidiary. Any surplus of the acquirer’s interest in the subsidiary’s net assets over the
cost of acquisition is credited to the consolidated income statement.
The consolidated financial statements of the Group include the assets, liabilities and results of the Company and subsidiaries
in which AIA Group Limited has a controlling interest, using accounts drawn up to the reporting date.
Investment funds
Investment funds in which the Group has interests and power to direct their relevant activities that affect the return of the
funds are consolidated in the financial statements. In conducting the assessment, the Group considers substantive
contractual rights as well as de facto control. De facto control of an entity may arise from circumstances where the Group
does not have more than 50% of the voting power but it has the practical ability to direct the relevant activities of the entity.
If the Group has power to remove or control over the party having the ability to direct the relevant activities of the fund
based on the facts and circumstances and that the Group has exposure to variable returns of the investment funds, they
are consolidated. Variable returns include both rights to the profits or distributions as well as the obligation to absorb
losses of the investees.
Employee share-based trusts
Trusts are set up to acquire shares of the Company for distribution to participants in future periods through the share-based
compensation schemes. The consolidation of these trusts is evaluated in accordance with IFRS 10; where the Group is
deemed to control the trusts, they are consolidated. Shares acquired by the trusts to the extent not provided to the
participants upon vesting are carried at cost and reported as “employee share-based trusts” in the consolidated statement
of financial position, and as a deduction from the equity in the consolidated statement of changes in equity.
| AIA GROUP LIMITED
FINANCIAL STATEMENTS

149
2. SIGNIFICANT ACCOUNTING POLICIES (continued)
2.3 Basis of consolidation (continued)
Non-controlling interests
Non-controlling interests are presented within equity except when they arise through the minority’s interest in puttable
liabilities such as the unit holders’ interest in consolidated investment funds, when they are recognised as a liability,
reflecting the net assets of the consolidated entity.
Acquisitions and disposals of non-controlling interests, except when they arise through the minority’s interest in puttable
liabilities, are treated as transactions between equity holders. As a result, any difference between the acquisition cost or
sale price of the non-controlling interest and the carrying value of the non-controlling interest is recognised as an increase
or decrease in equity.
Associates and joint ventures
Associates are entities over which the Group has significant influence, but which it does not control or joint control.
Generally, it is presumed that the Group has significant influence if it has between 20 per cent and 50 per cent of voting
rights. Joint ventures are entities whereby the Group and other parties undertake an economic activity which is subject to
joint control arising from a contractual agreement.
Gains on transactions between the Group and its associates and joint ventures are eliminated to the extent of the Group’s
interest in the associates and joint ventures. Losses are also eliminated, unless the transaction provides evidence of an
impairment of an asset transferred between entities.
Investments in associates and joint ventures are accounted for using the equity method of accounting. Under this method,
the cost of the investment in an associate or joint venture, together with the Group’s share of that entity’s post-acquisition
changes to equity, is included as an asset in the consolidated statement of financial position. Cost includes goodwill arising
on acquisition. The Group’s share of post-acquisition profits or losses is recognised in the consolidated income statement
and its share of post-acquisition movement in equity is recognised in other comprehensive income. Equity accounting is
discontinued when the Group no longer has significant influence over the investment. If the Group’s share of losses in an
associate or joint venture equals or exceeds its interest in the undertaking, additional losses are provided for, and a liability
recognised, only to the extent that the Group has incurred legal or constructive obligations or made payments on behalf of
the associate or joint venture.
The Company’s investments
In the Company’s statement of financial position, subsidiaries, associates and joint ventures are stated at cost, unless
impaired. The Company’s interests in investment funds such as mutual funds and unit trusts are designated at fair value
through profit or loss.
ANNUAL REPORT 2018 |
OV
ER
VIE
WF
INA
NC
IAL
AN
D O
PE
RA
TIN
G R
EV
IEW
CO
RP
OR
AT
E G
OV
ER
NA
NC
EF
INA
NC
IAL
STA
TE
ME
NT
SA
DD
ITIO
NA
L IN
FO
RM
AT
ION
NOTES TO THE CONSOLIDATED FINANCIAL STATEMENTS AND SIGNIFICANT ACCOUNTING POLICIES

150
2. SIGNIFICANT ACCOUNTING POLICIES (continued)
2.4 Insurance and investment contractsConsistent accounting policies for the measurement and recognition of insurance and investment contracts have been
adopted throughout the Group to substantially all of its business.
In a limited number of cases, the Group measures insurance contract liabilities with reference to statutory requirements in
the applicable jurisdiction.
Product classification
The Group classified its contracts written as either insurance contracts or investment contracts, depending on the level of
insurance risk. Insurance contracts are those contracts that transfer significant insurance risk, while investment contracts
are those contracts without significant insurance risk. Some insurance and investment contracts, referred to as participating
business, have discretionary participation features, “DPF”, which may entitle the customer to receive, as a supplement to
guaranteed benefits, additional non-guaranteed benefits, such as policyholder dividends or bonuses. The Group applies
the same accounting policies for the recognition and measurement of obligations arising from investment contracts with
DPF as it does for insurance contracts.
In the event that a scenario (other than those lacking commercial substance) exists in which an insured event would
require the Group to pay significant additional benefits to its customers, the contract is accounted for as an insurance
contract. For investment contracts that do not contain DPF, IAS 39, Financial Instruments: Measurement and Recognition,
and, if the contract includes an investment management element, IAS 18, Revenue Recognition, are applied. IFRS 4 permits
the continued use of previously applied accounting policies for insurance contracts and investment contracts with DPF,
and this basis has been adopted by the Group in accounting for such contracts. Once a contract has been classified as an
insurance or investment contract, reclassification is not subsequently performed unless the terms of the agreement are
later amended.
Certain contracts with DPF supplement the amount of guaranteed benefits due to policyholders. These contracts are
distinct from other insurance and investment contracts as the Group has discretion in the amount and/or timing of the
benefits declared, and how such benefits are allocated between groups of policyholders. Customers may be entitled to
receive, as a supplement to guaranteed benefits, additional benefits or bonuses:
• that are likely to be a significant portion of the total contractual benefits;
• whose amount or timing is contractually at the discretion of the Group; and
• that are contractually based on:
– the performance of a specified pool of contracts or a specified type of contract;
– realised and/or unrealised investment returns on a specified pool of assets held by the issuer; or
– the profit or loss of the Company, fund or other entity that issues the contract.
| AIA GROUP LIMITED
FINANCIAL STATEMENTS

151
2. SIGNIFICANT ACCOUNTING POLICIES (continued)
2.4 Insurance and investment contracts (continued)
Product classification (continued)
The Group applies the same accounting policies for the recognition and measurement of obligations and the deferral of
acquisition costs arising from investment contracts with DPF as it does to insurance contracts. The Group refers to such
contracts as participating business. In some jurisdictions participating business is written in a participating fund which is
distinct from the other assets of the Company or branch. The allocation of benefits from the assets held in such participating
funds is subject to minimum policyholder participation mechanisms which are established by regulation. The extent of
such policyholder participation may change over time. The current policyholder participation in declared dividends for
locations with participating funds is set out below:
Country Current policyholder participation
Singapore 90%
Malaysia 90%
China 70%
Australia 80%
Brunei 80%
In some jurisdictions participating business is not written in a distinct fund and the Group refers to this as other participating
business.
ANNUAL REPORT 2018 |
OV
ER
VIE
WF
INA
NC
IAL
AN
D O
PE
RA
TIN
G R
EV
IEW
CO
RP
OR
AT
E G
OV
ER
NA
NC
EF
INA
NC
IAL
STA
TE
ME
NT
SA
DD
ITIO
NA
L IN
FO
RM
AT
ION
NOTES TO THE CONSOLIDATED FINANCIAL STATEMENTS AND SIGNIFICANT ACCOUNTING POLICIES

152
2. SIGNIFICANT ACCOUNTING POLICIES (continued)
2.4 Insurance and investment contracts (continued)
Product classification (continued)
The Group’s products may be divided into the following main categories:
Basis of accounting for:
Policy type Description of benefits payable Insurance contract liabilitiesInvestment contract liabilities
Traditional participating life assurance with DPF
Participating funds Participating products include protection and savings elements. The basic sum assured, payable on death or maturity, may be enhanced by dividends or bonuses, the aggregate amount of which is determined by the performance of a distinct fund of assets and liabilities
The timing of dividend and bonus declarations is at the discretion of the insurer. Local regulations generally prescribe a minimum proportion of policyholder participation in declared dividends
Insurance contract liabilities make provision for the present value of guaranteed benefits less estimated future net premiums to be collected from policyholders. In addition, an insurance liability is recorded for the proportion of the net assets of the participating funds that would be allocated to policyholders, assuming all performance would be declared as a dividend based upon local regulations
Not applicable, as IFRS 4 permits contracts with DPF to be accounted for as insurance contracts
Other participating business
Participating products include protection and savings elements. The basic sum assured, payable on death or maturity, may be enhanced by dividends or bonuses, the timing or amount of which are at the discretion of the insurer taking into account factors such as investment experience
Insurance contract liabilities make provision for the present value of guaranteed benefits and non-guaranteed participation less estimated future net premiums to be collected from policyholders
Not applicable, as IFRS 4 permits contracts with DPF to be accounted for as insurance contracts
Non-participating life assurance, annuities and other protection products
Benefits payable are not at the discretion of the insurer
Insurance contract liabilities reflect the present value of future policy benefits to be paid less the present value of estimated future net premiums to be collected from policyholders. In addition, deferred profit liabilities for limited payment contracts are recognised
Investment contract liabilities are measured at amortised cost
Universal life Benefits are based on an account balance, credited with interest at a rate set by the insurer, and a death benefit, which may be varied by the customer
Insurance contract liabilities reflect the accumulation value, representing premiums received and investment return credited, less deductions for front-end loads, mortality and morbidity costs and expense charges. In addition, liabilities for unearned revenue and additional insurance benefits are recorded
Not applicable as such contracts generally contain significant insurance risk
Unit-linked These may be primarily savings products or may combine savings with an element of protection
Insurance contract liabilities reflect the accumulation value, representing premiums received and investment return credited, less deductions for front-end loads, mortality and morbidity costs and expense charges. In addition, liabilities for unearned revenue and additional insurance benefits are recorded
Investment contract liabilities are measured at fair value (determined with reference to the accumulation value)
In the notes to the financial statements, unit-linked contracts are presented together with pension contracts for disclosure
purposes.
| AIA GROUP LIMITED
FINANCIAL STATEMENTS

153
2. SIGNIFICANT ACCOUNTING POLICIES (continued)
2.4 Insurance and investment contracts (continued)
Product classification (continued)
The basis of accounting for insurance and investment contracts is discussed in notes 2.4.1 and 2.4.2 below.
2.4.1 Insurance contracts and investment contracts with DPF
PremiumsPremiums from life insurance contracts, including participating policies and annuity policies with life contingencies, are
recognised as revenue when due from the policyholder. Benefits and expenses are provided in respect of such revenue so
as to recognise profits over the estimated life of the policies. For limited pay contracts, premiums are recognised in profit
or loss when due, with any excess profit deferred and recognised in income in a constant relationship to the insurance
in-force or, for annuities, the amount of expected benefit payments.
Amounts collected as premiums from insurance contracts with investment features but with sufficient insurance risk to be
considered insurance contracts, such as universal life, and certain unit-linked contracts, are accumulated as deposits.
Revenue from these contracts consists of policy fees for the cost of insurance, administration, and surrenders during the
period.
Upfront fees are recognised over the estimated life of the contracts to which they relate. Policy benefits and claims that are
charged to expenses include benefit claims incurred in the period in excess of related policyholder contract deposits and
interest credited to policyholder deposits.
Unearned revenue liabilityUnearned revenue liability represents upfront fees and other non-level charges that have been collected and released to
the consolidated income statement over the estimated life of the business. A separate liability for accumulation value is
established.
Deferred profit liabilityDeferred profit liability arising from traditional insurance contracts represents excess profits that have been collected and
released to the consolidated income statement over the estimated life of the business. A separate liability for future policy
benefits is established.
Deferred acquisition costsThe costs of acquiring new insurance contracts, including commissions and distribution costs, underwriting and other
policy issue expenses which vary with and are primarily related to the production of new business or renewal of existing
business, are deferred as an asset. Deferred acquisition costs are assessed for recoverability in the year of policy issue to
ensure that these costs are recoverable out of the estimated future margins to be earned on the policy. Deferred acquisition
costs are assessed for recoverability at least annually thereafter. Future investment income is also taken into account in
assessing recoverability. To the extent that acquisition costs are not considered to be recoverable at inception or thereafter,
these costs are expensed in the consolidated income statement.
Deferred acquisition costs for life insurance and annuity policies are amortised over the expected life of the contracts as a
constant percentage of expected premiums. Expected premiums are estimated at the date of policy issue and are
consistently applied throughout the life of the contract unless a deficiency occurs when performing liability adequacy
testing (see below).
Deferred acquisition costs for universal life and unit-linked contracts are amortised over the expected life of the contracts
based on a constant percentage of the present value of estimated gross profits expected to be realised over the life of the
contract or on a straight-line basis. Estimated gross profits include expected amounts to be assessed for mortality,
administration, investment and surrenders, less benefit claims in excess of policyholder balances, administrative expenses
and interest credited. Estimated gross profits are revised regularly. The interest rate used to compute the present value of
revised estimates of expected gross profits is the latest revised rate applied to the remaining benefit period. Deviations of
actual results from estimated experience are reflected in earnings.
ANNUAL REPORT 2018 |
OV
ER
VIE
WF
INA
NC
IAL
AN
D O
PE
RA
TIN
G R
EV
IEW
CO
RP
OR
AT
E G
OV
ER
NA
NC
EF
INA
NC
IAL
STA
TE
ME
NT
SA
DD
ITIO
NA
L IN
FO
RM
AT
ION
NOTES TO THE CONSOLIDATED FINANCIAL STATEMENTS AND SIGNIFICANT ACCOUNTING POLICIES

154
2. SIGNIFICANT ACCOUNTING POLICIES (continued)
2.4 Insurance and investment contracts (continued)
Product classification (continued)
2.4.1 Insurance contracts and investment contracts with DPF (continued)
Deferred sales inducementsDeferred sales inducements, consisting of day one bonuses, persistency bonuses and enhanced crediting rates are deferred
and amortised using the same methodology and assumptions used to amortise acquisition costs when:
• the sales inducements are recognised as part of insurance contract liabilities;
• they are explicitly identified in the contract on inception;
• they are incremental to amounts credited on similar contracts without sales inducements; and
• they are higher than the expected ongoing crediting rates for periods after the inducement.
UnbundlingThe deposit component of an insurance contract is unbundled when both of the following conditions are met:
• the deposit component (including any embedded surrender option) can be measured separately (i.e. without taking
into account the insurance component); and
• the Group’s accounting policies do not otherwise require the recognition of all obligations and rights arising from the
deposit component.
BifurcationTo the extent that certain of the Group’s insurance contracts include embedded derivatives that are not clearly and closely
related to the host contract, these are bifurcated from the insurance contracts and accounted for as derivatives.
Benefits and claimsInsurance contract benefits reflect the cost of all maturities, surrenders, withdrawals and claims arising during the period,
as well as policyholder dividends accrued in anticipation of dividend declarations.
Accident and health claims incurred include all losses occurring during the period, whether reported or not, related
handling costs, a reduction for recoveries, and any adjustments to claims outstanding from previous years.
Claims handling costs include internal and external costs incurred in connection with the negotiation and settlement of
claims, and are included in operating expenses.
Insurance contract liabilities (including liabilities in respect of investment contracts with DPF)Insurance contract liabilities represent the estimated future policyholder benefit liability for life insurance policies.
Future policy benefits for life insurance policies are calculated using a net level premium valuation method which
represents the present value of estimated future policy benefits to be paid, less the present value of estimated future net
premiums to be collected from policyholders.
For contracts with an explicit account balance, such as universal life and unit-linked contracts, insurance contract liabilities
are equal to the accumulation value, which represents premiums received and investment returns credited to the policy
less deductions for mortality and morbidity costs and expense charges.
Settlement options are accounted for as an integral component of the underlying insurance or investment contract unless
they provide annuitisation benefits, in which case an additional liability is established to the extent that the present value
of expected annuitisation payments at the expected annuitisation date exceeds the expected account balance at that date.
Where settlement options have been issued with guaranteed rates less than market interest rates, the insurance or
investment contract liability does not reflect any provision for subsequent declines in market interest rates unless a
deficiency is identified through liability adequacy testing.
| AIA GROUP LIMITED
FINANCIAL STATEMENTS

155
2. SIGNIFICANT ACCOUNTING POLICIES (continued)
2.4 Insurance and investment contracts (continued)
Product classification (continued)
2.4.1 Insurance contracts and investment contracts with DPF (continued)
Insurance contract liabilities (including liabilities in respect of investment contracts with DPF) (continued)
The Group accounts for insurance contract liabilities for participating business written in participating funds by establishing
a liability for the present value of guaranteed benefits less estimated future net premiums to be collected from policyholders.
In addition, an insurance liability is recorded for the proportion of the net assets of the participating funds that would be
allocated to policyholders assuming all relevant surplus at the date of the consolidated statement of financial position
were to be declared as a policyholder dividend based upon applicable regulations. The Group accounts for other
participating business by establishing a liability for the present value of guaranteed benefits and non-guaranteed
participation, less estimated future net premiums to be collected from policyholders.
Liability adequacy testingThe adequacy of liabilities is assessed by portfolio of contracts, in accordance with the Group’s manner of acquiring,
servicing and measuring the profitability of its insurance contracts. Liability adequacy testing is performed for each
reportable segment.
For traditional life insurance contracts, insurance contract liabilities reduced by deferred acquisition costs and value of
business acquired on acquired insurance contracts, are compared to the gross premium valuation calculated on a best
estimate basis, as of the valuation date. If there is a deficiency, the unamortised balance of deferred acquisition cost and
value of business acquired on acquired insurance contracts are written down to the extent of the deficiency. If, after writing
down the unamortised balance for the specific portfolio of contracts to nil, a deficiency still exists, the net liability is
increased by the amount of the remaining deficiency.
For universal life and investment contracts, deferred acquisition costs, net of unearned revenue liabilities, are compared to
estimated gross profits. If a deficiency exists, deferred acquisition costs are written down.
Financial guaranteesFinancial guarantees are regarded as insurance contracts. Liabilities in respect of such contracts are recognised when loss
is incurred.
2.4.2 Investment contracts
Investment contracts do not contain sufficient insurance risk to be considered insurance contracts and are accounted for
as a financial liability, other than investment contracts with DPF which are excluded from the scope of IAS 39 and are
accounted for as insurance contracts.
Revenue from these contracts consists of various charges (policy fees, handling fees, management fees and surrender
charges) made against the contract for the cost of insurance, expenses and early surrender. First year charges are amortised
over the life of the contract as the services are provided.
Investment contract fee revenueCustomers are charged fees for policy administration, investment management, surrenders or other contract services. The
fees may be fixed amounts or vary with the amounts being managed, and will generally be charged as an adjustment to the
policyholder’s account balance. The fees are recognised as revenue in the period in which they are received unless they
relate to services to be provided in future periods, in which case they are deferred and recognised as the service is provided.
Origination and other “upfront” fees (fees that are assessed against the account balance as consideration for origination of
the contract) are charged on some non-participating investment and pension contracts. Where the investment contract is
recorded at amortised cost, these fees are amortised and recognised over the expected term of the policy as an adjustment
to the effective yield. Where the investment contract is measured at fair value, the front-end fees that relate to the provision
of investment management services are amortised and recognised as the services are provided.
ANNUAL REPORT 2018 |
OV
ER
VIE
WF
INA
NC
IAL
AN
D O
PE
RA
TIN
G R
EV
IEW
CO
RP
OR
AT
E G
OV
ER
NA
NC
EF
INA
NC
IAL
STA
TE
ME
NT
SA
DD
ITIO
NA
L IN
FO
RM
AT
ION
NOTES TO THE CONSOLIDATED FINANCIAL STATEMENTS AND SIGNIFICANT ACCOUNTING POLICIES

156
2. SIGNIFICANT ACCOUNTING POLICIES (continued)
2.4 Insurance and investment contracts (continued)
Product classification (continued)
2.4.2 Investment contracts (continued)
Deferred origination costsThe costs of acquiring investment contracts with investment management services, including commissions and other
incremental expenses directly related to the issue of each new contract, are deferred and amortised over the period that
services are provided. Deferred origination costs are tested for recoverability at each reporting date.
The costs of acquiring new investment contracts without investment management services are included as part of the
effective interest rate used to calculate the amortised cost of the related investment contract liabilities.
Investment contract liabilitiesDeposits received in respect of investment contracts are not accounted for through the consolidated income statement,
except for the investment income and fees attributable to those contracts, but are accounted for directly through the
consolidated statement of financial position as an adjustment to the investment contract liability, which reflects the
account balance.
The majority of the Group’s contracts classified as investment contracts are unit-linked contracts, with measurement
directly linked to the underlying investment assets. These represent investment portfolios maintained to meet specific
investment objectives of policyholders who generally bear the credit and market risks on those investments. The liabilities
are carried at fair value determined with reference to the accumulation value (current unit value) with changes recognised
in profit or loss. The costs of policy administration, investment management, surrender charges and certain policyholder
taxes assessed against customers’ account balances are included in revenue, and accounted for as described under
“Investment contract fee revenue” above.
Non unit-linked investment contract liabilities are carried at amortised cost, being the fair value of consideration received
at the date of initial recognition, less the net effect of principal payments such as transaction costs and front-end fees, plus
or minus the cumulative amortisation using the effective interest method of any difference between that initial amount and
the maturity value, and less any write-down for surrender payments. The effective interest rate equates the discounted
cash payments to the initial amount. At each reporting date, the unearned revenue liability is determined as the value of
the future best estimate cash flows discounted at the effective interest rate. Any adjustment is immediately recognised as
income or expense in the consolidated income statement.
The amortised cost of the financial liability is never recorded at less than the amount payable on surrender, discounted for
the time value of money where applicable, if the investment contract is subject to a surrender option.
Deferred fee income liabilityDeferred fee income liability represents upfront fees and other non-level charges that have been collected and released to
the consolidated income statement over the estimated life of the business. A separate liability for accumulation value is
established.
| AIA GROUP LIMITED
FINANCIAL STATEMENTS
157
2. SIGNIFICANT ACCOUNTING POLICIES (continued)
2.4 Insurance and investment contracts (continued)
Product classification (continued)
2.4.3 Insurance and investment contracts
ReinsuranceThe Group cedes reinsurance in the normal course of business, with retentions varying by line of business. The cost of
reinsurance is accounted for over the life of the underlying reinsured policies, using assumptions consistent with those
used to account for such policies.
Premiums ceded and claims reimbursed are presented on a gross basis in the consolidated income statement and
statement of financial position.
Reinsurance assets consist of amounts receivable in respect of ceded insurance liabilities. Amounts recoverable from
reinsurers are estimated in a manner consistent with the reinsured insurance or investment contract liabilities or benefits
paid and in accordance with the relevant reinsurance contract.
To the extent that reinsurance contracts principally transfer financial risk (as opposed to insurance risk) they are accounted
for directly through the consolidated statement of financial position and are not included in reinsurance assets or liabilities.
A deposit asset or liability is recognised, based on the consideration paid or received less any explicitly identified premiums
or fees to be retained by the reinsured.
If a reinsurance asset is impaired, the Group reduces the carrying amount accordingly and recognises that impairment loss
in the consolidated income statement. A reinsurance asset is impaired if there is objective evidence, as a result of an event
that occurred after initial recognition of the reinsurance asset, that the Group may not receive all amounts due to it under
the terms of the contract, and the impact on the amounts that the Group will receive from the reinsurer can be reliably
measured.
The upfront premium rebate received on reinsurance contracts is a reinsurance liability. This liability is initially recognised
as a reduction in deferred acquisition and origination costs up to the carrying value of associated deferred acquisition
costs or associated value of business acquired, if any, with any excess being recognised in other liabilities. This reinsurance
liability is released in line with the release of the underlying insurance contracts. Change in this reinsurance liability during
the period is recognised as insurance and investment contract benefits ceded.
Value of business acquired (VOBA)The VOBA in respect of a portfolio of long-term insurance and investment contracts, either directly or through the purchase
of a subsidiary, is recognised as an asset. If this results from the acquisition of an investment in a joint venture or an
associate, the VOBA is held within the carrying amount of that investment. In all cases, the VOBA is amortised over the
estimated life of the contracts in the acquired portfolio on a systematic basis. The rate of amortisation reflects the profile
of the value of in-force business acquired. The carrying value of VOBA is reviewed annually for impairment and any
reduction is charged to the consolidated income statement.
Shadow accountingShadow accounting is applied to insurance and certain investment contracts with discretionary participation feature
where financial assets backing insurance and investment contract liabilities are classified as available for sale. Shadow
accounting is applied to deferred acquisition costs, VOBA, deferred origination costs and the contract liabilities for
investment contracts with DPF to take into account the effect of unrealised gains or losses on insurance liabilities or assets
that are recognised in other comprehensive income in the same way as for a realised gain or loss recognised in the
consolidated income statement. Such assets or liabilities are adjusted with corresponding charges or credits recognised
directly in shareholders’ equity as a component of the related unrealised gains and losses.
Other assessments and leviesThe Group is potentially subject to various periodic insurance-related assessments or guarantee fund levies. Related
provisions are established where there is a present obligation (legal or constructive) as a result of a past event. Such
amounts are not included in insurance or investment contract liabilities but are included under “Provisions” in the
consolidated statement of financial position.
ANNUAL REPORT 2018 |
OV
ER
VIE
WF
INA
NC
IAL
AN
D O
PE
RA
TIN
G R
EV
IEW
CO
RP
OR
AT
E G
OV
ER
NA
NC
EF
INA
NC
IAL
STA
TE
ME
NT
SA
DD
ITIO
NA
L IN
FO
RM
AT
ION
NOTES TO THE CONSOLIDATED FINANCIAL STATEMENTS AND SIGNIFICANT ACCOUNTING POLICIES

158
2. SIGNIFICANT ACCOUNTING POLICIES (continued)
2.5 Financial instruments2.5.1 Classification of and designation of financial instruments
Financial assets and liabilities at fair value through profit or lossFinancial assets and liabilities at fair value through profit or loss comprise two categories:
• financial assets or liabilities designated at fair value through profit or loss upon initial recognition; and
• financial assets or liabilities classified as held for trading.
Management designates financial assets and liabilities at fair value through profit or loss if this eliminates a measurement
inconsistency or if the related assets and liabilities are actively managed on a fair value basis, including:
• financial assets held to back unit-linked contracts and participating funds;
• other financial assets managed on a fair value basis; consisting of the Group’s equity portfolio and investments held by
the Group’s fully consolidated investment funds; and
• compound instruments containing an embedded derivative, where the embedded derivative would otherwise require
bifurcation.
Financial assets and liabilities classified as held for trading include financial assets acquired principally for the purpose of
selling them in the near future and those that form part of a portfolio of financial assets in which there is evidence of
short-term profit taking, as well as derivative assets and liabilities.
Dividend income from equity instruments designated at fair value through profit or loss is recognised in investment income
in the consolidated income statement, generally when the security becomes ex-dividend. Interest income is recognised on
an accrued basis. For all financial assets designated at fair value through profit or loss, changes in fair value are recognised
in investment experience.
Transaction costs in respect of financial assets and liabilities at fair value through profit or loss are expensed as they are
incurred.
Available for sale financial assetsFinancial assets, other than those at fair value through profit or loss, and loans and receivables, are classified as available
for sale.
The available for sale category is used where the relevant investments backing insurance and investment contract liabilities
and shareholders’ equity are not managed on a fair value basis. These principally consist of the Group’s debt securities
(other than those backing participating funds and unit-linked contracts). Available for sale financial assets are initially
recognised at fair value plus attributable transaction costs. For available for sale debt securities, the difference between
their cost and par value is amortised. Available for sale financial assets are subsequently measured at fair value. Interest
income from debt securities classified as available for sale is recognised in investment income in the consolidated income
statement using the effective interest method.
Unrealised gains and losses on securities classified as available for sale are analysed between differences resulting from
foreign currency translation, and other fair value changes. Foreign currency translation differences on monetary available
for sale investments, such as debt securities are calculated as if they were carried at amortised cost and so are recognised
in the consolidated income statement as investment experience. For impairments of available for sale financial assets,
reference is made to the section “Impairment of financial assets”.
Changes in the fair value of securities classified as available for sale, except for impairment losses and relevant foreign
exchange gains and losses, are recognised in other comprehensive income and accumulated in a separate fair value
reserve within equity. Impairment losses and relevant foreign exchange gains and losses are recognised in the income
statement.
Realised gains and losses on financial assetsRealised gains and losses on available for sale financial assets are determined as the difference between the sale proceeds
and amortised cost. Amortised cost is determined by specific identification.
| AIA GROUP LIMITED
FINANCIAL STATEMENTS

159
2. SIGNIFICANT ACCOUNTING POLICIES (continued)
2.5 Financial instruments (continued)
2.5.1 Classification of and designation of financial instruments (continued)
Recognition of financial instrumentsPurchases and sales of financial instruments are recognised on the trade date, which is the date at which the Group
commits to purchase or sell the assets.
Derecognition and offset of financial assetsFinancial assets are derecognised when the rights to receive cash flows from the financial assets have expired or where
the Group has transferred substantially all risks and rewards of ownership. If the Group neither transfers nor retains
substantially all the risks and rewards of ownership of a financial asset, it derecognises the financial asset if it no longer
has control over the asset. In transfers where control over the asset is retained, the Group continues to recognise the asset
to the extent of its continuing involvement. The extent of continuing involvement is determined by the extent to which the
Group is exposed to changes in the fair value of the asset.
Financial assets and liabilities are offset and the net amount reported in the consolidated statement of financial position
only when there is a legally enforceable right to offset the recognised amounts and there is an intention to settle on a net
basis, or realise the asset and settle the liability simultaneously.
Loans and receivablesLoans and receivables are non-derivative financial assets with fixed or determinable payments that are not quoted in an
active market. They are initially recognised at fair value plus transaction costs. Subsequently, they are carried at amortised
cost using the effective interest method less any impairment losses. Interest income from loans and receivables is
recognised in investment income in the consolidated income statement using the effective interest method.
Term depositsDeposits include time deposits with financial institutions which do not meet the definition of cash and cash equivalents as
their maturity at acquisition exceeds three months. Certain of these balances are subject to regulatory or other restriction
as disclosed in note 20 Loans and deposits. Deposits are stated at amortised cost using the effective interest method.
Cash and cash equivalentsCash and cash equivalents include cash in hand, deposits held at call with banks and other short-term highly liquid
investments with maturities at acquisition of three months or less, which are held for cash management purposes. Cash
and cash equivalents also include cash received as collateral for derivative transactions, and repo and reverse repo
transactions, as well as cash and cash equivalents held for the benefit of policyholders in connection with unit-linked
products. Cash and cash equivalents are measured at amortised cost using the effective interest method.
2.5.2 Fair values of non-derivative financial instruments
The fair value of a financial instrument is the amount that would be received to sell an asset or paid to transfer a liability in
an orderly transaction between market participants at the measurement date, having regard to the specific characteristics
of the asset or liability concerned, assuming that the transfer takes place in the most advantageous market to which the
Group has access. The fair values of financial instruments traded in active markets (such as financial instruments at fair
value through profit or loss and available for sale securities) are based on quoted market prices at the date of the
consolidated statement of financial position. The quoted market price used for financial assets held by the Group is the
current bid price, which is considered to be the price within the bid-ask spread that is most representative of the fair value
in the circumstances. The fair values of financial instruments that are not traded in active markets are determined using
valuation techniques. The Group uses a variety of methods and makes assumptions that are based on market conditions at
the date of each consolidated statement of financial position. The objective of using a valuation technique is to estimate
the price at which an orderly transaction would take place between market participants at the date of the consolidated
statement of financial position.
Financial instruments carried at fair value are measured using a fair value hierarchy described in note 22.
ANNUAL REPORT 2018 |
OV
ER
VIE
WF
INA
NC
IAL
AN
D O
PE
RA
TIN
G R
EV
IEW
CO
RP
OR
AT
E G
OV
ER
NA
NC
EF
INA
NC
IAL
STA
TE
ME
NT
SA
DD
ITIO
NA
L IN
FO
RM
AT
ION
NOTES TO THE CONSOLIDATED FINANCIAL STATEMENTS AND SIGNIFICANT ACCOUNTING POLICIES

160
2. SIGNIFICANT ACCOUNTING POLICIES (continued)
2.5 Financial instruments (continued)
2.5.3 Impairment of financial assets
GeneralFinancial assets are assessed for impairment on a regular basis. The Group assesses at each reporting date whether there
is objective evidence that a financial asset or group of financial assets is impaired. A financial asset, or group of financial
assets, is impaired and impairment losses are incurred only if there is objective evidence of impairment as a result of one
or more events that have occurred after the initial recognition of the asset (a loss event) and that loss event (or events) has
an impact on the estimated future cash flows of the financial asset or group of financial assets that can be reliably
estimated.
For loans and receivables, the Group first assesses whether objective evidence of impairment exists for financial assets
that are individually significant. If the Group determines that objective evidence of impairment does not exist for an
individually assessed financial asset, whether significant or not, it includes the asset in a group of financial assets with
similar credit risk characteristics and collectively assesses them for impairment. Assets that are individually assessed for
impairment and for which an impairment loss is or continues to be recognised are not included in a collective assessment
of impairment.
Available for sale financial instrumentsWhen a decline in the fair value of an available for sale asset has been recognised in other comprehensive income and
there is objective evidence that the asset is impaired, the cumulative loss already recognised directly in other comprehensive
income is recognised in current period profit or loss.
If the fair value of a debt instrument classified as available for sale increases in a subsequent period, and the increase can
be objectively related to an event occurring after the impairment loss was recognised in profit or loss, the impairment loss
is reversed through profit or loss. Where, following the recognition of an impairment loss in respect of an available for sale
debt security, the asset suffers further falls in value, such further falls are recognised as an impairment only in the case
when objective evidence exists of a further impairment event to which the losses can be attributed.
Loans and receivablesFor loans and receivables, impairment is considered to have taken place if it is probable that the Group will not be able to
collect principal and/or interest due according to the contractual terms of the instrument. When impairment is determined
to have occurred, the carrying amount is decreased through a charge to profit or loss. The carrying amount of mortgage
loans or receivables is reduced through the use of an allowance account, and the amount of any allowance is recognised
as an impairment loss in profit or loss.
2.5.4 Derivative financial instruments
Derivative financial instruments primarily include foreign exchange contracts and interest rate swaps that derive their
value mainly from underlying foreign exchange rates and interest rates. All derivatives are initially recognised in the
consolidated statement of financial position at their fair value, which represents their cost excluding transaction costs,
which are expensed, giving rise to a day one loss. They are subsequently remeasured at their fair value, with movements in
this value recognised in profit or loss. Fair values are obtained from quoted market prices or, if these are not available, by
using valuation techniques such as discounted cash flow models or option pricing models. All derivatives are carried as
assets when the fair values are positive and as liabilities when the fair values are negative.
Derivative instruments for economic hedgingWhilst the Group enters into derivative transactions to provide economic hedges under the Group’s risk management
framework, it adopts hedge accounting to these transactions only in limited circumstances. This is either because the
transactions would not meet the specific IFRS rules to be eligible for hedge accounting or the documentation requirements
to meet hedge accounting criteria would be unduly onerous. Where hedge accounting does not apply, these transactions
are treated as held for trading and fair value movements are recognised immediately in investment experience.
| AIA GROUP LIMITED
FINANCIAL STATEMENTS

161
2. SIGNIFICANT ACCOUNTING POLICIES (continued)
2.5 Financial instruments (continued)
2.5.4 Derivative financial instruments (continued)
Embedded derivativesEmbedded derivatives are derivatives embedded within other non-derivative host financial instruments to create hybrid
instruments. Where the economic characteristics and risks of the embedded derivatives are not closely related to the
economic characteristics and risks of the host instrument, and where the hybrid instrument is not measured at fair value
with changes in fair value recognised in profit or loss, the embedded derivative is bifurcated and carried at fair value as a
derivative in accordance with IAS 39.
2.6 Segment reportingAn operating segment is a component of the Group that engages in business activity from which it earns revenues and
incurs expenses and, for which, discrete financial information is available, and whose operating results are regularly
reviewed by the Group’s chief operating decision-maker, considered to be the Executive Committee of the Group (ExCo).
2.7 Foreign currency translationIncome statements and cash flows of foreign entities are translated into the Group’s presentation currency at average
exchange rates for the period as this approximates to the exchange rates prevailing at the transaction date. Their statements
of financial position are translated at year or period end exchange rates. Exchange differences arising from the translation
of the net investment in foreign operations, are taken to the currency translation reserve within equity. On disposal of a
foreign operation, such exchange differences are transferred out of this reserve and are recognised in the consolidated
income statement as part of the gain or loss on sale.
Foreign currency transactions are accounted for at the exchange rates prevailing at the date of the transactions. Gains and
losses resulting from the settlement of such transactions, and from the translation of monetary assets and liabilities
denominated in foreign currencies into functional currency, are recognised in the consolidated income statement.
Translation differences on financial assets designated at fair value through profit or loss are included in investment
experience. For monetary financial assets classified as available for sale, translation differences are calculated as if they
were carried at amortised cost and so are recognised in the consolidated income statement. Foreign exchange movements
on non-monetary equities that are accounted for as available for sale are included in the fair value reserve.
2.8 Property, plant and equipmentProperty held for own use is carried at fair value at last valuation date less accumulated depreciation. When an asset is
adjusted for the latest fair value, any accumulated depreciation at the date of valuation is eliminated against the gross
carrying amount of the asset. The movement of fair values is generally recognised in other comprehensive income. When
such properties are sold, the amounts accumulated in other comprehensive income are transferred to retained earnings.
The Group records its interest in leasehold land and land use rights associated with property held for own use separately
as operating leases or finance leases depending on whether substantially all the risks and rewards incidental to ownership
of the land are transferred to the Group. Those interests classified as finance leases are reported as a component of the
property held for own use and carried at fair value at last valuation date. The prepayments to acquire leasehold land
classified as operating leases are recorded at original cost within “Other assets” and amortised over the term of the lease
(see note 2.19).
Plant and equipment are stated at historical cost less accumulated depreciation and any accumulated impairment losses.
Historical cost includes expenditure that is directly attributable to the acquisition of the items.
ANNUAL REPORT 2018 |
OV
ER
VIE
WF
INA
NC
IAL
AN
D O
PE
RA
TIN
G R
EV
IEW
CO
RP
OR
AT
E G
OV
ER
NA
NC
EF
INA
NC
IAL
STA
TE
ME
NT
SA
DD
ITIO
NA
L IN
FO
RM
AT
ION
NOTES TO THE CONSOLIDATED FINANCIAL STATEMENTS AND SIGNIFICANT ACCOUNTING POLICIES

162
2. SIGNIFICANT ACCOUNTING POLICIES (continued)
2.8 Property, plant and equipment (continued)
Depreciation is calculated using the straight-line method to allocate cost less any residual value over the estimated useful
life, generally:
Fixtures, fittings and office equipment 5 years
Buildings 20-40 years
Computer hardware and other assets 3-5 years
Freehold land No depreciation
Subsequent costs are included in the carrying amount or recognised as a separate asset, as appropriate, when it is probable
that future economic benefits will flow to the Group. Repairs and maintenance are charged to the consolidated income
statement during the financial period in which they are incurred.
Residual values and useful lives are reviewed and adjusted, if applicable, at each reporting date. An asset is written down
to its recoverable amount if the carrying value is greater than the estimated recoverable amount.
Any gain and loss arising on disposal of property, plant and equipment is measured as the difference between the net sale
proceeds and the carrying amount of the relevant asset, and is recognised in the consolidated income statement.
2.9 Investment propertyProperty held for long-term rental or capital appreciation, or both that is not occupied by the Group is classified as
investment property. Investment property, including land and buildings, is initially recognised at cost with changes in fair
values in subsequent periods recognised in the consolidated income statement.
If an investment property becomes held for own use, it is reclassified as property, plant and equipment. Where a property
is partly used as an investment property and partly for the use by the Group, these elements are recorded separately within
investment property and property, plant and equipment respectively, where the component used as investment property
would be capable of separate sale or finance lease.
2.10 Goodwill and other intangible assetsGoodwillGoodwill represents the excess of the cost of an acquisition over the fair value of the Group’s share of the net identifiable
assets of the acquired subsidiary, associate or joint venture at the date of acquisition. Goodwill on acquisitions prior to 1
December 2006 (the date of transition to IFRS) is carried at book value (original cost less cumulative amortisation) on that
date, less any impairment subsequently incurred. Goodwill arising on the Group’s investment in subsidiaries since that date
is shown as a separate asset and is carried at cost less any accumulated impairment losses, whilst that on associates and
joint ventures is included within the carrying value of those investments. All acquisition-related costs are expensed as
incurred.
Other intangible assetsOther intangible assets consist primarily of acquired computer software and contractual relationships, such as access to
distribution networks, and are amortised over their estimated useful lives. The amortisation charge for rights to access
distribution networks is included in the consolidated income statement under “Commission and other acquisition
expenses”.
Acquired computer software licences are capitalised on the basis of the costs incurred to acquire and bring to use the
specific software. Costs directly associated with the internal production of identifiable and unique software by the Group
that will generate economic benefits exceeding those costs over a period greater than a year, are recognised as intangible
assets. All other costs associated with developing or maintaining computer software programmes are recognised as an
expense as incurred. Costs of acquiring computer software licences and incurred in the internal production of computer
software are amortised using the straight-line method over the estimated useful life of the software, which does not
generally exceed a period of 3 to 15 years. The amortisation charge for the period is included in the consolidated income
statement under “Operating expenses”.
| AIA GROUP LIMITED
FINANCIAL STATEMENTS

163
2. SIGNIFICANT ACCOUNTING POLICIES (continued)
2.11 Impairment of non-financial assetsProperty, plant and equipment, goodwill and other non-financial assets are reviewed for impairment whenever events or
changes in circumstances indicate that the carrying amount may not be recoverable. An impairment loss is recognised to
the extent that the carrying amount of the asset exceeds its recoverable amount, which is the higher of the fair value of the
asset less cost to sell and value in use. For the purposes of assessing impairment, assets are allocated to each of the
Group’s cash-generating units, or group of cash-generating units, the lowest level for which there are separately identifiable
cash flows. The carrying values of goodwill and intangible assets with indefinite useful lives are reviewed at least annually
or when circumstances or events indicate that there may be uncertainty over this value.
The Group assesses at the end of each reporting period whether there is any objective evidence that its investments in
associates and joint ventures are impaired. Such objective evidence includes whether there has been any significant
adverse changes in the technological, market, economic or legal environment in which the associates and joint ventures
operate or whether there has been a significant or prolonged decline in value below their cost. If there is an indication that
an interest in an associate or a joint venture is impaired, the Group assesses whether the entire carrying amount of the
investment (including goodwill) is recoverable. An impairment loss is recognised in profit or loss for the amount by which
the carrying amount is lower than the higher of the investment’s fair value less costs to sell or value in use. Any reversal of
such impairment loss in subsequent periods is reversed through profit or loss.
In the statement of financial position of the Company, impairment testing of the investments in subsidiaries, associates and
joint ventures is required upon receiving dividends from these investments if the dividend exceeds the total comprehensive
income of the subsidiaries, associates or joint ventures in the period the dividend is declared or if the carrying amount of
the relevant investment in the Company’s statement of financial position exceeds its carrying amount in the consolidated
financial statements of the investees’ net assets including goodwill.
2.12 Securities lending including repurchase agreementsThe Group has been a party to various securities lending agreements under which securities are loaned to third parties on
a short-term basis. The loaned securities are not derecognised and so they continue to be recognised within the appropriate
investment classification.
Assets sold under repurchase agreements (repos)Assets sold under repurchase agreements continue to be recognised and a liability is established for the consideration
received. The Group may be required to provide additional collateral based on the fair value of the underlying assets, and
such collateral assets remain on the consolidated statement of financial position.
Assets purchased under agreements to resell (reverse repos)The Group enters into purchases of assets under agreements to resell (reverse repos). Reverse repos are initially recorded
at the cost of the loan or collateral advanced within the caption “Loans and deposits” in the consolidated statement of
financial position. In the event of failure by the counterparty to repay the loan, the Group has the right to the underlying
assets.
ANNUAL REPORT 2018 |
OV
ER
VIE
WF
INA
NC
IAL
AN
D O
PE
RA
TIN
G R
EV
IEW
CO
RP
OR
AT
E G
OV
ER
NA
NC
EF
INA
NC
IAL
STA
TE
ME
NT
SA
DD
ITIO
NA
L IN
FO
RM
AT
ION
NOTES TO THE CONSOLIDATED FINANCIAL STATEMENTS AND SIGNIFICANT ACCOUNTING POLICIES

164
2. SIGNIFICANT ACCOUNTING POLICIES (continued)
2.13 CollateralThe Group receives and pledges collateral in the form of cash or non-cash assets in respect of derivative transactions,
securities lending transactions, and repo and reverse repo transactions, in order to reduce the credit risk of these
transactions. The amount and type of collateral depends on an assessment of the credit risk of the counterparty. Collateral
received in the form of cash, which is not legally segregated from the Group, is recognised as an asset in the consolidated
statement of financial position with a corresponding liability for the repayment. Non-cash collateral received is not
recognised on the consolidated statement of financial position unless the Group sells these assets in the absence of
default, at which point the obligation to return this collateral is recognised as a liability. To further minimise credit risk, the
financial condition of counterparties is monitored on a regular basis.
Collateral pledged in the form of cash which is legally segregated from the Group is derecognised from the consolidated
statement of financial position and a corresponding receivable established for its return. Non-cash collateral pledged is not
derecognised (except in the event of default) and therefore continues to be recognised in the consolidated statement of
financial position within the appropriate financial instrument classification.
2.14 BorrowingsBorrowings are recognised initially at their issue proceeds less transaction costs incurred. Subsequently, borrowings are
stated at amortised cost, and any difference between net proceeds and redemption value is recognised in the consolidated
income statement over the period of the borrowings using the effective interest method. All borrowing costs are expensed
as they are incurred, except for borrowing costs directly attributable to the development of investment properties and other
qualifying assets, which are capitalised as part of the cost of the asset.
2.15 Income taxesThe current tax expense is based on the taxable profits for the period, including any adjustments in respect of prior years.
Tax is allocated to profit or loss before taxation and amounts charged or credited to equity as appropriate.
Deferred tax is recognised in respect of temporary differences between the tax bases of assets and liabilities and their
carrying amounts in the consolidated financial statements, except as described below.
The principal temporary differences arise from the basis of recognition of insurance and investment contract liabilities,
revaluation of certain financial assets and liabilities including derivative contracts, deferred acquisition costs and the
future taxes arising on the surplus in life funds where the relevant local tax regime is distributions-based. The rates enacted
or substantively enacted at the date of the consolidated statement of financial position are used to determine deferred tax.
Deferred tax assets are recognised to the extent that it is probable that future taxable profit will be available against which
the temporary differences can be utilised. In countries where there is a history of tax losses, deferred tax assets are only
recognised in excess of deferred tax liabilities if there is evidence that future profits will be available.
Deferred taxes are not provided in respect of temporary differences arising from the initial recognition of goodwill or from
goodwill for which amortisation is not deductible for tax purposes, or from the initial recognition of an asset or liability in a
transaction which is not a business combination and which affects neither accounting nor taxable profit or loss at the time
of the transaction.
Deferred tax related to fair value remeasurement of available for sale investments and other amounts taken directly to
equity, is recognised initially within the applicable component of equity. It is subsequently recognised in the consolidated
income statement, together with the gain or loss arising on the underlying item.
In addition to paying tax on shareholders’ profits, certain of the Group’s life insurance businesses pay tax on policyholders’
investment returns (policyholder tax) at policyholder tax rates. Policyholder tax is accounted for as an income tax and is
included in the total tax expense and disclosed separately.
| AIA GROUP LIMITED
FINANCIAL STATEMENTS

165
2. SIGNIFICANT ACCOUNTING POLICIES (continued)
2.16 RevenueInvestment returnInvestment income consists of dividends, interest and rents receivable for the reporting period. Investment experience
comprises realised gains and losses, impairments and unrealised gains and losses on investments held at fair value
through profit or loss. Interest income is recognised as it accrues, taking into account the effective yield on the investment.
Rental income on investment property is recognised on an accrual basis. Investment return consists of investment income
and investment experience.
The realised gain or loss on disposal of an investment is the difference between the proceeds received, net of transaction
costs, and its original cost or amortised cost as appropriate. Unrealised gains and losses represent the difference between
the carrying value at the period end and the carrying value at the previous year end or purchase price if purchased during
the period, less the reversal of previously recognised unrealised gains and losses in respect of disposals made during the
period.
Other fee and commission incomeOther fee and commission income consists primarily of fund management fees, income from any incidental non-insurance
activities, distribution fees from mutual funds, commissions on reinsurance ceded and commission revenue from the sale
of mutual fund shares. Reinsurance commissions receivable are deferred in the same way as acquisition costs. All other
fee and commission income is recognised as the services are provided.
2.17 Employee benefitsAnnual leave and long service leaveEmployee entitlements to annual leave and long service leave are recognised when they accrue to employees. A provision
is made for the estimated liability for annual leave and long service leave as a result of services rendered by employees up
to the reporting date.
Post-retirement benefit obligationsThe Group operates a number of funded and unfunded post-retirement employee benefit schemes, whose members
receive benefits on either a defined benefit basis (generally related to salary and length of service) or a defined contribution
basis (generally related to the amount invested, investment return and annuity rates), the assets of which are generally
held in separate trustee-administered funds. The defined benefit plans provide life and medical benefits for employees
after retirement and a lump sum benefit on cessation of employment, and the defined contribution plans provide
post-retirement pension benefits.
For defined benefit plans, the costs are assessed using the projected unit credit method. Under this method, the cost of
providing benefits is charged to the consolidated income statement so as to spread the regular cost over the service lives
of employees, in accordance with the advice of qualified actuaries. The obligation is measured as the present value of the
estimated future cash outflows, using a discount rate based on market yields for high-quality corporate bonds that are
denominated in the currency in which the benefits will be paid and that have terms to maturity approximating to the terms
of the related liability. The resulting scheme surplus or deficit appears as an asset or liability in the consolidated statement
of financial position.
Remeasurements arising from defined benefit plans comprise actuarial gains and losses, the return on plan assets
(excluding interest) and the effect of the asset ceiling (if any, excluding interest). The Group recognises them immediately
in other comprehensive income and all other expenses related to defined benefit plans in staff costs in the consolidated
income statement.
When the benefits of a plan are changed, or when a plan is curtailed, the portion of the changed benefit related to past
service by employees, or the gain or loss on curtailment, is recognised immediately in consolidated income statement
when the plan amendment or curtailment occurs.
For defined contribution plans, the Group pays contributions to publicly or privately administered pension plans. Once the
contributions have been paid, the Group, as employer, does not have any further payment obligations. The Group’s
contributions are charged to the consolidated income statement in the reporting period to which they relate and are
included in staff costs.
ANNUAL REPORT 2018 |
OV
ER
VIE
WF
INA
NC
IAL
AN
D O
PE
RA
TIN
G R
EV
IEW
CO
RP
OR
AT
E G
OV
ER
NA
NC
EF
INA
NC
IAL
STA
TE
ME
NT
SA
DD
ITIO
NA
L IN
FO
RM
AT
ION
NOTES TO THE CONSOLIDATED FINANCIAL STATEMENTS AND SIGNIFICANT ACCOUNTING POLICIES

166
2. SIGNIFICANT ACCOUNTING POLICIES (continued)
2.17 Employee benefits (continued)
Share-based compensation and cash incentive plansThe Group launched a number of share-based compensation plans, under which the Group receives services from the
employees, directors, officers and agents as consideration for the shares and/or share options of the Company. These
share-based compensation plans comprise the Share Option Scheme (SO Scheme), the Restricted Share Unit Scheme
(RSU Scheme), the Employee Share Purchase Plan (ESPP) and the Agency Share Purchase Plan (ASPP).
The Group’s share-based compensation plans are predominantly equity-settled plans. Under equity-settled share-based
compensation plan, the fair value of the employee services received in exchange for the award of shares and/or share
options is recognised as an expense in profit or loss over the vesting period with a corresponding amount recorded in
equity.
The total amount to be expensed over the vesting period is determined by reference to the fair value of the share and/or
share options awarded. Non-market vesting conditions are included in assumptions about the number of shares and/or
share options that are expected to be vested. At each period end, the Group revises its estimates of the number of shares
and/or share options that are expected to be vested. Any impact of the revision to original estimates is recognised in profit
or loss with a corresponding adjustment to equity. Where awards of share-based payment arrangements have graded
vesting terms, each tranche is recognised as a separate award, and therefore the fair value of each tranche is recognised
over the applicable vesting period.
The Group estimates the fair value of share options using a binomial lattice model. This model requires inputs such as
share price, implied volatility, risk-free interest rate, expected dividend rate and the expected life of the share option.
Where modification or cancellation of an equity-settled share-based compensation plan occurs, the grant date fair value
continues to be recognised, together with any incremental value arising on the date of modification if non-market conditions
are met.
For cash-settled share-based compensation plans, the fair value of the employee services in exchange for the award of
cash-settled award is recognised as an expense in profit or loss, with a corresponding amount recognised in liability. At the
end of each reporting period, any unsettled award is remeasured based on the change in fair value of the underlying asset
and the liability and expense are adjusted accordingly.
2.18 Provisions and contingenciesProvisions are recognised when the Group has a present legal or constructive obligation as a result of past events, it is
probable that an outflow of economic resources will be required to settle the obligation, and a reliable estimate of the
amount of the obligation can be made. Where the Group expects a provision to be reimbursed, for example under an
insurance contract held, the reimbursement is recognised as a separate asset only when the reimbursement is virtually
certain.
The Group recognises a provision for onerous contracts when the expected benefits to be derived from a contract are less
than the unavoidable costs of meeting the obligations under the contract.
Contingencies are disclosed if material and if there is a possible future obligation as a result of a past event, or if there is a
present obligation as a result of a past event, but either a payment is not probable or the amount cannot be reliably
estimated.
| AIA GROUP LIMITED
FINANCIAL STATEMENTS

167
2. SIGNIFICANT ACCOUNTING POLICIES (continued)
2.19 LeasesLeases, where a significant portion of the risks and rewards of ownership is retained by the Group as a lessor, are classified
as operating leases. Assets subject to such leases are included in property, plant and equipment or investment property,
and are depreciated to their residual values over their estimated useful lives. Rentals from such leases are credited to the
consolidated income statement on a straight-line basis over the period of the relevant lease.
Payments made by the Group as lessee under operating leases are classified either as an operating lease prepayment or
as a component of investment property depending on whether the property interest is used as investment property.
Operating leases held for long-term rental or capital appreciation or both that are not occupied by the Group are classified
as investment property. They are initially recognised at cost with changes in fair values in subsequent periods recognised
in the consolidated income statement. The Group classifies amounts paid to acquire leasehold land which are held for the
Group’s own occupancy as an operating lease prepayment or as a component of property, plant and equipment depending
on whether substantially all the risks and rewards incidental to the ownership of the land are transferred to the Group.
Prepayments for land use rights under operating leases that are held for the Group’s own occupancy (net of any incentives
received from the lessor) are included within “Other assets” and charged to the consolidated income statement on a
straight-line basis over the period of the relevant lease. There are not any freehold land interests in Hong Kong.
2.20 Share capitalOrdinary shares are classified in equity when there is not any obligation to transfer cash or other assets to the holders.
Share issue costsIncremental external costs directly attributable to the issue of new shares are shown in equity as a deduction, net of tax,
from the proceeds of the issue.
DividendsInterim dividends on ordinary shares are recognised when they have been paid. Final dividends on ordinary shares are
recognised when they have been approved by shareholders.
2.21 Presentation of the consolidated statement of financial positionThe Group’s insurance and investment contract liabilities and related assets are realised and settled over periods of several
years, reflecting the long-term nature of the Group’s products. Accordingly, the Group presents the assets and liabilities in
its consolidated statement of financial position in approximate order of liquidity, rather than distinguishing current and
non-current assets and liabilities. The Group regards its intangible assets, investments in associates and joint ventures,
property, plant and equipment, investment property and deferred acquisition and origination costs as non-current assets
as these are held for the longer-term use of the Group.
2.22 Earnings per shareBasic earnings per share is calculated by dividing net profit available to ordinary shareholders by the weighted average
number of ordinary shares in issue during the period.
Earnings per share has also been calculated on the operating profit before adjusting items, attributable to ordinary
shareholders, as the Directors believe this figure provides a better indication of operating performance.
For diluted earnings per share, the weighted average number of ordinary shares in issue is adjusted to assume conversion
of all dilutive potential ordinary shares, such as share options awarded to employees.
Potential or contingent share issuances are treated as dilutive when their conversion to shares would decrease net earnings
per share.
2.23 Fiduciary activitiesAssets and income arising from fiduciary activities, together with related undertakings to return such assets to customers,
are excluded from these consolidated financial statements where the Group does not have contractual rights to the assets
and acts in a fiduciary capacity such as nominee, trustee or agent.
ANNUAL REPORT 2018 |
OV
ER
VIE
WF
INA
NC
IAL
AN
D O
PE
RA
TIN
G R
EV
IEW
CO
RP
OR
AT
E G
OV
ER
NA
NC
EF
INA
NC
IAL
STA
TE
ME
NT
SA
DD
ITIO
NA
L IN
FO
RM
AT
ION
NOTES TO THE CONSOLIDATED FINANCIAL STATEMENTS AND SIGNIFICANT ACCOUNTING POLICIES

168
2. SIGNIFICANT ACCOUNTING POLICIES (continued)
2.24 Consolidated statement of cash flowThe consolidated statement of cash flow presents movements in cash and cash equivalents and bank overdrafts as shown
in the consolidated statement of financial position.
Purchases and sales of financial investments are included in operating cash flows as the purchases are funded from cash
flows associated with the origination of insurance and investment contracts, net of payments of related benefits and
claims. Purchases and sales of investment property are included within cash flows from investing activities.
2.25 Related party transactionsTransactions with related parties are recorded at amounts mutually agreed and transacted between the parties to the
arrangement.
3. CRITICAL ACCOUNTING ESTIMATES AND JUDGEMENTSThe Group makes estimates and assumptions that affect the reported amounts of assets, liabilities, and revenue and
expenses. All estimates are based on management’s knowledge of current facts and circumstances, assumptions based on
that knowledge and predictions of future events and actions. Actual results can always differ from those estimates, possibly
significantly.
Items that are considered particularly sensitive to changes in estimates and assumptions, and the relevant accounting
policies are those which relate to product classification, insurance contract liabilities (including liabilities in respect of
investment contracts with DPF), deferred acquisition and origination costs, liability adequacy testing, fair value
measurement and impairment of goodwill and other intangible assets.
3.1 Product classificationThe Group issues contracts that transfer insurance risk or financial risk or both. Insurance contracts are those contracts
that transfer significant insurance risk, while investment contracts are those contracts without significant insurance risk.
The Group exercises significant judgement to determine whether there is a scenario (other than those lacking commercial
substance) in which an insured event would require the Group to pay significant additional benefits to its customers. In the
event the Group has to pay significant additional benefits to its customers, the contract is accounted for as an insurance
contract. The judgements exercised in determining the level of insurance risk in product classification affect the amounts
recognised in the consolidated financial statements as insurance and investment contract liabilities and deferred
acquisition and origination costs. The accounting policy on product classification is described in note 2.4.
3.2 Insurance contract liabilities (including liabilities in respect of investment contracts with DPF)The Group calculates the insurance contract liabilities for traditional life insurance using a net level premium valuation
method, whereby the liability represents the present value of estimated future policy benefits to be paid, less the present
value of estimated future net premiums to be collected from policyholders. This method uses best estimate assumptions
at inception adjusted for a provision for the risk of adverse deviation for mortality, morbidity, expected investment yields,
policyholder dividends (for other participating business), surrenders and expenses set at the policy inception date. These
assumptions remain locked in thereafter, unless a deficiency arises on liability adequacy testing. Interest rate assumptions
can vary by geographical market, year of issuance and product. Mortality, surrender and expense assumptions are based
on actual experience by each geographical market, modified to allow for variations in policy form. The Group exercises
significant judgement in making appropriate assumptions.
For contracts with an explicit account balance, such as universal life and unit-linked contracts, insurance contract liabilities
represent the accumulation value, which represents premiums received and investment returns credited to the policy less
deductions for mortality and morbidity costs and expense charges. Significant judgement is exercised in making appropriate
estimates of gross profits which are based on historical and anticipated future experiences, these estimates are regularly
reviewed by the Group.
| AIA GROUP LIMITED
FINANCIAL STATEMENTS

169
3. CRITICAL ACCOUNTING ESTIMATES AND JUDGEMENTS (continued)
3.2 Insurance contract liabilities (including liabilities in respect of investment contracts with DPF) (continued)
The Group accounts for insurance contract liabilities for participating business written in participating funds by establishing
a liability for the present value of guaranteed benefits less estimated future net premiums to be collected from policyholders.
In addition, an insurance liability is recorded for the proportion of the net assets of the participating funds that would be
allocated to policyholders assuming all relevant surplus at the date of the consolidated statement of financial position
were to be declared as a policyholder dividend based upon applicable regulations. Establishing these liabilities requires
the exercise of significant judgement. In addition, the assumption that all relevant performance is declared as a policyholder
dividend may not be borne out in practice. The Group accounts for other participating business by establishing a liability
for the present value of guaranteed benefits and non-guaranteed participation, less estimated future net premiums to be
collected from policyholders.
The judgements exercised in the valuation of insurance contract liabilities (including investment contracts with DPF)
affect the amounts recognised in the consolidated financial statements as insurance contract benefits and insurance
contract liabilities. Further details of the related accounting policy, key risk and variables, and the sensitivities of
assumptions to the key variables in respect of insurance contract liabilities are provided in notes 2.4, 26 and 28.
3.3 Deferred acquisition and origination costsThe judgements exercised in the deferral and amortisation of acquisition and origination costs affect amounts recognised
in the consolidated financial statements as deferred acquisition and origination costs and insurance and investment
contract benefits.
As noted in note 2.4.1, deferred acquisition costs for traditional life insurance and annuity policies are amortised over the
expected life of the contracts as a constant percentage of expected premiums. Expected premiums are estimated at the
date of policy issue and are applied consistently throughout the life of the contract unless a deficiency occurs when
performing liability adequacy testing.
As noted in note 2.4.1, deferred acquisition costs for universal life and unit-linked contracts are amortised over the expected
life of the contracts based on a constant percentage of the present value of estimated gross profits expected to be realised
over the life of the contract or on a straight-line basis. As noted in note 3.2, significant judgement is exercised in making
appropriate estimates of gross profits. The expensing of acquisition costs is accelerated following adverse investment
performance. Likewise, in periods of favourable investment performance, previously expensed acquisition costs are
reversed, not exceeding the amount initially deferred.
Additional details of deferred acquisition and origination costs are provided in notes 2.4 and 19.
3.4 Liability adequacy testingThe Group evaluates the adequacy of its insurance and investment contract liabilities with DPF at least annually. Significant
judgement is exercised in determining the level of aggregation at which liability adequacy testing is performed and in
selecting best estimate assumptions. Liability adequacy is assessed by portfolio of contracts in accordance with the
Group’s manner of acquiring, servicing and measuring the profitability of its insurance contracts. The Group performs
liability adequacy testing separately for each reportable segment.
The judgements exercised in liability adequacy testing affect amounts recognised in the consolidated financial statements
as commission and other acquisition expenses, deferred acquisition costs, insurance contract benefits and insurance and
investment contract liabilities.
ANNUAL REPORT 2018 |
OV
ER
VIE
WF
INA
NC
IAL
AN
D O
PE
RA
TIN
G R
EV
IEW
CO
RP
OR
AT
E G
OV
ER
NA
NC
EF
INA
NC
IAL
STA
TE
ME
NT
SA
DD
ITIO
NA
L IN
FO
RM
AT
ION
NOTES TO THE CONSOLIDATED FINANCIAL STATEMENTS AND SIGNIFICANT ACCOUNTING POLICIES

170
3. CRITICAL ACCOUNTING ESTIMATES AND JUDGEMENTS (continued)
3.5 Fair value measurement3.5.1 Fair value of financial assets
The Group determines the fair values of financial assets traded in active markets using quoted bid prices as of each
reporting date. The fair values of financial assets that are not traded in active markets are typically determined using a
variety of other valuation techniques, such as prices observed in recent transactions and values obtained from current bid
prices of comparable investments. More judgement is used in measuring the fair value of financial assets for which market
observable prices are not available or are available only infrequently.
The degree of judgement used in measuring the fair value of financial assets generally correlates with the level of pricing
observability. Pricing observability is affected by a number of factors, including the type of financial instrument, whether
the financial instrument is new to the market and not yet established, the characteristics specific to the transaction and
general market conditions.
Changes in the fair value of financial assets held by the Group’s participating funds affect not only the value of financial
assets, but are also reflected in corresponding movements in insurance and investment contract liabilities. This is due to
an insurance liability being recorded for the proportion of the net assets of the participating funds that would be allocated
to policyholders if all relevant surplus at the date of the consolidated statement of financial position were to be declared
as a policyholder dividend based on current local regulations. Both of the foregoing changes are reflected in the consolidated
income statement.
Changes in the fair value of financial assets held to back the Group’s unit-linked contracts result in a corresponding change
in insurance and investment contract liabilities. Both of the foregoing changes are also reflected in the consolidated
income statement.
Further details of the fair value of financial assets and the sensitivity analysis to interest rates and equity prices are
provided in notes 22 and 37.
3.5.2 Fair value of property held for own use and investment property
The Group uses independent professional valuers to determine the fair value of properties on the basis of the highest and
best use of the properties that is physically possible, legally permissible and financially feasible. In most cases, current use
of the properties is considered to be the highest and best use for determining the fair value. Different valuation techniques
may be adopted to reach the fair value of the properties. Under the Market Data Approach, records of recent sales and
offerings of similar property are analysed and comparisons are made for factors such as size, location, quality and
prospective use. For investment properties, the discounted cash flow approach may be used by reference to net rental
income allowing for reversionary income potential to estimate the fair value of the properties. On some occasions, the cost
approach is used as well to calculate the fair value which reflects the cost that would be required to replace the service
capacity of the property.
Further details of the fair value of property held for own use and investment property are provided in note 22.
3.6 Impairment of goodwill and other intangible assetsFor the purposes of impairment testing, goodwill and other intangible assets are grouped into cash-generating units or
groups of cash generating units. These assets are tested for impairment by comparing the carrying amount of the
cash-generating unit (group of units), including goodwill, to the recoverable amount of that cash-generating unit (group of
units). The determination of the recoverable amount requires significant judgement regarding the selection of appropriate
valuation techniques and assumptions. Further details of the impairment of goodwill during the period are provided in note
14.
| AIA GROUP LIMITED
FINANCIAL STATEMENTS

171
4. EXCHANGE RATESThe Group’s principal overseas operations during the reporting period were located within the Asia-Pacific region. The
results and cash flows of these operations have been translated into US dollars at the following average rates:
US dollar exchange rates
Thirteen months ended 31 December
2018
Twelve months ended 30 November
2017
Hong Kong 7.84 7.79
Thailand 32.35 34.15
Singapore 1.35 1.39
Malaysia 4.04 4.33
China 6.61 6.78
Assets and liabilities have been translated at the following period-end rates:
US dollar exchange rates
As at31 December
2018
As at30 November
2017
Hong Kong 7.83 7.81
Thailand 32.47 32.62
Singapore 1.36 1.35
Malaysia 4.14 4.09
China 6.88 6.61
Exchange rates are expressed in units of local currency per US$1.
ANNUAL REPORT 2018 |
OV
ER
VIE
WF
INA
NC
IAL
AN
D O
PE
RA
TIN
G R
EV
IEW
CO
RP
OR
AT
E G
OV
ER
NA
NC
EF
INA
NC
IAL
STA
TE
ME
NT
SA
DD
ITIO
NA
L IN
FO
RM
AT
ION
NOTES TO THE CONSOLIDATED FINANCIAL STATEMENTS AND SIGNIFICANT ACCOUNTING POLICIES

172
5. CHANGE IN GROUP COMPOSITIONThis note provides details of the acquisition of subsidiaries that the Group has made during the thirteen months ended 31
December 2018.
AcquisitionOn 2 July 2018, the Group acquired 100 per cent of share capital of Sovereign Assurance Company Limited allowing 100
per cent control of its voting rights, included as part of the acquisition of ASB Group (Life) Limited and its subsidiaries
(Sovereign), the life and health insurance businesses owned by Commonwealth Bank of Australia (CBA) in New Zealand.
This acquisition presents the Group with an extensive customer reaches and distribution capabilities in New Zealand and
a separate 20-year strategic bancassurance partnership with the ASB Bank Limited in New Zealand. The consideration
with respect to this acquisition was AUD1,241m or US$918m at exchange rate on the date of the acquisition.
There is a related reinsurance agreement, resulting in Sovereign receiving an upfront reinsurance commission of US$482m.
The Group incurred US$15m of acquisition-related costs which were recognised as “other expenses” in the Group’s
consolidated income statement.
Details of the fair value of the assets and liabilities acquired and the goodwill arising from the acquisition of Sovereign are
set out as follows:
US$m
Fair values as at the date of
acquisition
Deferred acquisition costs (value of business acquired) 348
Property, plant and equipment 10
Reinsurance assets 19
Investment securities 1,083
Other assets(1) 37
Cash and cash equivalents 312
Insurance and investment contract liabilities (571)
Deferred tax liabilities (455)
Other liabilities (32)
Net assets acquired 751
Goodwill arising on acquisition 167
Fair value of consideration 918
Less:
Cash and cash equivalents held in acquired subsidiaries (312)
Net change in cash and cash equivalents 606
Note:
(1) Fair value approximates the gross contractual amount.
GoodwillThe goodwill recognised is mainly attributable to the distribution strengths and synergies and other benefits from
combining Sovereign and the Group’s operations in Australia (including New Zealand). The goodwill is not expected to be
deductible for tax purposes.
Impact of acquisition on the results of the GroupThe acquired Sovereign contributed revenue of US$156m and profit before tax of US$16m to the Group’s consolidated
income statement for the thirteen months ended 31 December 2018. The impact of the acquisition would not be materially
different had the acquisition been completed at the beginning of the reporting period.
| AIA GROUP LIMITED
FINANCIAL STATEMENTS

173
6. OPERATING PROFIT AFTER TAXOperating profit after tax may be reconciled to net profit as follows:
US$m Note
Thirteen months ended 31 December
2018
Twelve months ended 30 November
2017
Operating profit after tax 8 5,731 4,682
Non-operating items, net of related changes in insurance and investment contract liabilities:
Short-term fluctuations in investment return related to equities and real estate (net of tax of: thirteen months ended 31 December 2018: US$164m; twelve months ended 30 November 2017: US$(117)m)(1) (1,881) 1,764
Reclassification of revaluation gain for property held for own use (net of tax of: thirteen months ended 31 December 2018: US$11m; twelve months ended 30 November 2017: US$4m)(1)(2) (212) (84)
Corporate transaction related costs (net of tax of: thirteen months ended 31 December 2018: US$(35)m; twelve months ended 30 November 2017: US$6m)(2) (148) (25)
Implementation costs for new accounting standards (net of tax of: thirteen months ended 31 December 2018: US$5m; twelve months ended 30 November 2017: nil)(2) (43) (6)
Other non-operating investment return and other items (net of tax of: thirteen months ended 31 December 2018: US$22m; twelve months ended 30 November 2017: US$30m)(2) (221) (144)
Net profit 3,226 6,187
Operating profit after tax attributable to:
Shareholders of AIA Group Limited 5,684 4,647
Non-controlling interests 47 35
Net profit attributable to:
Shareholders of AIA Group Limited 3,163 6,120
Non-controlling interests 63 67
Operating profit is determined using, among others, expected long-term investment return for equities and real estate.
Short-term fluctuations between expected long-term investment return and actual investment return for these asset
classes are excluded from operating profit. The investment return assumptions used to determine expected long-term
investment return are based on the same assumptions used by the Group in determining its embedded value and are
disclosed in the Supplementary Embedded Value Information.
Notes:
(1) Short-term fluctuations in investment return include the revaluation gain for property held for own use. This amount is then reclassified out of net profit to conform to IFRS measurement and presentation.
(2) The comparative information has been adjusted to conform to current period presentation.
7. TOTAL WEIGHTED PREMIUM INCOME AND ANNUALISED NEW PREMIUMSFor management decision-making and internal performance management purposes, the Group measures business
volumes during the period using a performance measure referred to as total weighted premium income (TWPI). The Group
measures new business activity using a performance measure referred to as annualised new premiums (ANP). The
presentation of this note is consistent with our reportable segment presentation in note 8.
TWPI consists of 100 per cent of renewal premiums, 100 per cent of first year premiums and 10 per cent of single premiums,
before reinsurance ceded, and includes deposits and contributions for contracts that are accounted for as deposits in
accordance with the Group’s accounting policies.
ANNUAL REPORT 2018 |
OV
ER
VIE
WF
INA
NC
IAL
AN
D O
PE
RA
TIN
G R
EV
IEW
CO
RP
OR
AT
E G
OV
ER
NA
NC
EF
INA
NC
IAL
STA
TE
ME
NT
SA
DD
ITIO
NA
L IN
FO
RM
AT
ION
NOTES TO THE CONSOLIDATED FINANCIAL STATEMENTS AND SIGNIFICANT ACCOUNTING POLICIES

174
7. TOTAL WEIGHTED PREMIUM INCOME AND ANNUALISED NEW PREMIUMS (continued)
Management considers that TWPI provides an indicative volume measure of transactions undertaken in the reporting
period that have the potential to generate profits for shareholders. The amounts shown are not intended to be indicative of
premiums and fee income recorded in the consolidated income statement.
ANP is a key internal measure of new business activities, which consists of 100 per cent of annualised first year premiums
and 10 per cent of single premiums, before reinsurance ceded. ANP excludes new business of pension business, personal
lines and motor insurance.
TWPIUS$m
Thirteen months ended 31 December
2018
Twelve months ended 30 November
2017
TWPI by geography
Hong Kong 12,501 9,434
Thailand 4,232 3,517
Singapore 2,906 2,421
Malaysia 2,245 1,823
China 4,366 3,092
Other Markets 6,859 5,860
Total 33,109 26,147
First year premiums by geography
Hong Kong 2,458 2,586
Thailand 589 477
Singapore 349 277
Malaysia 328 286
China 1,082 928
Other Markets 1,127 925
Total 5,933 5,479
Single premiums by geography
Hong Kong 2,767 2,417
Thailand 284 194
Singapore 1,800 1,433
Malaysia 202 187
China 151 150
Other Markets 737 622
Total 5,941 5,003
Renewal premiums by geography
Hong Kong 9,766 6,606
Thailand 3,614 3,021
Singapore 2,377 2,001
Malaysia 1,897 1,518
China 3,269 2,149
Other Markets 5,658 4,873
Total 26,581 20,168
| AIA GROUP LIMITED
FINANCIAL STATEMENTS

175
7. TOTAL WEIGHTED PREMIUM INCOME AND ANNUALISED NEW PREMIUMS (continued)
ANPUS$m
Thirteen months ended 31 December
2018
Twelve months ended 30 November
2017
ANP by geography
Hong Kong 2,793 2,849
Thailand 648 518
Singapore 562 433
Malaysia 396 348
China 1,098 968
Other Markets 1,273 976
Total 6,770 6,092
8. SEGMENT INFORMATIONThe Group’s operating segments, based on the reports received by the ExCo, are each of the geographical markets in which
the Group operates. Each of the reportable segments, other than the “Group Corporate Centre” segment, writes life
insurance business, providing life insurance, accident and health insurance and savings plans to customers in its local
market, and distributes related investment and other financial services products. The reportable segments are Hong Kong
(including Macau), Thailand, Singapore (including Brunei), Malaysia, China, Other Markets and Group Corporate Centre.
Other Markets includes the Group’s operations in Australia (including New Zealand), Cambodia, Indonesia, Korea, the
Philippines, Sri Lanka, Taiwan, Vietnam and India. The activities of the Group Corporate Centre segment consist of the
Group’s corporate functions, shared services and eliminations of intragroup transactions.
The acquired subsidiaries and respective operations mentioned in note 5 are included under the operations in Australia
(including New Zealand).
As each reportable segment other than the Group Corporate Centre segment focuses on serving the life insurance needs
of its local market, there are limited transactions between reportable segments. The key performance indicators reported
in respect of each segment are:
• ANP;
• TWPI;
• investment return;
• operating expenses;
• operating profit after tax attributable to shareholders of AIA Group Limited;
• expense ratio, measured as operating expenses divided by TWPI;
• operating margin, measured as operating profit after tax expressed as a percentage of TWPI; and
• operating return on shareholders’ allocated equity measured as operating profit after tax attributable to shareholders
of AIA Group Limited expressed as a percentage of the simple average of opening and closing shareholders’ allocated
segment equity (being the segment assets less segment liabilities in respect of each reportable segment less
non-controlling interests and fair value reserve).
In presenting net capital in/(out) flows to reportable segments, capital outflows consist of dividends and profit distributions
to the Group Corporate Centre segment and capital inflows consist of capital injections into reportable segments by the
Group Corporate Centre segment. For the Group, net capital in/(out) flows reflect the net amount received from shareholders
by way of capital contributions less amounts distributed by way of dividends.
Business volumes in respect of the Group’s five largest customers are less than 30 per cent of premiums and fee income.
ANNUAL REPORT 2018 |
OV
ER
VIE
WF
INA
NC
IAL
AN
D O
PE
RA
TIN
G R
EV
IEW
CO
RP
OR
AT
E G
OV
ER
NA
NC
EF
INA
NC
IAL
STA
TE
ME
NT
SA
DD
ITIO
NA
L IN
FO
RM
AT
ION
NOTES TO THE CONSOLIDATED FINANCIAL STATEMENTS AND SIGNIFICANT ACCOUNTING POLICIES

176
8. SEGMENT INFORMATION (continued)
US$m Hong Kong Thailand Singapore Malaysia ChinaOther
Markets
Group Corporate
Centre Total
Thirteen months ended 31 December 2018
ANP 2,793 648 562 396 1,098 1,273 – 6,770
TWPI 12,501 4,232 2,906 2,245 4,366 6,859 – 33,109
Net premiums, fee income and other operating revenue (net of reinsurance ceded) 14,046 4,156 3,295 1,970 4,222 4,505 28 32,222
Investment return 2,849 1,433 1,271 644 934 1,200 397 8,728
Total revenue 16,895 5,589 4,566 2,614 5,156 5,705 425 40,950
Net insurance and investment contract benefits 12,600 3,156 3,290 1,701 3,246 3,030 26 27,049
Commission and other acquisition expenses 1,568 828 380 273 294 775 13 4,131
Operating expenses 438 235 226 196 348 701 222 2,366
Finance costs and other expenses 149 55 32 13 38 55 169 511
Total expenses 14,755 4,274 3,928 2,183 3,926 4,561 430 34,057
Share of profit from associates and joint ventures – – – – – – – –
Operating profit/(losses) before tax 2,140 1,315 638 431 1,230 1,144 (5) 6,893
Tax on operating profit/(losses) before tax (165) (254) (39) (81) (291) (248) (84) (1,162)
Operating profit/(losses) after tax 1,975 1,061 599 350 939 896 (89) 5,731
Operating profit/(losses) after tax attributable to:
Shareholders of AIA Group Limited 1,958 1,061 599 345 939 871 (89) 5,684
Non-controlling interests 17 – – 5 – 25 – 47
Key operating ratios:
Expense ratio 3.5% 5.6% 7.8% 8.7% 8.0% 10.2% – 7.1%
Operating margin 15.8% 25.1% 20.6% 15.6% 21.5% 13.1% – 17.3%
Operating return on shareholders’ allocated equity 25.4% 18.2% 19.7% 22.1% 27.0% 13.1% – 15.7%
Operating profit/(losses) before tax includes:
Finance costs 33 1 – – 23 4 149 210
Depreciation and amortisation 34 11 21 19 26 54 12 177
| AIA GROUP LIMITED
FINANCIAL STATEMENTS

177
8. SEGMENT INFORMATION (continued)
US$m Hong Kong Thailand Singapore Malaysia ChinaOther
Markets
Group Corporate
Centre Total
31 December 2018
Total assets 71,898 31,632 36,064 14,526 24,228 39,095 12,363 229,806
Total liabilities 64,299 24,627 32,865 12,885 20,068 30,889 4,767 190,400
Total equity 7,599 7,005 3,199 1,641 4,160 8,206 7,596 39,406
Shareholders’ allocated equity 7,508 6,181 3,116 1,600 3,565 6,901 7,924 36,795
Net capital (out)/in flows (1,054) (149) (267) (185) (542) (479) 1,172 (1,504)
Total assets include:
Investments in associates and joint ventures – – – 6 – 604 – 610
Segment information may be reconciled to the consolidated income statement as shown below:
US$mSegment
information
Short-term fluctuations in
investment return related
to equities and real estate
Other non-operating
items(1)
Consolidated income
statement
Thirteen months ended 31 December 2018
Net premiums, fee income and other operating revenue 32,222 – (2) 32,220
Net premiums, fee income and other operating revenue
Investment return 8,728 (2,928) (1,723) 4,077 Investment return
Total revenue 40,950 (2,928) (1,725) 36,297 Total revenue
Net insurance and investment contract benefits 27,049 (883) (1,570) 24,596
Net insurance and investment contract benefits
Other expenses 7,008 – 523 7,531 Other expenses
Total expenses 34,057 (883) (1,047) 32,127 Total expenses
Share of profit from associates and joint ventures – – – –
Share of profit from associates and joint ventures
Operating profit before tax 6,893 (2,045) (678) 4,170 Profit before tax
Note:
(1) Include unit-linked contracts.
ANNUAL REPORT 2018 |
OV
ER
VIE
WF
INA
NC
IAL
AN
D O
PE
RA
TIN
G R
EV
IEW
CO
RP
OR
AT
E G
OV
ER
NA
NC
EF
INA
NC
IAL
STA
TE
ME
NT
SA
DD
ITIO
NA
L IN
FO
RM
AT
ION
NOTES TO THE CONSOLIDATED FINANCIAL STATEMENTS AND SIGNIFICANT ACCOUNTING POLICIES

178
8. SEGMENT INFORMATION (continued)
US$m Hong Kong Thailand Singapore Malaysia ChinaOther
Markets
Group Corporate
Centre Total
Twelve months ended 30 November 2017
ANP 2,849 518 433 348 968 976 – 6,092
TWPI 9,434 3,517 2,421 1,823 3,092 5,860 – 26,147
Net premiums, fee income and other operating revenue (net of reinsurance ceded) 10,828 3,532 2,837 1,610 3,006 3,888 7 25,708
Investment return 2,148 1,189 1,083 547 734 1,057 338 7,096
Total revenue 12,976 4,721 3,920 2,157 3,740 4,945 345 32,804
Net insurance and investment contract benefits 9,454 2,659 2,822 1,439 2,406 2,603 4 21,387
Commission and other acquisition expenses 1,213 739 347 210 181 752 1 3,443
Operating expenses 407 199 181 164 278 552 188 1,969
Finance costs and other expenses 117 49 27 11 28 42 126 400
Total expenses 11,191 3,646 3,377 1,824 2,893 3,949 319 27,199
Share of profit from associates and joint ventures – – – – – – – –
Operating profit before tax 1,785 1,075 543 333 847 996 26 5,605
Tax on operating profit before tax (137) (210) (39) (59) (208) (217) (53) (923)
Operating profit/(losses) after tax 1,648 865 504 274 639 779 (27) 4,682
Operating profit/(losses) after tax attributable to:
Shareholders of AIA Group Limited 1,636 865 504 272 639 758 (27) 4,647
Non-controlling interests 12 – – 2 – 21 – 35
Key operating ratios:
Expense ratio 4.3% 5.7% 7.5% 9.0% 9.0% 9.4% – 7.5%
Operating margin 17.5% 24.6% 20.8% 15.0% 20.7% 13.3% – 17.9%
Operating return on shareholders’ allocated equity 23.6% 17.5% 18.5% 19.1% 20.4% 12.8% – 14.2%
Operating profit before tax includes:
Finance costs 29 6 – – 16 2 104 157
Depreciation and amortisation 37 10 16 17 17 40 12 149
| AIA GROUP LIMITED
FINANCIAL STATEMENTS

179
8. SEGMENT INFORMATION (continued)
US$m Hong Kong Thailand Singapore Malaysia ChinaOther
Markets
Group Corporate
Centre Total
30 November 2017
Total assets 65,485 31,319 35,922 14,347 19,915 37,145 11,558 215,691
Total liabilities 54,023 24,358 32,501 12,806 16,789 29,172 3,670 173,319
Total equity 11,462 6,961 3,421 1,541 3,126 7,973 7,888 42,372
Shareholders’ allocated equity 7,909 5,510 2,961 1,524 3,391 6,430 7,933 35,658
Net capital (out)/in flows (952) (467) (238) (192) (207) (50) 866 (1,240)
Total assets include:
Investments in associates and joint ventures – – 1 6 – 635 – 642
Segment information may be reconciled to the consolidated income statement as shown below:
US$mSegment
information
Short-term fluctuations in
investment return related to
equities and real estate
Other non-operating
items(1)
Consolidated income
statement
Twelve months ended 30 November 2017
Net premiums, fee income and other operating revenue 25,708 – – 25,708
Net premiums, fee income and other operating revenue
Investment return 7,096 2,314 3,212 12,622 Investment return
Total revenue 32,804 2,314 3,212 38,330 Total revenue
Net insurance and investment contract benefits 21,387 433 3,021 24,841
Net insurance and investment contract benefits
Other expenses 5,812 – 362 6,174 Other expenses
Total expenses 27,199 433 3,383 31,015 Total expenses
Share of profit from associates and joint ventures – – – –
Share of profit from associates and joint ventures
Operating profit before tax 5,605 1,881 (171) 7,315 Profit before tax
Note:
(1) Include unit-linked contracts.
ANNUAL REPORT 2018 |
OV
ER
VIE
WF
INA
NC
IAL
AN
D O
PE
RA
TIN
G R
EV
IEW
CO
RP
OR
AT
E G
OV
ER
NA
NC
EF
INA
NC
IAL
STA
TE
ME
NT
SA
DD
ITIO
NA
L IN
FO
RM
AT
ION
NOTES TO THE CONSOLIDATED FINANCIAL STATEMENTS AND SIGNIFICANT ACCOUNTING POLICIES

180
9. REVENUEInvestment return
US$m
Thirteen months ended 31 December
2018
Twelve months ended 30 November
2017
Interest income 6,743 5,599
Dividend income 849 695
Rental income 184 151
Investment income 7,776 6,445
Available for sale
Net realised gains from debt securities 10 180
Impairment of debt securities (81) –
Net (losses)/gains of available for sale financial assets reflected in the consolidated income statement (71) 180
At fair value through profit or loss
Net (losses)/gains of financial assets designated at fair value through profit or loss
Net gains/(losses) of debt securities 63 (89)
Net (losses)/gains of equity securities (4,028) 5,789
Net fair value movement on derivatives (120) 513
Net (losses)/gains in respect of financial instruments at fair value through profit or loss (4,085) 6,213
Net fair value movement of investment property and property held for own use 469 367
Net foreign exchange losses (2) (560)
Other net realised losses (10) (23)
Investment experience (3,699) 6,177
Investment return 4,077 12,622
Foreign currency movements resulted in the following gains/(losses) recognised in the consolidated income statement
(other than gains and losses arising on items measured at fair value through profit or loss):
US$m
Thirteen months ended 31 December
2018
Twelve months ended 30 November
2017
Foreign exchange gains/(losses) 53 (238)
Other operating revenueThe balance of other operating revenue largely consists of asset management fees.
| AIA GROUP LIMITED
FINANCIAL STATEMENTS

181
10. EXPENSES
US$m
Thirteen months ended 31 December
2018
Twelve months ended 30 November
2017
Insurance contract benefits 13,573 11,530
Change in insurance contract liabilities 13,272 13,366
Investment contract benefits (462) 1,212
Insurance and investment contract benefits 26,383 26,108
Insurance and investment contract benefits ceded (1,787) (1,267)
Insurance and investment contract benefits, net of reinsurance ceded 24,596 24,841
Commission and other acquisition expenses incurred 6,664 5,696
Deferral and amortisation of acquisition costs (2,528) (2,241)
Commission and other acquisition expenses 4,136 3,455
Employee benefit expenses 1,486 1,243
Depreciation 80 65
Amortisation 57 53
Operating lease rentals 187 147
Other operating expenses 556 461
Operating expenses 2,366 1,969
Investment management expenses and others 517 397
Depreciation on property held for own use 37 22
Restructuring and other non-operating costs(1) 223 142
Change in third-party interests in consolidated investment funds 24 6
Other expenses 801 567
Finance costs 228 183
Total 32,127 31,015
Other operating expenses include auditors’ remuneration of US$23m (twelve months ended 30 November 2017: US$20m),
an analysis of which is set out below:
US$m
Thirteen months ended 31 December
2018
Twelve months ended 30 November
2017
Audit services(2) 17 16
Non-audit services, including:
Audit-related services(2) 2 2
Tax services 2 1
Other services 2 1
Total 23 20
Notes:
(1) Restructuring costs represent costs related to restructuring programmes and are primarily comprised of redundancy and contract termination costs. Other non-operating costs primarily consist of corporate transaction related costs and implementation costs for new accounting standards.
(2) Expenses for audit services include the audit of the Supplementary Embedded Value Information which was reported as part of audit related services in prior period. The comparative information has been adjusted to conform to current period presentation.
ANNUAL REPORT 2018 |
OV
ER
VIE
WF
INA
NC
IAL
AN
D O
PE
RA
TIN
G R
EV
IEW
CO
RP
OR
AT
E G
OV
ER
NA
NC
EF
INA
NC
IAL
STA
TE
ME
NT
SA
DD
ITIO
NA
L IN
FO
RM
AT
ION
NOTES TO THE CONSOLIDATED FINANCIAL STATEMENTS AND SIGNIFICANT ACCOUNTING POLICIES

182
10. EXPENSES (continued)
Finance costs may be analysed as:
US$m
Thirteen months ended 31 December
2018
Twelve months ended 30 November
2017
Repurchase agreements (see note 30 for details) 43 47
Medium-term notes 176 132
Other loans 9 4
Total 228 183
Employee benefit expenses consist of:
US$m
Thirteen months ended 31 December
2018
Twelve months ended 30 November
2017
Wages and salaries 1,217 1,012
Share-based compensation 74 73
Pension costs – defined contribution plans 89 72
Pension costs – defined benefit plans 10 7
Other employee benefit expenses 96 79
Total 1,486 1,243
11. INCOME TAX
US$m
Thirteen months ended 31 December
2018
Twelve months ended 30 November
2017
Tax charged in the consolidated income statement
Current income tax – Hong Kong Profits Tax 148 124
Current income tax – overseas 796 526
Deferred income tax on temporary differences – 478
Total 944 1,128
The tax benefit or expense attributable to life insurance policyholder returns in Singapore, Brunei, Malaysia, Australia,
Indonesia, the Philippines, Sri Lanka and New Zealand is included in the tax charge or credit and is analysed separately in
the consolidated income statement in order to permit comparison of the underlying effective rate of tax attributable to
shareholders from year to year. The tax credit attributable to policyholders’ returns included above is US$51m (twelve
months ended 30 November 2017: tax expenses of US$128m).
| AIA GROUP LIMITED
FINANCIAL STATEMENTS

183
11. INCOME TAX (continued)
The provision for Hong Kong Profits Tax is calculated at 16.5 per cent. Taxation for overseas subsidiaries and branches is
charged at the appropriate current rates of taxation ruling in the relevant jurisdictions of which the most significant
jurisdictions are outlined below.
Thirteen months ended 31 December
2018
Twelve months ended 30 November
2017
Hong Kong 16.5% 16.5%
Thailand 20% 20%
Singapore 17% 17%
Malaysia 24% 24%
China 25% 25%
Others 12% – 30% 12% – 30%
The table above reflects the principal rate of corporate income tax as at the end of each period. The rates reflect enacted
or substantively enacted corporate tax rates throughout the period in each jurisdiction.
From fiscal years 2018 to 2020, AIA Korea is subject to an effective corporate income tax of 27.5%, which includes an
Accumulated Earnings Tax following the subsidiarisation of the branch in AIA Korea. Based on current regulations, the
corporate income tax rate will revert to 24.2% from fiscal year 2021.
ANNUAL REPORT 2018 |
OV
ER
VIE
WF
INA
NC
IAL
AN
D O
PE
RA
TIN
G R
EV
IEW
CO
RP
OR
AT
E G
OV
ER
NA
NC
EF
INA
NC
IAL
STA
TE
ME
NT
SA
DD
ITIO
NA
L IN
FO
RM
AT
ION
NOTES TO THE CONSOLIDATED FINANCIAL STATEMENTS AND SIGNIFICANT ACCOUNTING POLICIES

184
11. INCOME TAX (continued)
US$m
Thirteen months ended 31 December
2018
Twelve months ended 30 November
2017
Income tax reconciliation
Profit before income tax 4,170 7,315
Tax calculated at domestic tax rates applicable to profits in the respective jurisdictions 874 1,361
Reduction in tax payable from:
Life insurance tax(1) – (108)
Exempt investment income (312) (266)
Amount over-provided in prior years (2) (10)
Provisions for uncertain tax positions (28) –
Others – (83)
(342) (467)
Increase in tax payable from:
Life insurance tax(1) 185 –
Withholding taxes 43 17
Disallowed expenses 164 132
Unrecognised deferred tax assets 6 19
Provisions for uncertain tax positions – 66
Change in tax rate and law 2 –
Others 12 –
412 234
Total income tax expense 944 1,128
Note:
(1) Life insurance tax refers to the permanent differences which arise where the tax regime specific to the life insurance business does not adopt net income as the basis for calculating taxable profit, for example Hong Kong, where life business taxable profit is derived from life premiums.
| AIA GROUP LIMITED
FINANCIAL STATEMENTS

185
11. INCOME TAX (continued)
The movement in net deferred tax liabilities in the period may be analysed as set out below:
US$m
Net deferred tax asset/
(liability) at 1 December
Acquisition of subsidiaries(3)
Credited/(charged) to
the income statement
Credited/(charged) to othercomprehensive income Net deferred
tax asset/(liability) at period end
Fair value reserve(2)
Foreign exchange Others
31 December 2018
Revaluation of financial instruments (1,156) 1 424 (159) – – (890)
Deferred acquisition costs (2,546) (98) (474) – 56 – (3,062)
Insurance and investment contract liabilities 1,086 (360) 12 – (12) – 726
Withholding taxes (147) – (41) – 7 – (181)
Provision for expenses 146 2 (1) – (3) (7) 137
Losses available for offset against future taxable income 31 – 25 – (1) – 55
Life surplus (1) (674) – 48 – 9 – (617)
Others (326) – 7 – – (10) (329)
Total (3,586) (455) – (159) 56 (17) (4,161)
30 November 2017
Revaluation of financial instruments (1,387) – (52) 316 (33) – (1,156)
Deferred acquisition costs (2,196) – (214) – (136) – (2,546)
Insurance and investment contract liabilities 1,094 – (78) – 70 – 1,086
Withholding taxes (132) – (16) – 1 – (147)
Provision for expenses 110 – 29 – 7 – 146
Losses available for offset against future taxable income 69 – (39) – 1 – 31
Life surplus (1) (534) – (100) – (40) – (674)
Others (293) – (8) – (11) (14) (326)
Total (3,269) – (478) 316 (141) (14) (3,586)
Notes:(1) Life surplus relates to the temporary difference which arises where the taxable profits are based on actual distributions from the long-term fund.
This primarily relates to Singapore and Malaysia.(2) Of the fair value reserve deferred tax charge/(credit) of US$159m for 2018 (twelve months ended 30 November 2017: US$(316)m), US$177m
(twelve months ended 30 November 2017: US$(297)m) relates to fair value gains and losses on available for sale financial assets and US$(18)m (twelve months ended 30 November 2017: US$(19)m) relates to fair value gains and losses on available for sale financial assets transferred to income on disposal and impairment.
(3) The amount of US$455m represents a one-time adjustment in respect of the acquisition of Sovereign.
Deferred tax assets are recognised to the extent that sufficient future taxable profits will be available for realisation. The Group has not recognised deferred tax assets of US$60m (30 November 2017: US$52m) on tax losses and the temporary difference on insurance and investment contract liabilities arising from different accounting and statutory/tax reserving methodology for certain branches and subsidiaries on the basis that they have histories of tax losses and there is insufficient evidence that future profits will be available.
The Group has not provided deferred tax liabilities of US$59m (30 November 2017: US$62m) in respect of unremitted earnings of operations in two jurisdictions from which a withholding tax charge would be incurred upon distribution as the Group does not consider it probable that this portion of accumulated earnings will be remitted in the foreseeable future.
The Group has unused income tax losses carried forward in Hong Kong, Macau, Thailand, Singapore, Malaysia, China, Korea, Cambodia, New Zealand, the Philippines, Sri Lanka and Taiwan. The tax losses of Hong Kong, Singapore and New Zealand can be carried forward indefinitely. The tax losses of remaining branches and subsidiaries are due to expire within the periods ending 2021 (Macau and the Philippines), 2023 (Thailand, China and Cambodia), 2024 (Sri Lanka), 2025 (Malaysia) and 2028 (Korea and Taiwan).
ANNUAL REPORT 2018 |
OV
ER
VIE
WF
INA
NC
IAL
AN
D O
PE
RA
TIN
G R
EV
IEW
CO
RP
OR
AT
E G
OV
ER
NA
NC
EF
INA
NC
IAL
STA
TE
ME
NT
SA
DD
ITIO
NA
L IN
FO
RM
AT
ION
NOTES TO THE CONSOLIDATED FINANCIAL STATEMENTS AND SIGNIFICANT ACCOUNTING POLICIES

186
12. EARNINGS PER SHAREBasicBasic earnings per share is calculated by dividing the net profit attributable to shareholders of AIA Group Limited by the
weighted average number of ordinary shares in issue during the period. The shares held by employee share-based trusts
are not considered to be outstanding from the date of the purchase for purposes of computing basic and diluted earnings
per share.
Thirteen months ended 31 December
2018
Twelve months ended 30 November
2017
Net profit attributable to shareholders of AIA Group Limited (US$m) 3,163 6,120
Weighted average number of ordinary shares in issue (million) 12,020 12,000
Basic earnings per share (US cents per share) 26.31 51.00
DilutedDiluted earnings per share is calculated by adjusting the weighted average number of ordinary shares outstanding to
assume conversion of all dilutive potential ordinary shares. As of 31 December 2018 and 30 November 2017, the Group
has potentially dilutive instruments which are the share options, restricted share units, restricted stock purchase units and
restricted stock subscription units awarded to eligible directors, officers, employees and agents under various share-based
compensation plans as described in note 39.
Thirteen months ended 31 December
2018
Twelve months ended 30 November
2017
Net profit attributable to shareholders of AIA Group Limited (US$m) 3,163 6,120
Weighted average number of ordinary shares in issue (million) 12,020 12,000
Adjustment for share options, restricted share units, restricted stock purchase units and restricted stock subscription units awarded under share-based compensation plans (million) 35 37
Weighted average number of ordinary shares for diluted earnings per share (million) 12,055 12,037
Diluted earnings per share (US cents per share) 26.24 50.84
At 31 December 2018, 5,752,143 share options (30 November 2017: 5,340,052) were excluded from the diluted weighted
average number of ordinary shares calculation as their effect would have been anti-dilutive.
Operating profit after tax per shareOperating profit after tax (see note 6) per share is calculated by dividing the operating profit after tax attributable to
shareholders of AIA Group Limited by the weighted average number of ordinary shares in issue during the period. As of 31
December 2018 and 30 November 2017, the Group has potentially dilutive instruments which are the share options,
restricted share units, restricted stock purchase units and restricted stock subscription units awarded to eligible directors,
officers, employees and agents under various share-based compensation plans as described in note 39.
Thirteen months ended 31 December
2018
Twelve months ended 30 November
2017
Basic (US cents per share) 47.29 38.73
Diluted (US cents per share) 47.15 38.61
| AIA GROUP LIMITED
FINANCIAL STATEMENTS

187
13. DIVIDENDSDividends to shareholders of the Company attributable to the period:
US$m
Thirteen months ended 31 December
2018
Twelve months ended 30 November
2017
Interim dividend declared and paid of 29.20 Hong Kong cents per share (twelve months ended 30 November 2017: 25.62 Hong Kong cents per share) 449 393
Final dividend proposed after the reporting date of 84.80 Hong Kong cents per share (twelve months ended 30 November 2017: 74.38 Hong Kong cents per share) (1) 1,302 1,144
Total dividend excluding special dividend 1,751 1,537
Special dividend proposed after the reporting date of 9.50 Hong Kong cents per share (twelve months ended 30 November 2017: nil) (1) 146 –
1,897 1,537
Note:
(1) Based upon shares outstanding at 31 December 2018 and 30 November 2017 that are entitled to a dividend, other than those held by employee share-based trusts.
The above final and special dividends were proposed by the Board on 15 March 2019 subject to shareholders’ approval at
the AGM to be held on 17 May 2019. The proposed final and special dividends have not been recognised as a liability at the
reporting date.
The Board has recommended a special dividend for the additional month in the accounting period due to the change of the
Group’s financial year-end date from 30 November 2018 to 31 December 2018.
Dividends to shareholders of the Company attributable to the previous financial year, approved and paid during the period:
US$m
Thirteen months ended 31 December
2018
Twelve months ended 30 November
2017
Final dividend in respect of the previous financial year, approved and paid during the period of 74.38 Hong Kong cents per share (twelve months ended 30 November 2017: 63.75 Hong Kong cents per share) 1,140 983
ANNUAL REPORT 2018 |
OV
ER
VIE
WF
INA
NC
IAL
AN
D O
PE
RA
TIN
G R
EV
IEW
CO
RP
OR
AT
E G
OV
ER
NA
NC
EF
INA
NC
IAL
STA
TE
ME
NT
SA
DD
ITIO
NA
L IN
FO
RM
AT
ION
NOTES TO THE CONSOLIDATED FINANCIAL STATEMENTS AND SIGNIFICANT ACCOUNTING POLICIES

188
14. INTANGIBLE ASSETS
US$m GoodwillComputer
software
Distribution and other
rights Total
Cost
At 1 December 2016 775 458 815 2,048
Additions – 53 77 130
Disposals – (2) – (2)
Foreign exchange movements 60 17 15 92
At 30 November 2017 835 526 907 2,268
Additions – 86 1 87
Acquisition of subsidiaries 167 – – 167
Disposals – (4) (1) (5)
Foreign exchange movements (26) (10) (19) (55)
At 31 December 2018 976 598 888 2,462
Accumulated amortisation
At 1 December 2016 (4) (232) (69) (305)
Amortisation charge for the year – (51) (33) (84)
Foreign exchange movements – (14) (1) (15)
At 30 November 2017 (4) (297) (103) (404)
Amortisation charge for the period – (57) (40) (97)
Disposals – 2 1 3
Foreign exchange movements – 3 3 6
At 31 December 2018 (4) (349) (139) (492)
Net book value
At 30 November 2017 831 229 804 1,864
At 31 December 2018 972 249 749 1,970
The Group holds intangible assets for its long-term use and the annual amortisation charge of US$90m (30 November 2017: US$84m) approximates the amount that is expected to be recovered through consumption within 12 months after the end of the reporting period.
Intangible assets in this note exclude deferred acquisition and origination costs, which are separately disclosed with further details provided in note 19.
Impairment tests for goodwillGoodwill arises primarily in respect of the Group’s insurance business in Malaysia. Goodwill is tested for impairment by comparing the carrying amount of the cash-generating unit (group of units), including goodwill, to the recoverable amount of that cash-generating unit (group of units). If the recoverable amount of the unit (group of units) exceeds the carrying amount of the unit (group of units), the goodwill allocated to that unit (group of units) shall be regarded as not impaired. The recoverable amount is the value in use of the cash-generating unit (group of units) unless otherwise stated. The value in use is determined by calculating the present value of expected future cash flows plus a multiple of the present value of the new business generated.
Value in use is calculated as an actuarially determined appraisal value, based on the embedded value of the business and the value from future new business.
The key assumptions used in the embedded value calculations, which are detailed in Section 5 of Supplementary Embedded Value Information, include risk discount rate, investment returns, mortality, morbidity, persistency, expenses and inflation. The value from future new business is calculated based on a combination of indicators which include, among others, a multiple of the projected one-year value of new business (VONB), taking into account recent production mix, business strategy and market trends. The Group may apply alternative method to estimate the value of future new business if the described method is not appropriate under the circumstances.
| AIA GROUP LIMITED
FINANCIAL STATEMENTS

189
15. INVESTMENTS IN ASSOCIATES AND JOINT VENTURES
US$m
As at 31 December
2018
As at 30 November
2017
Group
Investments in associates 602 636
Investment in joint ventures 8 6
Total 610 642
Investments in associates and joint ventures are held for their long-term contribution to the Group’s performance and so
all amounts are expected to be realised more than 12 months after the end of the reporting period.
The Group’s interests in its principal associates and joint ventures are as follows:
Group’s interest %
Place of incorporation
Principal activity
Type of shares held
As at 31 December
2018
As at 30 November
2017
Tata AIA Life Insurance Company Limited India Insurance Ordinary 49% 49%
All associates and joint ventures are unlisted.
Aggregated financial information of associates and joint venturesThe investments in the associates and joint ventures are measured using the equity method. The following table analyses,
in aggregate, the carrying amount and share of profit and other comprehensive income of these associates and joint
ventures.
US$m
Thirteen months ended 31 December
2018
Twelve months ended 30 November
2017
Carrying amount in the statement of financial position 610 642
Profit from continuing operations – –
Other comprehensive expenses (45) (24)
Total comprehensive expenses (45) (24)
ANNUAL REPORT 2018 |
OV
ER
VIE
WF
INA
NC
IAL
AN
D O
PE
RA
TIN
G R
EV
IEW
CO
RP
OR
AT
E G
OV
ER
NA
NC
EF
INA
NC
IAL
STA
TE
ME
NT
SA
DD
ITIO
NA
L IN
FO
RM
AT
ION
NOTES TO THE CONSOLIDATED FINANCIAL STATEMENTS AND SIGNIFICANT ACCOUNTING POLICIES

190
16. PROPERTY, PLANT AND EQUIPMENT
US$m
Property held for
own useComputer hardware
Fixtures and fittings and
others Total
Cost or revaluation
At 1 December 2016 905 188 464 1,557
Additions 1 23 66 90
Disposals (7) (21) (58) (86)
Net transfers to investment property (24) – – (24)
Increase from valuation 62 – – 62
Foreign exchange movements 42 11 18 71
At 30 November 2017 979 201 490 1,670
Additions 1 23 75 99
Acquisition of subsidiaries – – 10 10
Disposals (10) (26) (40) (76)
Net transfers from investment property 12 – – 12
Increase from valuation 5 – – 5
Foreign exchange movements (5) (3) (9) (17)
At 31 December 2018 982 195 526 1,703
Accumulated depreciation
At 1 December 2016 – (160) (265) (425)
Depreciation charge for the year (16) (18) (47) (81)
Disposals 5 19 37 61
Revaluation adjustment 10 – – 10
Foreign exchange movements 1 (9) (14) (22)
At 30 November 2017 – (168) (289) (457)
Depreciation charge for the period (30) (20) (60) (110)
Disposals – 23 35 58
Net transfers from investment property (4) – – (4)
Revaluation adjustment 33 – – 33
Foreign exchange movements 1 3 6 10
At 31 December 2018 – (162) (308) (470)
Net book value
At 30 November 2017 979 33 201 1,213
At 31 December 2018 982 33 218 1,233
Properties held for own use are carried at fair value at the reporting date less accumulated depreciation. The fair value at
the reporting date is determined by independent professional valuers. Details of valuation techniques and process are
disclosed in notes 3 and 22.
During the reporting period, no expenditure (30 November 2017: nil) recognised in the carrying amount of property held
for own use was in the course of its construction. Increases from revaluation on property held for own use of US$38m
(twelve months ended 30 November 2017: US$72m) were taken to other comprehensive income.
If property held for own use were stated on a historical cost basis, the carrying value would be US$377m (30 November
2017: US$373m). The Group holds property, plant and equipment for its long-term use and, accordingly, the annual
depreciation charge approximates to the amount expected to be recovered through consumption within 12 months after
the end of the reporting period.
| AIA GROUP LIMITED
FINANCIAL STATEMENTS

191
17. INVESTMENT PROPERTY
US$m
Fair value
At 1 December 2016 3,910
Additions and capitalised subsequent expenditures 10
Disposals (12)
Net transfers from property, plant and equipment 24
Fair value gain 367
Foreign exchange movements 66
At 30 November 2017 4,365
Additions and capitalised subsequent expenditures 38
Disposals (7)
Net transfers to property, plant and equipment (8)
Net transfers to other assets (34)
Fair value gain 477
Foreign exchange movements (37)
At 31 December 2018 4,794
Investment properties are carried at fair value at the reporting date as determined by independent professional valuers.
Details of valuation techniques and process are disclosed in notes 3 and 22.
The Group leases out its investment property under operating leases. The leases typically run for an initial period of one to
ten years, with an option to renew the lease based on future negotiations. Lease payments are usually negotiated every one
to four years to reflect market rentals. There were not any material contingent rentals earned as income for the period.
Rental income generated from investment property amounted to US$184m (twelve months ended 30 November 2017:
US$151m). Direct operating expenses (including repair and maintenance) on investment property that generates rental
income amounted to US$38m (twelve months ended 30 November 2017: US$31m).
The Group owns investment property in the form of freehold land outside Hong Kong and leasehold land under finance
lease. Leasehold land under operating leases which is held for long-term rental or capital appreciation or both that is not
occupied by the Group is classified as investment property. They are initially recognised at cost with changes in fair values
in subsequent periods recognised in the consolidated income statement. The Group does not hold freehold land in Hong
Kong.
The future minimum operating lease rental income under non-cancellable operating leases that the Group expects to
receive in future periods may be analysed as follows:
US$m
As at31 December
2018
As at30 November
2017
Leases of investment property
Expiring no later than one year 148 135
Expiring later than one year and no later than five years 252 241
Expiring after five years or more 24 31
Total 424 407
ANNUAL REPORT 2018 |
OV
ER
VIE
WF
INA
NC
IAL
AN
D O
PE
RA
TIN
G R
EV
IEW
CO
RP
OR
AT
E G
OV
ER
NA
NC
EF
INA
NC
IAL
STA
TE
ME
NT
SA
DD
ITIO
NA
L IN
FO
RM
AT
ION
NOTES TO THE CONSOLIDATED FINANCIAL STATEMENTS AND SIGNIFICANT ACCOUNTING POLICIES

192
18. REINSURANCE ASSETS
US$m
As at31 December
2018
As at30 November
2017
Amounts recoverable from reinsurers 539 506
Ceded insurance and investment contract liabilities 2,348 1,975
Total 2,887 2,481
19. DEFERRED ACQUISITION AND ORIGINATION COSTS
US$m
As at31 December
2018
As at30 November
2017
Carrying amount
Deferred acquisition costs on insurance contracts 24,162 21,345
Deferred origination costs on investment contracts 347 373
Value of business acquired 454 129
Less: Upfront reinsurance premium rebate (337) –
Total 24,626 21,847
Thirteen months ended 31 December
2018
Twelve months ended 30 November
2017
Movements in the period
At beginning of financial period 21,847 18,898
Deferral and amortisation of acquisition and origination costs 2,507 2,318
Foreign exchange movements (301) 833
Impact of assumption changes 21 (77)
Other movements 552 (125)
At end of financial period 24,626 21,847
Deferred acquisition and origination costs are expected to be recoverable over the mean term of the Group’s insurance and
investment contracts, and liability adequacy testing is performed at least annually to confirm their recoverability.
Accordingly, the annual amortisation charge, which varies with investment performance for certain universal life and
unit-linked products, approximates to the amount which is expected to be realised within 12 months of the end of the
reporting period.
During the period, there was an addition to value of business of US$348m attributable to the acquisition of Sovereign,
which has been applied in part against the reinsurance liability arising from the upfront reinsurance commission also
attributable to the acquisition of Sovereign.
| AIA GROUP LIMITED
FINANCIAL STATEMENTS

193
20. FINANCIAL INVESTMENTSThe following tables analyse the Group’s financial investments by type and nature. The Group manages its financial investments in two distinct categories: Unit-linked Investments and Policyholder and Shareholder Investments. The investment risk in respect of Unit-linked Investments is generally wholly borne by our customers, and does not directly affect the profit for the period before tax. Furthermore, unit-linked contract holders are responsible for allocation of their policy values amongst investment options offered by the Group. Although profit for the period before tax is not affected by Unit-linked Investments, the investment return from such financial investments is included in the Group’s profit for the period before tax, as the Group has elected the fair value option for all Unit-linked Investments with corresponding changes in insurance and investment contract liabilities for unit-linked contracts. Policyholder and Shareholder Investments include all financial investments other than Unit-linked Investments. The investment risk in respect of Policyholder and Shareholder Investments is partially or wholly borne by the Group.
Policyholder and Shareholder Investments are further categorised as Participating Funds and other participating business with discretionary expected sharing with policyholders and underlying distinct investment Portfolios (“Other Participating Business with distinct Portfolios”) and Other Policyholder and Shareholder. Other Participating Business with distinct Portfolios refers to business where it is expected that the policyholder will receive, at the discretion of the insurer, additional benefits based on the performance of underlying segregated investment assets where this asset segregation is supported by an explicit statutory reserve and reporting in the relevant territory.
The reason for separately analysing financial investments held by Participating Funds and Other Participating Business with distinct Portfolios is that Participating Funds are subject to local regulations that generally prescribe a minimum proportion of policyholder participation in declared dividends and for Other Participating Business with distinct Portfolios it is, as explained above, expected that the policyholder will receive, at the discretion of the insurer, additional benefits based on the performance of the underlying segregated investment assets where this asset segregation is supported by an explicit statutory reserve and reporting in the relevant territory. The Group has elected the fair value option for debt and equity securities of Participating Funds. The Group’s accounting policy is to record an insurance liability for the proportion of net assets of the Participating Funds that would be allocated to policyholders assuming all performance would be declared as a dividend based upon local regulations as at the date of the statement of financial position. As a result, the Group’s net profit before tax for the period is impacted by the proportion of investment return that would be allocated to shareholders as described above. For Other Participating Business with distinct Portfolios, the Group either have discretion as to the timing or amount of additional benefits to the policyholders. The Group has elected the fair value option for equity securities and the available for sale classification of the majority of debt securities. The investment risk from Other Participating Business with distinct Portfolios directly impacts the Group’s financial statements, but it is expected that a proportion of investment return may be allocated to policyholders through policyholder dividends.
Other Policyholder and Shareholder Investments are distinct from Unit-linked Investments, Participating Funds and Other Participating Business with distinct Portfolios as there is not any direct contractual or regulatory requirement governing the amount, if any, for allocation to policyholders or it is not expected that the policyholder will receive at the discretion of the insurer additional benefits based on the performance of the underlying segregated investment assets where this asset segregation is supported by an explicit statutory reserve and reporting in the relevant territory. The Group has elected to apply the fair value option for equity securities in this category and the available for sale classification in respect of the majority of debt securities in this category. The investment risk from investments in this category directly impacts the Group’s financial statements. Although a proportion of investment return may be allocated to policyholders through policyholder dividends, the Group’s accounting policy for insurance and certain investment contract liabilities utilises a net level premium methodology that includes best estimates as at the date of issue for non-guaranteed participation. To the extent investment return from these investments either is not allocated to participating contracts or varies from the best estimates, it will impact the Group’s profit before tax.
In the following tables, “FVTPL” indicates financial investments classified at fair value through profit or loss and “AFS” indicates financial investments classified as available for sale.
Debt securitiesIn compiling the tables, external ratings have been used where available. Where external ratings are not readily available an internal rating methodology has been adopted, if applicable. External ratings for government bonds are based on issuers as well as currencies of issuances. The following conventions have been adopted to conform the various ratings.
External ratings Internal ratings Reported as
Standard and Poor’s Moody’s
AAA Aaa 1 AAA
AA+ to AA- Aa1 to Aa3 2+ to 2- AA
A+ to A- A1 to A3 3+ to 3- A
BBB+ to BBB- Baa1 to Baa3 4+ to 4- BBB
BB+ and below Ba1 and below 5+ and below Below investment grade(1)
Note:(1) Unless otherwise identified individually.
ANNUAL REPORT 2018 |
OV
ER
VIE
WF
INA
NC
IAL
AN
D O
PE
RA
TIN
G R
EV
IEW
CO
RP
OR
AT
E G
OV
ER
NA
NC
EF
INA
NC
IAL
STA
TE
ME
NT
SA
DD
ITIO
NA
L IN
FO
RM
AT
ION
NOTES TO THE CONSOLIDATED FINANCIAL STATEMENTS AND SIGNIFICANT ACCOUNTING POLICIES

194
20. FINANCIAL INVESTMENTS (continued)
Debt securities (continued)
Debt securities by type comprise the following:
Policyholder and shareholder
Consolidated investment
funds(2)
Participating funds and Other participating
business with distinct portfolios
Other policyholder and shareholder Unit-linked
US$m Rating FVTPL AFS FVTPL AFS Subtotal FVTPL FVTPL Total
31 December 2018
Government bonds – issued in local currency
Thailand A – – – 13,108 13,108 – – 13,108
China A 1,952 – – 10,267 12,219 42 – 12,261
Korea AA – – – 6,989 6,989 283 – 7,272
Singapore AAA 2,753 – – 1,247 4,000 602 – 4,602
Philippines BBB – – – 1,844 1,844 49 – 1,893
Malaysia A 1,575 – – 629 2,204 74 – 2,278
United States AA 262 642 6 2,760 3,670 9 – 3,679
Indonesia BBB 81 – 33 319 433 45 – 478
Other(1) 353 – 355 794 1,502 22 – 1,524
Subtotal 6,976 642 394 37,957 45,969 1,126 – 47,095
Government bonds – foreign currency
AAA – – – – – 7 – 7
AA 57 379 – 639 1,075 21 – 1,096
A 95 280 – 619 994 22 – 1,016
BBB 190 331 21 1,906 2,448 150 – 2,598
Below investment grade 3 2 6 31 42 – – 42
Subtotal 345 992 27 3,195 4,559 200 – 4,759
Government agency bonds(3)
AAA 1,683 35 – 828 2,546 55 – 2,601
AA 165 91 – 2,952 3,208 34 303 3,545
A 2,480 214 3 2,317 5,014 72 35 5,121
BBB 296 151 11 1,497 1,955 6 – 1,961
Below investment grade 51 – 1 129 181 11 – 192
Not rated – – – 6 6 – – 6
Subtotal 4,675 491 15 7,729 12,910 178 338 13,426
Notes:
(1) Of the total government bonds issued in local currency listed as “Other” at 31 December 2018, 71 per cent are rated as investment grade and a further 21 per cent are rated BB- and above. The remaining are rated below BB-.
(2) Consolidated investment funds reflect 100 per cent of assets and liabilities held by such funds.
(3) Government agency bonds comprise bonds issued by government-sponsored institutions such as national, provincial and municipal authorities; government-related entities; multilateral development banks and supranational organisations.
| AIA GROUP LIMITED
FINANCIAL STATEMENTS

195
20. FINANCIAL INVESTMENTS (continued)
Debt securities (continued)
Policyholder and shareholder
Consolidated investment
funds(2)
Participating funds and Other participating
business with distinct portfolios
Other policyholder and shareholder Unit-linked
US$m FVTPL AFS FVTPL AFS Subtotal FVTPL FVTPL Total
31 December 2018
Corporate bonds
AAA 43 178 – 368 589 5 – 594
AA 468 1,661 17 3,149 5,295 17 382 5,694
A 4,938 8,531 37 17,490 30,996 309 1,147 32,452
BBB 4,161 8,890 123 18,439 31,613 632 169 32,414
Below investment grade 500 276 15 1,739 2,530 149 – 2,679
Not rated – – 2 1 3 113 – 116
Subtotal 10,110 19,536 194 41,186 71,026 1,225 1,698 73,949
Structured securities(4)
AAA – – – 10 10 – – 10
AA 30 10 – 100 140 – – 140
A 27 132 – 191 350 – – 350
BBB 143 178 – 131 452 – – 452
Below investment grade – – – 4 4 – – 4
Not rated 17 – 18 1 36 – – 36
Subtotal 217 320 18 437 992 – – 992
Total(5) 22,323 21,981 648 90,504 135,456 2,729 2,036 140,221
Notes:
(2) Consolidated investment funds reflect 100 per cent of assets and liabilities held by such funds.
(4) Structured securities include collateralised debt obligations, mortgage-backed securities and other asset-backed securities.
(5) Debt securities of US$5,282m are restricted due to local regulatory requirements.
ANNUAL REPORT 2018 |
OV
ER
VIE
WF
INA
NC
IAL
AN
D O
PE
RA
TIN
G R
EV
IEW
CO
RP
OR
AT
E G
OV
ER
NA
NC
EF
INA
NC
IAL
STA
TE
ME
NT
SA
DD
ITIO
NA
L IN
FO
RM
AT
ION
NOTES TO THE CONSOLIDATED FINANCIAL STATEMENTS AND SIGNIFICANT ACCOUNTING POLICIES

196
20. FINANCIAL INVESTMENTS (continued)
Debt securities (continued)
Policyholder and shareholder(4)
Consolidated investment
funds(2)
Participating funds and Other participating
business with distinct portfolios
Other policyholder and shareholder Unit-linked
US$m Rating FVTPL AFS FVTPL AFS Subtotal FVTPL FVTPL Total
30 November 2017
Government bonds – issued in local currency
Thailand A – – – 13,141 13,141 – – 13,141
China A 1,520 – – 6,821 8,341 27 – 8,368
Korea AA – – – 5,439 5,439 272 – 5,711
Singapore AAA 2,440 – – 1,230 3,670 476 – 4,146
Philippines BBB – – – 2,346 2,346 55 – 2,401
Malaysia A 1,249 – – 562 1,811 25 – 1,836
United States AA 168 24 – 3,076 3,268 1 – 3,269
Indonesia BBB 77 – 25 379 481 55 – 536
Other(1) 6 – – 744 750 2 – 752
Subtotal 5,460 24 25 33,738 39,247 913 – 40,160
Government bonds – foreign currency
AAA – – – – – 8 – 8
AA 36 274 – 525 835 25 – 860
A 90 252 – 579 921 16 – 937
BBB 117 338 23 1,339 1,817 185 – 2,002
Below investment grade 6 6 6 47 65 – – 65
Subtotal 249 870 29 2,490 3,638 234 – 3,872
Government agency bonds(3)
AAA 1,184 61 – 847 2,092 90 – 2,182
AA 367 119 – 3,398 3,884 63 263 4,210
A 2,084 205 3 2,846 5,138 38 56 5,232
BBB 198 127 10 1,366 1,701 5 – 1,706
Below investment grade 71 35 1 225 332 14 – 346
Subtotal 3,904 547 14 8,682 13,147 210 319 13,676
Notes:
(1) Of the total government bonds issued in local currency listed as “Other” at 30 November 2017, 44 per cent are rated as investment grade and a further 38 per cent are rated BB- and above. The remaining are rated below BB-.
(2) Consolidated investment funds reflect 100 per cent of assets and liabilities held by such funds.
(3) Government agency bonds comprise bonds issued by government-sponsored institutions such as national, provincial and municipal authorities; government-related entities; multilateral development banks and supranational organisations.
(4) The comparative information has been adjusted to conform to the current period presentation.
| AIA GROUP LIMITED
FINANCIAL STATEMENTS

197
20. FINANCIAL INVESTMENTS (continued)
Debt securities (continued)
Policyholder and shareholder(4)
Consolidated investment
funds(2)
Participating funds and Other participating
business with distinct portfolios
Other policyholder and shareholder Unit-linked
US$m FVTPL AFS FVTPL AFS Subtotal FVTPL FVTPL Total
30 November 2017
Corporate bonds
AAA 46 154 – 277 477 5 – 482
AA 475 1,148 17 2,873 4,513 11 349 4,873
A 5,198 7,511 30 18,639 31,378 377 1,139 32,894
BBB 4,510 7,541 106 17,920 30,077 598 181 30,856
Below investment grade 679 391 19 2,030 3,119 191 – 3,310
Not rated – – 2 – 2 177 – 179
Subtotal 10,908 16,745 174 41,739 69,566 1,359 1,669 72,594
Structured securities(5)
AAA – – – 9 9 – – 9
AA – 10 – 54 64 – – 64
A 18 144 – 157 319 – – 319
BBB 165 167 – 83 415 – – 415
Below investment grade – – – 6 6 – – 6
Not rated 31 – 21 1 53 – – 53
Subtotal 214 321 21 310 866 – – 866
Total(6) 20,735 18,507 263 86,959 126,464 2,716 1,988 131,168
Notes:
(2) Consolidated investment funds reflect 100 per cent of assets and liabilities held by such funds.
(4) The comparative information has been adjusted to conform to the current period presentation.
(5) Structured securities include collateralised debt obligations, mortgage-backed securities and other asset-backed securities.
(6) Debt securities of US$4,900m are restricted due to local regulatory requirements.
The Group’s debt securities classified at fair value through profit or loss are all designated at fair value through profit or
loss.
ANNUAL REPORT 2018 |
OV
ER
VIE
WF
INA
NC
IAL
AN
D O
PE
RA
TIN
G R
EV
IEW
CO
RP
OR
AT
E G
OV
ER
NA
NC
EF
INA
NC
IAL
STA
TE
ME
NT
SA
DD
ITIO
NA
L IN
FO
RM
AT
ION
NOTES TO THE CONSOLIDATED FINANCIAL STATEMENTS AND SIGNIFICANT ACCOUNTING POLICIES

198
20. FINANCIAL INVESTMENTS (continued)
Equity securitiesEquity securities by type comprise the following:
Policyholder and shareholder
Participating funds and Other
participating business with
distinct portfolios
Other policyholder
and shareholder Unit-linked
Consolidated investment
funds(1)
US$m FVTPL FVTPL Subtotal FVTPL FVTPL Total
31 December 2018
Equity shares 9,225 5,042 14,267 4,516 – 18,783
Interests in investment funds 4,667 747 5,414 13,902 – 19,316
Total 13,892 5,789 19,681 18,418 – 38,099
Policyholder and shareholder(2)
Participating funds and Other
participating business with
distinct portfolios
Other policyholder
and shareholder Unit-linked
Consolidated investment
funds(1)
US$m FVTPL FVTPL Subtotal FVTPL FVTPL Total
30 November 2017
Equity shares 8,730 5,168 13,898 4,610 – 18,508
Interests in investment funds 3,154 711 3,865 14,343 – 18,208
Total 11,884 5,879 17,763 18,953 – 36,716
Note:
(1) Consolidated investment funds reflect 100 per cent of assets and liabilities held by such funds.
(2) The comparative information has been adjusted to conform to the current year presentation.
Debt and equity securities
US$m
As at31 December
2018
As at30 November
2017
Debt securities
Listed 111,008 100,647
Unlisted 29,213 30,521
Total 140,221 131,168
Equity securities
Listed 20,060 20,205
Unlisted(1) 18,039 16,511
Total 38,099 36,716
Note:
(1) Including US$16,495m (30 November 2017: US$15,375m) of investment funds which can be redeemed daily.
| AIA GROUP LIMITED
FINANCIAL STATEMENTS

199
20. FINANCIAL INVESTMENTS (continued)
Interests in structured entitiesThe Group has determined that the investment funds and structured securities, such as collateralised debt obligations,
mortgage-backed securities and other asset-backed securities that the Group has interest are structured entities.
The Group has consolidated certain investment funds for which the Group provides guarantee on capital or rate of return
to the investors and deemed to have control based on an analysis of the guidance in IFRS 10. For these investment funds,
the Group has the ability to reduce the guaranteed rates of return, subject to obtaining approvals of applicable regulators.
The Group has an obligation to absorb losses in the event that the returns of the funds are insufficient to cover the capital
or rate of return guarantee provided to the investors.
The following table summarises the Group’s interest in unconsolidated structured entities:
As at 31 December 2018 As at 30 November 2017
US$mInvestment
fundsStructured securities(1)
Investment funds
Structured securities(1)
Available for sale debt securities 1,506(2) 757 1,250(2) 631
Debt securities at fair value through profit or loss 638(2) 235 520(2) 235
Equity securities at fair value through profit or loss 19,316 – 18,208 –
Total 21,460 992 19,978 866
Notes:
(1) Structured securities include collateralised debt obligation, mortgage-backed securities and other asset-backed securities.
(2) Balance represents the Group’s interests in debt securities issued by real estate investment trusts.
The Group’s maximum exposure to loss arising from its interests in these unconsolidated structured entities is limited to
the carrying amount of the assets. Dividend income and interest income are received during the reporting period from
these interests in unconsolidated structured entities.
In addition, the Group receives management fees and trustee fees in respect of providing trustee, management and
administrative services to certain retirement scheme funds and investment funds. These funds are not held and the
associated investment risks are not borne by the Group, the Group does not have exposure to loss in these funds.
ANNUAL REPORT 2018 |
OV
ER
VIE
WF
INA
NC
IAL
AN
D O
PE
RA
TIN
G R
EV
IEW
CO
RP
OR
AT
E G
OV
ER
NA
NC
EF
INA
NC
IAL
STA
TE
ME
NT
SA
DD
ITIO
NA
L IN
FO
RM
AT
ION
NOTES TO THE CONSOLIDATED FINANCIAL STATEMENTS AND SIGNIFICANT ACCOUNTING POLICIES

200
20. FINANCIAL INVESTMENTS (continued)
Loans and deposits
US$m
As at31 December
2018
As at30 November
2017
Policy loans 2,896 2,726
Mortgage loans on residential real estate 613 600
Mortgage loans on commercial real estate 46 53
Other loans 742 889
Allowance for loan losses (12) (12)
Loans 4,285 4,256
Term deposits 1,521 2,138
Promissory notes(1) 1,586 1,579
Total 7,392 7,973
Note:
(1) The promissory notes are issued by a government.
Certain term deposits with financial institutions and promissory notes are restricted due to local regulatory requirements.
The restricted balance held within term deposits and promissory notes is US$1,782m (30 November 2017: US$1,749m).
Other loans include receivables from reverse repurchase agreements under which the Group does not take physical
possession of securities purchased under the agreements. Sales or transfers of securities are not permitted by the
respective clearing house on which they are registered while the loan is outstanding. In the event of default by the
counterparty to repay the loan, the Group has the right to the underlying securities held by the clearing house. At 31
December 2018, the carrying value of such receivables is US$149m (30 November 2017: US$326m).
| AIA GROUP LIMITED
FINANCIAL STATEMENTS

201
21. DERIVATIVE FINANCIAL INSTRUMENTSThe Group’s non-hedge derivative exposure was as follows:
Fair value
US$m Notional amount Assets Liabilities
31 December 2018
Foreign exchange contracts
Cross-currency swaps 7,825 224 (159)
Forwards 4,456 11 (42)
Foreign exchange futures 105 – –
Currency options 6 – –
Total foreign exchange contracts 12,392 235 (201)
Interest rate contracts
Interest rate swaps 4,730 122 (42)
Other
Warrants and options 4,211 57 –
Forward contracts 275 16 –
Netting (105) – –
Total 21,503 430 (243)
30 November 2017
Foreign exchange contracts
Cross-currency swaps 7,569 249 (164)
Forwards 5,921 47 (142)
Foreign exchange futures 139 – –
Currency options 7 – –
Total foreign exchange contracts 13,636 296 (306)
Interest rate contracts
Interest rate swaps 3,157 51 (55)
Other
Warrants and options 161 16 –
Netting (139) – –
Total 16,815 363 (361)
The column “notional amount” in the above table represents the pay leg of derivative transactions other than equity index
option. For certain equity-index call and put options with same notional amount that are purchased to hedge the downside
risk of the underlying equities by means of a collar strategy, the notional amount represents the exposure of the hedged
equities.
Of the total derivatives, US$6m (30 November 2017: US$8m) are listed in exchange or dealer markets and the rest are
over-the-counter (OTC) derivatives. OTC derivative contracts are individually negotiated between contracting parties and
not cleared through an exchange. OTC derivatives include forwards, swaps and options. Derivatives are subject to various
risks including market, liquidity and credit risks, similar to those related to the underlying financial instruments.
Derivative assets and derivative liabilities are recognised in the consolidated statement of financial position as financial
assets at fair value through profit or loss and derivative financial liabilities respectively. The Group’s derivative contracts
are established to economic hedge financial exposures. The Group adopts hedge accounting in limited circumstances. The
notional or contractual amounts associated with derivative financial instruments are not recorded as assets or liabilities in
the consolidated statement of financial position as they do not represent the fair value of these transactions. The notional
amounts in the previous table reflect the aggregate of individual derivative positions on a gross basis and so give an
indication of the overall scale of derivative transactions.
ANNUAL REPORT 2018 |
OV
ER
VIE
WF
INA
NC
IAL
AN
D O
PE
RA
TIN
G R
EV
IEW
CO
RP
OR
AT
E G
OV
ER
NA
NC
EF
INA
NC
IAL
STA
TE
ME
NT
SA
DD
ITIO
NA
L IN
FO
RM
AT
ION
NOTES TO THE CONSOLIDATED FINANCIAL STATEMENTS AND SIGNIFICANT ACCOUNTING POLICIES

202
21. DERIVATIVE FINANCIAL INSTRUMENTS (continued)
Foreign exchange contractsForeign exchange forward and futures contracts represent agreements to exchange the currency of one country for the
currency of another country at an agreed price and settlement date. Currency options are agreements that give the buyer
the right to exchange the currency of one country for the currency of another country at agreed prices and settlement
dates. Currency swaps are contractual agreements that involve the exchange of both periodic and final amounts in two
different currencies. Exposure to gains and losses on the foreign exchange contracts will increase or decrease over their
respective lives as a function of maturity dates, interest and foreign exchange rates, implied volatilities of the underlying
indices and the timing of payments.
Interest rate swapsInterest rate swaps are contractual agreements between two parties to exchange periodic payments in the same currency,
each of which is computed on a different interest rate basis, on a specified notional amount. Most interest rate swaps
involve the net exchange of payments calculated as the difference between the fixed and floating rate interest payments.
Other derivativesWarrants and options are option agreements that give the owner the right to buy or sell securities at an agreed price and
settlement date. Forward contracts are contractual obligations to buy or sell a financial instrument on a predetermined
future date at a specified price.
Netting adjustmentThe netting adjustment is related to futures contracts executed through clearing house where the settlement arrangement
satisfied the netting criteria under IFRS.
Collateral under derivative transactionsAt 31 December 2018, the Group had posted cash collateral of US$20m (30 November 2017: US$10m) and pledged debt
securities with carrying value of US$141m (30 November 2017: US$227m) for liabilities and held cash collateral of
US$251m (30 November 2017: US$141m), debt securities collateral with carrying value of US$41m (30 November 2017:
US$15m) for assets in respect of derivative transactions. The Group did not sell or repledge the collateral received. These
transactions are conducted under terms that are usual and customary to collateralised transactions including, where
relevant, standard securities lending and repurchase agreements.
| AIA GROUP LIMITED
FINANCIAL STATEMENTS

203
22. FAIR VALUE MEASUREMENTFair value of financial instrumentsThe Group classifies all financial assets as either at fair value through profit or loss, or as available for sale, which are
carried at fair value, or as loans and receivables, which are carried at amortised cost. Financial liabilities are classified as
either at fair value through profit or loss or at amortised cost, except for investment contracts with DPF which are accounted
for under IFRS 4.
The following tables present the fair values of the Group’s financial assets and financial liabilities:
Fair value
US$m Notes
Fair value through
profit or lossAvailable
for sale
Cost/amortised
cost
Total carrying
valueTotal fair
value
31 December 2018
Financial investments 20
Loans and deposits – – 7,392 7,392 7,392
Debt securities 27,736 112,485 – 140,221 140,221
Equity securities 38,099 – – 38,099 38,099
Derivative financial instruments 21 430 – – 430 430
Reinsurance receivables 18 – – 539 539 539
Other receivables 23 – – 2,242 2,242 2,242
Accrued investment income 23 – – 1,604 1,604 1,604
Cash and cash equivalents 25 – – 2,451 2,451 2,451
Financial assets 66,265 112,485 14,228 192,978 192,978
Notes
Fair value through
profit or loss
Cost/amortised
cost
Total carrying
valueTotal fair
value
Financial liabilities
Investment contract liabilities 27 6,907 549 7,456 7,456
Borrowings 29 – 4,954 4,954 4,984
Obligations under repurchase and securities lending agreements 30 – 1,683 1,683 1,683
Derivative financial instruments 21 243 – 243 243
Other liabilities 33 1,153 4,831 5,984 5,984
Financial liabilities 8,303 12,017 20,320 20,350
ANNUAL REPORT 2018 |
OV
ER
VIE
WF
INA
NC
IAL
AN
D O
PE
RA
TIN
G R
EV
IEW
CO
RP
OR
AT
E G
OV
ER
NA
NC
EF
INA
NC
IAL
STA
TE
ME
NT
SA
DD
ITIO
NA
L IN
FO
RM
AT
ION
NOTES TO THE CONSOLIDATED FINANCIAL STATEMENTS AND SIGNIFICANT ACCOUNTING POLICIES

204
22. FAIR VALUE MEASUREMENT (continued)
Fair value of financial instruments (continued)
Fair value
US$m Notes
Fair value through
profit or lossAvailable
for sale
Cost/amortised
cost
Total carrying
valueTotal fair
value
30 November 2017
Financial investments 20
Loans and deposits – – 7,973 7,973 7,977
Debt securities 25,702 105,466 – 131,168 131,168
Equity securities 36,716 – – 36,716 36,716
Derivative financial instruments 21 363 – – 363 363
Reinsurance receivables 18 – – 506 506 506
Other receivables 23 – – 2,150 2,150 2,150
Accrued investment income 23 – – 1,541 1,541 1,541
Cash and cash equivalents 25 – – 2,289 2,289 2,289
Financial assets 62,781 105,466 14,459 182,706 182,710
Notes
Fair value through
profit or loss
Cost/amortised
cost
Total carrying
valueTotal fair
value
Financial liabilities
Investment contract liabilities(1) 27 7,020 580 7,600 7,600
Borrowings 29 – 3,958 3,958 4,144
Obligations under repurchase agreements 30 – 1,883 1,883 1,883
Derivative financial instruments 21 361 – 361 361
Other liabilities 33 1,225 4,663 5,888 5,888
Financial liabilities 8,606 11,084 19,690 19,876
The carrying amount of assets included in the above tables represents the maximum credit exposure.
Foreign currency exposure, including the net notional amount of foreign currency derivative positions, is shown in note 37
for the Group’s key foreign exchange exposures.
The fair value of investment contract liabilities measured at amortised cost is not considered to be materially different from
the amortised cost carrying value.
The carrying value of financial instruments expected to be settled within 12 months (after taking into account valuation
allowances, where applicable) is not considered to be materially different from the fair value.
Note:
(1) The comparative information has been adjusted to conform to the current period presentation.
| AIA GROUP LIMITED
FINANCIAL STATEMENTS

205
22. FAIR VALUE MEASUREMENT (continued)
Fair value measurements on a recurring basisThe Group measures at fair value property held for own use, investment property, financial instruments classified at fair
value through profit or loss, available for sale securities portfolios, derivative assets and liabilities, investments held by
investment funds which are consolidated, investments in non-consolidated investment funds and certain investment
contract liabilities on a recurring basis.
The fair value of a financial instrument is the amount that would be received on sale of an asset or paid to transfer a liability
in an orderly transaction between market participants at the measurement date.
The degree of judgement used in measuring the fair value of financial instruments generally correlates with the level of
pricing observability. Financial instruments with quoted prices in active markets generally have more pricing observability
and less judgement is used in measuring fair value. Conversely, financial instruments traded in other than active markets
or that do not have quoted prices have less observability and are measured at fair value using valuation models or other
pricing techniques that require more judgement. An active market is one in which transactions for the asset or liability
being valued occur with sufficient frequency and volume to provide pricing information on an ongoing basis.
An other than active market is one in which there are few transactions, the prices are not current, price quotations vary
substantially either over time or among market makers, or in which little information is released publicly for the asset or
liability being valued. Pricing observability is affected by a number of factors, including the type of financial instrument,
whether the financial instrument is new to the market and not yet established, the characteristics specific to the transaction
and general market conditions.
Fair value of properties is based on valuation by independent professional valuers.
The Group does not have assets or liabilities measured at fair value on a non-recurring basis during the thirteen months
ended 31 December 2018.
The following methods and assumptions were used by the Group to estimate the fair value of financial instruments and
properties.
Determination of fair valueLoans and receivables
For loans and advances that are repriced frequently and have not had any significant changes in credit risk, carrying
amounts represent a reasonable estimate of fair values. The fair values of other loans are estimated by discounting expected
future cash flows using interest rates offered for similar loans to borrowers with similar credit ratings.
The fair values of mortgage loans are estimated by discounting future cash flows using interest rates currently being
offered in respect of similar loans to borrowers with similar credit ratings. The fair values of fixed rate policy loans are
estimated by discounting cash flows at the interest rates charged on policy loans of similar policies currently being issued.
Loans with similar characteristics are aggregated for purposes of the calculations. The carrying values of policy loans with
variable rates approximate to their fair values.
Debt securities and equity securities
The fair values of equity securities are based on quoted market prices or, if unquoted, on estimated market values generally
based on quoted prices for similar securities. Fair values for fixed interest securities are based on quoted market prices,
where available. For those securities not actively traded, fair values are estimated using values obtained from brokers,
private pricing services or by discounting expected future cash flows using a current market rate applicable to the yield,
credit quality and maturity of the investment. Priority is given to values from independent sources when available, but
overall the source of pricing and/or valuation technique is chosen with the objective of arriving at the price at which an
orderly transaction would take place between market participants on the measurement date. The inputs to determining
fair value that are relevant to fixed interest securities include, but not limited to risk-free interest rates, the obligor’s credit
spreads, foreign exchange rates and credit default rates. For holdings in hedge funds and limited partnerships, fair values
are determined based on the net asset values provided by the general partner or manager of each investment, the accounts
of which are generally audited on an annual basis. The transaction price is used as the best estimate of fair value at
inception.
ANNUAL REPORT 2018 |
OV
ER
VIE
WF
INA
NC
IAL
AN
D O
PE
RA
TIN
G R
EV
IEW
CO
RP
OR
AT
E G
OV
ER
NA
NC
EF
INA
NC
IAL
STA
TE
ME
NT
SA
DD
ITIO
NA
L IN
FO
RM
AT
ION
NOTES TO THE CONSOLIDATED FINANCIAL STATEMENTS AND SIGNIFICANT ACCOUNTING POLICIES

206
22. FAIR VALUE MEASUREMENT (continued)
Determination of fair value (continued)
Derivative financial instruments
The Group values its derivative financial assets and liabilities using market transactions and other market evidence
whenever possible, including market-based inputs to models, model calibration to market clearing transactions, broker or
dealer quotations or alternative pricing sources with reasonable levels of price transparency. When models are used, the
selection of a particular model to value a derivative depends on the contract terms of, and specific risks inherent in, the
instrument as well as the availability of pricing information in the market. The Group generally uses similar models to value
similar instruments. Valuation models require a variety of inputs, including contractual terms, market prices and rates,
yield curves, credit curves, measures of volatility, prepayment rates and correlations of such inputs. For derivatives that
trade in liquid markets, such as generic forwards, swaps and options, model inputs can generally be verified and model
selection does not involve significant management judgement. Examples of inputs that are generally observable include
foreign exchange spot and forward rates, benchmark interest rate curves and volatilities for commonly traded option
products. Examples of inputs that may be unobservable include volatilities for less commonly traded option products and
correlations between market factors.
When the Group holds a group of derivative assets and derivative liabilities entered into with a particular counterparty, the
Group takes into account the arrangements that mitigate credit risk exposure in the event of default (e.g. International
Swap and Derivatives Association (ISDA) Master Agreements and Credit Support Annex (CSA) that require the exchange of
collateral on the basis of each party’s net credit risk exposure). The Group measures the fair value of the group of financial
assets and financial liabilities on the basis of its net exposure to the credit risk of that counterparty or the counterparty’s
net exposure to our credit risk that reflects market participants’ expectations about the likelihood that such an arrangement
would be legally enforceable in the event of default.
Property held for own use and investment property
The Group engaged external, independent and qualified valuers to determine the fair value of the Group’s properties at
least on an annual basis. The valuation on open market value basis by independent professional valuer for certain
investment properties was calculated by reference to net rental income allowing for reversionary income potential. The fair
values of other properties were derived using the Market Data Approach. In this approach, the values are based on sales
and listing of comparable property registered in the vicinity.
The properties held for own use and investment properties, in most cases, are valued on the basis of the highest and best
use of the properties that is physically possible, legally permissible and financially feasible. The current use of the properties
are considered to be its highest and best use; records of recent sales and offerings of similar property are analysed and
comparison made for such factors as size, location, quality and prospective use. On limited occasions, potential
redevelopment of the properties in use would be taken into account when they would maximise the fair value of the
properties; the Group is occupying these properties for operational purposes.
Cash and cash equivalents
The carrying amount of cash approximates its fair value.
Reinsurance receivables
The carrying amount of amounts receivable from reinsurers is not considered materially different to their fair value.
Fair value of securities sold under repurchase agreements and the associated payables
The contract values of payables under repurchase agreements approximate their fair value as these obligations are
short-term in nature.
Other assets
The carrying amount of other financial assets is not materially different to their fair value. The fair values of deposits with
banks are generally based on quoted market prices or, if unquoted, on estimates based on discounting future cash flows
using available market interest rates offered for receivables with similar characteristics.
| AIA GROUP LIMITED
FINANCIAL STATEMENTS
207
22. FAIR VALUE MEASUREMENT (continued)
Determination of fair value (continued)
Investment contract liabilities
For investment contract liabilities, the fair values have been estimated using a discounted cash flow approach based on
interest rates currently being offered for similar contracts with maturities consistent with those remaining for the contracts
being valued. For investment contracts where the investment risk is borne by the policyholder, the fair value generally
approximates to the fair value of the underlying assets.
Investment contracts with DPF enable the contract holder to receive additional benefits as a supplement to guaranteed
benefits. These are referred to as participating business and are measured and classified according to the Group practice
for insurance contract liabilities and hence are disclosed within note 26. These are not measured at fair value as there is
currently not an agreed definition of fair value for investment and insurance contracts with DPF under IFRS. In the absence
of any agreed methodology, it is not possible to provide a range of estimates within which fair value is likely to fall.
Borrowings
The fair values of borrowings with stated maturities have been estimated based on discounting future cash flows using the
interest rates currently applicable to deposits of similar maturities or prices obtained from brokers.
Other liabilities
The fair values of other unquoted financial liabilities is estimated by discounting expected future cash flows using current
market rates applicable to their yield, credit quality and maturity, except for those without stated maturity, where the
carrying value approximates to fair value.
Fair value hierarchy for fair value measurement on a recurring basisAssets and liabilities recorded at fair value in the consolidated statement of financial position are measured and classified
in a hierarchy for disclosure purposes consisting of three “levels” based on the observability of inputs available in the
marketplace used to measure their fair values as discussed below:
• Level 1: Fair value measurements that are quoted prices (unadjusted) in active markets for identical assets or liabilities
that the Group has the ability to access as of the measurement date. Market price data is generally obtained from
exchange or dealer markets. The Group does not adjust the quoted price for such instruments. Assets measured at fair
value on a recurring basis and classified as Level 1 are actively traded equities. The Group considers that government
debt securities issued by G7 countries (the United States, Canada, France, Germany, Italy, Japan, the United Kingdom)
and traded in a dealer market to be Level 1, until they no longer trade with sufficient frequency and volume to be
considered actively traded.
• Level 2: Fair value measurements based on inputs other than quoted prices included in Level 1 that are observable for
the asset or liability, either directly (as prices) or indirectly (derived from prices). Level 2 inputs include quoted prices
for similar assets and liabilities in active markets, quoted prices for identical or similar assets or liabilities in markets
that are not active and inputs other than quoted prices that are observable for the asset and liability, such as interest
rates and yield curves that are observable at commonly quoted intervals. Assets and liabilities measured at fair value
on a recurring basis and classified as Level 2 generally include government securities issued by non-G7 countries, most
investment grade corporate bonds, hedge fund investments and derivative contracts.
• Level 3: Fair value measurements based on valuation techniques that use significant inputs that are unobservable.
Unobservable inputs are only used to measure fair value to the extent that relevant observable inputs are not available,
allowing for circumstances in which there is little, if any, market activity for the asset or liability. Assets and liabilities
measured at fair value on a recurring basis and classified as Level 3 include properties held for own use, investment
properties, certain classes of structured securities, certain derivative contracts, private equity and real estate fund
investments, and direct private equity investments.
ANNUAL REPORT 2018 |
OV
ER
VIE
WF
INA
NC
IAL
AN
D O
PE
RA
TIN
G R
EV
IEW
CO
RP
OR
AT
E G
OV
ER
NA
NC
EF
INA
NC
IAL
STA
TE
ME
NT
SA
DD
ITIO
NA
L IN
FO
RM
AT
ION
NOTES TO THE CONSOLIDATED FINANCIAL STATEMENTS AND SIGNIFICANT ACCOUNTING POLICIES

208
22. FAIR VALUE MEASUREMENT (continued)
Fair value hierarchy for fair value measurement on a recurring basis (continued)
In certain cases, the inputs used to measure fair value may fall into different levels of the fair value hierarchy. In such cases,
the level in the fair value hierarchy within which the fair value measurement in its entirety falls is determined based on the
lowest level input that is significant to the fair value measurement in its entirety. The Group’s assessment of the significance
of a particular input to the fair value measurement in its entirety requires judgement. In making the assessment, the Group
considers factors specific to the asset or liability.
A summary of assets and liabilities carried at fair value on a recurring basis according to fair value hierarchy is given below:
Fair value hierarchy
US$m Level 1 Level 2 Level 3 Total
31 December 2018
Recurring fair value measurements
Non-financial assets
Property held for own use – – 982 982
Investment property – – 4,794 4,794
Financial assets
Available for sale
Debt securities
Participating funds and Other participating business with distinct portfolios 27 21,645 309 21,981
Other policyholder and shareholder – 89,591 913 90,504
At fair value through profit or loss
Debt securities
Participating funds and Other participating business with distinct portfolios 7 21,785 531 22,323
Unit-linked and consolidated investment funds – 4,697 68 4,765
Other policyholder and shareholder 1 618 29 648
Equity securities
Participating funds and Other participating business with distinct portfolios 12,124 710 1,058 13,892
Unit-linked and consolidated investment funds 18,223 195 – 18,418
Other policyholder and shareholder 4,859 655 275 5,789
Derivative financial instruments
Foreign exchange contracts – 235 – 235
Interest rate contracts – 122 – 122
Other contracts 2 71 – 73
Total assets on a recurring fair value measurement basis 35,243 140,324 8,959 184,526
% of Total 19.1 76.0 4.9 100.0
Financial liabilities
Investment contract liabilities – – 6,907 6,907
Derivative financial instruments
Foreign exchange contracts – 201 – 201
Interest rate contracts – 42 – 42
Other liabilities – 1,153 – 1,153
Total liabilities on a recurring fair value measurement basis – 1,396 6,907 8,303
% of Total – 16.8 83.2 100.0
| AIA GROUP LIMITED
FINANCIAL STATEMENTS
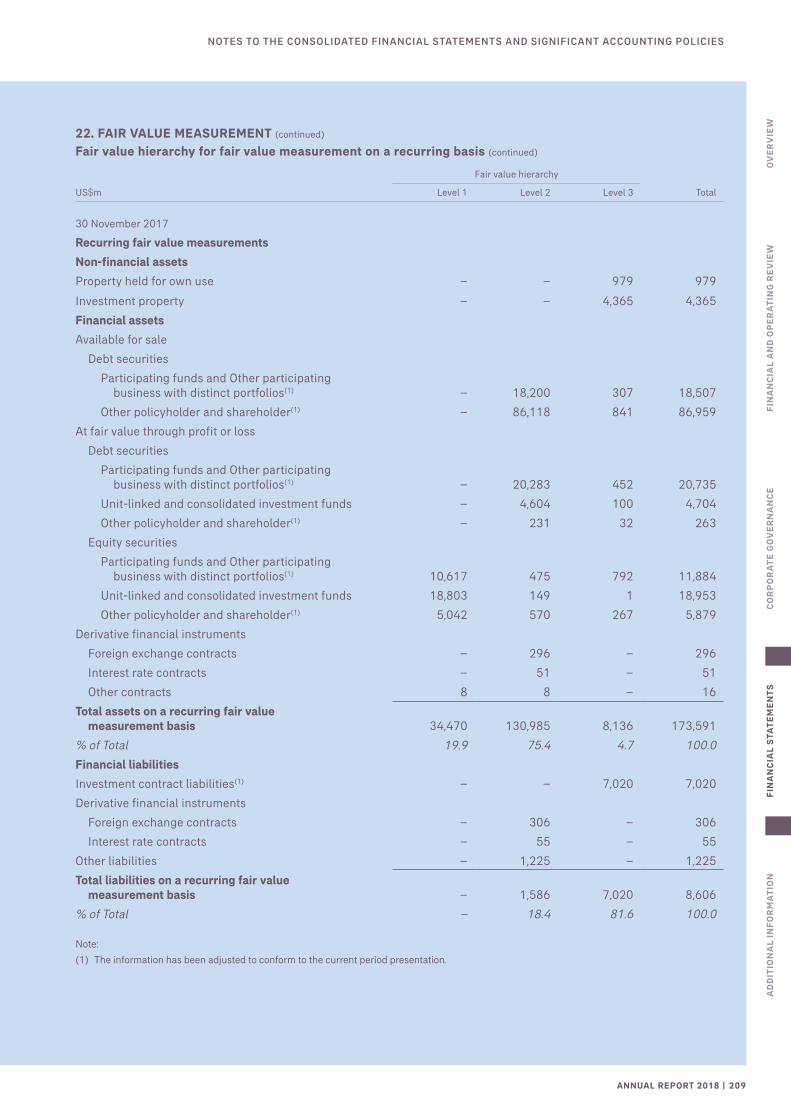
209
22. FAIR VALUE MEASUREMENT (continued)
Fair value hierarchy for fair value measurement on a recurring basis (continued)
Fair value hierarchy
US$m Level 1 Level 2 Level 3 Total
30 November 2017
Recurring fair value measurements
Non-financial assets
Property held for own use – – 979 979
Investment property – – 4,365 4,365
Financial assets
Available for sale
Debt securities
Participating funds and Other participating business with distinct portfolios(1) – 18,200 307 18,507
Other policyholder and shareholder(1) – 86,118 841 86,959
At fair value through profit or loss
Debt securities
Participating funds and Other participating business with distinct portfolios(1) – 20,283 452 20,735
Unit-linked and consolidated investment funds – 4,604 100 4,704
Other policyholder and shareholder(1) – 231 32 263
Equity securities
Participating funds and Other participating business with distinct portfolios(1) 10,617 475 792 11,884
Unit-linked and consolidated investment funds 18,803 149 1 18,953
Other policyholder and shareholder(1) 5,042 570 267 5,879
Derivative financial instruments
Foreign exchange contracts – 296 – 296
Interest rate contracts – 51 – 51
Other contracts 8 8 – 16
Total assets on a recurring fair value measurement basis 34,470 130,985 8,136 173,591
% of Total 19.9 75.4 4.7 100.0
Financial liabilities
Investment contract liabilities(1) – – 7,020 7,020
Derivative financial instruments
Foreign exchange contracts – 306 – 306
Interest rate contracts – 55 – 55
Other liabilities – 1,225 – 1,225
Total liabilities on a recurring fair value measurement basis – 1,586 7,020 8,606
% of Total – 18.4 81.6 100.0
Note:
(1) The information has been adjusted to conform to the current period presentation.
ANNUAL REPORT 2018 |
OV
ER
VIE
WF
INA
NC
IAL
AN
D O
PE
RA
TIN
G R
EV
IEW
CO
RP
OR
AT
E G
OV
ER
NA
NC
EF
INA
NC
IAL
STA
TE
ME
NT
SA
DD
ITIO
NA
L IN
FO
RM
AT
ION
NOTES TO THE CONSOLIDATED FINANCIAL STATEMENTS AND SIGNIFICANT ACCOUNTING POLICIES

210
22. FAIR VALUE MEASUREMENT (continued)
Fair value hierarchy for fair value measurement on a recurring basis (continued)
The Group’s policy is to recognise transfers of assets and liabilities between Level 1 and Level 2 at their fair values as at
the end of each reporting period, consistent with the date of the determination of fair value. Assets are transferred out of
Level 1 when they are no longer transacted with sufficient frequency and volume in an active market. During the thirteen
months ended 31 December 2018, the Group transferred US$15m (twelve months ended 30 November 2017: US$50m)
of assets measured at fair value from Level 1 to Level 2. Conversely, assets are transferred from Level 2 to Level 1 when
transaction volume and frequency are indicative of an active market. The Group transferred no asset (twelve months ended
30 November 2017: US$148m) from Level 2 to Level 1 during the thirteen months ended 31 December 2018.
The Group’s Level 2 financial instruments include debt securities, equity securities, derivative instruments and other
liabilities. The fair values of Level 2 financial instruments are estimated using values obtained from private pricing services
and brokers corroborated with internal review as necessary. When the quotes from third-party pricing services and brokers
are not available, internal valuation techniques and inputs will be used to derive the fair value for the financial instruments.
The tables below set out a summary of changes in the Group’s Level 3 assets and liabilities measured at fair value on a
recurring basis for the thirteen months ended 31 December 2018 and the twelve months ended 30 November 2017. The
tables reflect gains and losses, including gains and losses on assets and liabilities categorised as Level 3 as at 31 December
2018 and 30 November 2017.
Level 3 assets and liabilities
US$m
Property held for
own useInvestment
propertyDebt
securitiesEquity
securities
Derivative financial
assets/ (liabilities)
Investment contracts
At 1 December 2017 979 4,365 1,732 1,060 – (7,020)
Net movement on investment contract liabilities – – – – – 593
Total gains/(losses)
Reported under investment return and other expenses in the consolidated income statement (30) 477 15 (14) – –
Reported under fair value reserve, foreign currency translation reserve and property revaluation reserve in the consolidated statement of comprehensive income 34 (37) (55) (16) – –
Acquisition of subsidiaries – – – – – (480)
Transfer to other assets – (34) – – – –
Transfer from investment property 8 (8) – – – –
Purchases 1 38 635 375 – –
Sales (10) (7) (11) (72) – –
Settlements – – (492) – – –
Transfer into Level 3 – – 26 – – –
At 31 December 2018 982 4,794 1,850 1,333 – (6,907)
Change in unrealised gains or losses included in the consolidated income statement for assets and liabilities held at the end of the reporting period, under investment return and other expenses (30) 477 14 19 – –
| AIA GROUP LIMITED
FINANCIAL STATEMENTS

211
22. FAIR VALUE MEASUREMENT (continued)
Fair value hierarchy for fair value measurement on a recurring basis (continued)
Level 3 assets and liabilities (continued)
US$m
Property held for
own useInvestment
propertyDebt
securitiesEquity
securities
Derivative financial
assets/ (liabilities)
Investment contracts(1)
At 1 December 2016 905 3,910 1,947 688 – (5,941)
Net movement on investment contract liabilities – – – – – (1,079)
Total gains/(losses)
Reported under investment return and other expenses in the consolidated income statement (16) 367 (56) 31 – –
Reported under fair value reserve, foreign currency translation reserve and property revaluation reserve in the consolidated statement of comprehensive income 115 66 55 18 – –
Transfer to investment property (24) 24 – – – –
Purchases 1 10 216 369 – –
Sales (2) (12) (20) (35) – –
Settlements – – (410) – – –
Transfer into Level 3 – – – 2 – –
Transfer out of Level 3 – – – (13) – –
At 30 November 2017 979 4,365 1,732 1,060 – (7,020)
Change in unrealised gains or losses included in the consolidated income statement for assets and liabilities held at the end of the reporting period, under investment return and other expenses (16) 367 (61) 31 – –
Movements in investment contract liabilities at fair value are offset by movements in the underlying portfolio of matching
assets. Details of the movement in investment contract liabilities are provided in note 27.
Assets transferred out of Level 3 mainly relate to corporate debt instruments of which market-observable inputs became
available during the period and were used in determining the fair value.
There are not any differences between the fair values on initial recognition and the amounts determined using valuation
techniques since the models adopted are calibrated using initial transaction prices.
Note:
(1) The information has been adjusted to conform to the current period presentation.
ANNUAL REPORT 2018 |
OV
ER
VIE
WF
INA
NC
IAL
AN
D O
PE
RA
TIN
G R
EV
IEW
CO
RP
OR
AT
E G
OV
ER
NA
NC
EF
INA
NC
IAL
STA
TE
ME
NT
SA
DD
ITIO
NA
L IN
FO
RM
AT
ION
NOTES TO THE CONSOLIDATED FINANCIAL STATEMENTS AND SIGNIFICANT ACCOUNTING POLICIES

212
22. FAIR VALUE MEASUREMENT (continued)
Significant unobservable inputs for level 3 fair value measurementsAs at 31 December 2018 and 30 November 2017, the valuation techniques and applicable unobservable inputs used to
measure the Group’s Level 3 financial instruments are summarised as follows:
DescriptionFair value at 31 December 2018 (US$m) Valuation techniques Unobservable inputs Range
Debt securities 872 Discounted cash flows Risk adjusted discount rate 3.83% – 13.41%
DescriptionFair value at 30 November 2017 (US$m) Valuation techniques Unobservable inputs Range
Debt securities 943 Discounted cash flows Risk adjusted discount rate 5.29% – 11.89%
Fair value of the Group’s properties are determined based on appropriate valuation techniques which may consider among
others income projection, value of comparable property and adjustments for factors such as size, location, quality and
prospective use. These valuation inputs are deemed unobservable.
Valuation processesThe Group has the valuation policies, procedures and analyses in place to govern the valuation of financial assets required
for financial reporting purposes, including Level 3 fair values. In determining the fair values of financial assets, the Group
in general uses third-party pricing providers and, only in rare cases when third-party prices do not exist, will use prices
derived from internal models. The Chief Investment Officers of each of the business units are required to review the
reasonableness of the prices used and report price exceptions, if any. The Group Investment team analyses reported price
exceptions and reviews price challenge responses from third-party pricing providers and provides the final recommendation
on the appropriate price to be used. Any changes in valuation policies are reviewed and approved by the Group Valuations
Advisory Committee which is part of the Group’s wider financial risk governance processes. Changes in Level 2 and 3 fair
values are analysed at each reporting date.
The main Level 3 input used by the Group pertains to the discount rate for the fixed income securities and investment
contracts. The unobservable inputs for determining the fair value of these instruments include the obligor’s credit spread
and/or the liquidity spread. A significant increase/(decrease) in any of the unobservable input may result in a significantly
lower/(higher) fair value measurement. The Group has subscriptions to private pricing services for gathering such
information. If the information from private pricing services is not available, the Group uses the proxy pricing method based
on internally-developed valuation inputs.
| AIA GROUP LIMITED
FINANCIAL STATEMENTS

213
22. FAIR VALUE MEASUREMENT (continued)
Fair value of financial and insurance assets and liabilities for which the fair value is disclosed at reporting dateA summary of fair value hierarchy of assets and liabilities not carried at fair value but for which the fair value is disclosed
as at 31 December 2018 and 30 November 2017 is given below.
Fair value hierarchy
US$m Level 1 Level 2 Level 3 Total
31 December 2018
Assets for which the fair value is disclosed
Financial assets
Loans and deposits 601 2,525 4,266 7,392
Reinsurance receivables – 539 – 539
Other receivables 5 2,178 59 2,242
Accrued investment income 26 1,578 – 1,604
Cash and cash equivalents 2,451 – – 2,451
Total assets for which the fair value is disclosed 3,083 6,820 4,325 14,228
Liabilities for which the fair value is disclosed
Financial liabilities
Investment contract liabilities – – 549 549
Borrowings 4,504 480 – 4,984
Obligations under repurchase and securities lending agreements – 1,683 – 1,683
Other liabilities 476 4,131 224 4,831
Total liabilities for which the fair value is disclosed 4,980 6,294 773 12,047
Fair value hierarchy
US$m Level 1 Level 2 Level 3 Total
30 November 2017
Assets for which the fair value is disclosed
Financial assets
Loans and deposits 1,112 2,680 4,185 7,977
Reinsurance receivables – 506 – 506
Other receivables – 2,109 41 2,150
Accrued investment income 21 1,520 – 1,541
Cash and cash equivalents 2,289 – – 2,289
Total assets for which the fair value is disclosed 3,422 6,815 4,226 14,463
Liabilities for which the fair value is disclosed
Financial liabilities
Investment contract liabilities – – 580 580
Borrowings 3,630 514 – 4,144
Obligations under repurchase agreements – 1,883 – 1,883
Other liabilities 692 3,938 33 4,663
Total liabilities for which the fair value is disclosed 4,322 6,335 613 11,270
ANNUAL REPORT 2018 |
OV
ER
VIE
WF
INA
NC
IAL
AN
D O
PE
RA
TIN
G R
EV
IEW
CO
RP
OR
AT
E G
OV
ER
NA
NC
EF
INA
NC
IAL
STA
TE
ME
NT
SA
DD
ITIO
NA
L IN
FO
RM
AT
ION
NOTES TO THE CONSOLIDATED FINANCIAL STATEMENTS AND SIGNIFICANT ACCOUNTING POLICIES

214
23. OTHER ASSETS
US$m
As at31 December
2018
As at30 November
2017
Accrued investment income 1,604 1,541
Pension scheme assets
Defined benefit pension scheme surpluses 47 44
Insurance receivables due from insurance and investment contract holders 1,316 1,223
Prepayments – operating lease of leasehold land 385 357
Others 1,551 1,465
Total 4,903 4,630
All amounts other than certain prepayments are generally expected to be recovered within 12 months after the end of the
reporting period.
24. IMPAIRMENT OF FINANCIAL ASSETSIn accordance with the Group’s accounting policies, impairment reviews were performed for available for sale securities
and loans and receivables.
Available for sale debt securitiesDuring the thirteen months ended 31 December 2018, impairment loss of US$81m (twelve months ended 30 November
2017: nil) was recognised in respect of available for sale debt securities.
The carrying amounts of available for sale debt securities that are individually determined to be impaired at 31 December
2018 was nil (30 November 2017: nil).
Loans and receivablesThe Group’s primary potential credit risk exposure in respect of loans and receivables arises in respect of policy loans and
a portfolio of mortgage loans on residential and commercial real estate (see note 20 Financial investments for further
details). The Group’s credit exposure on policy loans is mitigated because, if and when the total indebtedness on any policy,
including interest due and accrued, exceeds the cash surrender value, the policy terminates and becomes void. The Group
has a first lien on all policies which are subject to policy loans.
The carrying amounts of loans and receivables that are individually determined to be impaired at 31 December 2018 was
US$13m (30 November 2017: US$12m).
The Group has a portfolio of residential and commercial mortgage loans which it originates. To the extent that any such
loans are past their due dates specific allowance is made, together with a collective allowance, based on historical
delinquency. Insurance receivables are short-term in nature and cover is not provided if consideration is not received. An
ageing of accounts receivable is not provided as all amounts are due within one year and cover is cancelled if consideration
is not received.
| AIA GROUP LIMITED
FINANCIAL STATEMENTS

215
25. CASH AND CASH EQUIVALENTS
US$m
As at31 December
2018
As at30 November
2017
Cash 1,657 1,735
Cash equivalents 794 554
Total(1) 2,451 2,289
Note:
(1) Of cash and cash equivalents, US$590m (30 November 2017: US$385m) are held to back unit-linked contracts and US$82m (30 November 2017: US$71m) are held by consolidated investment funds.
Cash comprises cash at bank and cash in hand. Cash equivalents comprise bank deposits and highly liquid short-term
investments with maturities at acquisition of three months or less and money market funds. Accordingly, all such amounts
are expected to be realised within 12 months after the end of the reporting period.
26. INSURANCE CONTRACT LIABILITIESThe movement of insurance contract liabilities (including liabilities in respect of investment contracts with DPF) is shown
as follows:
US$m
Thirteen months ended 31 December
2018
Twelve months ended 30 November
2017
At beginning of financial period 148,897 128,186
Valuation premiums and deposits 31,660 25,586
Liabilities released for policy termination or other policy benefits paid and related expenses (17,576) (14,929)
Fees from account balances (1,924) (1,817)
Accretion of interest 5,610 4,417
Change in net asset values attributable to policyholders (666) 2,762
Acquisition of subsidiaries 91 –
Foreign exchange movements (1,949) 5,232
Other movements 621 (540)
At end of financial period 164,764 148,897
Insurance contract liabilities (including liabilities in respect of investment contracts with DPF) can also be analysed as
follows:
US$m
Thirteen months ended 31 December
2018
Twelve months ended 30 November
2017
Deferred profit 8,386 7,046
Unearned revenue 3,224 2,674
Policyholders’ share of participating surplus 7,474 7,935
Liabilities for future policyholder benefits 145,680 131,242
Total 164,764 148,897
ANNUAL REPORT 2018 |
OV
ER
VIE
WF
INA
NC
IAL
AN
D O
PE
RA
TIN
G R
EV
IEW
CO
RP
OR
AT
E G
OV
ER
NA
NC
EF
INA
NC
IAL
STA
TE
ME
NT
SA
DD
ITIO
NA
L IN
FO
RM
AT
ION
NOTES TO THE CONSOLIDATED FINANCIAL STATEMENTS AND SIGNIFICANT ACCOUNTING POLICIES

216
26. INSURANCE CONTRACT LIABILITIES (continued)
Business descriptionThe table below summarises the key variables on which insurance and investment contract cash flows depend.
Type of contract Material terms and conditions
Nature of benefits and
compensation for claims
Factors affecting
contract cash
flows
Key reportable
segments
Traditional participating life assurance with DPF
Participating funds
Participating products include protection and savings elements. The basic sum assured, payable on death or maturity, may be enhanced by dividends or bonuses, the aggregate amount of which is determined by the performance of a distinct fund of assets and liabilities. The timing of dividend and bonus declarations is at the discretion of the insurer. Local regulations generally prescribe a minimum proportion of policyholder participation in declared dividends
Minimum guaranteed benefits may be enhanced based on investment experience and other considerations
• Investment performance
• Expenses• Mortality• Surrenders
Singapore, China, Malaysia
Other participating business
Participating products include protection and savings elements. The basic sum assured, payable on death or maturity, may be enhanced by dividends or bonuses, the timing or amount of which are at the discretion of the insurer taking into account factors such as investment experience
Minimum guaranteed benefits may be enhanced based on investment experience and other considerations
• Investment performance
• Expenses• Mortality• Surrenders• Morbidity
Hong Kong, Thailand, Other Markets
Traditional non-participating life assurance
Benefits paid on death, maturity, sickness or disability that are fixed and guaranteed and not at the discretion of the insurer
Benefits, defined in the insurance contract, are determined by the contract and are not affected by investment performance or the performance of the contract as a whole
• Mortality• Morbidity• Lapses• Expenses
All(1)
Accident and health These products provide morbidity or sickness benefits and include health, disability, critical illness and accident cover
Benefits, defined in the insurance contract, are determined by the contract and are not affected by investment performance or the performance of the contract as a whole
• Mortality• Morbidity• Lapses• Expenses
All(1)
Unit-linked Unit-linked contracts combine savings with protection, the cash value of the policy depending on the value of unitised funds
Benefits are based on the value of the unitised funds and death benefits
• Investment performance
• Lapses• Expenses• Mortality
All(1)
Universal life The customer pays flexible premiums subject to specified limits accumulated in an account balance which are credited with interest at a rate set by the insurer, and a death benefit which may be varied by the customer
Benefits are based on the account balance and death benefit
• Investment performance
• Crediting rates• Lapses• Expenses• Mortality
All(1)
Note:
(1) Other than the Group Corporate Centre segment.
| AIA GROUP LIMITED
FINANCIAL STATEMENTS

217
26. INSURANCE CONTRACT LIABILITIES (continued)
Methodology and assumptionsThe most significant items to which profit for the period and shareholders’ equity are sensitive are market, insurance and
lapse risks which are shown in the table below. Indirect exposure indicates that there is a second order impact. For example,
whilst the profit for the period attributable to shareholders is not directly affected by investment income earned where the
investment risk is borne by policyholders (for example, in respect of unit-linked contracts), there is a second-order effect
through the investment management fees which the Group earns by managing such investments. The distinction between
direct and indirect exposure is not intended to indicate the relative sensitivity to each of these items. Where the direct
exposure is shown as being “net neutral”, this is because the exposure to market and credit risk is offset by a corresponding
movement in insurance contract liabilities.
Market and credit risk
Direct exposure
Type of contractInsurance and investment contract liabilities
Risks associated with related investment portfolio Indirect exposure
Significant insurance and lapse risks
Traditional participating life assurance with DPF
Participating funds
• Net neutral except for the insurer’s share of participating investment performance
• Guarantees
• Net neutral except for the insurer’s share of participating investment performance
• Guarantees
• Investment performance subject to smoothing through dividend declarations
• Impact of persistency on future dividends
• Mortality
Other participating business
• Net neutral except for the insurer’s share of participating investment performance
• Guarantees
• Net neutral except for the insurer’s share of participating investment performance
• Guarantees
• Investment performance subject to smoothing through dividend declarations
• Impact of persistency on future dividends
• Mortality• Morbidity
Traditional non-participating life assurance
• Guarantees• Asset-liability
mismatch risk
• Investment performance
• Asset-liability mismatch risk
• Credit risk
• Not applicable • Mortality• Persistency• Morbidity
Accident and health • Asset-liability mismatch risk
• Investment performance
• Credit risk• Asset-liability
mismatch risk
• Not applicable • Morbidity• Persistency
Pension • Net neutral• Asset-liability
mismatch risk
• Net neutral• Asset-liability
mismatch risk
• Performance-related investment management fees
• Persistency
Unit-linked • Net neutral • Net neutral • Performance-related investment management fees
• Persistency• Mortality
Universal life • Guarantees• Asset-liability
mismatch risk
• Investment performance
• Credit risk• Asset-liability
mismatch risk
• Spread between earned rate and crediting rate to policyholders
• Mortality• Persistency• Withdrawals
The Group is also exposed to foreign exchange rate risk in respect of its operations, and to interest rate risk, credit risk and
equity price risk on assets representing net shareholders’ equity, and to expense risk to the extent that actual expenses
exceed those that can be charged to insurance and investment contract holders on non-participating business. Expense
assumptions applied in the Group’s actuarial valuation models assume a continuing level of business volumes.
ANNUAL REPORT 2018 |
OV
ER
VIE
WF
INA
NC
IAL
AN
D O
PE
RA
TIN
G R
EV
IEW
CO
RP
OR
AT
E G
OV
ER
NA
NC
EF
INA
NC
IAL
STA
TE
ME
NT
SA
DD
ITIO
NA
L IN
FO
RM
AT
ION
NOTES TO THE CONSOLIDATED FINANCIAL STATEMENTS AND SIGNIFICANT ACCOUNTING POLICIES

218
26. INSURANCE CONTRACT LIABILITIES (continued)
Methodology and assumptions (continued)
Valuation interest rates
As at 31 December 2018 and 30 November 2017, the ranges of applicable valuation interest rates for traditional insurance
contracts, which vary by operating segment, year of issuance and products, within the first 20 years are as follows:
As at31 December
2018
As at30 November
2017
Hong Kong 3.50% – 7.50% 3.50% – 7.50%
Thailand 3.13% – 9.00% 3.13% – 9.00%
Singapore 2.00% – 7.00% 2.00% – 7.00%
Malaysia 3.70% – 5.43% 3.70% – 5.43%
China 2.75% – 7.00% 2.75% – 7.00%
Australia 2.04% – 7.11% 2.97% – 7.11%
Indonesia 3.02% – 8.75% 3.01% – 9.00%
Korea 2.74% – 6.50% 2.85% – 6.50%
Philippines 2.20% – 9.20% 2.20% – 9.20%
Sri Lanka 8.34% – 12.57% 7.10% – 10.78%
Taiwan 1.75% – 6.50% 1.75% – 6.50%
Vietnam 5.53% – 11.48% 5.53% – 11.48%
27. INVESTMENT CONTRACT LIABILITIES
US$m
Thirteen months ended 31 December
2018
Twelve months ended 30 November
2017
At beginning of financial period 8,082 7,028
Investment contract benefits (462) 1,212
Fees charged (134) (145)
Acquisition of subsidiaries 480 –
Net withdrawals and other movements (3) (136)
Foreign exchange movements (78) 123
At end of financial period(1) 7,885 8,082
Note:
(1) Of investment contract liabilities, US$429m (30 November 2017: US$482m) represents deferred fee income.
| AIA GROUP LIMITED
FINANCIAL STATEMENTS

219
28. EFFECT OF CHANGES IN ASSUMPTIONS AND ESTIMATESThe table below sets out the sensitivities of the assumptions in respect of insurance and investment contracts with DPF to
key variables. This disclosure only allows for the impact on liabilities and related assets, such as reinsurance, and deferred
acquisition costs and does not allow for offsetting movements in the fair value of financial assets backing those liabilities.
US$m
As at31 December
2018
As at30 November
2017
(Increase)/decrease in insurance contract liabilities, increase/(decrease) in equity and profit before tax
0.5 pps increase in investment return 42 20
0.5 pps decrease in investment return (64) (39)
10% increase in expenses (11) (7)
10% increase in mortality rates (55) (42)
10% increase in lapse/discontinuance rates (39) (32)
Future policy benefits for traditional life insurance policies (including investment contracts with DPF) are calculated using
a net level premium valuation method with reference to best estimate assumptions set at policy inception date unless a
deficiency arises on liability adequacy testing. There is not any impact of the above assumption sensitivities on the carrying
amount of traditional life insurance liabilities as the sensitivities presented would not have triggered a liability adequacy
adjustment. During the years presented there were not any effect of changes in assumptions and estimates on the Group’s
traditional life products.
For interest sensitive insurance contracts, such as universal life products and unit-linked contracts, assumptions are made
at each reporting date including mortality, persistency, expenses, future investment earnings and future crediting rates.
The impact of changes in assumptions on the valuation of insurance and investment contracts with DPF was US$11m
(twelve months ended 30 November 2017: US$16m) increase in profit.
ANNUAL REPORT 2018 |
OV
ER
VIE
WF
INA
NC
IAL
AN
D O
PE
RA
TIN
G R
EV
IEW
CO
RP
OR
AT
E G
OV
ER
NA
NC
EF
INA
NC
IAL
STA
TE
ME
NT
SA
DD
ITIO
NA
L IN
FO
RM
AT
ION
NOTES TO THE CONSOLIDATED FINANCIAL STATEMENTS AND SIGNIFICANT ACCOUNTING POLICIES

220
29. BORROWINGS
US$m
As at31 December
2018
As at30 November
2017
Medium-term notes 4,954 3,958
Total 4,954 3,958
Interest expense on borrowings is shown in note 10. Further information relating to interest rates and the maturity profile
of borrowings is presented in note 37.
The following table summarises the Company’s outstanding medium-term notes placed to the market at 31 December
2018:
Issue date Nominal amount Interest rate Tenor
13 March 2013(1) US$500m 3.125% 10 years
11 March 2014(1) US$500m 2.250% 5 years
11 March 2014(1) US$500m 4.875% 30 years
11 March 2015(1) US$750m 3.200% 10 years
16 March 2016(1) US$750m 4.500% 30 years
23 May 2017(2) US$500m 4.470% 30 years
6 April 2018(1) US$500m 3.900% 10 years
12 April 2018 HK$3,900m 2.760% 3 years
20 September 2018(1) US$500m 3M LIBOR + 0.52% 3 years
Notes:
(1) These medium-term notes are listed on The Stock Exchange of Hong Kong Limited.
(2) These medium-term notes are listed on The Taipei Exchange, Taiwan. The Company has the right to redeem these notes at par on 23 May of each year beginning on 23 May 2022.
The net proceeds from issuance during the thirteen months ended 31 December 2018 and the twelve months ended 30
November 2017 are used for general corporate purposes.
The Group has access to an aggregate of US$2,374m unsecured committed credit facilities, which includes a US$300m
revolving three-year credit facility expiring in 2020, as well as a US$2,074m five-year credit facility expiring in 2022. The
credit facilities will be used for general corporate purposes. There were no outstanding borrowings under these credit
facilities as of 31 December 2018 (30 November 2017: nil).
| AIA GROUP LIMITED
FINANCIAL STATEMENTS

221
30. OBLIGATIONS UNDER REPURCHASE AND SECURITIES LENDING AGREEMENTSThe Group has entered into repurchase agreements whereby securities are sold to third parties with a concurrent agreement
to repurchase the securities at a specified date. In addition, the Group has entered into securities lending agreement
whereby securities are loaned to a national monetary authority.
The securities related to these agreements are not de-recognised from the Group’s consolidated statement of financial
position, but are retained within the appropriate financial asset classification. During the term of the repurchase and
securities lending agreements, the Group is restricted from selling or pledging the transferred debt securities. The following
table specifies the amounts included within financial investments subject to repurchase or securities lending agreements
which do not qualify for de-recognition at each period end:
US$m
As at31 December
2018
As at30 November
2017
Debt securities – AFS
Repurchase agreements 1,748 1,854
Securities lending 340 –
Debt securities – FVTPL
Repurchase agreements 16 12
Total 2,104 1,866
CollateralAt 31 December 2018, the Group had no pledged debt securities (30 November 2017: US$1m). Cash collateral of US$5m
(30 November 2017: US$1m) were held based on the market value of the securities transferred. In the absence of default,
the Group does not sell or repledge the debt securities collateral received and they are not recognised in the consolidated
statement of financial position.
The securities lending transactions outstanding as at 31 December 2018 are conducted with a national monetary authority
on securities denominated in local currency issued by the same authority.
At 31 December 2018, the obligations under repurchase agreements were US$1,683m (30 November 2017: US$1,883m).
ANNUAL REPORT 2018 |
OV
ER
VIE
WF
INA
NC
IAL
AN
D O
PE
RA
TIN
G R
EV
IEW
CO
RP
OR
AT
E G
OV
ER
NA
NC
EF
INA
NC
IAL
STA
TE
ME
NT
SA
DD
ITIO
NA
L IN
FO
RM
AT
ION
NOTES TO THE CONSOLIDATED FINANCIAL STATEMENTS AND SIGNIFICANT ACCOUNTING POLICIES

222
31. OFFSETTING OF FINANCIAL ASSETS AND FINANCIAL LIABILITIESOffsetting, enforceable master netting agreements and similar agreementsThe following table shows the assets that are subject to offsetting, enforceable master netting agreements and similar
arrangements at each period end:
US$m
Gross amount of
recognised financial
assets
Gross amount of
recognised financial liabilities
set off in the consolidated
statement of financial
position
Net amount of financial
assets presented
in the consolidated statement of
financial position
Related amounts not set off in the
consolidated statement of financial position
Net amount
Financial instruments
Cashcollateral received
31 December 2018
Financial assets:
Derivative assets 430 – 430 (41) (251) 138
Reverse repurchase agreements 149 – 149 (149) – –
Total 579 – 579 (190) (251) 138
US$m
Gross amount of
recognised financial
assets
Gross amount of
recognised financial liabilities
set off in the consolidated
statement of financial
position
Net amount of financial
assets presented
in the consolidated statement of
financial position
Related amounts not set off in the
consolidated statement of financial position
Net amount
Financial instruments
Cash collateral received
30 November 2017
Financial assets:
Derivative assets 363 – 363 (15) (141) 207
Reverse repurchase agreements 326 – 326 (326) – –
Total 689 – 689 (341) (141) 207
| AIA GROUP LIMITED
FINANCIAL STATEMENTS

223
31. OFFSETTING OF FINANCIAL ASSETS AND FINANCIAL LIABILITIES (continued)
Offsetting, enforceable master netting agreements and similar agreements (continued)
The following table shows the liabilities that are subject to offsetting, enforceable master netting agreements and similar
arrangements at each period end:
US$m
Gross amount of
recognised financial liabilities
Gross amount of
recognised financial
assets set off in the consolidated statement of
financial position
Net amount of financial
liabilities presented
in the consolidated statement of
financial position
Related amounts not set off in the
consolidated statement of financial position
Net amount
Financial instruments
Cash collateral
pledged
31 December 2018
Financial liabilities:
Derivative liabilities 243 – 243 (141) (20) 82
Repurchase agreements 1,683 – 1,683 (1,683) – –
Total 1,926 – 1,926 (1,824) (20) 82
US$m
Gross amount of
recognised financial liabilities
Gross amount of
recognised financial
assets set off in the consolidated
statement of financial
position
Net amount of financial
liabilities presented
in the consolidated statement of
financial position
Related amounts not set off in the
consolidated statement of financial position
Net amount
Financial instruments
Cash collateral
pledged
30 November 2017
Financial liabilities:
Derivative liabilities 361 – 361 (227) (10) 124
Repurchase agreements 1,883 – 1,883 (1,883) – –
Total 2,244 – 2,244 (2,110) (10) 124
The Group entered into enforceable master netting agreements for derivative transactions, as well as the repurchase and
securities lending agreements for debt instruments with various counterparties. Except for certain futures contracts
executed through clearing house mechanism where the settlement arrangement satisfied the IFRS netting criteria, the
transactions under the enforceable master netting agreements and similar agreements involving the exchange of financial
instruments or cash as collateral do not satisfy the IFRS netting criteria. The provision in the master netting agreement and
similar agreements enables a party to terminate transactions early and settle at a net amount if a default or termination
event occurs.
ANNUAL REPORT 2018 |
OV
ER
VIE
WF
INA
NC
IAL
AN
D O
PE
RA
TIN
G R
EV
IEW
CO
RP
OR
AT
E G
OV
ER
NA
NC
EF
INA
NC
IAL
STA
TE
ME
NT
SA
DD
ITIO
NA
L IN
FO
RM
AT
ION
NOTES TO THE CONSOLIDATED FINANCIAL STATEMENTS AND SIGNIFICANT ACCOUNTING POLICIES

224
32. PROVISIONS
US$m Employee benefits Other Total
At 1 December 2016 145 108 253
Charged to the consolidated income statement 7 94 101
Charged to other comprehensive income (23) – (23)
Exchange differences 9 – 9
Released during the year – (29) (29)
Utilised during the year (12) (83) (95)
Other movements 17 1 18
At 30 November 2017 143 91 234
Charged to the consolidated income statement 10 30 40
Charged to other comprehensive income (8) – (8)
Exchange differences – (1) (1)
Released during the period – (11) (11)
Utilised during the period (18) (64) (82)
Other movements 3 (7) (4)
At 31 December 2018 130 38 168
Other provisionsOther provisions comprise provisions in respect of regulatory matters, litigation, reorganisation and restructuring. In view
of the diverse nature of the matters provided for and the contingent nature of the matters to which they relate, the Group
is unable to provide an accurate assessment of the term over which provisions are expected to be utilised.
33. OTHER LIABILITIES
US$m
As at31 December
2018
As at30 November
2017
Trade and other payables 3,964 3,958
Third-party interests in consolidated investment funds 1,153 1,225
Reinsurance-related payables 867 705
Total 5,984 5,888
Third-party interests in consolidated investment funds consist of third-party unit holders’ interests in consolidated
investment funds which are reflected as a liability since they can be put back to the Group for cash.
Trade and other payables are generally expected to be settled within 12 months after the end of the reporting period. The
realisation of third-party interests in investment funds cannot be predicted with accuracy since these represent the
interests of third-party unit holders in consolidated investment funds held to back insurance and investment contract
liabilities and are subject to market risk and the actions of third-party investors.
| AIA GROUP LIMITED
FINANCIAL STATEMENTS
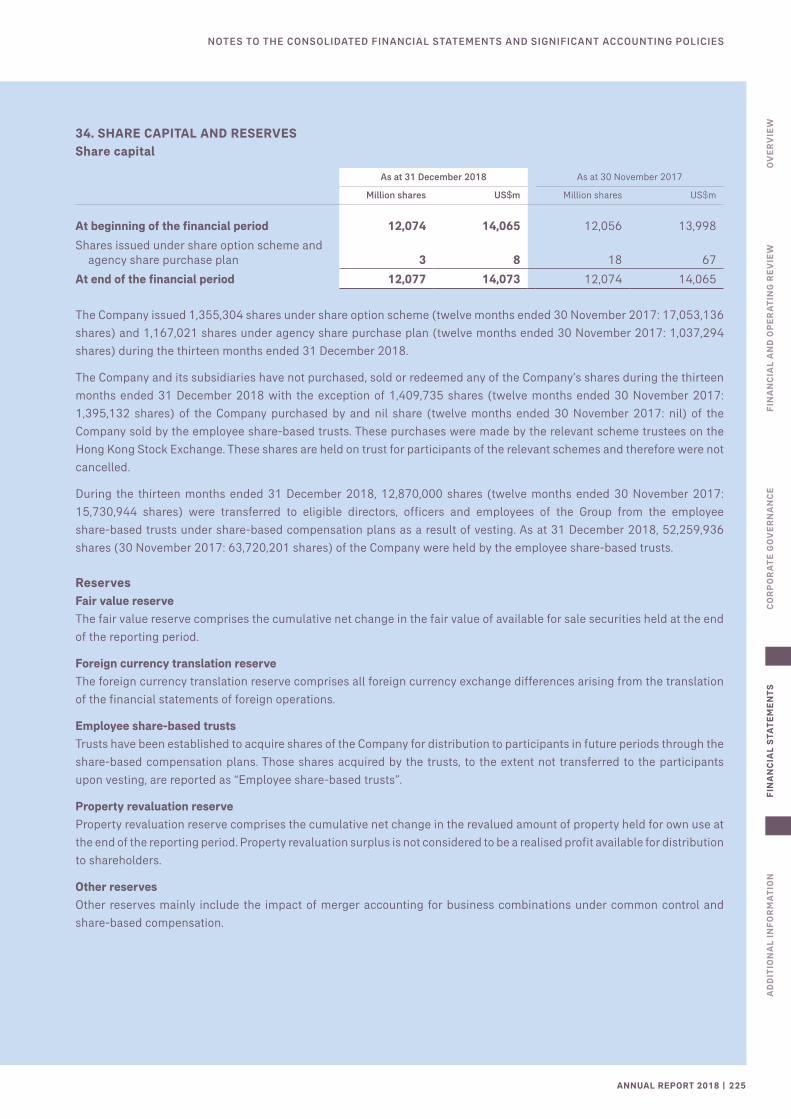
225
34. SHARE CAPITAL AND RESERVESShare capital
As at 31 December 2018 As at 30 November 2017
Million shares US$m Million shares US$m
At beginning of the financial period 12,074 14,065 12,056 13,998
Shares issued under share option scheme and agency share purchase plan 3 8 18 67
At end of the financial period 12,077 14,073 12,074 14,065
The Company issued 1,355,304 shares under share option scheme (twelve months ended 30 November 2017: 17,053,136
shares) and 1,167,021 shares under agency share purchase plan (twelve months ended 30 November 2017: 1,037,294
shares) during the thirteen months ended 31 December 2018.
The Company and its subsidiaries have not purchased, sold or redeemed any of the Company’s shares during the thirteen
months ended 31 December 2018 with the exception of 1,409,735 shares (twelve months ended 30 November 2017:
1,395,132 shares) of the Company purchased by and nil share (twelve months ended 30 November 2017: nil) of the
Company sold by the employee share-based trusts. These purchases were made by the relevant scheme trustees on the
Hong Kong Stock Exchange. These shares are held on trust for participants of the relevant schemes and therefore were not
cancelled.
During the thirteen months ended 31 December 2018, 12,870,000 shares (twelve months ended 30 November 2017:
15,730,944 shares) were transferred to eligible directors, officers and employees of the Group from the employee
share-based trusts under share-based compensation plans as a result of vesting. As at 31 December 2018, 52,259,936
shares (30 November 2017: 63,720,201 shares) of the Company were held by the employee share-based trusts.
ReservesFair value reserve
The fair value reserve comprises the cumulative net change in the fair value of available for sale securities held at the end
of the reporting period.
Foreign currency translation reserve
The foreign currency translation reserve comprises all foreign currency exchange differences arising from the translation
of the financial statements of foreign operations.
Employee share-based trusts
Trusts have been established to acquire shares of the Company for distribution to participants in future periods through the
share-based compensation plans. Those shares acquired by the trusts, to the extent not transferred to the participants
upon vesting, are reported as “Employee share-based trusts”.
Property revaluation reserve
Property revaluation reserve comprises the cumulative net change in the revalued amount of property held for own use at
the end of the reporting period. Property revaluation surplus is not considered to be a realised profit available for distribution
to shareholders.
Other reserves
Other reserves mainly include the impact of merger accounting for business combinations under common control and
share-based compensation.
ANNUAL REPORT 2018 |
OV
ER
VIE
WF
INA
NC
IAL
AN
D O
PE
RA
TIN
G R
EV
IEW
CO
RP
OR
AT
E G
OV
ER
NA
NC
EF
INA
NC
IAL
STA
TE
ME
NT
SA
DD
ITIO
NA
L IN
FO
RM
AT
ION
NOTES TO THE CONSOLIDATED FINANCIAL STATEMENTS AND SIGNIFICANT ACCOUNTING POLICIES

226
35. NON-CONTROLLING INTERESTS
US$m
As at31 December
2018
As at30 November
2017
Equity shares in subsidiaries 71 64
Share of earnings 356 310
Share of other reserves (27) 4
Total 400 378
36. GROUP CAPITAL STRUCTURECapital Management ApproachThe Group’s capital management objectives focus on maintaining a strong capital base to support the development of its
business, maintaining the ability to move capital freely and satisfying regulatory capital requirements at all times.
The Group’s capital management function oversees all capital-related activities of the Group and assists senior management
in making capital decisions. The capital management function participates in decisions concerning asset-liability
management, strategic asset allocation and ongoing solvency management. This includes ensuring capital considerations
are paramount in the strategy and business planning processes and when determining AIA’s capacity to pay dividends to
shareholders.
Regulatory SolvencyThe Group is in compliance with the solvency and capital adequacy requirements applied by its regulators. The Group’s
primary insurance regulator at the AIA Company Limited (AIA Co.) and AIA International Limited (AIA International) levels
is the Hong Kong Insurance Authority (HKIA), which requires that AIA Co. and AIA International meet the solvency margin
requirements of the Hong Kong Insurance Ordinance (HKIO). The HKIO (among other matters) sets minimum solvency
margin requirements that an insurer must meet in order to be authorised to carry on insurance business in or from Hong
Kong.
On 16 May 2017, the HKIA and the China Banking and Insurance Regulatory Commission (formerly the China Insurance
Regulatory Commission) signed the Equivalence Assessment Framework Agreement on the Solvency Regulatory Regime.
As a transitional arrangement, AIA will report under the HKIO the capital position of its China branches based on the China
local regulatory solvency basis progressively over a 4-year phase-in period to full implementation on 31 March 2022.
AIA has given an undertaking to the HKIA to maintain an excess of assets over liabilities for branches other than Hong
Kong at no less than 100% of the Hong Kong statutory minimum solvency margin requirement in each of AIA Co. and AIA
International.
The capital positions of the Group’s two principal operating companies as of 31 December 2018 and 30 November 2017
are as follows:
31 December 2018 30 November 2017
US$m
Total available
capital
Regulatory minimum
capitalSolvency
ratio
Total available
capital
Regulatory minimum
capitalSolvency
ratio
AIA Co. 9,208 2,189 421% 8,248 1,862 443%
AIA International 6,772 1,855 365% 7,826 2,431 322%
For these purposes, the Group defines total available capital as the amount of assets in excess of liabilities measured in
accordance with the HKIO and “regulatory minimum capital” as the required minimum margin of solvency calculated in
accordance with the HKIO. The solvency ratio is the ratio of total available capital to regulatory minimum capital.
| AIA GROUP LIMITED
FINANCIAL STATEMENTS

227
36. GROUP CAPITAL STRUCTURE (continued)
Regulatory Solvency (continued)
The Group’s individual branches and subsidiaries are also subject to the supervision of government regulators in the
jurisdictions in which those branches and subsidiaries and their parent entity operate and, in relation to subsidiaries, in
which they are incorporated. The various regulators overseeing the Group actively monitor our local solvency positions. AIA
Co. and AIA International submit annual filings to the HKIA of their solvency margin position based on their annual audited
financial statements.
The ability of the Company to pay dividends to shareholders and to meet other obligations depends ultimately on dividends
and other payments being received from its operating subsidiaries and branches, which are subject to contractual,
regulatory and other limitations. The various regulators overseeing the individual branches and subsidiaries of the Group
have the discretion to impose additional restrictions on the ability of those regulated subsidiaries and branches to make
payment of dividends or other distributions and payments to AIA Co., including increasing the required margin of solvency
that an operating unit must maintain. For example, capital may not be remitted without the consent from regulators for
certain individual branches or subsidiaries of the Group. The payment of dividends, distributions and other payments to
shareholders is subject to the oversight of the HKIA.
Capital and Regulatory Orders Specific to the GroupAs of 31 December 2018, the requirements and restrictions summarised below may be considered material to the Group
and remain in effect unless otherwise stated.
Hong Kong Insurance Authority
AIA Group Limited has given to the HKIA an undertaking that AIA Group Limited will:
(i) ensure that (a) each of AIA Co. and AIA International will at all times maintain an excess of assets over liabilities of not
less than the aggregate of 150% of the Hong Kong statutory minimum solvency margin requirement in respect of the
Hong Kong branch and no less than 100% of the Hong Kong statutory minimum solvency margin requirement for
branches other than Hong Kong (“minimum amount”); (b) it will not withdraw capital or transfer any funds or assets
out of AIA Co. or AIA International that will cause the solvency ratio to fall below the minimum amounts specified in (a),
except with, in either case, the prior written consent of the HKIA; and (c) should the solvency ratio of either AIA Co. or
AIA International fall below the respective minimum amounts, AIA Group Limited will take steps as soon as possible to
restore it to at least the respective minimum amounts in a manner acceptable to the HKIA;
(ii) notify the HKIA in writing as soon as the Company becomes aware of any person (a) becoming a controller (within the
meaning of Section 9(1)(a)(iii)(B) of the HKIO) of AIA Co. and AIA International through the acquisition of our shares
traded on the HKSE; or (b) ceasing to be a controller (within the meaning of Section 9(1)(a)(iii)(B) of the HKIO) of AIA
Co. and AIA International through the disposal of our shares traded on the HKSE;
(iii) be subject to the supervision of the HKIA and AIA Group Limited will be required to continually comply with the HKIA’s
guidance on the “fit and proper” standards of a controller pursuant to Section 8(2) of the HKIO. The HKIA is empowered
by the HKIO to raise objection if it appears to it that any person is not fit and proper to be a controller or director of an
authorised insurer. These standards include the sufficiency of a holding company’s financial resources; the viability of
a holding company’s business plan for its insurance subsidiaries which are regulated by the HKIA; the clarity of the
Group’s legal, managerial and operational structures; the identities of any other holding companies or major regulated
subsidiaries; whether the holding company, its directors or controllers is subject to receivership, administration,
liquidation or other similar proceedings or failed to satisfy any judgement debt under a court order or the subject of any
criminal convictions or in breach of any statutory or regulatory requirements; the soundness of the Group’s corporate
governance; the soundness of the Group’s risk management framework; the receipt of information from its insurance
subsidiaries which are regulated by the HKIA to ensure that they are managed in compliance with applicable laws,
rules and regulation; and its role in overseeing and managing the operations of its insurance subsidiaries which are
regulated by the HKIA; and
(iv) fulfil all enhancements or improvements to the guidance referred to in subparagraph (iii) above, as well as administrative
measures issued from time to time by the HKIA or requirements that may be prescribed by the HKIA in accordance with
the HKIO, regulations under the HKIO or guidelines issued by the HKIA from time to time.
ANNUAL REPORT 2018 |
OV
ER
VIE
WF
INA
NC
IAL
AN
D O
PE
RA
TIN
G R
EV
IEW
CO
RP
OR
AT
E G
OV
ER
NA
NC
EF
INA
NC
IAL
STA
TE
ME
NT
SA
DD
ITIO
NA
L IN
FO
RM
AT
ION
NOTES TO THE CONSOLIDATED FINANCIAL STATEMENTS AND SIGNIFICANT ACCOUNTING POLICIES

228
37. RISK MANAGEMENTRisk management frameworkAIA recognises the importance of sound risk management in every aspect of our business and for all our stakeholders. The
Risk Management Framework (RMF) provides the structure for identifying, quantifying and mitigating risk across the
Group. An effective RMF is the key to avoiding the financial and reputational damage that arises from inadequate or
ineffective control of the risks in the business.
Insurance riskInsurance risk is the risk arising from changes in claims experience as well as more general exposure relating to the
acquisition and persistency of insurance business. This also includes changes to assumptions regarding future experience
for these risks.
Lapse
Lapse risk is the risk that the rate of policy termination deviates from the Group’s expectation.
Ensuring customers buy products that meet their needs is central to the Group’s Operating Philosophy. Through effective
implementation of the Business Quality Framework, comprehensive sales training programmes and active monitoring of
sales activities and persistency, the Group seeks to ensure that appropriate products are sold by qualified sales
representatives and that standards of service consistently meet our customers’ needs.
Expense
Expense risk is the risk that the cost of selling new business and of administering the in-force book exceeds the assumptions
made in pricing and/or reserving.
Daily operations follow a disciplined budgeting and control process that allows for the management of expenses based on
the Group’s very substantial experience within the markets in which we operate.
Morbidity and Mortality
Morbidity and mortality risk is the risk that the occurrence and/or amounts of medical/death claims are higher than the
assumptions made in pricing and/or reserving.
The Group adheres to well-defined market-oriented underwriting and claims guidelines and practices that have been
developed based on extensive historical experience and with the assistance of professional reinsurers.
The Group’s actuarial teams conduct regular experience studies of all the insurance risk factors in its in-force book. These
internal studies together with external data are used to identify emerging trends which can then be used to inform product
design, pricing, underwriting, claims management and reinsurance needs.
Through monitoring the development of both local and global trends in medical technology, health and wellness, the
impact of legislation and general social, political and economic conditions the Group seeks to anticipate and respond
promptly to potential adverse experience impacts on its products.
Reinsurance is used to reduce concentration and volatility risk, especially with large policies or new risks, and as protection
against catastrophic events such as pandemics or natural disasters.
| AIA GROUP LIMITED
FINANCIAL STATEMENTS

229
37. RISK MANAGEMENT (continued)
Investment and financial risksCredit riskCredit risk is the risk that third parties fail to meet their obligations to the Group when they fall due. Although the primary source of credit risk is the Group’s investment portfolio, such risk can also arise through reinsurance, procurement, and treasury activities.
The Group’s credit risk management oversight process is governed centrally, but provides for decentralised management and accountability by our lines of business. A key to AIA’s credit risk management is adherence to a well-controlled underwriting process. The Group’s credit risk management starts with the assignment of an internal rating to all counterparties. A detailed analysis of each counterparty is performed and a rating recommended by the first line of business. The Group’s Risk Management function manages the Group’s internal ratings framework and reviews these recommendations and make final decision on the assigned ratings. Measuring and monitoring of credit risk is an ongoing process and is designed to enable early identification of emerging risk.
Interest rate riskThe Group’s exposure to interest rate risk predominantly arises from any differences between the duration of the Group’s liabilities and assets. Since most markets do not have assets of sufficient tenor to match life insurance liabilities, an uncertainty arises around the reinvestment of maturing assets to match the Group’s insurance liabilities.
AIA manages interest rate risk primarily on an economic basis to determine the durations of both assets and liabilities. Interest rate risk on local solvency basis is also taken into consideration for business units where local solvency regimes deviate from economic basis. Furthermore, for products with discretionary benefits, additional modelling of interest rate risk is performed to guide determination of appropriate management actions. Management also takes into consideration the asymmetrical impact of interest rate movements when evaluating products with options and guarantees.
ANNUAL REPORT 2018 |
OV
ER
VIE
WF
INA
NC
IAL
AN
D O
PE
RA
TIN
G R
EV
IEW
CO
RP
OR
AT
E G
OV
ER
NA
NC
EF
INA
NC
IAL
STA
TE
ME
NT
SA
DD
ITIO
NA
L IN
FO
RM
AT
ION
NOTES TO THE CONSOLIDATED FINANCIAL STATEMENTS AND SIGNIFICANT ACCOUNTING POLICIES

230
37. RISK MANAGEMENT (continued)
Investment and financial risks (continued)
Exposure to interest rate riskThe table below summarises the nature of the interest rate risk associated with financial assets and financial liabilities. In preparing this analysis, fixed rate interest bearing instruments that mature or reprice within 12 months of the reporting date have been disclosed as variable rate instruments.
US$mVariable
interest rateFixed
interest rateNon-interest
bearing Total
31 December 2018
Financial assets
Loans and deposits 978 6,406 8 7,392
Other receivables 2 – 1,970 1,972
Debt securities 6,499 133,722 – 140,221
Equity securities – – 38,099 38,099
Reinsurance receivables – – 539 539
Accrued investment income – – 1,604 1,604
Cash and cash equivalents 2,201 – 250 2,451
Derivative financial instruments – – 430 430
Total financial assets 9,680 140,128 42,900 192,708
Financial liabilities
Investment contract liabilities – – 7,456 7,456
Borrowings 500 4,454 – 4,954
Obligations under repurchase and securities lending agreements 1,683 – – 1,683
Other liabilities 260 2 5,722 5,984
Derivative financial instruments – – 243 243
Total financial liabilities 2,443 4,456 13,421 20,320
| AIA GROUP LIMITED
FINANCIAL STATEMENTS

231
37. RISK MANAGEMENT (continued)
Investment and financial risks (continued)
Exposure to interest rate risk (continued)
US$mVariable
interest rateFixed
interest rateNon-interest
bearing Total
30 November 2017
Financial assets
Loans and deposits 1,045 6,919 9 7,973
Other receivables 1 – 1,898 1,899
Debt securities 8,392 122,776 – 131,168
Equity securities – – 36,716 36,716
Reinsurance receivables – – 506 506
Accrued investment income – – 1,541 1,541
Cash and cash equivalents 2,001 – 288 2,289
Derivative financial instruments – – 363 363
Total financial assets 11,439 129,695 41,321 182,455
Financial liabilities
Investment contract liabilities(1) – – 7,600 7,600
Borrowings – 3,958 – 3,958
Obligations under repurchase agreements 1,883 – – 1,883
Other liabilities 92 – 5,796 5,888
Derivative financial instruments – – 361 361
Total financial liabilities 1,975 3,958 13,757 19,690
Equity price risk
Equity price risk arises from changes in the market value of equity securities. Investments in equity securities on a
long-term basis are expected to align policyholders expectations, provide diversification benefits and enhance returns. The
extent of exposure to equities at any time is subject to the terms of the Group’s strategic asset allocations.
Equity price risk is managed in the first instance through the individual investment mandates which define benchmarks
and any tracking error targets. Equity limits are also applied to contain individual exposures. Equity exposures are included
in the aggregate exposure reports on each individual counterparty to ensure concentrations are avoided.
Note:
(1) The information has been adjusted to conform to the current period presentation.
ANNUAL REPORT 2018 |
OV
ER
VIE
WF
INA
NC
IAL
AN
D O
PE
RA
TIN
G R
EV
IEW
CO
RP
OR
AT
E G
OV
ER
NA
NC
EF
INA
NC
IAL
STA
TE
ME
NT
SA
DD
ITIO
NA
L IN
FO
RM
AT
ION
NOTES TO THE CONSOLIDATED FINANCIAL STATEMENTS AND SIGNIFICANT ACCOUNTING POLICIES

232
37. RISK MANAGEMENT (continued)
Investment and financial risks (continued)
Equity price risk (continued)
Sensitivity analysis
Sensitivity analysis to the key variables affecting financial assets and liabilities is set out in the table below. Information
relating to sensitivity of insurance and investment contracts with DPF is provided in note 28. The carrying values of other
financial assets are not subject to changes in response to movements in interest rates or equity prices. In calculating the
sensitivity of debt and equity instruments to changes in interest rates and equity prices, the Group has made assumptions
about the corresponding impact of asset valuations on liabilities to policyholders. Assets held to support unit-linked
contracts have been excluded on the basis that changes in fair value are wholly borne by policyholders. Sensitivity analysis
for assets held in participating funds has been calculated after allocation of returns to policyholders using the applicable
minimum policyholders’ participation ratios described in note 2.
Information is presented to illustrate the estimated impact on profits and total equity arising from a change in a single
variable before taking into account the effects of taxation.
The impact of any impairments of financial assets has been ignored for the purpose of illustrating the sensitivity of profit
before tax and total equity before the effects of taxation to changes in interest rates and equity prices on the grounds that
default events reflect the characteristics of individual issuers. As the Group’s accounting policies lock in interest rate
assumptions on policy inception and the Group’s assumptions incorporate a provision for adverse deviations, the level of
movement illustrated in this sensitivity analysis does not result in loss recognition and so there is not any corresponding
effect on liabilities.
31 December 2018 30 November 2017
US$m
Impact onprofit
before tax
Impact on total equity(before the
effects of taxation)
Impact on allocated
equity (before the
effects of taxation)
Impact onprofit
before tax
Impact on total equity(before the
effects of taxation)
Impact on allocated
equity (before the
effects of taxation)
Equity price risk
10 per cent increase in equity prices 1,369 1,369 1,369 1,182 1,182 1,182
10 per cent decrease in equity prices (1,369) (1,369) (1,369) (1,182) (1,182) (1,182)
Interest rate risk
+50 basis points shift in yield curves (258) (6,504) (258) (157) (5,676) (157)
- 50 basis points shift in yield curves 274 7,231 274 169 6,272 169
| AIA GROUP LIMITED
FINANCIAL STATEMENTS

233
37. RISK MANAGEMENT (continued)
Investment and financial risks (continued)
Foreign exchange rate risk
The Group’s foreign exchange rate risk arises mainly from the Group’s operations in multiple geographical markets in the
Asia-Pacific region and the translation of multiple currencies to US dollar for financial reporting purposes. The balance
sheet values of our operating units and subsidiaries are not hedged to the Group’s presentation currency, the US dollar.
However, assets, liabilities and local regulatory and stress capital in each business unit are generally currency matched
with the exception of holdings of equities denominated in currencies other than the functional currency, or any expected
capital movements due within one year which may be hedged. Bonds denominated in currencies other than the functional
currency are commonly hedged with cross-currency swaps or foreign exchange forward contracts.
Foreign exchange rate net exposure
US$mUnited States
DollarHong Kong
DollarThai Baht
Singapore Dollar
Malaysian Ringgit
China Renminbi
31 December 2018
Equity analysed by original currency 19,278 2,527 3,819 (1,821) 2,153 4,380
Net notional amounts of currency derivative positions (8,448) 595 3,209 2,806 – (560)
Currency exposure 10,830 3,122 7,028 985 2,153 3,820
5% strengthening of original currency
Impact on profit before tax 100 (36) 7 12 3 (21)
Impact on other comprehensive income (125) 158 344 37 105 212
Impact on total equity (25) 122 351 49 108 191
5% strengthening of the US dollar
Impact on profit before tax 100 70 (5) 4 (2) 23
Impact on other comprehensive income (125) (192) (346) (53) (106) (214)
Impact on total equity (25) (122) (351) (49) (108) (191)
US$mUnited States
DollarHong Kong
DollarThai Baht
Singapore Dollar
Malaysian Ringgit
China Renminbi
30 November 2017
Equity analysed by original currency 24,497 2,772 3,768 (2,356) 2,157 3,527
Net notional amounts of currency derivative positions (9,225) 597 2,535 3,005 – 8
Currency exposure 15,272 3,369 6,303 649 2,157 3,535
5% strengthening of original currency
Impact on profit before tax 164 3 (8) 21 4 19
Impact on other comprehensive income (188) 133 323 12 104 158
Impact on total equity (24) 136 315 33 108 177
5% strengthening of the US dollar
Impact on profit before tax 164 30 9 (5) (3) (16)
Impact on other comprehensive income (188) (166) (324) (28) (105) (161)
Impact on total equity (24) (136) (315) (33) (108) (177)
ANNUAL REPORT 2018 |
OV
ER
VIE
WF
INA
NC
IAL
AN
D O
PE
RA
TIN
G R
EV
IEW
CO
RP
OR
AT
E G
OV
ER
NA
NC
EF
INA
NC
IAL
STA
TE
ME
NT
SA
DD
ITIO
NA
L IN
FO
RM
AT
ION
NOTES TO THE CONSOLIDATED FINANCIAL STATEMENTS AND SIGNIFICANT ACCOUNTING POLICIES

234
37. RISK MANAGEMENT (continued)
Investment and financial risks (continued)
Liquidity riskAIA identifies liquidity risk as occurring in two ways, financial liquidity risk and investment liquidity risk. Financial liquidity risk is the risk that insufficient cash is available to meet payment obligations to counterparties as they fall due. One area of particular focus in the management of financial liquidity is collateral. AIA manages this exposure by determining limits for its activities in the derivatives and repurchase agreement markets based on the collateral available within the relevant fund or subsidiary to withstand extreme market events. More broadly AIA supports its liquidity through committed bank facilities, use of the bond repurchase markets and maintaining access to debt markets via the Company’s Global Medium-term Note and Securities programme.
Investment liquidity risk occurs in relation to the Group’s ability to buy and sell investments. This is a function of the size of the Group’s holdings relative to the availability of counterparties willing to buy or sell these holdings at any given time. In times of stress, market losses will generally be compounded by forced sellers seeking unwilling buyers.
While life insurance companies are characterised by a relatively low need for liquidity to cover those of their liabilities which are directly linked to mortality and morbidity, this risk is nevertheless carefully managed by continuously assessing the relative liquidity of the Group’s assets and managing the size of individual holdings through limits.
US$m Total
Due in one year
or less
Due after one year through
five years
Due after five years
through ten years
Due after ten years
No fixed maturity
31 December 2018
Financial assets (Policyholder and shareholder investments)
Loans and deposits 7,311 1,011 708 270 2,422 2,900
Other receivables 1,913 1,788 68 5 – 52
Debt securities 135,456 2,683 17,352 30,450 84,971 –
Equity securities 19,681 – – – – 19,681
Reinsurance receivables 539 539 – – – –
Accrued investment income 1,546 1,537 – – – 9
Cash and cash equivalents 1,779 1,779 – – – –
Derivative financial instruments 428 121 85 164 58 –
Subtotal 168,653 9,458 18,213 30,889 87,451 22,642
Financial assets (Unit-linked contracts and consolidated investment funds) 24,055 – – – – 24,055
Total 192,708 9,458 18,213 30,889 87,451 46,697
Financial and insurance contract liabilities (Policyholder and shareholder investments)
Insurance and investment contract liabilities (net of deferred acquisition and origination costs, and reinsurance) 122,563 2,914 10,824 11,965 96,860 –
Borrowings 4,954 500 1,496(1) 1,241 1,717 –
Obligations under repurchase and securities lending agreements 1,683 1,683 – – – –
Other liabilities 4,754 3,526 126 5 2 1,095
Derivative financial instruments 243 54 98 53 38 –
Subtotal 134,197 8,677 12,544 13,264 98,617 1,095
Financial and insurance contract liabilities (Unit-linked contracts and consolidated investment funds) 24,073 – – – – 24,073
Total 158,270 8,677 12,544 13,264 98,617 25,168
Note:
(1) These borrowings fall due after 2 years through 5 years.
| AIA GROUP LIMITED
FINANCIAL STATEMENTS

235
37. RISK MANAGEMENT (continued)
Investment and financial risks (continued)
Liquidity risk (continued)
US$m Total
Due in one year
or less
Due after one year through
five years
Due after five years
through ten years
Due after ten years
No fixed maturity
30 November 2017
Financial assets (Policyholders and shareholder investments)
Loans and deposits 7,866 1,427 919 399 2,392 2,729
Other receivables 1,727 1,617 59 6 – 45
Debt securities 126,464 3,834 17,553 31,334 73,743 –
Equity securities 17,763 – – – – 17,763
Reinsurance receivables 506 506 – – – –
Accrued investment income 1,494 1,486 1 – – 7
Cash and cash equivalents 1,833 1,833 – – – –
Derivative financial instruments 352 76 142 122 12 –
Subtotal 158,005 10,779 18,674 31,861 76,147 20,544
Financial assets (Unit-linked contracts and consolidated investment funds) 24,450 – – – – 24,450
Total 182,455 10,779 18,674 31,861 76,147 44,994
Financial and insurance contract liabilities (Policyholders and shareholder investments)
Insurance and investment contract liabilities (net of deferred acquisition and origination costs, and reinsurance) 109,900 2,609 10,420 11,404 85,467 –
Borrowings 3,958 500 499(1) 1,242 1,717 –
Obligations under repurchase agreements 1,883 1,883 – – – –
Other liabilities 4,445 3,314 47 2 – 1,082
Derivative financial instruments 361 170 57 86 48 –
Subtotal 120,547 8,476 11,023 12,734 87,232 1,082
Financial and insurance contract liabilities (Unit-linked contracts and consolidated investment funds) 24,450 – – – – 24,450
Total 144,997 8,476 11,023 12,734 87,232 25,532
Note:
(1) No borrowings are due after 2 years through 5 years.
ANNUAL REPORT 2018 |
OV
ER
VIE
WF
INA
NC
IAL
AN
D O
PE
RA
TIN
G R
EV
IEW
CO
RP
OR
AT
E G
OV
ER
NA
NC
EF
INA
NC
IAL
STA
TE
ME
NT
SA
DD
ITIO
NA
L IN
FO
RM
AT
ION
NOTES TO THE CONSOLIDATED FINANCIAL STATEMENTS AND SIGNIFICANT ACCOUNTING POLICIES

236
38. EMPLOYEE BENEFITSDefined benefit plansThe Group operates funded and unfunded defined benefit plans that provide life and medical benefits for participating
employees after retirement and a lump sum benefit on cessation of employment. The locations covered by these plans
include Hong Kong, Singapore, Malaysia, Thailand, Indonesia, Korea, the Philippines, Sri Lanka, Taiwan and Vietnam. The
latest independent actuarial valuations of the plans were at 31 December 2018 and were prepared by credentialed
actuaries of Mercer (Hong Kong) Limited and Mercer Philippines Inc. All the actuaries are qualified members of professional
actuarial organisations to render the actuarial opinions. The actuarial valuations indicate that the Group’s obligations
under these defined benefit retirement plans are 48 per cent (30 November 2017: 44 per cent) covered by the plan assets
held by the trustees. The fair value of plan assets as at period end at the date of valuation was US$82m (30 November
2017: US$79m). The total expenses relating to these plans recognised in the consolidated income statement was US$10m
(twelve months ended 30 November 2017: US$7m).
Defined contribution plansThe Group operates a number of defined contribution pension plans. The total expense relating to these plans in the
current thirteen months was US$89m (twelve months ended 30 November 2017: US$72m). Employees and the employer
are required to make monthly contributions equal to 1 per cent to 22 per cent of the employees’ monthly basic salaries,
depending on years of service and subject to any applicable caps of monthly relevant income in different jurisdictions. For
defined contribution pension plans with vesting conditions, any forfeited contributions by employers on behalf of employees
who leave the scheme prior to vesting fully in such contributions are used by the employer to reduce any future contributions.
The amount of forfeited contributions used to reduce the existing level of contributions is not material.
39. SHARE-BASED COMPENSATIONShare-based compensation plansDuring the thirteen months ended 31 December 2018, the Group made further awards of share options, restricted share
units (RSUs) and restricted stock purchase units (RSPUs) to certain directors, officers and employees of the Group under
the Share Option Scheme (SO Scheme), the Restricted Share Unit Scheme (RSU Scheme) and the Employee Share
Purchase Plan (ESPP). In addition, the Group made further awards of restricted stock subscription units (RSSUs) to eligible
agents under the Agency Share Purchase Plan (ASPP).
RSU Scheme
Under the RSU Scheme, the vesting of the awarded RSUs is conditional upon the eligible participants remaining in
employment with the Group during the respective vesting periods. RSU awards are vested either entirely after a specific
period of time or in tranches over the vesting period. For RSU awards that are vested in tranches, each vesting tranche is
accounted for as a separate award for the purposes of recognising the expense over the vesting period. For certain RSUs,
performance conditions are also attached which include both market and non-market conditions. RSUs subject to
performance conditions are released to the participants at the end of the vesting period depending on the actual
achievement of the performance conditions. During the vesting period, the participants are not entitled to dividends of the
underlying shares. Except in jurisdictions where restrictions apply, the awarded RSUs are expected to be settled in equity;
awards that the Group has the legal or constructive obligation to settle in cash are insignificant to the Group. The maximum
number of shares that can be awarded under this scheme is 301,100,000 (30 November 2017: 301,100,000), representing
approximately 2.5 per cent (30 November 2017: 2.5 per cent) of the number of shares in issue at 31 December 2018.
| AIA GROUP LIMITED
FINANCIAL STATEMENTS

237
39. SHARE-BASED COMPENSATION (continued)
Share-based compensation plans (continued)
RSU Scheme (continued)
Thirteen months ended 31 December
2018
Twelve months ended 30 November
2017
Number of shares
Restricted Share Units
Outstanding at beginning of financial period 42,600,687 49,337,302
Awarded 11,617,538 16,003,902
Forfeited (4,544,909) (7,751,321)
Vested (11,871,992) (14,989,196)
Outstanding at end of financial period 37,801,324 42,600,687
SO Scheme
The objectives of the SO Scheme are to align eligible participants’ interests with those of the shareholders of the Company
by allowing eligible participants to share in the value created at the point they exercise their options. Share option (SO)
awards are vested either entirely after a specific period of time or in tranches over the vesting period approximately three
to five years, during which, the eligible participants are required to remain in employment with the Group. For SO awards
vested in tranches, each vesting tranche is accounted for as a separate award for the purposes of recognising the expense
over the vesting period. The awarded share options expire 10 years from the date of grant and each share option entitles
the eligible participant to subscribe for one ordinary share. Except in jurisdictions where restrictions apply, the awarded
share options are expected to be settled in equity; awards that the Group has the legal or constructive obligation to settle
in cash are insignificant to the Group. The total number of shares under options that can be awarded under the scheme is
301,100,000 (30 November 2017: 301,100,000), representing approximately 2.5 per cent (30 November 2017: 2.5 per
cent) of the number of shares in issue at 31 December 2018.
Information about share options outstanding and share options exercisable by the Group’s employees and directors as at
the end of the reporting period is as follows:
Thirteen months ended 31 December 2018
Twelve months ended 30 November 2017
Number ofshare options
Weighted average
exercise price(HK$)
Number ofshare options
Weighted average
exercise price(HK$)
Share options
Outstanding at beginning of financial period 29,112,234 42.58 41,581,033 35.88
Awarded 4,601,313 67.03 9,460,949 51.70
Exercised (1,355,304) 38.00 (17,053,136) 30.10
Forfeited or expired (1,954,299) 46.73 (4,876,612) 46.79
Outstanding at end of financial period 30,403,944 46.22 29,112,234 42.58
Share options exercisable at end of financial period 12,849,114 38.11 14,134,157 37.38
At the respective dates on which the share options were exercised, the weighted average share price of the Company was
HK$67.88 for the thirteen months ended 31 December 2018 (twelve months ended 30 November 2017: HK$52.61).
ANNUAL REPORT 2018 |
OV
ER
VIE
WF
INA
NC
IAL
AN
D O
PE
RA
TIN
G R
EV
IEW
CO
RP
OR
AT
E G
OV
ER
NA
NC
EF
INA
NC
IAL
STA
TE
ME
NT
SA
DD
ITIO
NA
L IN
FO
RM
AT
ION
NOTES TO THE CONSOLIDATED FINANCIAL STATEMENTS AND SIGNIFICANT ACCOUNTING POLICIES

238
39. SHARE-BASED COMPENSATION (continued)
Share-based compensation plans (continued)
SO Scheme (continued)
The range of exercise prices for the share options outstanding as of 31 December 2018 and 30 November 2017 is
summarised in the table below.
Thirteen months ended 31 December 2018
Twelve months ended 30 November 2017
Number ofshare options
outstanding
Weighted average
remaining contractual life
(years)
Number ofshare options
outstanding
Weighted average
remaining contractual life
(years)
Range of exercise price
HK$26 – HK$35 4,350,787 3.11 5,059,663 4.21
HK$36 – HK$45 11,259,533 6.40 12,090,822 7.58
HK$46 – HK$55 9,041,481 7.29 10,787,231 8.34
HK$56 – HK$65 1,336,469 8.72 1,174,518 9.67
HK$66 – HK$75 4,415,674 9.20 – –
Outstanding at end of financial period 30,403,944 6.70 29,112,234 7.36
ESPPUnder the plan, eligible employees of the Group can purchase ordinary shares of the Company with qualified employee contributions and the Company will award one matching restricted stock purchase unit to them at the end of the vesting period for each two shares purchased through the qualified employee contributions (contribution shares). Contribution shares are purchased from the open market. During the vesting period, the eligible employees must hold the contribution shares purchased during the plan cycle and remain employed by the Group. The level of qualified employee contribution is limited to not more than 8 per cent of the annual basic salary subject to a maximum of HK$117,000 per annum. The awarded matching restricted stock purchase units are expected to be settled in equity. For the thirteen months ended 31 December 2018, eligible employees paid US$24m (twelve months ended 30 November 2017: US$20m) to purchase 2,833,351 ordinary shares (twelve months ended 30 November 2017: 2,739,064 ordinary shares) of the Company.
ASPPThe structure of the ASPP generally follows that of the ESPP, the key difference being that the eligible agents are required to pay a subscription price of US$1 to subscribe for each new share in the Company at the end of the vesting period. Under the plan, eligible agents of the Group can purchase ordinary shares of the Company with qualified agent contributions and the Company will award one matching restricted stock subscription unit to them at the end of the vesting period for each two shares purchased through the qualified agent contributions (agent contribution shares). Each restricted stock subscription unit entitles eligible agents to subscribe for one new share of the Company. Agent contribution shares are purchased from the open market. During the vesting period, the eligible agents must hold the contribution shares purchased during the plan cycle and maintain their agent contracts with the Group. The awarded matching restricted stock subscription units are expected to be settled in equity. The level of qualified agent contribution is subject to a maximum of US$15,000 per annum. For the thirteen months ended 31 December 2018, eligible agents paid US$25m (twelve months ended 30 November 2017: US$20m) to purchase 2,886,679 ordinary shares (twelve months ended 30 November 2017: 2,708,018 ordinary shares) of the Company.
Valuation methodologyThe Group utilises a binomial lattice model to calculate the fair value of the share option awards, a Monte-Carlo simulation model and/or discounted cash flow technique to calculate the fair value of the RSU, ESPP and ASPP awards, taking into account the terms and conditions upon which the awards were made. The price volatility is estimated on the basis of implied volatility of the Company’s shares which is based on an analysis of historical data since they are traded in the Hong Kong Stock Exchange. The expected life of the share options is derived from the output of the valuation model and is calculated based on an analysis of expected exercise behaviour of the Company’s employees. The estimate of market condition for performance-based RSUs is based on one-year historical data preceding the grant date. An allowance for forfeiture prior to vesting is not included in the valuation of the awards.
| AIA GROUP LIMITED
FINANCIAL STATEMENTS

239
39. SHARE-BASED COMPENSATION (continued)
Valuation methodology (continued)
The fair value calculated for share options is inherently subjective due to the assumptions made and the limitations of the
model utilised.
Thirteen months ended 31 December 2018
Share optionsRestricted
share units
ESPP Restricted stock purchase
units
ASPP Restricted stock subscription
units
Assumptions
Risk-free interest rate 1.87%-2.33% 1.48%-2.11%* 1.35%-2.27% 1.44%
Volatility 20% 20% 20% 20%
Dividend yield 1.50%-1.80% 1.50%-1.80% 1.50%-1.80% 1.80%
Exercise price (HK$) 63.64-67.15 n/a n/a n/a
Share option life (in years) 10 n/a n/a n/a
Expected life (in years) 7.89-7.95 n/a n/a n/a
Weighted average fair value per option/unit at measurement date (HK$) 13.69 57.52 60.26 54.26
Twelve months ended 30 November 2017
Share optionsRestricted
share units
ESPP Restricted stock purchase
units
ASPP Restricted stock subscription
units
Assumptions
Risk-free interest rate 1.45% – 1.90% 0.83% – 1.29%* 0.68% – 1.29% 1.25%
Volatility 20% 20% 20% 20%
Dividend yield 1.8% 1.8% 1.8% 1.8%
Exercise price (HK$) 50.30 – 61.55 n/a n/a n/a
Share option life (in years) 10 n/a n/a n/a
Expected life (in years) 7.95 – 8.00 n/a n/a n/a
Weighted average fair value per option/unit at measurement date (HK$) 10.47 39.95 58.25 45.81
* Applicable to RSU with market conditions.
The weighted average share price for share option valuation for awards made during the thirteen months ended 31
December 2018 is HK$67.03 (twelve months ended 30 November 2017: HK$51.70). The total fair value of share options
awarded during the thirteen months ended 31 December 2018 is US$8m (twelve months ended 30 November 2017:
US$13m).
Recognised compensation costThe total recognised compensation cost (net of expected forfeitures) related to various share-based compensation awards
made under the RSU Scheme, SO Scheme, ESPP and ASPP by the Group for the thirteen months ended 31 December 2018
is US$82m (twelve months ended 30 November 2017: US$79m).
ANNUAL REPORT 2018 |
OV
ER
VIE
WF
INA
NC
IAL
AN
D O
PE
RA
TIN
G R
EV
IEW
CO
RP
OR
AT
E G
OV
ER
NA
NC
EF
INA
NC
IAL
STA
TE
ME
NT
SA
DD
ITIO
NA
L IN
FO
RM
AT
ION
NOTES TO THE CONSOLIDATED FINANCIAL STATEMENTS AND SIGNIFICANT ACCOUNTING POLICIES

240
40. REMUNERATION OF DIRECTORS AND KEY MANAGEMENT PERSONNELDirectors’ remunerationThe Executive Director receives compensation in the form of salaries, bonuses, contributions to pension schemes, long-term
incentives, housing and other allowances, and benefits in kind subject to applicable laws, rules and regulations. Bonuses and
long-term incentives represent the variable components in the Executive Director’s compensation and are linked to the
performance of the Group and the Executive Director. Details of share-based payment schemes are described in note 39.
US$Director’s
fees
Salaries, allowances
and benefits in kind(1) Bonuses
Share-based payments(2)
Pension scheme
contributionsOther
benefitsInducement
fees Total
Thirteen months ended 31 December 2018
Executive Director
Mr. Ng Keng Hooi(3) – 1,689,773 3,854,533 4,023,357 99,406 – – 9,667,069
Total – 1,689,773 3,854,533 4,023,357 99,406 – – 9,667,069
US$Director’s
fees
Salaries, allowances
and benefits in kind(1) Bonuses
Share-based payments(2)
Pension scheme
contributionsOther
benefits(4)
Inducement fees Total
Twelve months ended 30 November 2017
Executive Directors
Mr. Mark Edward Tucker(5) – 1,135,952 4,824,000 8,336,772 70,949 1,154,706 – 15,522,379
Mr. Ng Keng Hooi(3) – 749,333 1,504,110 1,375,587 44,788 – – 3,673,818
Total – 1,885,285 6,328,110 9,712,359 115,737 1,154,706 – 19,196,197
Notes:
(1) Includes non-cash benefits for housing, medical and life insurance, club and professional membership, company car and perquisites.
(2) Includes SOs and RSUs awarded based upon the fair value at grant date.
(3) Mr. Ng Keng Hooi is currently the Group Chief Executive and President of the Company. He receives his remuneration exclusively for his role as Group Chief Executive and President and receives no separate fees for his role as Director of the Company or for acting as a director of any subsidiary of the Company.
(4) Includes post-employment benefits received during garden leave and termination benefits.
(5) Mr. Mark Edward Tucker retired as Group Chief Executive and President with effect from 1 June 2017. Formerly, he received remuneration exclusively for his role as Group Chief Executive and President and received no separate fees for his role as Director of the Company or for acting as a director of any subsidiary of the Company.
| AIA GROUP LIMITED
FINANCIAL STATEMENTS

241
40. REMUNERATION OF DIRECTORS AND KEY MANAGEMENT PERSONNEL (continued)
Directors’ remuneration (continued)
The remuneration of Non-executive Director and Independent Non-executive Directors of the Company at 31 December
2018 and 30 November 2017 are included in the tables below:
US$Director’s
fees(1)
Salaries, allowances
and benefits in kind(2) Bonuses
Share-based payments
Pension scheme
contributionsOther
benefitsInducement
fees Total
Thirteen months ended
31 December 2018
Independent Non-executive Directors
Mr. Edmund Sze-Wing Tse 618,411 133,594 – – – – – 752,005
Mr. Jack Chak-Kwong So 282,082 – – – – – – 282,082
Mr. Chung-Kong Chow 238,685 – – – – – – 238,685
Mr. John Barrie Harrison 282,082 – – – – – – 282,082
Mr. George Yong-Boon Yeo 265,808 – – – – – – 265,808
Mr. Mohamed Azman Yahya 222,411 – – – – – – 222,411
Professor Lawrence Juen-Yee Lau 222,411 – – – – – – 222,411
Ms. Swee-Lian Teo 222,411 – – – – – – 222,411
Dr. Narongchai Akrasanee(3) 287,427 – – – – – – 287,427
Mr. Cesar Velasquez Purisima 189,863 – – – – – – 189,863
Total 2,831,591 133,594 – – – – – 2,965,185
ANNUAL REPORT 2018 |
OV
ER
VIE
WF
INA
NC
IAL
AN
D O
PE
RA
TIN
G R
EV
IEW
CO
RP
OR
AT
E G
OV
ER
NA
NC
EF
INA
NC
IAL
STA
TE
ME
NT
SA
DD
ITIO
NA
L IN
FO
RM
AT
ION
NOTES TO THE CONSOLIDATED FINANCIAL STATEMENTS AND SIGNIFICANT ACCOUNTING POLICIES

242
40. REMUNERATION OF DIRECTORS AND KEY MANAGEMENT PERSONNEL (continued)
Directors’ remuneration (continued)
US$Director’s
fees(1)
Salaries, allowances
and benefits in kind(2) Bonuses
Share-based payments
Pension scheme
contributionsOther
benefitsInducement
fees Total
Twelve months ended 30 November 2017
Non-executive Director
Mr. Mark Edward Tucker(4) – – – – – – – –
Independent Non-executive Directors
Mr. Edmund Sze-Wing Tse(5) 570,000 109,383 – – – – – 679,383
Mr. Jack Chak-Kwong So 260,000 – – – – – – 260,000
Mr. Chung-Kong Chow 220,000 – – – – – – 220,000
Mr. John Barrie Harrison 260,000 – – – – – – 260,000
Mr. George Yong-Boon Yeo 245,000 – – – – – – 245,000
Mr. Mohamed Azman Yahya 205,000 – – – – – – 205,000
Professor Lawrence Juen-Yee Lau 205,000 – – – – – – 205,000
Ms. Swee-Lian Teo 205,000 – – – – – – 205,000
Dr. Narongchai Akrasanee(3) 265,000 – – – – – – 265,000
Mr. Cesar Velasquez Purisima(6) 43,630 – – – – – – 43,630
Total 2,478,630 109,383 – – – – – 2,588,013
Notes:
(1) Saved as disclosed below, all Directors receive the fees for their role as a Director of the Company and not for acting as a director of any subsidiary of the Company.
(2) Includes non-cash benefits for housing, club and professional membership, medical insurance and company car.
(3) Dr. Narongchai Akrasanee was appointed as Independent Non-executive Director of the Company on 15 January 2016. US$50,000 and US$54,167 which represented remuneration to Dr. Narongchai Akrasanee in respect of his services as Chairman of Advisory Board of AIA Thailand for the twelve months ended 30 November 2017 and for the thirteen months ended 31 December 2018 respectively were included in his fees stated above.
(4) Mr. Mark Edward Tucker was re-designated as Non-executive Director of the Company on 1 June 2017 and retired from the position on 1 September 2017. He did not receive a Director’s fee during his tenure of office as a Non-executive Director of the Company.
(5) Mr. Edmund Sze-Wing Tse was re-designated as Independent Non-executive Director of the Company on 23 March 2017.
(6) Mr. Cesar Velasquez Purisima was appointed as Independent Non-executive Director of the Company on 1 September 2017.
Remuneration of five highest-paid individualsThe aggregate remuneration of the five highest-paid individuals employed by the Group in each of the thirteen months
ended 31 December 2018 and the twelve months ended 30 November 2017 is presented in the table below.
US$Director’s
fees
Salaries, allowances
and benefits in kind(1) Bonuses
Share-based payments(2)
Pension scheme
contributionsOther
benefits(3)
Inducement fees Total
Thirteen months ended 31 December 2018 – 5,885,017 8,676,292 10,343,424 326,851 465,665 – 25,697,249
Twelve months ended 30 November 2017 – 5,098,393 10,523,042 15,462,857 247,032 2,458,727 – 33,790,051
Notes:
(1) 2018 and 2017 non-cash benefits include housing, medical and life insurance, medical check-up, children’s education, club and professional membership, company car and perquisites.
(2) Includes SOs and RSUs awarded to the five highest-paid individuals based upon the fair value at grant date.
(3) 2018 other benefits include tax equalisation, 2017 other benefits include post-employment benefits received during garden leave, termination benefits and tax equalisation.
| AIA GROUP LIMITED
FINANCIAL STATEMENTS

243
40. REMUNERATION OF DIRECTORS AND KEY MANAGEMENT PERSONNEL (continued)
Remuneration of five highest-paid individuals (continued)
The emoluments of the five individuals with the highest emoluments are within the following bands:
HK$
Thirteen months ended 31 December
2018
Twelve months ended 30 November
2017
28,500,001 to 29,000,000 – 1
29,000,001 to 29,500,000 1 –
31,500,001 to 32,000,000 2 –
32,000,001 to 32,500,000 – 1
32,500,001 to 33,000,000 1 –
35,000,001 to 35,500,000 – 1
45,500,001 to 46,000,000 – 1
75,500,001 to 76,000,000 1 –
120,500,001 to 121,000,000 – 1
Key management personnel remunerationKey management personnel have been identified as the members of the Group’s Executive Committee.
US$
Thirteen months ended 31 December
2018
Twelve months ended 30 November
2017
Key management compensation and other expenses
Salaries and other short-term employee benefits 28,562,471 27,287,043
Post-employment benefits 726,421 3,731,580
Share-based payments(1) 16,266,771 18,646,971
Termination benefits – 3,078,510
Total 45,555,663 52,744,104
Note:
(1) Include SOs and RSUs awarded to the key management personnel based upon the fair value at grant date.
The emoluments of the key management personnel are within the following bands:
US$
Thirteen months ended 31 December
2018
Twelve months ended 30 November
2017
Below 1,000,000 1 4
1,000,001 to 2,000,000 – 5
2,000,001 to 3,000,000 4 1
3,000,001 to 4,000,000 4 3
4,000,001 to 5,000,000 3 2
5,000,001 to 6,000,000 – 1
Over 7,000,000 1 1
ANNUAL REPORT 2018 |
OV
ER
VIE
WF
INA
NC
IAL
AN
D O
PE
RA
TIN
G R
EV
IEW
CO
RP
OR
AT
E G
OV
ER
NA
NC
EF
INA
NC
IAL
STA
TE
ME
NT
SA
DD
ITIO
NA
L IN
FO
RM
AT
ION
NOTES TO THE CONSOLIDATED FINANCIAL STATEMENTS AND SIGNIFICANT ACCOUNTING POLICIES

244
41. RELATED PARTY TRANSACTIONSRemuneration of Directors and key management personnel is disclosed in note 40.
42. COMMITMENTS AND CONTINGENCIESCommitments under operating leasesTotal future aggregate minimum lease payments under non-cancellable operating leases are as follows:
US$m
As at31 December
2018
As at30 November
2017
Properties and others expiring
Not later than one year 171 128
Later than one and not later than five years 301 219
Later than five years 41 48
Total 513 395
The Group is the lessee in respect of a number of properties and items of office equipment held under operating leases.
The leases typically run for an initial period of one to ten years, with an option to renew the lease when all terms are
renegotiated. Lease payments are usually reviewed at the end of the lease term to reflect market rates. None of the leases
include contingent rentals.
Investment and capital commitments
US$m
As at31 December
2018
As at30 November
2017
Not later than one year 1,353 1,231
Later than one and not later than five years 5 6
Total 1,358 1,237
Investment and capital commitments consist of commitments to invest in private equity partnerships and other assets.
ContingenciesThe Group is subject to regulation in each of the geographical markets in which it operates from insurance, securities,
capital markets, pension, data privacy and other regulators and is exposed to the risk of regulatory actions in response to
perceived or actual non-compliance with regulations relating to suitability, sales or underwriting practices, claims
payments and procedures, product design, disclosure, administration, denial or delay of benefits and breaches of fiduciary
or other duties. The Group believes that these matters have been adequately provided for in these financial statements.
The Group is exposed to legal proceedings, complaints and other actions from its activities including those arising from
commercial activities, sales practices, suitability of products, policies and claims. The Group believes that these matters
are adequately provided for in these financial statements.
The Group is the reinsurer in a residential mortgage credit reinsurance agreement covering residential mortgages in
Australia. The Group is exposed to the risk of losses in the event of the failure of the retrocessionaire, a subsidiary of
American International Group, Inc., to honour its outstanding obligations which is mitigated by a trust agreement. The
principal balance outstanding of mortgage loans to which the reinsurance agreement relates were approximately US$486m
at 31 December 2018 (30 November 2017: US$561m). The liabilities and related reinsurance assets, which totalled
US$2m (30 November 2017: US$2m), respectively, arising from these agreements are reflected and presented on a gross
basis in these financial statements in accordance with the Group’s accounting policies. The Group expects to fully recover
amounts outstanding at the reporting date under the terms of this agreement from the retrocessionaire.
| AIA GROUP LIMITED
FINANCIAL STATEMENTS

245
43. SUBSIDIARIESThe principal subsidiary companies which materially contribute to the net income of the Group or hold a material element
of its assets and liabilities are:
Name of entity
Place of
incorporation
and operation Principal activity Issued share capital
As at
31 December 2018
As at
30 November 2017
Group’s
interest %
NCI’s
interest %
Group’s
interest %
NCI’s
interest %
AIA Company Limited(1) Hong Kong Insurance 1,151,049,861 ordinary shares
of US$5,962,084,000 issued
share capital
100% – 100% –
AIA International Limited Bermuda Insurance 3,000,000 ordinary shares of
US$1.20 each
100% – 100% –
AIA Australia Limited Australia Insurance 112,068,300 ordinary shares
of A$193,872,800 issued
share capital
100% – 100% –
AIA Pension and Trustee Co. Ltd. British Virgin
Islands
Trusteeship 19,500,000 ordinary shares
of US$1 each
100% – 100% –
AIA Bhd. Malaysia Insurance 767,438,174 ordinary shares
of RM1,450,890,000 issued
share capital
100% – 100% –
AIA Singapore Private Limited Singapore Insurance 1,374,000,001 ordinary shares
of S$1 each
100% – 100% –
PT. AIA Financial Indonesia Insurance 1,910,844,140 ordinary shares
of Rp1,000 each
100% – 100% –
The Philippine American Life
and General Insurance
(PHILAM LIFE) Company
Philippines Insurance 199,560,671 ordinary shares
of PHP10 each and 439,329
treasury shares
100% – 100% –
AIA (Vietnam) Life Insurance
Company Limited
Vietnam Insurance Contributed capital of
VND3,224,420,000,000
100% – 100% –
AIA Insurance Lanka PLC Sri Lanka Insurance Stated capital of
LKR511,921,836
97.16% 2.84% 97.16% 2.84%
Bayshore Development Group Limited British Virgin
Islands
Investment
holding
company
100 ordinary shares of
US$1 each
90% 10% 90% 10%
BPI-Philam Life Assurance (BPLAC)
Corporation
Philippines Insurance 749,993,979 ordinary shares
of PHP1 each and 6,000
treasury shares
51% 49% 51% 49%
AIA Reinsurance Limited Bermuda Reinsurance 250,000 common shares of
US$1 each
100% – 100% –
AIA Life Insurance Co. Ltd. Korea Insurance 60,328,932 ordinary shares of
KRW603,289,320,000 issued
share capital
100% – – –
Sovereign Assurance Company
Limited
New Zealand Insurance 187,805,849 ordinary shares
of NZD539,676,534
issued share capital
100% – – –
Notes:
(1) The Company’s subsidiary.
(2) All of the above subsidiaries are audited by PricewaterhouseCoopers.
All subsidiaries are unlisted except AIA Insurance Lanka PLC which is listed on the Main Board of the Colombo Stock
Exchange.
ANNUAL REPORT 2018 |
OV
ER
VIE
WF
INA
NC
IAL
AN
D O
PE
RA
TIN
G R
EV
IEW
CO
RP
OR
AT
E G
OV
ER
NA
NC
EF
INA
NC
IAL
STA
TE
ME
NT
SA
DD
ITIO
NA
L IN
FO
RM
AT
ION
NOTES TO THE CONSOLIDATED FINANCIAL STATEMENTS AND SIGNIFICANT ACCOUNTING POLICIES

246
44. EVENTS AFTER THE REPORTING PERIODIn September 2017, the Group reached an agreement to acquire Commonwealth Bank of Australia’s (CBA) life insurance
business in Australia, including a 20-year strategic bancassurance partnership with CBA in Australia. The acquisition
remains in progress, subject to securing all necessary regulatory and governmental approvals. The transaction aims to
expand the Group’s distribution capabilities and customer reach in Australia. The total gross consideration to be paid with
respect to the proposed transaction is expected to be approximately US$2.0 billion payable in cash on completion of the
proposed transaction and subject to certain adjustments at completion. After taking into account the expected proceeds
from reinsurance agreement and the expected free surplus of the acquired business, the final net cash outlay by AIA is
expected to be approximately US$1.0 billion.
On 16 January 2019, the Group issued Hong Kong dollar-denominated fixed rate medium-term notes that are unlisted. The
offering comprised of HK$1,300 million of 3.5-year notes at an annual rate of 2.95 per cent and HK$1,100 million of 12-
year notes at an annual rate of 3.68 per cent. In aggregate the US dollar-equivalent is approximately US$307 million.
On 15 March 2019, a Committee appointed by the Board of Directors proposed a final dividend of 84.80 Hong Kong cents
per share (twelve months ended 30 November 2017: 74.38 Hong Kong cents per share), and a special dividend of 9.50
Hong Kong cents per share (twelve months ended 30 November 2017: nil) for the additional month in the accounting
period due to the change of the Group’s financial year-end date from 30 November 2018 to 31 December 2018.
| AIA GROUP LIMITED
FINANCIAL STATEMENTS

247
45. STATEMENT OF FINANCIAL POSITION OF THE COMPANY
US$m
As at
31 December
2018
As at
30 November
2017
Assets
Investment in subsidiaries 15,751 15,750
Available for sale – debt securities 2,917 2,442
At fair value through profit or loss – derivative financial instruments 5 37
Loans to/amounts due from subsidiaries 7,384 3,554
Other assets 115 17
Cash and cash equivalents 14 5
Total assets 26,186 21,805
Liabilities
Borrowings 5,547 4,420
Derivative financial instruments 33 125
Other liabilities 151 43
Total liabilities 5,731 4,588
Equity
Share capital 14,073 14,065
Employee share-based trusts (258) (297)
Other reserves 231 200
Retained earnings 6,488 3,315
Amounts reflected in other comprehensive income (79) (66)
Total equity 20,455 17,217
Total liabilities and equity 26,186 21,805
Note:
(1) The financial information of the Company should be read in conjunction with the consolidated financial statements of the Group.
Approved and authorised for issue by the Board of Directors on 15 March 2019.
Ng Keng Hooi Edmund Sze-Wing Tse
Director Director
ANNUAL REPORT 2018 |
OV
ER
VIE
WF
INA
NC
IAL
AN
D O
PE
RA
TIN
G R
EV
IEW
CO
RP
OR
AT
E G
OV
ER
NA
NC
EF
INA
NC
IAL
STA
TE
ME
NT
SA
DD
ITIO
NA
L IN
FO
RM
AT
ION
NOTES TO THE CONSOLIDATED FINANCIAL STATEMENTS AND SIGNIFICANT ACCOUNTING POLICIES

248
46. STATEMENT OF CHANGES IN EQUITY OF THE COMPANY
US$m Share capital
Employee share-based
trustsOther
reservesRetained earnings
Amounts reflected in other
comprehensive income Total equity
Balance at 1 December 2017 14,065 (297) 200 3,315 (66) 17,217
Net profit – – – 4,762 – 4,762
Fair value losses on available for sale financial assets – – – – (34) (34)
Fair value losses on available for sale financial assets transferred to income on disposal – – – – 21 21
Dividends – – – (1,589) – (1,589)
Shares issued under share option scheme and agency share purchase plan 8 – – – – 8
Share-based compensation – – 82 – – 82
Purchase of shares held by employee share-based trusts – (12) – – – (12)
Transfer of vested shares from employee share-based trusts – 51 (51) – – –
Balance at 31 December 2018 14,073 (258) 231 6,488 (79) 20,455
US$m Share capital
Employee share-based
trustsOther
reservesRetained earnings
Amounts reflected in other
comprehensive income Total equity
Balance at 1 December 2016 13,998 (351) 185 2,620 (59) 16,393
Net profit – – – 2,071 – 2,071
Cash flow hedges – – – – (11) (11)
Fair value losses on available for sale financial assets – – – – (4) (4)
Fair value losses on available for sale financial assets transferred to income on disposal – – – – 8 8
Dividends – – – (1,376) – (1,376)
Shares issued under share option scheme and agency share purchase plan 67 – – – – 67
Share-based compensation – – 79 – – 79
Purchase of shares held by employee share-based trusts – (10) – – – (10)
Transfer of vested shares from employee share-based trusts – 64 (64) – – –
Balance at 30 November 2017 14,065 (297) 200 3,315 (66) 17,217
| AIA GROUP LIMITED
FINANCIAL STATEMENTS

249
47. SUPPLEMENTARY FINANCIAL INFORMATION ON A CALENDAR YEAR BASISIn February 2018, the Board resolved to change the Company’s financial year-end date from 30 November to 31 December.
Accordingly, the current financial period-end date of the Company is 31 December 2018 and the consolidated financial
statements of the Group cover the 13-month period from 1 December 2017 to 31 December 2018. In conjunction with this
change, the following financial information is voluntarily disclosed by the Company for comparison purpose.
The accounting policies adopted to prepare the following supplementary financial information are consistent with those
shown in note 2 of this 2018 consolidated financial statements.
(a) Consolidated Income Statement
US$m
Twelve months ended 31 December
2018
Twelve months ended 31 December
2017
Revenue
Premiums and fee income 31,271 27,241
Premiums ceded to reinsurers (1,842) (1,524)
Net premiums and fee income 29,429 25,717
Investment return 2,655 13,907
Other operating revenue 285 224
Total revenue 32,369 39,848
Expenses
Insurance and investment contract benefits 23,633 27,112
Insurance and investment contract benefits ceded (1,675) (1,282)
Net insurance and investment contract benefits 21,958 25,830
Commission and other acquisition expenses 3,781 3,486
Operating expenses 2,171 2,019
Finance costs 212 185
Other expenses 739 607
Total expenses 28,861 32,127
Profit before share of profit from associates and joint ventures 3,508 7,721
Share of profit from associates and joint ventures – –
Profit before tax 3,508 7,721
Income tax credit/(expense) attributable to policyholders’ returns 65 (135)
Profit before tax attributable to shareholders’ profits 3,573 7,586
Tax expense (849) (1,159)
Tax attributable to policyholders’ returns (65) 135
Tax expense attributable to shareholders’ profits (914) (1,024)
Net profit 2,659 6,562
Net profit attributable to:
Shareholders of AIA Group Limited 2,597 6,496
Non-controlling interests 62 66
Earnings per share (US$)
Basic 0.22 0.54
Diluted 0.22 0.54
ANNUAL REPORT 2018 |
OV
ER
VIE
WF
INA
NC
IAL
AN
D O
PE
RA
TIN
G R
EV
IEW
CO
RP
OR
AT
E G
OV
ER
NA
NC
EF
INA
NC
IAL
STA
TE
ME
NT
SA
DD
ITIO
NA
L IN
FO
RM
AT
ION
NOTES TO THE CONSOLIDATED FINANCIAL STATEMENTS AND SIGNIFICANT ACCOUNTING POLICIES

250
47. SUPPLEMENTARY FINANCIAL INFORMATION ON A CALENDAR YEAR BASIS (continued)
(b) Consolidated Statement of Financial Position
US$m
As at31 December
2018
As at31 December
2017
Assets
Intangible assets 1,970 1,870
Investments in associates and joint ventures 610 643
Property, plant and equipment(1) 1,233 1,225
Investment property(1) 4,794 4,363
Reinsurance assets 2,887 2,549
Deferred acquisition and origination costs 24,626 21,950
Financial investments:
Loans and deposits 7,392 8,210
Available for sale
Debt securities 112,485 106,788
At fair value through profit or loss
Debt securities 27,736 26,081
Equity securities 38,099 38,079
Derivative financial instruments 430 345
186,142 179,503
Deferred tax assets 26 13
Current tax recoverable 164 117
Other assets 4,903 4,491
Cash and cash equivalents 2,451 1,922
Total assets 229,806 218,646
Liabilities
Insurance contract liabilities 164,764 151,475
Investment contract liabilities 7,885 8,210
Borrowings 4,954 3,958
Obligations under repurchase and securities lending agreements 1,683 1,557
Derivative financial instruments 243 271
Provisions 168 223
Deferred tax liabilities 4,187 3,611
Current tax liabilities 532 497
Other liabilities 5,984 5,288
Total liabilities 190,400 175,090
| AIA GROUP LIMITED
FINANCIAL STATEMENTS

251
47. SUPPLEMENTARY FINANCIAL INFORMATION ON A CALENDAR YEAR BASIS (continued)
(b) Consolidated Statement of Financial Position (continued)
US$m
As at31 December
2018
As at31 December
2017
Equity
Share capital 14,073 14,065
Employee share-based trusts (258) (298)
Other reserves (11,910) (11,943)
Retained earnings 35,661 34,653
Fair value reserve 2,211 6,763
Foreign currency translation reserve (1,301) (569)
Property revaluation reserve 538 530
Others (8) (25)
Amounts reflected in other comprehensive income 1,440 6,699
Total equity attributable to:
Shareholders of AIA Group Limited 39,006 43,176
Non-controlling interests 400 380
Total equity 39,406 43,556
Total liabilities and equity 229,806 218,646
Note:
(1) The appraisal values for the real estate of the Group as at 31 December 2017 remain unchanged from those reported in the consolidated financial statements of the Group as at 30 November 2017.
ANNUAL REPORT 2018 |
OV
ER
VIE
WF
INA
NC
IAL
AN
D O
PE
RA
TIN
G R
EV
IEW
CO
RP
OR
AT
E G
OV
ER
NA
NC
EF
INA
NC
IAL
STA
TE
ME
NT
SA
DD
ITIO
NA
L IN
FO
RM
AT
ION
NOTES TO THE CONSOLIDATED FINANCIAL STATEMENTS AND SIGNIFICANT ACCOUNTING POLICIES

252
47. SUPPLEMENTARY FINANCIAL INFORMATION ON A CALENDAR YEAR BASIS (continued)
(c) Exchange ratesThe Group’s principal overseas operations during the reporting period were located within the Asia-Pacific region. The
results and cash flows of these operations have been translated into US dollars at the following average rates:
US dollar exchange rates
Twelve months ended 31 December
2018
Twelve months ended 31 December
2017
Hong Kong 7.84 7.79
Thailand 32.33 33.90
Singapore 1.35 1.38
Malaysia 4.03 4.30
China 6.61 6.75
Assets and liabilities have been translated at the following period-end rates:
US dollar exchange rates
As at31 December
2018
As at31 December
2017
Hong Kong 7.83 7.82
Thailand 32.47 32.61
Singapore 1.36 1.34
Malaysia 4.14 4.05
China 6.88 6.51
Exchange rates are expressed in units of local currency per US$1.
| AIA GROUP LIMITED
FINANCIAL STATEMENTS

253
47. SUPPLEMENTARY FINANCIAL INFORMATION ON A CALENDAR YEAR BASIS (continued)
(d) Operating profit after taxOperating profit after tax may be reconciled to net profit as follows:
US$m
Twelve months ended 31 December
2018
Twelve months ended 31 December
2017
Operating profit after tax 5,343 4,670
Non-operating items, net of related changes in insurance and investment contract liabilities:
Short-term fluctuations in investment return related to equities and real estate (net of tax of: twelve months ended 31 December 2018: US$187m; twelve months ended 31 December 2017: US$(143)m) (2,036) 2,063
Reclassification of revaluation gain for property held for own use (net of tax of: twelve months ended 31 December 2018: US$11m; twelve months ended 31 December 2017: US$4m)(1)(2) (212) (84)
Corporate transaction related costs (net of tax of: twelve months ended
31 December 2018: US$(35)m; twelve months ended 31 December 2017:
US$6m)(2) (148) (25)
Implementation costs for new accounting standards
(net of tax of: twelve months ended 31 December 2018: US$5m;
twelve months ended 31 December 2017: nil)(2) (42) (7)
Other non-operating investment return and other items (net of tax of: twelve months ended 31 December 2018: US$12m; twelve months ended 31 December 2017: US$26m)(2) (246) (55)
Net profit 2,659 6,562
Operating profit after tax attributable to:
Shareholders of AIA Group Limited 5,298 4,635
Non-controlling interests 45 35
Net profit attributable to:
Shareholders of AIA Group Limited 2,597 6,496
Non-controlling interests 62 66
Operating profit is determined using, among others, expected long-term investment return for equities and real estate.
Short-term fluctuations between expected long-term investment return and actual investment return for these asset
classes are excluded from operating profit. The investment return assumptions used to determine expected long-term
investment return are based on the same assumptions used by the Group in determining its embedded value and are
disclosed in the Supplementary Embedded Value Information.
Notes:
(1) Short-term fluctuations in investment return include the revaluation gain for property held for own use. This amount is then reclassified out of net profit to conform to IFRS measurement and presentation.
(2) The comparative information has been adjusted to conform to current period presentation.
ANNUAL REPORT 2018 |
OV
ER
VIE
WF
INA
NC
IAL
AN
D O
PE
RA
TIN
G R
EV
IEW
CO
RP
OR
AT
E G
OV
ER
NA
NC
EF
INA
NC
IAL
STA
TE
ME
NT
SA
DD
ITIO
NA
L IN
FO
RM
AT
ION
NOTES TO THE CONSOLIDATED FINANCIAL STATEMENTS AND SIGNIFICANT ACCOUNTING POLICIES

254
47. SUPPLEMENTARY FINANCIAL INFORMATION ON A CALENDAR YEAR BASIS (continued)
(e) Total weighted premium income and annualised new premiums
TWPIUS$m
Twelve months ended31 December
2018
Twelve months ended31 December
2017
TWPI by geography
Hong Kong 11,444 9,535
Thailand 3,895 3,559
Singapore 2,738 2,435
Malaysia 2,083 1,848
China 4,006 3,118
Other Markets 6,377 5,898
Total 30,543 26,393
First year premiums by geography
Hong Kong 2,386 2,231
Thailand 554 477
Singapore 337 272
Malaysia 307 285
China 1,050 838
Other Markets 1,067 925
Total 5,701 5,028
Single premiums by geography
Hong Kong 2,556 2,405
Thailand 269 194
Singapore 1,747 1,422
Malaysia 195 182
China 142 136
Other Markets 687 620
Total 5,596 4,959
Renewal premiums by geography
Hong Kong 8,802 7,063
Thailand 3,314 3,063
Singapore 2,226 2,021
Malaysia 1,757 1,545
China 2,942 2,266
Other Markets 5,241 4,911
Total 24,282 20,869
| AIA GROUP LIMITED
FINANCIAL STATEMENTS

255
47. SUPPLEMENTARY FINANCIAL INFORMATION ON A CALENDAR YEAR BASIS (continued)
(e) Total weighted premium income and annualised new premiums (continued)
ANPUS$m
Twelve months ended31 December
2018
Twelve months ended31 December
2017
ANP by geography
Hong Kong 2,697 2,493
Thailand 611 519
Singapore 547 426
Malaysia 382 340
China 1,067 873
Other Markets 1,206 973
Total 6,510 5,624
ANNUAL REPORT 2018 |
OV
ER
VIE
WF
INA
NC
IAL
AN
D O
PE
RA
TIN
G R
EV
IEW
CO
RP
OR
AT
E G
OV
ER
NA
NC
EF
INA
NC
IAL
STA
TE
ME
NT
SA
DD
ITIO
NA
L IN
FO
RM
AT
ION
NOTES TO THE CONSOLIDATED FINANCIAL STATEMENTS AND SIGNIFICANT ACCOUNTING POLICIES

256
47. SUPPLEMENTARY FINANCIAL INFORMATION ON A CALENDAR YEAR BASIS (continued)
(f) Segment information
US$m Hong Kong Thailand Singapore Malaysia ChinaOther
Markets
Group Corporate
Centre Total
Twelve months ended 31 December 2018
ANP 2,697 611 547 382 1,067 1,206 – 6,510
TWPI 11,444 3,895 2,738 2,083 4,006 6,377 – 30,543
Net premiums, fee income and other operating revenue (net of reinsurance ceded) 12,858 3,832 3,114 1,831 3,878 4,177 26 29,716
Investment return 2,647 1,322 1,175 592 860 1,112 368 8,076
Total revenue 15,505 5,154 4,289 2,423 4,738 5,289 394 37,792
Net insurance and investment contract benefits 11,572 2,895 3,103 1,577 2,968 2,791 25 24,931
Commission and other acquisition expenses 1,414 757 353 254 266 721 13 3,778
Operating expenses 401 218 209 180 323 640 200 2,171
Finance costs and other expenses 137 51 29 12 35 52 159 475
Total expenses 13,524 3,921 3,694 2,023 3,592 4,204 397 31,355
Share of profit from associates and joint ventures – – – – – – – –
Operating profit/(losses) before tax 1,981 1,233 595 400 1,146 1,085 (3) 6,437
Tax on operating profit/(losses) before tax (152) (238) (37) (75) (276) (234) (82) (1,094)
Operating profit/(losses) after tax 1,829 995 558 325 870 851 (85) 5,343
Operating profit/(losses) after tax attributable to:
Shareholders of AIA Group Limited 1,814 995 558 320 870 826 (85) 5,298
Non-controlling interests 15 – – 5 – 25 – 45
Key operating ratios:
Expense ratio 3.5% 5.6% 7.6% 8.6% 8.1% 10.0% – 7.1%
Operating margin 16.0% 25.5% 20.4% 15.6% 21.7% 13.3% – 17.5%
Operating return on shareholders’ allocated equity 23.2% 16.8% 18.2% 20.2% 24.6% 12.3% – 14.5%
Operating profit/(losses) before tax includes:
Finance costs 31 1 – – 21 3 139 195
Depreciation and amortisation 33 11 19 16 25 49 11 164
| AIA GROUP LIMITED
FINANCIAL STATEMENTS

257
47. SUPPLEMENTARY FINANCIAL INFORMATION ON A CALENDAR YEAR BASIS (continued)
(f) Segment information (continued)
US$m Hong Kong Thailand Singapore Malaysia ChinaOther
Markets
Group Corporate
Centre Total
31 December 2018
Total assets 71,898 31,632 36,064 14,526 24,228 39,095 12,363 229,806
Total liabilities 64,299 24,627 32,865 12,885 20,068 30,889 4,767 190,400
Total equity 7,599 7,005 3,199 1,641 4,160 8,206 7,596 39,406
Shareholders’ allocated equity 7,508 6,181 3,115 1,601 3,565 6,901 7,924 36,795
Net capital (out)/in flows (1,054) (149) (267) (185) (542) (556) 1,245 (1,508)
Total assets includes:
Investments in associates and joint ventures – – – 6 – 604 – 610
Segment information may be reconciled to the consolidated income statement as shown below:
US$mSegment
information
Short-term fluctuations in
investment return related
to equities and real estate
Other non-operating
items(1)
Consolidated income
statement
Twelve months ended 31 December 2018
Net premiums, fee income and other operating revenue 29,716 – (2) 29,714
Net premiums, fee income and other operating revenue
Investment return 8,076 (3,140) (2,281) 2,655 Investment return
Total revenue 37,792 (3,140) (2,283) 32,369 Total revenue
Net insurance and investment contract benefits 24,931 (917) (2,056) 21,958
Net insurance and investment contract benefits
Other expenses 6,424 – 479 6,903 Other expenses
Total expenses 31,355 (917) (1,577) 28,861 Total expenses
Share of profit from associates and joint ventures – – – –
Share of profit from associates and joint ventures
Operating profit before tax 6,437 (2,223) (706) 3,508 Profit before tax
Note:
(1) Include unit-linked contracts.
ANNUAL REPORT 2018 |
OV
ER
VIE
WF
INA
NC
IAL
AN
D O
PE
RA
TIN
G R
EV
IEW
CO
RP
OR
AT
E G
OV
ER
NA
NC
EF
INA
NC
IAL
STA
TE
ME
NT
SA
DD
ITIO
NA
L IN
FO
RM
AT
ION
NOTES TO THE CONSOLIDATED FINANCIAL STATEMENTS AND SIGNIFICANT ACCOUNTING POLICIES

258
47. SUPPLEMENTARY FINANCIAL INFORMATION ON A CALENDAR YEAR BASIS (continued)
(f) Segment information (continued)
US$m Hong Kong Thailand Singapore Malaysia ChinaOther
Markets
Group Corporate
Centre Total
Twelve months ended 31 December 2017
ANP 2,493 519 426 340 873 973 – 5,624
TWPI 9,535 3,559 2,435 1,848 3,118 5,898 – 26,393
Net premiums, fee income and other operating revenue (net of reinsurance ceded) 10,972 3,567 2,840 1,622 3,011 3,921 8 25,941
Investment return 2,187 1,208 1,094 554 747 1,058 341 7,189
Total revenue 13,159 4,775 3,934 2,176 3,758 4,979 349 33,130
Net insurance and investment contract benefits 9,615 2,697 2,821 1,457 2,410 2,642 4 21,646
Commission and other acquisition expenses 1,232 747 352 209 183 748 1 3,472
Operating expenses 416 202 183 167 286 569 196 2,019
Finance costs and other expenses 119 49 28 11 30 43 126 406
Total expenses 11,382 3,695 3,384 1,844 2,909 4,002 327 27,543
Share of profit from associates and joint ventures – – – – – – – –
Operating profit before tax 1,777 1,080 550 332 849 977 22 5,587
Tax on operating profit before tax (138) (212) (37) (56) (206) (214) (54) (917)
Operating profit/(losses) after tax 1,639 868 513 276 643 763 (32) 4,670
Operating profit/(losses) after tax attributable to:
Shareholders of AIA Group Limited 1,627 868 513 274 643 742 (32) 4,635
Non-controlling interests 12 – – 2 – 21 – 35
Key operating ratios:
Expense ratio 4.4% 5.7% 7.5% 9.0% 9.2% 9.6% – 7.6%
Operating margin 17.2% 24.4% 21.1% 14.9% 20.6% 12.9% – 17.7%
Operating return on shareholders’ allocated equity 23.1% 17.2% 18.6% 18.8% 20.3% 12.5% – 14.0%
Operating profit before tax includes:
Finance costs 29 7 – – 18 2 106 162
Depreciation and amortisation 37 10 16 17 18 41 11 150
| AIA GROUP LIMITED
FINANCIAL STATEMENTS

259
US$m Hong Kong Thailand Singapore Malaysia ChinaOther
Markets
Group Corporate
Centre Total
31 December 2017
Total assets 66,710 31,299 36,175 14,546 20,470 37,913 11,533 218,646
Total liabilities 54,658 24,111 32,665 12,957 17,263 29,852 3,584 175,090
Total equity 12,052 7,188 3,510 1,589 3,207 8,061 7,949 43,556
Shareholders’ allocated equity 8,122 5,656 3,019 1,566 3,511 6,539 8,000 36,413
Net capital (out)/in flows (952) (467) (238) (192) (207) 17 799 (1,240)
Total assets includes:
Investments in associates and joint ventures – – 1 7 – 635 – 643
Segment information may be reconciled to the consolidated income statement as shown below:
US$mSegment
information
Short-term fluctuations in
investment return related to
equities and real estate
Other non-operating
items(1)
Consolidated income
statement
Twelve months ended 31 December 2017
Net premiums, fee income and other operating revenue 25,941 – – 25,941
Net premiums, fee income and other operating revenue
Investment return 7,189 2,713 4,005 13,907 Investment return
Total revenue 33,130 2,713 4,005 39,848 Total revenue
Net insurance and investment contract benefits 21,646 507 3,677 25,830
Net insurance and investment contract benefits
Other expenses 5,897 – 400 6,297 Other expenses
Total expenses 27,543 507 4,077 32,127 Total expenses
Share of profit from associates and joint ventures – – – –
Share of profit from associates and joint ventures
Operating profit before tax 5,587 2,206 (72) 7,721 Profit before tax
Note:
(1) Include unit-linked contracts.
47. SUPPLEMENTARY FINANCIAL INFORMATION ON A CALENDAR YEAR BASIS (continued)
(f) Segment information (continued)
ANNUAL REPORT 2018 |
OV
ER
VIE
WF
INA
NC
IAL
AN
D O
PE
RA
TIN
G R
EV
IEW
CO
RP
OR
AT
E G
OV
ER
NA
NC
EF
INA
NC
IAL
STA
TE
ME
NT
SA
DD
ITIO
NA
L IN
FO
RM
AT
ION
NOTES TO THE CONSOLIDATED FINANCIAL STATEMENTS AND SIGNIFICANT ACCOUNTING POLICIES

260
47. SUPPLEMENTARY FINANCIAL INFORMATION ON A CALENDAR YEAR BASIS (continued)
(g) Investment return
US$m
Twelve months ended31 December
2018
Twelve months ended31 December
2017
Interest income 6,235 5,652
Dividend income 795 693
Rental income 171 152
Investment income 7,201 6,497
Available for sale
Net realised (losses)/gains from debt securities (13) 202
Impairment of debt securities (81) –
Net (losses)/gains of available for sale financial assets reflected in the consolidated income statement (94) 202
At fair value through profit or loss
Net gains/(losses) of financial assets designated at fair value through profit or loss
Net gains of debt securities 53 53
Net (losses)/gains of equity securities (4,814) 6,781
Net fair value movement on derivatives (206) 743
Net (losses)/gains in respect of financial instruments at fair value through profit or loss (4,967) 7,577
Net fair value movement of investment property and property held for own use 469 367
Net foreign exchange gains/(losses) 54 (709)
Other net realised losses (8) (27)
Investment experience (4,546) 7,410
Investment return 2,655 13,907
Foreign currency movements resulted in the following gains/(losses) recognised in the consolidated income statement
(other than gains and losses arising on items measured at fair value through profit or loss):
US$m
Twelve months ended31 December
2018
Twelve months ended31 December
2017
Foreign exchange gains/(losses) 69 (279)
| AIA GROUP LIMITED
FINANCIAL STATEMENTS

261
47. SUPPLEMENTARY FINANCIAL INFORMATION ON A CALENDAR YEAR BASIS (continued)
(h) Expenses
US$m
Twelve months ended31 December
2018
Twelve months ended31 December
2017
Insurance contract benefits 12,471 11,735
Change in insurance contract liabilities 11,758 13,982
Investment contract benefits (596) 1,395
Insurance and investment contract benefits 23,633 27,112
Insurance and investment contract benefits ceded (1,675) (1,282)
Insurance and investment contract benefits, net of reinsurance ceded 21,958 25,830
Commission and other acquisition expenses incurred 6,271 5,505
Deferral and amortisation of acquisition costs (2,490) (2,019)
Commission and other acquisition expenses 3,781 3,486
Employee benefit expenses 1,370 1,265
Depreciation 74 65
Amortisation 53 53
Operating lease rentals 174 148
Other operating expenses 500 488
Operating expenses 2,171 2,019
Investment management expenses and others 479 408
Depreciation on property held for own use 35 22
Restructuring and other non-operating costs(1) 204 153
Change in third-party interests in consolidated investment funds 21 24
Other expenses 739 607
Finance costs 212 185
Total 28,861 32,127
Note:
(1) Restructuring costs represent costs related to restructuring programmes and are primarily comprised of redundancy and contract termination costs. Other non-operating costs primarily consist of corporate transaction related costs and implementation costs for new accounting standards.
Finance costs may be analysed as:
US$m
Twelve months ended31 December
2018
Twelve months ended31 December
2017
Repurchase agreements 39 47
Medium-term notes 164 134
Other loans 9 4
Total 212 185
ANNUAL REPORT 2018 |
OV
ER
VIE
WF
INA
NC
IAL
AN
D O
PE
RA
TIN
G R
EV
IEW
CO
RP
OR
AT
E G
OV
ER
NA
NC
EF
INA
NC
IAL
STA
TE
ME
NT
SA
DD
ITIO
NA
L IN
FO
RM
AT
ION
NOTES TO THE CONSOLIDATED FINANCIAL STATEMENTS AND SIGNIFICANT ACCOUNTING POLICIES

262
47. SUPPLEMENTARY FINANCIAL INFORMATION ON A CALENDAR YEAR BASIS (continued)
(i) Earnings per shareBasic
Twelve months ended31 December
2018
Twelve months ended31 December
2017
Net profit attributable to shareholders of AIA Group Limited (US$m) 2,597 6,496
Weighted average number of ordinary shares in issue (million) 12,021 12,002
Basic earnings per share (US cents per share) 21.60 54.12
Diluted
Twelve months ended31 December
2018
Twelve months ended31 December
2017
Net profit attributable to shareholders of AIA Group Limited (US$m) 2,597 6,496
Weighted average number of ordinary shares in issue (million) 12,021 12,002
Adjustment for share options, restricted share units, restricted stock purchase units and restricted stock subscription units awarded under share-based compensation plans (million) 35 37
Weighted average number of ordinary shares for diluted earnings per share (million) 12,056 12,039
Diluted earnings per share (US cents per share) 21.54 53.96
At 31 December 2018, share options of 5,752,143 (31 December 2017: 5,835,750) were excluded from the diluted
weighted average number of ordinary shares calculation as their effect would have been anti-dilutive.
Operating profit after tax per share
Twelve months ended31 December
2018
Twelve months ended31 December
2017
Basic (US cents per share) 44.07 38.62
Diluted (US cents per share) 43.94 38.50
| AIA GROUP LIMITED
FINANCIAL STATEMENTS

263
47. SUPPLEMENTARY FINANCIAL INFORMATION ON A CALENDAR YEAR BASIS (continued)
(j) Financial investmentsDebt securities
Debt securities by type comprise the following:
Policyholder and shareholder(5)
Consolidated investment
funds(4)
Participating funds and Other participating business
with distinct portfoliosOther policyholder and
shareholder Unit-linked
US$m FVTPL AFS FVTPL AFS Subtotal FVTPL FVTPL Total
31 December 2017
Government bonds 6,097 896 60 36,927 43,980 1,131 – 45,111
Government agency bonds(1) 3,942 535 13 8,693 13,183 212 344 13,739
Corporate bonds 10,854 17,033 174 42,083 70,144 1,365 1,668 73,177
Structured securities(2) 199 317 22 304 842 – – 842
Total(3) 21,092 18,781 269 88,007 128,149 2,708 2,012 132,869
Notes:
(1) Government agency bonds comprise bonds issued by government-sponsored institutions such as national, provincial and municipal authorities; government-related entities; multilateral development banks and supranational organisations.
(2) Structured securities include collateralised debt obligations, mortgage-backed securities and other asset-backed securities.
(3) Debt securities of US$4,692m are restricted due to local regulatory requirements.
(4) Consolidated investment funds reflect 100 per cent of assets and liabilities held by such funds.
(5) The information has been adjusted to conform to the current period presentation.
Equity securities
Equity securities by type comprise the following:
Policyholder and shareholder(2)
Participating funds and Other
participating business with
distinct portfolios
Other policyholder
and shareholder Unit-linked
Consolidated investment
funds(1)
US$m FVTPL FVTPL Subtotal FVTPL FVTPL Total
31 December 2017
Equity shares 9,173 5,340 14,513 4,832 – 19,345
Interests in investment funds 3,325 719 4,044 14,690 – 18,734
Total 12,498 6,059 18,557 19,522 – 38,079
Notes:
(1) Consolidated investment funds reflect 100 per cent of assets and liabilities held by such funds.
(2) The information has been adjusted to conform to the current period presentation.
ANNUAL REPORT 2018 |
OV
ER
VIE
WF
INA
NC
IAL
AN
D O
PE
RA
TIN
G R
EV
IEW
CO
RP
OR
AT
E G
OV
ER
NA
NC
EF
INA
NC
IAL
STA
TE
ME
NT
SA
DD
ITIO
NA
L IN
FO
RM
AT
ION
NOTES TO THE CONSOLIDATED FINANCIAL STATEMENTS AND SIGNIFICANT ACCOUNTING POLICIES

264
47. SUPPLEMENTARY FINANCIAL INFORMATION ON A CALENDAR YEAR BASIS (continued)
(j) Financial investments (continued)
Debt and equity securities
US$m
As at31 December
2017
Debt securities
Listed 102,106
Unlisted 30,763
Total 132,869
Equity securities
Listed 21,118
Unlisted(1) 16,961
Total 38,079
Note:
(1) Including US$15,804m of investment funds which can be redeemed daily.
Loans and deposits
US$m
As at31 December
2017
Policy loans 2,765
Mortgage loans on residential real estate 607
Mortgage loans on commercial real estate 44
Other loans 1,114
Allowance for loan losses (12)
Loans 4,518
Term deposits 2,113
Promissory notes(1) 1,579
Total 8,210
Note:
(1) The promissory notes are issued by a government.
| AIA GROUP LIMITED
FINANCIAL STATEMENTS

265
47. SUPPLEMENTARY FINANCIAL INFORMATION ON A CALENDAR YEAR BASIS (continued)
(k) Insurance and investment contract liabilitiesInsurance contract liabilities
The movement of insurance contract liabilities (including liabilities in respect of investment contracts with DPF) is shown
as follows:
US$m
Twelve months ended31 December
2018
Twelve months ended31 December
2017
At beginning of financial period 151,475 128,588
Valuation premiums and deposits 29,220 26,424
Liabilities released for policy termination or other policy benefits paid and related expenses (16,155) (15,994)
Fees from account balances (1,742) (1,834)
Accretion of interest 5,208 4,483
Change in net asset values attributable to policyholders (1,162) 3,363
Acquisition of subsidiaries 91 –
Foreign exchange movements (2,865) 7,041
Other movements 694 (596)
At end of financial period 164,764 151,475
Insurance contract liabilities (including liabilities in respect of investment contracts with DPF) can also be analysed as
follows:
US$m
As at31 December
2017
Deferred profit 7,213
Unearned revenue 2,605
Policyholders’ share of participating surplus 8,117
Liabilities for future policyholder benefits 133,540
Total 151,475
Investment contract liabilities
US$m
Twelve months ended31 December
2018
Twelve months ended31 December
2017
At beginning of financial period 8,210 6,926
Investment contract benefits (594) 1,395
Fees charged (122) (144)
Acquisition of subsidiaries 480 –
Net withdrawals and other movements 17 (145)
Foreign exchange movements (106) 178
At end of financial period 7,885 8,210(1)
Note:
(1) Of investment contract liabilities, US$475m represents deferred fee income.
ANNUAL REPORT 2018 |
OV
ER
VIE
WF
INA
NC
IAL
AN
D O
PE
RA
TIN
G R
EV
IEW
CO
RP
OR
AT
E G
OV
ER
NA
NC
EF
INA
NC
IAL
STA
TE
ME
NT
SA
DD
ITIO
NA
L IN
FO
RM
AT
ION
NOTES TO THE CONSOLIDATED FINANCIAL STATEMENTS AND SIGNIFICANT ACCOUNTING POLICIES

266
47. SUPPLEMENTARY FINANCIAL INFORMATION ON A CALENDAR YEAR BASIS (continued)
(l) Group capital structureRegulatory Solvency
The capital positions of the Group’s two principal operating companies as of 31 December 2017 are as follows:
31 December 2017(unaudited)
US$mTotal available
capitalRegulatory
minimum capital Solvency ratio
AIA Co. 8,395 1,882 446%
AIA International 7,883 2,511 314%
| AIA GROUP LIMITED
FINANCIAL STATEMENTS

267
INDEPENDENT AUDITOR’S REPORT ON THE SUPPLEMENTARY EMBEDDED VALUE INFORMATION
INDEPENDENT AUDITOR’S REPORT ON THE SUPPLEMENTARY EMBEDDED VALUE INFORMATION AS AT AND FOR THE YEAR ENDED 31 DECEMBER 2018TO THE BOARD OF DIRECTORS OF AIA GROUP LIMITED(incorporated in Hong Kong with limited liability)
OpinionWhat we have audited
We have audited the Supplementary Embedded Value Information (the “EV Information”) of AIA
Group Limited (the “Company”) and its subsidiaries (the “Group”) set out on pages 271 to 293,
which comprises:
• the consolidated EV results as at and for the year ended 31 December 2018;
• the sensitivity analysis as at and for the year then ended; and
• a summary of significant methodology and assumptions and other explanatory notes.
Our opinion
In our opinion, the EV Information of the Group as at and for the year ended 31 December 2018 is
prepared, in all material respects, in accordance with the EV basis of preparation set out in
Sections 4 and 5 of the EV Information.
Basis for OpinionWe conducted our audit in accordance with Hong Kong Standards on Auditing (“HKSAs”) issued
by the Hong Kong Institute of Certified Public Accountants (“HKICPA”). Our responsibilities under
those standards are further described in the Auditor’s Responsibilities for the Audit of the EV
Information section of our report.
We believe that the audit evidence we have obtained is sufficient and appropriate to provide a
basis for our opinion.
Independence
We are independent of the Group in accordance with the HKICPA’s Code of Ethics for Professional
Accountants (“the Code”), and we have fulfilled our other ethical responsibilities in accordance
with the Code.
Emphasis of Matter – Basis of PreparationWe draw attention to Sections 4 and 5 of the EV Information, which describe the EV basis of
preparation. As a result, the EV Information may not be suitable for another purpose. Our opinion
is not modified in respect of this matter.
ANNUAL REPORT 2018 |
OV
ER
VIE
WF
INA
NC
IAL
AN
D O
PE
RA
TIN
G R
EV
IEW
CO
RP
OR
AT
E G
OV
ER
NA
NC
EF
INA
NC
IAL
STA
TE
ME
NT
SA
DD
ITIO
NA
L IN
FO
RM
AT
ION
FINANCIAL STATEMENTS

268
Other MatterThe Group has prepared a separate set of consolidated financial statements for the thirteen months
period ended 31 December 2018 in accordance with Hong Kong Financial Reporting Standards
(“HKFRSs”) issued by the HKICPA and with International Financial Reporting Standards (“IFRSs”)
issued by the International Accounting Standards Board (“IASB”), on which we issued a separate
auditor’s report to the shareholders of the Company dated 15 March 2019.
Other InformationThe Directors of the Company are responsible for the other information. The other information
comprises the Group Chief Executive and President’s Report, Financial Review, Business Review,
Regulatory and International Developments, Consolidated Financial Statements and our auditor’s
report thereon, Condensed Business and Financial Review for the Thirteen Months ended 31
December 2018 and Glossary (but does not include the EV Information of AIA Group Limited and
our auditor’s report thereon), which we obtained prior to the date of this auditor’s report, and the
Financial Highlights, Chairman’s Statement, Risk Management, Valuing Our People, Corporate
Social Responsibility, Statement of Directors’ Responsibilities, Board of Directors, Executive
Committee, Report of the Directors, Corporate Governance Report, Remuneration Report,
Information for Shareholders and Corporate Information, which are expected to be made available
to us after that date.
Our opinion on the EV Information does not cover the other information and we do not and will not
express any form of assurance conclusion thereon.
In connection with our audit of the EV Information, our responsibility is to read the other
information identified above and, in doing so, consider whether the other information is materially
inconsistent with the EV Information or our knowledge obtained in the audit, or otherwise appears
to be materially misstated.
If, based on the work we have performed on the other information that we obtained prior to the
date of this auditor’s report, we conclude that there is a material misstatement of this other
information, we are required to report that fact. We have nothing to report in this regard.
When we read the Financial Highlights, Chairman’s Statement, Risk Management, Valuing Our
People, Corporate Social Responsibility, Statement of Directors’ Responsibilities, Board of
Directors, Executive Committee, Report of the Directors, Corporate Governance Report,
Remuneration Report, Information for Shareholders and Corporate Information, if we conclude
that there is a material misstatement therein, we are required to communicate the matter to those
charged with governance and take appropriate action considering our legal rights and obligations.
| AIA GROUP LIMITED
FINANCIAL STATEMENTS

269
Responsibilities of Directors and Those Charged with Governance for the EV InformationThe Directors of the Company are responsible for the preparation of the EV Information in
accordance with the EV basis of preparation set out in Sections 4 and 5 of the EV Information and
for such internal control as the Directors determine is necessary to enable the preparation of the
EV Information that is free from material misstatement, whether due to fraud or error.
In preparing the EV Information, the Directors are responsible for assessing the Group’s ability to
continue as a going concern, disclosing, as applicable, matters relating to going concern and
using the going concern basis of accounting unless the Directors either intend to liquidate the
Group or to cease operations, or has no realistic alternative but to do so.
Those charged with governance are responsible for overseeing the Group’s EV Information
reporting process.
Auditor’s Responsibilities for the Audit of the EV InformationOur objectives are to obtain reasonable assurance about whether the EV Information as a whole
is free from material misstatement, whether due to fraud or error, and to issue an auditor’s report
that includes our opinion. We report our opinion solely to you, as a body, and for no other purpose.
We do not assume responsibility towards or accept liability to any other person for the contents
of this report.
Reasonable assurance is a high level of assurance, but is not a guarantee that an audit conducted
in accordance with HKSAs will always detect a material misstatement when it exists. Misstatements
can arise from fraud or error and are considered material if, individually or in the aggregate, they
could reasonably be expected to influence the economic decisions of users taken on the basis of
this EV Information.
As part of an audit in accordance with HKSAs, we exercise professional judgement and maintain
professional scepticism throughout the audit. We also:
• Identify and assess the risks of material misstatement of the EV Information, whether due to
fraud or error, design and perform audit procedures responsive to those risks, and obtain audit
evidence that is sufficient and appropriate to provide a basis for our opinion. The risk of not
detecting a material misstatement resulting from fraud is higher than for one resulting from
error, as fraud may involve collusion, forgery, intentional omissions, misrepresentations, or the
override of internal control.
• Obtain an understanding of internal control relevant to the audit in order to design audit
procedures that are appropriate in the circumstances, but not for the purpose of expressing an
opinion on the effectiveness of the Group’s internal control.
ANNUAL REPORT 2018 |
OV
ER
VIE
WF
INA
NC
IAL
AN
D O
PE
RA
TIN
G R
EV
IEW
CO
RP
OR
AT
E G
OV
ER
NA
NC
EF
INA
NC
IAL
STA
TE
ME
NT
SA
DD
ITIO
NA
L IN
FO
RM
AT
ION
INDEPENDENT AUDITOR’S REPORT ON THE SUPPLEMENTARY EMBEDDED VALUE INFORMATION

270
Auditor’s Responsibilities for the Audit of the EV Information (continued)
• Evaluate the appropriateness of the EV basis of preparation used and the reasonableness of accounting estimates and related disclosures made by the Directors.
• Conclude on the appropriateness of the Directors’ use of the going concern basis of accounting and, based on the audit evidence obtained, whether a material uncertainty exists related to events or conditions that may cast significant doubt on the Group’s ability to continue as a going concern. If we conclude that a material uncertainty exists, we are required to draw attention in our auditor’s report to the related disclosures in the EV Information or, if such disclosures are inadequate, to modify our opinion. Our conclusions are based on the audit evidence obtained up to the date of our auditor’s report. However, future events or conditions may cause the Group to cease to continue as a going concern.
• Obtain sufficient appropriate audit evidence regarding the EV Information of the entities or business activities within the Group to express an opinion on the EV Information. We are responsible for the direction, supervision and performance of the group audit. We remain solely responsible for our audit opinion.
We communicate with those charged with governance regarding, among other matters, the planned scope and timing of the audit and significant audit findings, including any significant deficiencies in internal control that we identify during our audit.
We also provide those charged with governance with a statement that we have complied with relevant ethical requirements regarding independence, and to communicate with them all relationships and other matters that may reasonably be thought to bear on our independence, and where applicable, related safeguards.
The engagement partner on the audit resulting in this independent auditor’s report is Lars Christian Jordy Nielsen.
PricewaterhouseCoopers
Certified Public Accountants
Hong Kong
15 March 2019
| AIA GROUP LIMITED
FINANCIAL STATEMENTSINDEPENDENT AUDITOR’S REPORT ON THE SUPPLEMENTARY EMBEDDED VALUE INFORMATION

271
SUPPLEMENTARY EMBEDDED VALUE INFORMATION
CAUTIONARY STATEMENTS CONCERNING SUPPLEMENTARY EMBEDDED VALUE INFORMATIONThis report includes non-IFRS financial measures and should not be viewed as a substitute for IFRS financial measures.
The results shown in this report are not intended to represent an opinion of market value and should not be interpreted in
that manner. This report does not purport to encompass all of the many factors that may bear upon a market value.
The results shown in this report are based on a series of assumptions as to the future. It should be recognised that actual
future results may differ from those shown, on account of changes in the operating and economic environments and
natural variations in experience. The results shown are presented at the valuation dates stated in this report and no
warranty is given by the Group that future experience after these valuation dates will be in line with the assumptions made.
ANNUAL REPORT 2018 |
OV
ER
VIE
WF
INA
NC
IAL
AN
D O
PE
RA
TIN
G R
EV
IEW
CO
RP
OR
AT
E G
OV
ER
NA
NC
EF
INA
NC
IAL
STA
TE
ME
NT
SA
DD
ITIO
NA
L IN
FO
RM
AT
ION
FINANCIAL STATEMENTS

272
1. HIGHLIGHTSThe embedded value (EV) is a measure of the value of shareholders’ interests in the earnings distributable from assets
allocated to the in-force business after allowance for the aggregate risks in that business. The Group uses a traditional
deterministic discounted cash flow methodology for determining its EV and value of new business (VONB). This
methodology makes an implicit overall level of allowance for risk including the cost of investment return guarantees and
policyholder options, asset-liability mismatch risk, credit risk, the risk that actual experience in future years differs from
that assumed, and the economic cost of capital, through the use of a risk discount rate. The equity attributable to
shareholders of the Company on the embedded value basis (EV Equity) is the total of EV, goodwill and other intangible
assets attributable to shareholders of the Company. More details on the EV results, methodology and assumptions are
covered in later sections of this report.
As set out in our 2017 annual results preliminary announcement published on 27 February 2018, the Board resolved to
change the Company’s financial year-end date from 30 November to 31 December in February 2018. Accordingly, the
current financial year-end date of the Company is 31 December 2018. In conjunction with this change, the financial
information as at 31 December 2017 is provided for comparative purposes.
The Group completed the acquisition of Sovereign Assurance Company Limited, included as part of the acquisition of ASB
Group (Life) Limited and its subsidiaries (Sovereign) on 2 July 2018. The financial results of this newly-acquired business
are reported in the Group’s results for the year ended 31 December 2018 from the date of completion. See Sections 2 and
4 of this report and note 5 to the IFRS consolidated financial statements for more details.
Summary of key metrics(1) (US$ millions)
As at31 December
2018
As at31 December
2017Change
CERChange
AER
Equity attributable to shareholders of the Company on the embedded value basis (EV Equity)
56,203 52,429 9% 7%
Embedded value (EV) 54,517 50,779 10% 7%
Adjusted net worth (ANW) 24,637 20,974 19% 17%
Value of in-force business (VIF) 29,880 29,805 3% –
Year ended31 December
2018
Year ended31 December
2017YoY
CERYoY
AER
Value of new business (VONB) 3,955 3,206 22% 23%
Annualised new premiums (ANP) 6,510 5,624 15% 16%
VONB margin 60.0% 56.0% 3.7 pps 4.0 pps
EV operating profit 8,278 6,654 23% 24%
Operating return on EV (Operating ROEV) 16.3% 15.5% 1.1 pps 0.8 pps
Note:
(1) The results are after adjustment to reflect the consolidated reserving and capital requirements and the present value of future after-tax unallocated Group Office expenses.
| AIA GROUP LIMITED
FINANCIAL STATEMENTS

273
2. EMBEDDED VALUE RESULTS2.1 Embedded Value by Business UnitThe EV as at 31 December 2018 is presented consistently with the segment information in the IFRS consolidated financial
statements.
Summary of EV by Business Unit (US$ millions)
As at 31 December 2018
Business Unit ANW(1)VIF before
CoC CoCVIF after
CoC EV
AIA Hong Kong 6,608 12,617 867 11,750 18,358
AIA Thailand 4,787 4,861 808 4,053 8,840
AIA Singapore 2,376 3,968 665 3,303 5,679
AIA Malaysia 1,206 1,630 206 1,424 2,630
AIA China 2,938 5,248 – 5,248 8,186
Other Markets 4,873 3,833 985 2,848 7,721
Group Corporate Centre 7,870 (131) – (131) 7,739
Subtotal 30,658 32,026 3,531 28,495 59,153
Adjustment to reflect consolidated reserving and capital requirements(2) (6,021) 3,284 936 2,348 (3,673)
After-tax value of unallocated Group Office expenses – (963) – (963) (963)
Total 24,637 34,347 4,467 29,880 54,517
As at 31 December 2017
Business Unit ANW(1)VIF before
CoC CoCVIF after
CoC EV
AIA Hong Kong 6,701 11,158 935 10,223 16,924
AIA Thailand 4,566 4,719 784 3,935 8,501
AIA Singapore 2,516 3,643 721 2,922 5,438
AIA Malaysia 1,200 1,508 218 1,290 2,490
AIA China 2,143 4,863 – 4,863 7,006
Other Markets 4,823 3,258 978 2,280 7,103
Group Corporate Centre 8,381 (121) (1) (120) 8,261
Subtotal 30,330 29,028 3,635 25,393 55,723
Adjustment to reflect consolidated reserving and capital requirements(2) (9,356) 5,597 118 5,479 (3,877)
After-tax value of unallocated Group Office expenses – (1,067) – (1,067) (1,067)
Total 20,974 33,558 3,753 29,805 50,779
Notes:
(1) ANW by Business Unit is after net capital flows between Business Units and Group Corporate Centre as reported in the IFRS consolidated financial statements.
(2) Adjustment to reflect consolidated reserving and capital requirements as described in Section 4.4 of this report.
ANNUAL REPORT 2018 |
OV
ER
VIE
WF
INA
NC
IAL
AN
D O
PE
RA
TIN
G R
EV
IEW
CO
RP
OR
AT
E G
OV
ER
NA
NC
EF
INA
NC
IAL
STA
TE
ME
NT
SA
DD
ITIO
NA
L IN
FO
RM
AT
ION
SUPPLEMENTARY EMBEDDED VALUE INFORMATION

274
2. EMBEDDED VALUE RESULTS (continued)
2.2 Reconciliation of ANW from IFRS EquityDerivation of the consolidated ANW from IFRS equity (US$ millions)
As at31 December
2018
As at31 December
2017
IFRS equity attributable to shareholders of the Company 39,006 43,176
Elimination of IFRS deferred acquisition and origination costs assets (24,626) (21,950)
Difference between IFRS policy liabilities and local statutory policy liabilities 15,587 8,588
Difference between net IFRS policy liabilities and local statutory policy liabilities (9,039) (13,362)
Mark-to-market adjustment for property and mortgage loan investments, net of amounts attributable to participating funds 523 348
Elimination of intangible assets (1,970) (1,870)
Recognition of deferred tax impacts of the above adjustments 2,075 1,979
Recognition of non-controlling interests impacts of the above adjustments 63 59
ANW (Business Unit) 30,658 30,330
Adjustment to reflect consolidated reserving requirements, net of tax (6,021) (9,356)
ANW (Consolidated) 24,637 20,974
2.3 Breakdown of ANWThe breakdown of the ANW for the Group between the required capital, as defined in Section 4.6 of this report, and the free
surplus, which is the ANW in excess of the required capital, is set out below:
Free surplus and required capital for the Group (US$ millions)
As at 31 December 2018 As at 31 December 2017
Business Unit Consolidated Business Unit Consolidated
Free surplus 22,093 14,751 21,831 12,586
Required capital 8,565 9,886 8,499 8,388
ANW 30,658 24,637 30,330 20,974
The Company’s subsidiaries, AIA Company Limited (AIA Co.) and AIA International Limited (AIA International), are both
subject to the Hong Kong reserving and capital requirements. In addition, AIA International, which is incorporated in
Bermuda, is subject to the Bermuda Monetary Authority (BMA) reserving and capital requirements. These regulatory
reserving and capital requirements, and other consolidated reserving and capital requirements, as determined by the
Group, apply in addition to the relevant local requirements applicable to our Business Units.
| AIA GROUP LIMITED
FINANCIAL STATEMENTS

275
2. EMBEDDED VALUE RESULTS (continued)
2.4 Earnings ProfileThe tables below show how the after-tax distributable earnings from the assets backing the statutory reserves and required
capital of the in-force business of the Group are projected to emerge over future years. The projected values reflect the
consolidated reserving and capital requirements.
Profile of projected after-tax distributable earnings for the Group’s in-force business (US$ millions)
As at 31 December 2018
Expected period of emergence Undiscounted Discounted
1 – 5 years 18,922 15,668
6 – 10 years 15,095 8,280
11 – 15 years 14,753 5,440
16 – 20 years 14,312 3,588
21 years and thereafter 151,000 6,790
Total 214,082 39,766
As at 31 December 2017
Expected period of emergence Undiscounted Discounted
1 – 5 years 18,434 15,175
6 – 10 years 14,491 7,952
11 – 15 years 14,499 5,386
16 – 20 years 13,425 3,434
21 years and thereafter 126,545 6,246
Total 187,394 38,193
The profile of distributable earnings is shown on an undiscounted and discounted basis. The discounted value of after-tax
distributable earnings of US$39,766 million (2017: US$38,193 million) plus the free surplus of US$14,751 million (2017:
US$12,586 million) shown in Section 2.3 of this report is equal to the EV of US$54,517 million (2017: US$50,779 million)
shown in Section 2.1 of this report.
ANNUAL REPORT 2018 |
OV
ER
VIE
WF
INA
NC
IAL
AN
D O
PE
RA
TIN
G R
EV
IEW
CO
RP
OR
AT
E G
OV
ER
NA
NC
EF
INA
NC
IAL
STA
TE
ME
NT
SA
DD
ITIO
NA
L IN
FO
RM
AT
ION
SUPPLEMENTARY EMBEDDED VALUE INFORMATION

276
2. EMBEDDED VALUE RESULTS (continued)
2.5 Value of New BusinessThe VONB for the Group for the year ended 31 December 2018 is summarised in the table below. The VONB is defined as
the present value, at the point of sale, of the projected after-tax statutory profits less the cost of required capital. Results
are presented consistently with the segment information in the IFRS consolidated financial statements. Section 4.1 of this
report contains a list of the entities included in this report and the mapping of these entities to Business Units for the
purpose of this report.
The Group VONB for the year ended 31 December 2018 was US$3,955 million, an increase of US$749 million, or 23 per
cent on actual exchange rates (AER), from US$3,206 million for the year ended 31 December 2017.
Summary of VONB by Business Unit (US$ millions)
Year ended31 December 2018
Year ended31 December 2017
Business UnitVONB
before CoC CoCVONB after
CoC(1)VONB
before CoC CoCVONB after
CoC(1)
AIA Hong Kong 1,837 125 1,712 1,520 136 1,384
AIA Thailand 503 56 447 434 53 381
AIA Singapore 410 53 357 344 47 297
AIA Malaysia 264 17 247 233 18 215
AIA China 1,051 86 965 791 66 725
Other Markets 522 87 435 479 84 395
Total before unallocated Group Office expenses (Business Unit) 4,587 424 4,163 3,801 404 3,397
Adjustment to reflect consolidated reserving and capital requirements (76) (20) (56) (86) (25) (61)
Total before unallocated Group Office expenses (Consolidated) 4,511 404 4,107 3,715 379 3,336
After-tax value of unallocated Group Office expenses (152) – (152) (130) – (130)
Total 4,359 404 3,955 3,585 379 3,206
Note:
(1) VONB for the Group is calculated before deducting the amount attributable to non-controlling interests. The amounts of VONB attributable to non-controlling interests for the year ended 31 December 2018 and 31 December 2017 were US$27 million and US$22 million respectively.
| AIA GROUP LIMITED
FINANCIAL STATEMENTS

277
2. EMBEDDED VALUE RESULTS (continued)
2.5 Value of New Business (continued)
The table below shows the breakdown of the VONB, ANP, VONB margin, and present value of new business premium
(PVNBP) margin for the Group, by quarter, for business written in the year ended 31 December 2018.
The VONB margin and PVNBP margin are defined as VONB, excluding pension business, expressed as a percentage of ANP
and PVNBP, respectively. The VONB for pension business is excluded from the margin calculation to be consistent with the
definition of ANP and PVNBP.
The Group VONB margin for the year ended 31 December 2018 was 60.0 per cent compared with 56.0 per cent for the year
ended 31 December 2017. The Group PVNBP margin for the year ended 31 December 2018 was 10 per cent compared
with 9 per cent for the year ended 31 December 2017.
Breakdown of VONB, ANP, VONB margin and PVNBP margin (US$ millions)
VONB after CoC ANP
VONB Margin
PVNBP Margin
Year
Values for 2018
12 months ended 31 December 2018 3,955 6,510 60.0% 10%
Values for 2017
12 months ended 31 December 2017 3,206 5,624 56.0% 9%
Quarter
Values for 2018
3 months ended 31 March 2018 1,021 1,696 59.7% 10%
3 months ended 30 June 2018 933 1,556 59.3% 10%
3 months ended 30 September 2018 979 1,582 61.1% 10%
3 months ended 31 December 2018 1,022 1,676 60.1% 10%
Values for 2017
3 months ended 31 March 2017 811 1,630 49.2% 9%
3 months ended 30 June 2017 794 1,276 61.3% 10%
3 months ended 30 September 2017 846 1,422 58.4% 10%
3 months ended 31 December 2017 755 1,296 56.9% 9%
ANNUAL REPORT 2018 |
OV
ER
VIE
WF
INA
NC
IAL
AN
D O
PE
RA
TIN
G R
EV
IEW
CO
RP
OR
AT
E G
OV
ER
NA
NC
EF
INA
NC
IAL
STA
TE
ME
NT
SA
DD
ITIO
NA
L IN
FO
RM
AT
ION
SUPPLEMENTARY EMBEDDED VALUE INFORMATION

278
2. EMBEDDED VALUE RESULTS (continued)
2.5 Value of New Business (continued)
The table below shows the VONB (excluding pension business), ANP, and VONB margin by Business Unit.
Summary of VONB excluding pension, ANP and VONB margin by Business Unit (US$ millions)
Year ended31 December 2018
Year ended31 December 2017
Business Unit
VONB Excluding
Pension ANPVONB
Margin
VONB Excluding
Pension ANPVONB
Margin
AIA Hong Kong 1,671 2,697 62.0% 1,338 2,493 53.7%
AIA Thailand 447 611 73.1% 381 519 73.4%
AIA Singapore 357 547 65.4% 297 426 69.7%
AIA Malaysia 244 382 63.8% 213 340 62.5%
AIA China 965 1,067 90.5% 725 873 83.1%
Other Markets 431 1,206 35.8% 388 973 39.9%
Total before unallocated Group Office expenses (Business Unit) 4,115 6,510 63.2% 3,342 5,624 59.4%
Adjustment to reflect consolidated reserving and capital requirements (56) – (61) –
Total before unallocated Group Office expenses (Consolidated) 4,059 6,510 62.4% 3,281 5,624 58.4%
After-tax value of unallocated Group Office expenses (152) – (130) –
Total 3,907 6,510 60.0% 3,151 5,624 56.0%
| AIA GROUP LIMITED
FINANCIAL STATEMENTS

279
2. EMBEDDED VALUE RESULTS (continued)
2.6 Analysis of EV MovementAnalysis of movement in EV (US$ millions)
Year ended31 December 2018
Year ended31 December 2017
YoYAER
ANW VIF EV ANW VIF EV EV
Opening EV 20,974 29,805 50,779 16,862 25,986 42,848 19%
Purchase price (918) – (918) – – – n/m(1)
Acquired EV(2) 487 320 807 – – – n/m
Effect of acquisition (431) 320 (111) – – – n/m
Value of new business (660) 4,615 3,955 (591) 3,797 3,206 23%
Expected return on EV 4,550 (657) 3,893 4,154 (846) 3,308 18%
Operating experience variances 355 257 612 297 64 361 70%
Operating assumption changes 29 (38) (9) (229) 146 (83) (89)%
Finance costs (173) – (173) (138) – (138) 25%
EV operating profit 4,101 4,177 8,278 3,493 3,161 6,654 24%
Investment return variances (1,428) (790) (2,218) 1,272 61 1,333 n/m
Effect of changes in economic assumptions (3) 50 47 (7) (185) (192) n/m
Other non-operating variances 3,452 (3,182) 270 387 (741) (354) n/m
Total EV profit 6,122 255 6,377 5,145 2,296 7,441 (14)%
Dividends (1,589) – (1,589) (1,376) – (1,376) 15%
Other capital movements 98 – 98 134 – 134 (27)%
Effect of changes in exchange rates (537) (500) (1,037) 209 1,523 1,732 n/m
Closing EV 24,637 29,880 54,517 20,974 29,805 50,779 7%
Notes:
(1) Not meaningful (n/m).
(2) The acquired EV for Sovereign is calculated as at 2 July 2018 net of the related reinsurance agreement. See note 5 to the IFRS consolidated financial statements for more details.
ANNUAL REPORT 2018 |
OV
ER
VIE
WF
INA
NC
IAL
AN
D O
PE
RA
TIN
G R
EV
IEW
CO
RP
OR
AT
E G
OV
ER
NA
NC
EF
INA
NC
IAL
STA
TE
ME
NT
SA
DD
ITIO
NA
L IN
FO
RM
AT
ION
SUPPLEMENTARY EMBEDDED VALUE INFORMATION

280
2. EMBEDDED VALUE RESULTS (continued)
2.6 Analysis of EV Movement (continued)
EV grew to US$54,517 million at 31 December 2018, an increase of 7 per cent over the year from US$50,779 million at 31
December 2017. The growth in EV of US$3,738 million was shown after a deduction of US$111 million as of 2 July 2018
relating to the acquisition of Sovereign. The purchase price of US$918 million for the acquisition as at 2 July 2018 was as
per note 5 to the IFRS consolidated financial statements. The acquired EV of US$807 million is calculated as at 2 July 2018
net of the related reinsurance agreement.
EV operating profit grew by 24 per cent on AER to US$8,278 million (2017: US$6,654 million) compared with 2017. The
growth reflected a combination of a higher VONB of US$3,955 million (2017: US$3,206 million) and a higher expected
return on EV of US$3,893 million (2017: US$3,308 million). Overall operating experience variances and operating
assumption changes were again positive at US$603 million (2017:US$278 million). Finance costs were US$173 million
(2017: US$138 million).
The VONB is calculated at the point of sale for business written during the year before deducting the amount attributable
to non-controlling interests. The expected return on EV is the expected change in the EV over the year plus the expected
return on the VONB from the point of sale to 31 December 2018 less the VONB attributable to non-controlling interests.
Operating experience variances reflect the impact on the ANW and VIF from differences between the actual experience
over the year and that expected based on the operating assumptions.
The main operating experience variances, net of tax, of US$612 million (2017: US$361 million), comprised of:
• Expense variances of US$53 million (2017: US$9 million);
• Mortality and morbidity claims variances of US$233 million (2017: US$193 million); and
• Persistency and other variances of US$326 million (2017: US$159 million) which included persistency variances of
US$94 million (2017: US$27 million) and other variances arising from management actions of US$232 million (2017:
US$132 million).
The effect of changes in operating assumptions during the year was US$(9) million (2017: US$(83) million).
The EV profit of US$6,377 million (2017: US$7,441 million) is the total of EV operating profit, investment return variances,
the effect of changes in economic assumptions and other non-operating variances.
The investment return variances arise from the impact of differences between the actual investment returns in the year
and the expected investment returns reflecting short-term fluctuations in investment returns. This amounted to US$(2,218)
million (2017: US$1,333 million) from the effect of short-term equity market and other capital market movements on the
Group’s investment portfolio and statutory reserves compared with the expected returns.
The effect of changes in economic assumptions amounted to US$47 million (2017: US$(192) million).
Other non-operating variances amounted to US$270 million (2017: US$(354) million) which comprised of the effects of
subsidiarising AIA Korea, the transitional arrangement for equivalence and other adjustments as described in Section 4.6
partly offset by other items including modelling-related enhancements.
The Group paid total shareholder dividends of US$1,589 million (2017: US$1,376 million). Other capital movements
increased EV by US$98 million (2017: US$134 million).
Foreign exchange movements were US$(1,037) million (2017: US$1,732 million).
| AIA GROUP LIMITED
FINANCIAL STATEMENTS

281
2. EMBEDDED VALUE RESULTS (continued)
2.6 Analysis of EV Movement (continued)
Operating ROEV (US$ millions)
Operating return on EV (operating ROEV) is calculated as EV operating profit expressed as a percentage of the opening EV
and was 16.3 per cent (2017: 15.5 per cent) for the year ended 31 December 2018.
Year ended31 December
2018
Year ended31 December
2017YoY
CERYoY
AER
EV operating profit 8,278 6,654 23% 24%
Opening EV 50,779 42,848 14% 19%
Operating ROEV 16.3% 15.5% 1.1pps 0.8pps
2.7 EV EquityThe EV Equity grew to US$56,203 million at 31 December 2018, an increase of 7 per cent on AER from US$52,429 million
as at 31 December 2017.
Derivation of EV Equity from EV (US$ millions)
As at31 December
2018
As at31 December
2017Change
CERChange
AER
EV 54,517 50,779 10% 7%
Goodwill and other intangible assets(1) 1,686 1,650 5% 2%
EV Equity 56,203 52,429 9% 7%
Note:
(1) Consistent with the IFRS consolidated financial statements, net of tax, amounts attributable to participating funds and non-controlling interests.
ANNUAL REPORT 2018 |
OV
ER
VIE
WF
INA
NC
IAL
AN
D O
PE
RA
TIN
G R
EV
IEW
CO
RP
OR
AT
E G
OV
ER
NA
NC
EF
INA
NC
IAL
STA
TE
ME
NT
SA
DD
ITIO
NA
L IN
FO
RM
AT
ION
SUPPLEMENTARY EMBEDDED VALUE INFORMATION

282
3. SENSITIVITY ANALYSISThe EV as at 31 December 2018 and the VONB for the year ended 31 December 2018 have been recalculated to illustrate
the sensitivity of the results to changes in certain central assumptions discussed in Section 5 of this report.
The sensitivities analysed were:
• Risk discount rates 200 basis points per annum higher than the central assumptions;
• Risk discount rates 200 basis points per annum lower than the central assumptions;
• Interest rates 50 basis points per annum higher than the central assumptions;
• Interest rates 50 basis points per annum lower than the central assumptions;
• The presentation currency (as explained below) appreciated by 5 per cent;
• The presentation currency depreciated by 5 per cent;
• Lapse and premium discontinuance rates increased proportionally by 10 per cent (i.e. 110 per cent of the central
assumptions);
• Lapse and premium discontinuance rates decreased proportionally by 10 per cent (i.e. 90 per cent of the central
assumptions);
• Mortality/morbidity rates increased proportionally by 10 per cent (i.e. 110 per cent of the central assumptions);
• Mortality/morbidity rates decreased proportionally by 10 per cent (i.e. 90 per cent of the central assumptions);
• Maintenance expenses 10 per cent lower (i.e. 90 per cent of the central assumptions); and
• Expense inflation set to 0 per cent.
The EV as at 31 December 2018 has been further analysed for the following sensitivities:
• Equity prices increased proportionally by 10 per cent (i.e. 110 per cent of the prices at 31 December 2018); and
• Equity prices decreased proportionally by 10 per cent (i.e. 90 per cent of the prices at 31 December 2018).
For the interest rate sensitivities, the investment return assumptions and the risk discount rates were changed by 50 basis
points per annum; the projected bonus rates on participating business, the statutory reserving bases at 31 December 2018
and the values of debt instruments held at 31 December 2018 were changed to be consistent with the interest rate
assumptions in the sensitivity analysis, while all the other assumptions were unchanged.
As the Group operates in multiple geographical markets in the Asia-Pacific region, the EV results for the Group are
translated from multiple currencies to US dollar which is the Group’s presentation currency. In order to provide sensitivity
results for EV and VONB of the impact of foreign currency movements, a change of 5 per cent to the US dollar is included.
| AIA GROUP LIMITED
FINANCIAL STATEMENTS

283
3. SENSITIVITY ANALYSIS (continued)
For the equity price sensitivities, the projected bonus rates on participating business and the values of equity securities and equity funds held at 31 December 2018 were changed to be consistent with the equity price assumptions in the sensitivity analysis, while all the other assumptions were unchanged.
For each of the remaining sensitivity analyses, the statutory reserving bases as at 31 December 2018 and the projected bonus rates on participating business were changed to be consistent with the sensitivity analysis assumptions, while all the other assumptions remain unchanged.
The sensitivities chosen do not represent the boundaries of possible outcomes, but instead illustrate how certain alternative assumptions would affect the results.
Sensitivity of EV (US$ millions)
As at 31 December 2018 As at 31 December 2017
Scenario EV Ratio EV Ratio
Central value 54,517 50,779
Impact of:
200 bps increase in risk discount rates (6,607) (12.1)% (6,227) (12.3)%
200 bps decrease in risk discount rates 10,604 19.5% 10,052 19.8%
10% increase in equity prices 736 1.4% 750 1.5%
10% decrease in equity prices (731) (1.3)% (743) (1.5)%
50 bps increase in interest rates 158 0.3% 49 0.1%
50 bps decrease in interest rates (249) (0.5)% (456) (0.9)%
5% appreciation in the presentation currency (1,711) (3.1)% (1,589) (3.1)%
5% depreciation in the presentation currency 1,711 3.1% 1,589 3.1%
10% increase in lapse/discontinuance rates (885) (1.6)% (763) (1.5)%
10% decrease in lapse/discontinuance rates 984 1.8% 886 1.7%
10% increase in mortality/morbidity rates (3,796) (7.0)% (3,730) (7.3)%
10% decrease in mortality/morbidity rates 3,779 6.9% 3,665 7.2%
10% decrease in maintenance expenses 625 1.1% 574 1.1%
Expense inflation set to 0% 672 1.2% 605 1.2%
Sensitivity of VONB (US$ millions)
Year ended 31 December 2018 Year ended 31 December 2017
Scenario VONB Ratio VONB Ratio
Central value 3,955 3,206
Impact of:
200 bps increase in risk discount rates (952) (24.1)% (906) (28.3)%
200 bps decrease in risk discount rates 1,599 40.4% 1,689 52.7%
50 bps increase in interest rates 142 3.6% 162 5.1%
50 bps decrease in interest rates (184) (4.7)% (225) (7.0)%
5% appreciation in the presentation currency (120) (3.0)% (100) (3.1)%
5% depreciation in the presentation currency 120 3.0% 100 3.1%
10% increase in lapse/discontinuance rates (195) (4.9)% (178) (5.6)%
10% decrease in lapse/discontinuance rates 215 5.4% 185 5.8%
10% increase in mortality/morbidity rates (359) (9.1)% (335) (10.4)%
10% decrease in mortality/morbidity rates 351 8.9% 320 10.0%
10% decrease in maintenance expenses 96 2.4% 79 2.5%
Expense inflation set to 0% 60 1.5% 52 1.6%
ANNUAL REPORT 2018 |
OV
ER
VIE
WF
INA
NC
IAL
AN
D O
PE
RA
TIN
G R
EV
IEW
CO
RP
OR
AT
E G
OV
ER
NA
NC
EF
INA
NC
IAL
STA
TE
ME
NT
SA
DD
ITIO
NA
L IN
FO
RM
AT
ION
SUPPLEMENTARY EMBEDDED VALUE INFORMATION

284
4. METHODOLOGY4.1 Entities Included in This ReportThe Group operates through a number of subsidiaries and branches. Its two main operating subsidiaries are AIA Co., a
company incorporated in Hong Kong and a subsidiary of the Company, and AIA International, a company incorporated in
Bermuda and an indirect subsidiary of the Company. Furthermore, AIA Co. has branches located in Brunei, China and
Thailand and AIA International has branches located in Hong Kong, Macau, New Zealand and Taiwan.
The following is a list of the entities and their mapping to Business Units included in this report.
• AIA Australia refers to AIA Australia Limited, a subsidiary of AIA Co., Sovereign Assurance Company Limited, a subsidiary
of AIA International, and the New Zealand branch of AIA International;
• AIA Cambodia refers to AIA (Cambodia) Life Insurance Plc., a subsidiary of AIA International;
• AIA China refers to the China branches of AIA Co.;
• AIA Hong Kong refers to the total of the following three entities:
– the Hong Kong and Macau branches of AIA International;
– the Hong Kong and Macau business written by AIA Co.; and
– AIA Pension and Trustee Co. Ltd., a subsidiary of AIA Co.
• AIA Indonesia refers to PT. AIA Financial, a subsidiary of AIA International;
• AIA Korea refers to AIA Life Insurance Co. Ltd., a subsidiary of AIA International;
• AIA Malaysia refers to AIA Bhd., a subsidiary of AIA Co. and AIA PUBLIC Takaful Bhd., a 70 per cent owned subsidiary
of AIA Co.;
• AIA Philippines refers to The Philippine American Life and General Insurance (PHILAM LIFE) Company, a subsidiary of
AIA Co. and its 51 per cent owned subsidiary BPI-Philam Life Assurance Corporation;
• AIA Singapore refers to AIA Singapore Private Limited, a subsidiary of AIA Co., and the Brunei branch of AIA Co.;
• AIA Sri Lanka refers to AIA Insurance Lanka PLC, a 97.16 per cent owned subsidiary of AIA Co.;
• AIA Taiwan refers to the Taiwan branch of AIA International;
• AIA Thailand refers to the Thailand branches of AIA Co.; and
• AIA Vietnam refers to AIA (Vietnam) Life Insurance Company Limited, a subsidiary of AIA International.
In addition, the financial results from the entity Tata AIA Life Insurance Company Limited (Tata AIA), which is 49 per cent
owned by AIA International, are accounted for using the equity method and have been included in the Group ANW presented
in this report. For clarity, the Group’s ANP and VONB exclude any contribution from Tata AIA.
Results are presented consistently with the segment information in the IFRS consolidated financial statements. The
summary of the EV of the Group by Business Unit in this report also includes the results for the “Group Corporate Centre”
segment. The results shown for this segment consist of the ANW for the Group’s corporate functions and the present value
of remittance taxes payable on distributable profits. The ANW has been derived from the IFRS equity for this segment plus
mark-to-market adjustments less the value of excluded intangible assets. For the VONB, “Other Markets” includes the
present value of allowance for remittance taxes payable on distributable profits.
| AIA GROUP LIMITED
FINANCIAL STATEMENTS

285
4. METHODOLOGY (continued)
4.2 Embedded Value and Value of New BusinessThe Group uses a traditional deterministic discounted cash flow methodology for determining its EV and VONB. This
methodology makes an implicit overall level of allowance for risk including the cost of investment return guarantees and
policyholder options, asset-liability mismatch risk, credit risk, the risk that actual experience in future years differs from
that assumed, and the economic cost of capital, through the use of a risk discount rate. Typically, the higher the risk
discount rate, the greater the allowance for these factors. This is a common methodology used by life insurance companies
in Asia currently. Alternative valuation methodologies and approaches continue to emerge and may be considered by AIA.
The business included in the VIF and VONB calculations includes all life business written by the Business Units of the
Group, plus other lines of business which may not be classified as life business but have similar characteristics. These
include accident and health, group and pension businesses. The projected in-force business included in the VIF also
incorporates expected renewals on short-term business with a term of one year or less.
The EV is the sum of the ANW and VIF. The ANW is the market value of assets in excess of the assets backing the policy
reserves and other liabilities of the life (and similar) business of the Group, plus the IFRS equity value of other activities,
such as general insurance business, less the value of intangible assets. It excludes any amounts not attributable to
shareholders of the Company. The market value of investment property and property held for own use that is used to
determine the ANW is based on the fair value disclosed in the Group’s IFRS consolidated financial statements as at the
valuation date. It is the Group’s policy to obtain external property valuations annually except in the case of a discrete event
occurring in the interim that has a significant impact on the fair value of the properties.
The VIF is the present value of projected after-tax statutory profits emerging in the future from the current in-force business
less the cost arising from holding the required capital (CoC) to support the in-force business. CoC is calculated as the face
value of the required capital as at the valuation date less the present value of the net-of-tax investment return on the
shareholder assets backing required capital and the present value of projected releases from the assets backing the
required capital. Where the required capital may be covered by policyholder assets such as surplus assets in a participating
fund, there is no associated cost of capital included in the VIF or VONB.
EV Equity is the total of EV, goodwill and other intangible assets attributable to shareholders of the Company.
The VONB is the present value, measured at the point of sale, of projected after-tax statutory profits emerging in the future
from new business sold in the period less the cost of holding required capital in excess of regulatory reserves to support
this business. The VONB for the Group is calculated based on assumptions applicable at the point of measurement and
before deducting the amount attributable to non-controlling interests. The VONB attributable to non-controlling interests
was US$27 million for the year ended 31 December 2018 (2017: US$22 million).
A deduction has been made from the EV and VONB for the present value of future after-tax unallocated Group Office
expenses, representing the expenses incurred by the Group Office which are not allocated to the Business Units. These
unallocated Group Office expenses have been allocated to acquisition and maintenance activities, and a deduction made
from the VONB and VIF respectively.
ANNUAL REPORT 2018 |
OV
ER
VIE
WF
INA
NC
IAL
AN
D O
PE
RA
TIN
G R
EV
IEW
CO
RP
OR
AT
E G
OV
ER
NA
NC
EF
INA
NC
IAL
STA
TE
ME
NT
SA
DD
ITIO
NA
L IN
FO
RM
AT
ION
SUPPLEMENTARY EMBEDDED VALUE INFORMATION

286
4. METHODOLOGY (continued)
4.3 Definition of New BusinessNew business includes the sale of new contracts during the period, additional single premium payments on recurrent
single premium contracts and increments to existing contracts where these are not variations allowed for in the calculation
of the VIF. The VONB also includes the present value of cash flows associated with new policies written during the reporting
period but subsequently terminated before the valuation date.
For group renewable business including group yearly renewable term business, new business is composed of new schemes
set up during the period plus any premium payable on existing schemes that exceeds the prior year’s premiums. For
individually significant group cases, the VONB is calculated over each premium rate guarantee period entered upon
contract inception or renewal.
For short-term accident and health business with a term of one year or less, renewals of existing contracts are not
considered new business, and the value of expected renewals on this business is included in the VIF.
For pension business, sales of new contracts during the period and any new contributions, including assets transferred in,
are considered as new business for the calculation of the VONB.
New business volumes shown in this report are measured using annualised new premiums (ANP), which is an internal
measure of new business sales.
4.4 Consolidation of Branches and Subsidiaries of AIA Co. and AIA InternationalThe Group’s subsidiaries, AIA Co. and AIA International, are both Hong Kong-regulated entities. AIA operates in a number
of territories as branches and subsidiaries of these entities. In addition, AIA International, which is incorporated in Bermuda,
is subject to the BMA reserving and capital requirements. These regulatory and other consolidated reserving and capital
requirements apply in addition to the relevant local requirements applicable to our Business Units.
The EV and VONB results for the Group shown in Section 2 of this report have been adjusted to reflect the consolidated
reserving and capital requirements. This approach was taken to reflect the distribution of profits from AIA Co. and AIA
International after allowing for the Hong Kong, BMA, local regulatory and other reserving and capital requirements as
applied by the Group. The EV and VONB for each Business Unit reflect the local reserving and capital requirements, as
discussed in Section 4.6 of this report, before a Group-level adjustment to reflect the consolidated reserving and capital
requirements.
4.5 Valuation of Future Statutory LossesFor certain lines of business, projected future statutory profits are negative due to the local statutory reserves being
insufficient to meet the value of future policyholder cash flows. Within a traditional embedded value framework, there are
a number of acceptable methods for determining the value of a combination of positive and negative statutory profits for
different lines of business.
For the purposes of this valuation, future projected statutory losses have been valued by discounting them at the risk
discount rate for the relevant Business Unit, with any negative VIF eliminated for each reported segment by reducing the
ANW and EV. This has been done because the allowance for risk in the range of selected risk discount rates for each
Business Unit has been set taking into account the presence of any such business lines with projected statutory losses.
Also, the consolidated reserving and capital requirements have the effect of reducing the level of any future projected
statutory losses. Based on the assumptions described in Section 5 of this report, and allowing for the consolidated statutory
reserving and capital requirements, the overall projected annual distributable profits from the current in-force business
and the assets backing the required capital of the Group are positive over the remaining lifetime of the business. Therefore,
it is not considered necessary to change the discounting approach described above.
| AIA GROUP LIMITED
FINANCIAL STATEMENTS

287
4. METHODOLOGY (continued)
4.6 Required CapitalEach of the Business Units has a regulatory requirement to hold shareholder capital in addition to the assets backing the
insurance liabilities. The Group’s assumed levels of local required capital for each Business Unit are set out in the table
below:
Business Unit Required Capital
AIA Australia
Australia 100% of regulatory capital adequacy requirement
New Zealand 100% of regulatory capital adequacy requirement
AIA China 100% of required capital as specified under the CAA EV assessment guidance
AIA Hong Kong 150% of required minimum solvency margin
AIA Indonesia 120% of regulatory Risk-Based Capital requirement
AIA Korea 150% of regulatory Risk-Based Capital requirement
AIA Malaysia 170% of regulatory Risk-Based Capital requirement
AIA Philippines 100% of regulatory Risk-Based Capital requirement
AIA Singapore 180% of regulatory Risk-Based Capital requirement
AIA Sri Lanka 120% of regulatory Risk-Based Capital requirement
AIA Taiwan 250% of regulatory Risk-Based Capital requirement
AIA Thailand 140% of regulatory Risk-Based Capital requirement
AIA Vietnam 100% of required minimum solvency margin
Capital Requirements on Consolidation
The Group has an undertaking to the Hong Kong Insurance Authority (HKIA) to maintain required capital not less than the
aggregate of 150% of the Hong Kong statutory minimum solvency margin requirement in respect of AIA Hong Kong and
no less than 100% of the Hong Kong statutory minimum solvency margin requirement for branches other than Hong Kong.
AIA International and its subsidiaries hold required capital of no less than 120% of the BMA regulatory capital requirements.
On 16 May 2017, the HKIA and the China Banking and Insurance Regulatory Commission (formerly the China Insurance
Regulatory Commission) signed the Equivalence Assessment Framework Agreement on the Solvency Regulatory Regime.
As a transitional arrangement, AIA reports under the Hong Kong Insurance Ordinance the capital position of its China
branches based on the China local regulatory solvency basis progressively over a 4-year phase-in period to full
implementation on 31 March 2022.
In addition to the above, the reserving and capital requirements for the purpose of consolidation allow for the local
regulatory requirements outlined above and other reserving and capital requirements as determined by the Group.
4.7 Foreign ExchangeThe EV as at 31 December 2018 and 31 December 2017 have been translated into US dollars using exchange rates as at
each valuation date. The VONB results shown in this report have been translated into US dollars using the corresponding
average exchange rates for each quarter. The other components of the EV profit shown in the analysis of movement in EV
have been translated using average exchange rates for the period.
Change on AER is calculated based on the translated figures as described above. Change on constant exchange rates
(CER) is calculated for all figures for the current year and for the prior year, using constant average exchange rates, other
than for EV as at the end of the current year and as at the end of the prior year, which is translated using the CER.
ANNUAL REPORT 2018 |
OV
ER
VIE
WF
INA
NC
IAL
AN
D O
PE
RA
TIN
G R
EV
IEW
CO
RP
OR
AT
E G
OV
ER
NA
NC
EF
INA
NC
IAL
STA
TE
ME
NT
SA
DD
ITIO
NA
L IN
FO
RM
AT
ION
SUPPLEMENTARY EMBEDDED VALUE INFORMATION

288
5. ASSUMPTIONS5.1 IntroductionThis section summarises the assumptions used by the Group to determine the EV as at 31 December 2018 and the VONB for the year ended 31 December 2018 and highlights certain differences in assumptions between the EV as at 31 December 2017 and the EV as at 31 December 2018.
5.2 Economic AssumptionsInvestment returnsThe Group has set the assumed long-term future returns for fixed income assets to reflect its view of expected returns having regard to estimates of long-term forward rates from yields available on government bonds and current bond yields. In determining returns on fixed income assets the Group allows for the risk of default, and this allowance varies by the credit rating of the underlying asset.
Where long-term views of investment return assumptions differ from current market yields on existing fixed income assets such that there would be a significant impact on value, an adjustment was made to make allowance for the current market yields. In these cases, in calculating the VIF, adjustments have been made to the investment return assumptions such that the investment returns on existing fixed income assets were set consistently with the current market yield on these assets for their full remaining term, to be consistent with the valuation of the assets backing the policy liabilities.
The Group has set the equity return and property return assumptions by reference to the return on 10-year government bonds, allowing for an internal assessment of risk premia that vary by asset class and by territory.
For each Business Unit, the non-linked portfolio is divided into a number of distinct product groups, and the returns for each of these product groups have been derived by considering current and future targeted asset allocations and associated investment returns for major asset classes.
For unit-linked business, fund growth assumptions have been determined based on actual asset mix within the funds at the valuation date and expected long-term returns for major asset classes.
Risk discount ratesThe risk discount rates can be considered as the sum of the appropriate risk-free interest rate, to reflect the time value of money, and a risk margin to make an implicit overall level of allowance for risk.
The table below summarises the current market 10-year government bond yields referenced in EV calculations.
Current market 10-year government bond yields referenced in EV
calculations (%)
Business Unit
As at31 December
2018
As at31 December
2017
AIA Australia
Australia 2.32 2.63
New Zealand 2.37 2.72
AIA China 3.31 3.88
AIA Hong Kong(1) 2.68 2.42
AIA Indonesia 8.03 6.32
AIA Korea 1.96 2.47
AIA Malaysia 4.08 3.91
AIA Philippines 7.07 5.70
AIA Singapore 2.04 2.00
AIA Sri Lanka 11.87 11.17
AIA Taiwan 0.86 0.95
AIA Thailand 2.51 2.54
AIA Vietnam 5.10 5.15
Note:
(1) The majority of AIA Hong Kong’s assets and liabilities are denominated in US dollars. The 10-year government bond yields shown above are those of US dollar-denominated bonds.
| AIA GROUP LIMITED
FINANCIAL STATEMENTS

289
5. ASSUMPTIONS (continued)
5.2 Economic Assumptions (continued)
Risk discount rates (continued)
The table below summarises the risk discount rates and long-term investment returns assumed in EV calculations. The
same risk discount rates were used for all the EV results shown in Section 1 and Section 2 of this report. The present value
of unallocated Group Office expenses was calculated using the AIA Hong Kong risk discount rate. The investment returns
on existing fixed income assets were set consistently with the market yields on these assets. Note that the VONB results
were calculated based on start-of-quarter economic assumptions consistent with the measurement at the point of sale.
The investment returns shown are gross of tax and investment expenses.
Risk discount rates assumed in EV
calculations (%)
Long-term investment returns assumed inEV calculations (%)
10-year government bonds Local equities
Business Unit
As at31 Dec
2018
As at31 Dec
2017
As at31 Dec
2018
As at31 Dec
2017
As at31 Dec
2018
As at31 Dec
2017
AIA Australia
Australia 7.35 7.35 3.00 3.00 7.50 7.50
New Zealand 7.75 7.75 3.50 3.50 8.00 n/a(2)
AIA China 9.75 9.75 3.70 3.70 9.30 9.30
AIA Hong Kong(1) 7.50 7.30 3.00 2.80 7.80 7.60
AIA Indonesia 13.00 13.00 7.50 7.50 12.00 12.00
AIA Korea 8.60 8.60 2.70 2.70 7.20 7.20
AIA Malaysia 8.75 8.75 4.20 4.20 8.80 8.80
AIA Philippines 11.80 11.30 5.30 4.80 10.50 10.00
AIA Singapore 7.10 6.90 2.70 2.50 7.20 7.00
AIA Sri Lanka 15.70 15.70 10.00 10.00 12.00 12.00
AIA Taiwan 7.85 7.85 1.60 1.60 6.60 6.60
AIA Thailand 8.60 8.60 3.20 3.20 9.00 9.00
AIA Vietnam 11.80 12.30 6.00 6.50 11.30 11.80
Notes:
(1) The majority of AIA Hong Kong’s assets and liabilities are denominated in US dollars. The 10-year government bond assumptions shown above are those of US dollar-denominated bonds.
(2) The assumed asset allocations did not include equities.
5.3 PersistencyPersistency covers the assumptions required, where relevant, for policy lapse (including surrender), premium persistency,
premium holidays, partial withdrawals and retirement rates for pension products.
Assumptions have been developed by each of the Business Units based on their recent historical experience, and their best
estimate expectations of current and expected future experience. Persistency assumptions vary by policy year and product
type with different rates for regular and single premium products.
Where experience for a particular product was not credible enough to allow any meaningful analysis to be performed,
experience for similar products was used as a basis for future persistency experience assumptions.
In the case of surrenders, the valuation assumes that current surrender value bases will continue to apply in the future.
ANNUAL REPORT 2018 |
OV
ER
VIE
WF
INA
NC
IAL
AN
D O
PE
RA
TIN
G R
EV
IEW
CO
RP
OR
AT
E G
OV
ER
NA
NC
EF
INA
NC
IAL
STA
TE
ME
NT
SA
DD
ITIO
NA
L IN
FO
RM
AT
ION
SUPPLEMENTARY EMBEDDED VALUE INFORMATION

290
5. ASSUMPTIONS (continued)
5.4 ExpensesThe expense assumptions have been set based on the most recent expense analysis. The purpose of the expense analysis
is to allocate total expenses between acquisition and maintenance activities, and then to allocate these acquisition and
maintenance expenses to various product categories to derive unit cost assumptions.
Where the expenses associated with certain activities have been identified as being one-off, these expenses have been
excluded from the expense analysis.
Expense assumptions have been determined for acquisition and maintenance activities, split by product type, and unit
costs expressed as a percentage of premiums, sum assured and an amount per policy. Where relevant, expense assumptions
have been calculated per distribution channel.
Expense assumptions do not make allowance for any anticipated future expense savings as a result of any strategic
initiatives aimed at improving policy administration and claims handling efficiency.
Assumptions for commission rates and other sales-related payments have been set in line with actual experience.
Group Office expenses
Group Office expense assumptions have been set, after excluding non-operating expenses, based on actual acquisition
and maintenance expenses in the year ended 31 December 2018. The Group Office acquisition expenses have been
deducted from the VONB. The present value of the projected future Group Office maintenance expenses has been deducted
from the Group EV. The maintenance expense assumptions in the VONB also allow for the allocation of Group Office
expenses.
5.5 Expense InflationThe expected long-term expense inflation rates used by Business Unit are set out below:
Expense inflation assumptions by Business Unit (%)
Business Unit
As at31 December
2018
As at31 December
2017
AIA Australia
Australia 2.75 3.00
New Zealand 2.00 2.50
AIA China 2.00 2.00
AIA Hong Kong 2.00 2.00
AIA Indonesia 6.00 6.00
AIA Korea 3.50 3.50
AIA Malaysia 3.00 3.00
AIA Philippines 3.50 3.50
AIA Singapore 2.00 2.00
AIA Sri Lanka 6.50 6.50
AIA Taiwan 1.20 1.20
AIA Thailand 2.00 2.00
AIA Vietnam 5.00 5.00
Unallocated Group Office expenses are assumed to inflate by the weighted average of the Business Unit expense inflation
rates.
| AIA GROUP LIMITED
FINANCIAL STATEMENTS

291
5. ASSUMPTIONS (continued)
5.6 MortalityAssumptions have been developed by each Business Unit based on their recent historical experience, and their expectations
of current and expected future experience. Where historical experience is not credible, reference has been made to pricing
assumptions supplemented by market data, where available.
Mortality assumptions have been expressed as a percentage of either standard industry experience tables or, where
experience is sufficiently credible, as a percentage of tables that have been developed internally by the Group.
For products that are exposed to longevity risk, an allowance has been made for expected improvements in mortality;
otherwise no allowance has been made for mortality improvements.
5.7 MorbidityAssumptions have been developed by each Business Unit based on their recent historical experience, and their expectations
of current and expected future experience. Morbidity rate assumptions have been expressed as a percentage of standard
industry experience tables or as expected claims ratios.
5.8 ReinsuranceReinsurance assumptions have been developed by each Business Unit based on the reinsurance arrangements in force as
at the valuation date and the recent historical and expected future experience.
5.9 Policyholder Dividends, Profit Sharing and Interest CreditingThe projected policyholder dividends, profit sharing and interest crediting assumptions set by each Business Unit that
have been used in calculating the EV results presented in this report, reflect contractual and regulatory requirements,
policyholders’ reasonable expectations (where clearly defined) and each Business Unit’s best estimate of future policies,
strategies and operations consistent with the investment return assumptions used in the EV results.
Participating fund surpluses have been assumed to be distributed between policyholders and shareholders via future final
bonuses or at the end of the projection period so that there are no residual assets at the end of the projection period.
ANNUAL REPORT 2018 |
OV
ER
VIE
WF
INA
NC
IAL
AN
D O
PE
RA
TIN
G R
EV
IEW
CO
RP
OR
AT
E G
OV
ER
NA
NC
EF
INA
NC
IAL
STA
TE
ME
NT
SA
DD
ITIO
NA
L IN
FO
RM
AT
ION
SUPPLEMENTARY EMBEDDED VALUE INFORMATION

292
5. ASSUMPTIONS (continued)
5.10 TaxationThe projections of distributable earnings underlying the values presented in this report are net of corporate income tax,
based on current taxation legislation and corporate income tax rates. The projected amount of tax payable in any year
allows, where relevant, for the benefits arising from any tax loss carried forward.
The local corporate income tax rates used by each Business Unit are set out below:
Local corporate income tax rates by Business Unit (%)
Business Unit
As at31 December
2018
As at31 December
2017
AIA Australia
Australia 30.0 30.0
New Zealand 28.0 28.0
AIA China 25.0 25.0
AIA Hong Kong 16.5 16.5
AIA Indonesia 25.0 25.0
AIA Korea 27.5(1) 24.2
AIA Malaysia 24.0 24.0
AIA Philippines 30.0 30.0
AIA Singapore 17.0 17.0
AIA Sri Lanka 28.0 28.0
AIA Taiwan 20.0 17.0
AIA Thailand 20.0 20.0
AIA Vietnam 20.0 20.0
Note:(1) From fiscal years 2018 to 2020, AIA Korea is subject to an assumed corporate income tax of 27.5%, which includes an Accumulated Earnings Tax
following the subsidiarisation of the branch in AIA Korea. Based on current regulations, the corporate income tax rate will revert to 24.2% from fiscal year 2021.
The tax assumptions used in the valuation reflect the local corporate income tax rates set out above. Where applicable, tax
payable on investment income has been reflected in projected investment returns.
The EV of the Group as at 31 December 2018 is calculated after deducting any remittance taxes payable on the anticipated
distribution of both the ANW and VIF.
| AIA GROUP LIMITED
FINANCIAL STATEMENTS

293
5. ASSUMPTIONS (continued)
5.11 Statutory Valuation BasesThe projection of regulatory liabilities at future points in time assumes the continuation of the reserving methodologies
used to value policyholder liabilities as at the valuation date.
5.12 Product ChargesManagement fees and product charges reflected in the VIF and VONB have been assumed to follow existing scales.
6. EVENTS AFTER THE REPORTING PERIODIn September 2017, the Group reached an agreement to acquire Commonwealth Bank of Australia’s (CBA) life insurance
business in Australia, including a 20-year strategic bancassurance partnership with CBA in Australia. The acquisition
remains in progress, subject to securing all necessary regulatory and governmental approvals. The transaction aims to
expand the Group’s distribution capabilities and customer reach in Australia. The total gross consideration to be paid with
respect to the proposed transaction is expected to be approximately US$2.0 billion payable in cash on completion of the
proposed transaction and subject to certain adjustments at completion. After taking into account the expected proceeds
from reinsurance agreement and the expected free surplus of the acquired business, the final net cash outlay by AIA is
expected to be approximately US$1.0 billion.
On 16 January 2019, the Group issued Hong Kong dollar-denominated fixed rate medium-term notes that are unlisted. The
offering comprised of HK$1,300 million of 3.5-year notes at an annual rate of 2.95 per cent and HK$1,100 million of 12-
year notes at an annual rate of 3.68 per cent. In aggregate the US dollar-equivalent is approximately US$307 million.
On 15 March 2019, a Committee appointed by the Board of Directors proposed a final dividend of 84.80 Hong Kong cents
per share (twelve months ended 30 November 2017: 74.38 Hong Kong cents per share), and a special dividend of 9.50
Hong Kong cents per share (twelve months ended 30 November 2017: nil) for the additional month in the accounting
period due to the change of the Group’s financial year-end date from 30 November 2018 to 31 December 2018.
ANNUAL REPORT 2018 |
OV
ER
VIE
WF
INA
NC
IAL
AN
D O
PE
RA
TIN
G R
EV
IEW
CO
RP
OR
AT
E G
OV
ER
NA
NC
EF
INA
NC
IAL
STA
TE
ME
NT
SA
DD
ITIO
NA
L IN
FO
RM
AT
ION
SUPPLEMENTARY EMBEDDED VALUE INFORMATION

294
CONDENSED BUSINESS AND FINANCIAL REVIEW FOR THE THIRTEEN MONTHS ENDED 31 DECEMBER 2018
The Company has changed its financial year-end to 31 December with the first set of consolidated financial statements
adopting the new year-end date for the thirteen months ended 31 December 2018. To facilitate a meaningful comparison
of our performance in 2018 and 2017, we are also reporting supplementary financial information on a calendar year
basis covering the twelve months ended 31 December 2018 for the current period and the twelve months ended 31
December 2017 for the prior period, and these are set out in note 47 to the financial statements. The financial information
in the Financial and Operating Review as set out on page 18 to page 35 has been prepared on a like-for-like basis, that
also covers the twelve months period from 1 January 2018 to 31 December 2018 for the current period and the twelve
months period from 1 January 2017 to 31 December 2017 for the prior period.
This set of management discussion and analysis covers the financial results for the thirteen months period from 1
December 2017 to 31 December 2018 for the current period and for the twelve months period from 1 December 2016 to
30 November 2017 for the prior period. When reporting the Group’s consolidated figures, there is currency translation
effect as we report in US dollars. We have provided growth rates and commentaries on our key operating performance on
a CER basis unless otherwise stated, as this provides a clearer picture of the performance of the underlying businesses.
BUSINESS REVIEW FOR THE THIRTEEN MONTHS ENDED 31 DECEMBER 2018
US$ millions, unless otherwise stated
Thirteen months ended 31 December
2018
Twelve months ended 30 November
2017YoY
CERYoY
AER
VONB 4,067 3,512 14% 16%
VONB margin 59.3% 56.8% 2.2pps 2.5pps
ANP 6,770 6,092 10% 11%
Operating profit after tax 5,684 4,647 20% 22%
VONB increased by 14 per cent to US$4,067 million with all our reportable market segments delivering positive VONB
growth. Agency distribution remains our main source of new business and accounted for 71 per cent of the Group’s total
VONB for the thirteen months ended 31 December 2018. The focused execution of our Premier Agency strategy has
continued to drive VONB growth of 16 per cent from the agency channel. VONB from partnership distribution delivered
solid growth of 8 per cent, building on the exceptionally strong performance from Hong Kong’s retail IFA channel for the
six months ended 31 May 2017 as previously highlighted.
ANP grew by 10 per cent to US$6,770 million and VONB margin was up by 2.2 pps to 59.3 per cent.
OPAT grew by 20 per cent for the thirteen months ended 31 December 2018, primarily due to the additional one-month
of profit relative to the result for the twelve months ended 30 November 2017, the new business growth over time and
the proactive management of our in-force portfolio.
| AIA GROUP LIMITED
ADDITIONAL INFORMATION

295
NEW BUSINESS PERFORMANCE
VONB, ANP and Margin by Segment
Thirteen months ended 31 December 2018
Twelve months ended 30 November 2017 VONB Change
US$ millions, unless otherwise stated VONBVONB
Margin ANP VONBVONB
Margin ANPYoY
CERYoY
AER
Hong Kong 1,763 61.5% 2,793 1,559 53.2% 2,849 13% 13%
Thailand 472 72.8% 648 381 73.6% 518 18% 24%
Singapore 360 64.1% 562 311 71.8% 433 13% 16%
Malaysia 256 63.6% 396 220 62.5% 348 8% 16%
China 988 90.0% 1,098 828 85.5% 968 16% 19%
Other Markets 450 35.1% 1,273 408 41.2% 976 13% 10%
Subtotal 4,289 62.6% 6,770 3,707 60.0% 6,092 14% 16%
Adjustment to reflect consolidated reserving and capital requirements (59) n/m n/m (65) n/m n/m n/m n/m
After-tax value of unallocated Group Office expenses (163) n/m n/m (130) n/m n/m n/m n/m
Total 4,067 59.3% 6,770 3,512 56.8% 6,092 14% 16%
VONB grew by 14 per cent to US$4,067 million for the thirteen months ended 31 December 2018, building on a strong
performance of 28 per cent growth in VONB for the twelve months ended 30 November 2017.
ANP was higher by 10 per cent to US$6,770 million. VONB margin increased by 2.2 pps to 59.3 per cent and PVNBP
margin remained stable at 10 per cent compared with the twelve months ended 30 November 2017.
Agency distribution remains our main source of new business and accounted for 71 per cent of the Group’s total VONB
for the thirteen months ended 31 December 2018. The focused execution of our Premier Agency strategy has continued
to drive strong VONB growth of 16 per cent from the agency channel. This was delivered through strong ANP growth
of 10 per cent to US$4,341 million and a higher VONB margin of 69.7 per cent. VONB from partnership distribution
delivered solid growth of 8 per cent, building on the exceptionally strong performance from Hong Kong’s retail IFA
channel for the six months ended 31 May 2017.
Hong Kong delivered VONB growth of 13 per cent to US$1,763 million for the thirteen months ended 31 December
2018 with strong performance across both domestic and Mainland Chinese visitor customer segments. VONB margin
increased by 8.3 pps to 61.5 per cent as our product mix continued to shift towards higher-margin long-term savings
and protection products.
AIA’s wholly-owned operation in China delivered VONB growth of 16 per cent to US$988 million for the thirteen months
ended 31 December 2018. This strong performance reflects the disciplined execution of our Premier Agency strategy,
focusing on quality recruitment together with continuing productivity enhancements.
Thailand reported VONB growth of 18 per cent to US$472 million for the thirteen months ended 31 December 2018.
Sales momentum continued as we continued to transform the agency through our Financial Adviser programme.
ANNUAL REPORT 2018 |
OV
ER
VIE
WF
INA
NC
IAL
AN
D O
PE
RA
TIN
G R
EV
IEW
CO
RP
OR
AT
E G
OV
ER
NA
NC
EF
INA
NC
IAL
STA
TE
ME
NT
SA
DD
ITIO
NA
L IN
FO
RM
AT
ION
CONDENSED BUSINESS AND FINANCIAL REVIEW FOR THE THIRTEEN MONTHS ENDED 31 DECEMBER 2018

296
Singapore delivered VONB growth of 13 per cent for the thirteen months ended 31 December 2018, mainly driven by
our core agency channel and strategic partnership with Citibank. VONB margin was lower at 64.1 per cent as a result
of lower profitability from our HealthShield business as previously highlighted and higher volumes of single premium
unit-linked business ahead of a regulatory change in October 2018.
Despite reduced consumer activity and changes to tax regulations during the period, Malaysia reported VONB growth of
8 per cent to US$256 million for the thirteen months ended 31 December 2018.
Other Markets reported VONB growth of 13 per cent to US$450 million for the thirteen months ended 31 December
2018. Highlights included strong growth from Australia (including New Zealand), Korea, the Philippines and Taiwan.
The VONB results for the Group are reported after a deduction of US$222 million for the consolidated reserving and
capital requirements over and above local statutory requirements and for the present value of unallocated Group Office
expenses.
IFRS FINANCIAL REVIEW FOR THE THIRTEEN MONTHS ENDED 31 DECEMBER 2018
OPAT(1) by Segment
US$ millions, unless otherwise stated
Thirteen months ended 31 December
2018
Twelve months ended 30 November
2017YoY
CERYoY
AER
Hong Kong 1,958 1,636 20% 20%
Thailand 1,061 865 16% 23%
Singapore 599 504 16% 19%
Malaysia 345 272 18% 27%
China 939 639 42% 47%
Other Markets 871 758 17% 15%
Group Corporate Centre (89) (27) n/m n/m
Total 5,684 4,647 20% 22%
Note:(1) Attributable to shareholders of the Company only excluding non-controlling interests.
OPAT for the thirteen months ended 31 December 2018 was US$5,684 million, up by 20 per cent as compared with the
twelve months ended 30 November 2017, primarily due to the additional one-month of profit for December 2018, new
business growth over time and the proactive management of our in-force portfolio.
Hong Kong delivered strong result reflecting growth in our business and improved claims experience, partly offset by a
shift in product mix towards participating business, as previously highlighted in our Interim Report 2018.
China achieved excellent OPAT growth, primarily driven by the growing scale of our business and positive claims
experience.
OPAT in Thailand increased as a result of our business growth and improved persistency.
Singapore reported an increase in OPAT despite pressure on profitability from double-digit medical inflation in the
market. Malaysia also had strong OPAT in line with business growth.
| AIA GROUP LIMITED
ADDITIONAL INFORMATION

297
Other Markets delivered strong OPAT growth. Highlights included strong performances from Australia (including New
Zealand), the Philippines, Taiwan and Vietnam.
Operating ROE for the thirteen months ended 31 December 2018 was 15.7 per cent compared with 14.2 per cent for
the twelve months ended 30 November 2017, driven by OPAT growth partly offset by higher average shareholders’
allocated equity for the thirteen months ended 31 December 2018.
TWPI by Segment
US$ millions, unless otherwise stated
Thirteen months ended 31 December
2018
Twelve months ended 30 November
2017YoY
CERYoY
AER
Hong Kong 12,501 9,434 33% 33%
Thailand 4,232 3,517 14% 20%
Singapore 2,906 2,421 17% 20%
Malaysia 2,245 1,823 15% 23%
China 4,366 3,092 37% 41%
Other Markets 6,859 5,860 18% 17%
Total 33,109 26,147 25% 27%
TWPI increased to US$33,109 million for the thirteen months ended 31 December 2018 compared with the twelve
month period ended 30 November 2017 due to business growth.
IFRS Operating Profit Investment Return
US$ millions, unless otherwise stated
Thirteen months ended 31 December
2018
Twelve months ended 30 November
2017YoY
CERYoY
AER
Interest income 6,623 5,440 19% 22%
Expected long-term investment return for equities and real estate 2,105 1,656 25% 27%
Total 8,728 7,096 20% 23%
IFRS operating profit investment return increased to US$8,728 million for the thirteen months ended 31 December
2018 compared with US$7,096 million for the twelve months ended 30 November 2017. The growth was primarily
driven by the increased size of our investments portfolio.
Operating Expenses
US$ millions, unless otherwise stated
Thirteen months ended 31 December
2018
Twelve months ended 30 November
2017YoY
CERYoY
AER
Operating expenses 2,366 1,969 19% 20%
Operating expenses grew to US$2,366 million for the thirteen months ended 31 December 2018 mainly due to the
additional month compared to the twelve months ended 30 November 2017. The expense ratio for the thirteen months
ended 31 December 2018 was 7.1 per cent compared with 7.5 per cent for the twelve months ended 30 November 2017
as we continued to benefit from increasing scale.
ANNUAL REPORT 2018 |
OV
ER
VIE
WF
INA
NC
IAL
AN
D O
PE
RA
TIN
G R
EV
IEW
CO
RP
OR
AT
E G
OV
ER
NA
NC
EF
INA
NC
IAL
STA
TE
ME
NT
SA
DD
ITIO
NA
L IN
FO
RM
AT
ION
CONDENSED BUSINESS AND FINANCIAL REVIEW FOR THE THIRTEEN MONTHS ENDED 31 DECEMBER 2018

298
Net Profit(1)
US$ millions, unless otherwise stated
Thirteen months ended 31 December
2018
Twelve months ended 30 November
2017YoY
CERYoY
AER
OPAT 5,684 4,647 20% 22%
Short-term fluctuations in investment return related to equities and real estate, net of tax(2) (1,908) 1,741 n/m n/m
Reclassification of revaluation gain for property held for own use, net of tax(2)(3) (212) (84) n/m n/m
Corporate transaction related costs, net of tax(3) (148) (25) n/m n/m
Implementation costs of new accounting standards, net of tax(3) (43) (6) n/m n/m
Other non-operating investment return and other items, net of tax(3) (210) (153) n/m n/m
Total 3,163 6,120 (49)% (48)%
Notes:(1) Attributable to shareholders of the Company only excluding non-controlling interests.(2) Short-term fluctuations in investment return include the revaluation gain for property held for own use. This amount is then reclassified out of net profit to conform to
IFRS measurement and presentation.(3) The comparative information has been adjusted to conform to current period presentation.
IFRS NON-OPERATING MOVEMENTAIA’s IFRS net profit definition includes mark-to-market movements from our equity portfolio. IFRS net profit for the
thirteen months ended 31 December 2018 decreased by 49 per cent to US$3,163 million. The decrease was due to
negative short-term fluctuations from equities and real estate of US$1,908 million for the thirteen months ended 31
December 2018, particularly in respect of our other participating business with distinct portfolios compared with
positive movements of US$1,741 million for the twelve months ended 30 November 2017. Other non-operating items
for the thirteen months ended 31 December 2018 included corporate transaction related costs of US$148 million,
representing tax expenses in relation to the subsidiarisation of AIA Korea and costs associated with the acquisition of
Sovereign, and implementation costs of new accounting standards of US$43 million.
Movement in Shareholders’ Allocated Equity
US$ millions, unless otherwise stated
Thirteen months ended 31 December
2018
Twelve months ended 30 November
2017
Opening shareholders’ allocated equity 35,658 29,632
Net profit 3,163 6,120
Purchase of shares held by employee share-based trusts (12) (10)
Dividends (1,589) (1,376)
Revaluation gains on property held for own use 11 78
Foreign currency translation adjustments (550) 1,061
Other capital movements 114 153
Total movement in shareholders’ allocated equity 1,137 6,026
Closing shareholders’ allocated equity 36,795 35,658
Average shareholders’ allocated equity 36,227 32,645
| AIA GROUP LIMITED
ADDITIONAL INFORMATION

299
The movement in shareholders’ allocated equity is shown before fair value reserve movements. AIA believes this provides
a clearer reflection of the underlying movement in shareholders’ equity over the period, before the IFRS accounting
treatment of market value movements in available for sale bonds.
Average shareholders’ allocated equity increased by US$3,582 million to US$36,227 million for the thirteen months
ended 31 December 2018 compared with US$32,645 million for the twelve months ended 30 November 2017 as a
result of a higher opening position for 2018 arising from significant mark-to-market gains in our equity portfolio during
2017.
At 31 December 2018, shareholders’ allocated equity grew to US$36,795 million compared to US$35,658 million at
30 November 2017, after the payment of shareholder dividends of US$1,589 million, reflecting the depreciation of
local currencies against our US dollar reporting currency of US$550 million and net profit of US$3,163 million which
included negative mark-to-market movement from our equity portfolio.
IFRS EARNINGS PER SHARE (EPS)
Basic EPS based on IFRS OPAT attributable to shareholders was 47.29 US cents for the thirteen months ended 31
December 2018.
Basic EPS based on IFRS net profit attributable to shareholders, including mark-to-market movements from our equity
and investment property portfolios, was 26.31 US cents for the thirteen months ended 31 December 2018.
IFRS EPS – Basic
Net Profit(1) OPAT(1)
Thirteen months ended 31 December
2018
Twelve months ended 30 November
2017
Thirteen months ended 31 December
2018
Twelve months ended 30 November
2017
Profit (US$ millions) 3,163 6,120 5,684 4,647
Weighted average number of ordinary shares (millions) 12,020 12,000 12,020 12,000
Basic earnings per share (US cents) 26.31 51.00 47.29 38.73
IFRS EPS – Diluted
Net Profit(1) OPAT(1)
Thirteen months ended 31 December
2018
Twelve months ended 30 November
2017
Thirteen months ended 31 December
2018
Twelve months ended 30 November
2017
Profit (US$ millions) 3,163 6,120 5,684 4,647
Weighted average number of ordinary shares(2) (millions) 12,055 12,037 12,055 12,037
Diluted earnings per share(2) (US cents) 26.24 50.84 47.15 38.61
Notes:(1) Attributable to shareholders of the Company only excluding non-controlling interests.(2) Diluted earnings per share including the dilutive effects, if any, of the awards of share options, restricted share units, RSPUs and RSSUs granted to eligible directors,
officers, employees and agents under the share-based compensation plans as described in note 39 to the financial statements.
ANNUAL REPORT 2018 |
OV
ER
VIE
WF
INA
NC
IAL
AN
D O
PE
RA
TIN
G R
EV
IEW
CO
RP
OR
AT
E G
OV
ER
NA
NC
EF
INA
NC
IAL
STA
TE
ME
NT
SA
DD
ITIO
NA
L IN
FO
RM
AT
ION
CONDENSED BUSINESS AND FINANCIAL REVIEW FOR THE THIRTEEN MONTHS ENDED 31 DECEMBER 2018

300
IFRS BALANCE SHEET
Consolidated Statement of Financial Position
US$ millions, unless otherwise stated
As at31 December
2018
As at30 November
2017Change
AER
Assets
Financial investments 186,142 176,220 6%
Investment property 4,794 4,365 10%
Cash and cash equivalents 2,451 2,289 7%
Deferred acquisition and origination costs 24,626 21,847 13%
Other assets 11,793 10,970 8%
Total assets 229,806 215,691 7%
Liabilities
Insurance and investment contract liabilities 172,649 156,979 10%
Borrowings 4,954 3,958 25%
Other liabilities 12,797 12,382 3%
Less total liabilities 190,400 173,319 10%
Equity
Total equity 39,406 42,372 (7)%
Less non-controlling interests 400 378 6%
Total equity attributable to shareholders of AIA Group Limited 39,006 41,994 (7)%
Shareholders’ allocated equity 36,795 35,658 3%
Movement in Shareholders’ Equity
US$ millions, unless otherwise stated
Thirteen months ended31 December
2018
Twelve months ended30 November
2017
Opening shareholders’ equity 41,994 34,984
Net profit 3,163 6,120
Fair value (losses)/gains on assets (4,125) 984
Purchase of shares held by employee share-based trusts (12) (10)
Dividends (1,589) (1,376)
Revaluation gains on property held for own use 11 78
Foreign currency translation adjustments (550) 1,061
Other capital movements 114 153
Total movement in shareholders’ equity (2,988) 7,010
Closing shareholders’ equity 39,006 41,994
| AIA GROUP LIMITED
ADDITIONAL INFORMATION

301
Total Investments
US$ millions, unless otherwise stated
As at31 December
2018Percentage
of total
As at30 November
2017Percentage
of total
Total policyholder and shareholder 171,337 88% 160,327 87%
Total unit-linked contracts and consolidated investment funds 23,938 12% 24,231 13%
Total investments 195,275 100% 184,558 100%
The investment mix remained stable for the thirteen months ended 31 December 2018 as set out below:
Unit-Linked Contracts and Consolidated Investment Funds
US$ millions, unless otherwise stated
As at31 December
2018Percentage
of total
As at30 November
2017Percentage
of total
Unit-linked contracts and consolidated investment funds
Debt securities 4,765 20% 4,704 19%
Loans and deposits 81 – 107 1%
Equities 18,418 77% 18,953 78%
Cash and cash equivalents 672 3% 456 2%
Derivatives 2 – 11 –
Total unit-linked contracts and consolidated investment funds 23,938 100% 24,231 100%
ANNUAL REPORT 2018 |
OV
ER
VIE
WF
INA
NC
IAL
AN
D O
PE
RA
TIN
G R
EV
IEW
CO
RP
OR
AT
E G
OV
ER
NA
NC
EF
INA
NC
IAL
STA
TE
ME
NT
SA
DD
ITIO
NA
L IN
FO
RM
AT
ION
CONDENSED BUSINESS AND FINANCIAL REVIEW FOR THE THIRTEEN MONTHS ENDED 31 DECEMBER 2018

302
Policyholder and Shareholder Investments
US$ millions, unless otherwise stated
As at31 December
2018Percentage
of total
As at30 November
2017Percentage
of total
Participating funds and Other participating business with distinct portfolios(1)
Government and government agency bonds 14,121 8% 11,054 7%
Corporate bonds and structured securities 30,183 18% 28,188 18%
Loans and deposits 2,179 1% 2,282 1%
Subtotal – Fixed income investments 46,483 27% 41,524 26%
Equities 13,892 8% 11,884 7%
Investment property and property held for own use 888 1% 757 1%
Cash and cash equivalents 395 – 272 –
Derivatives 148 – 73 –
Subtotal Participating funds and Other participating business with distinct portfolios 61,806 36% 54,510 34%
Other policyholder and shareholder(1)
Government and government agency bonds 49,317 29% 44,978 28%
Corporate bonds and structured securities 41,835 24% 42,244 26%
Loans and deposits 5,132 3% 5,584 4%
Subtotal – Fixed income investments 96,284 56% 92,806 58%
Equities 5,789 3% 5,879 4%
Investment property and property held for own use 5,794 4% 5,292 3%
Cash and cash equivalents 1,384 1% 1,561 1%
Derivatives 280 – 279 –
Subtotal other policyholder and shareholder 109,531 64% 105,817 66%
Total policyholder and shareholder 171,337 100% 160,327 100%
Note:(1) Presentation of Participating funds and Other participating business with distinct portfolios and Other policyholder and shareholder is consistent with note 20 to the
financial statements. The comparative information has been adjusted to conform to current period presentation. Please refer to note 20 to the financial statements for additional information.
ASSETSParticipating business is written in a segregated statutory fund, with regulations governing the division of surplus
between policyholders and shareholders. “Other participating business with distinct portfolios” is supported by
segregated investment assets and explicit provisions for future surplus distribution though the division of surplus
between policyholders and shareholders is not defined in regulations. We have enhanced our investment disclosures
to reflect the nature and greater size of this business by grouping its assets together with participating business.
Comparative information is also shown for 30 November 2017.
Total assets increased by US$14,115 million to US$229,806 million at 31 December 2018, compared with US$215,691
million at 30 November 2017.
Total investments including financial investments, investment property, property held for own use, and cash and cash
equivalents increased by US$10,717 million to US$195,275 million at 31 December 2018, compared with US$184,558
million at 30 November 2017.
| AIA GROUP LIMITED
ADDITIONAL INFORMATION

303
Of the total US$195,275 million investments at 31 December 2018, US$171,337 million were held in respect of
policyholders and shareholders and the remaining US$23,938 million were backing unit-linked contracts and
consolidated investment funds.
Fixed income investments, including debt securities, loans and term deposits held in respect of policyholders and
shareholders, totalled US$142,767 million at 31 December 2018 compared with US$134,330 million at 30 November
2017. The average credit rating of the fixed income portfolio of A remained consistent with the position at 30 November
2017.
Government and government agency bonds represented 44 per cent of fixed income investments at 31 December 2018,
compared with 42 per cent at 30 November 2017. Corporate bonds and structured securities accounted for 50 per cent
of fixed income investments at 31 December 2018, compared with 52 per cent at 30 November 2017.
Equity securities held in respect of policyholders and shareholders totalled US$19,681 million at 31 December 2018,
compared with US$17,763 million at 30 November 2017. The US$1,918 million increase in carrying value was mainly
attributable to new purchases offset by negative mark-to-market movements. Within this figure, equity securities of
US$13,892 million were held in participating funds and other participating business with distinct portfolios.
Cash and cash equivalents increased by US$162 million to US$2,451 million at 31 December 2018 compared with
US$2,289 million at 30 November 2017. The increase largely reflected positive net cash inflows from our operating
business, net proceeds of the issuances of medium-term notes totalling US$1,490 million during the period, partly
offset by the redemption of medium-term notes of US$500 million upon maturity and the payment of shareholder
dividends of US$1,589 million.
Investment property and property held for own use in respect of policyholders and shareholders totalled US$6,682
million at 31 December 2018 compared with US$6,049 million at 30 November 2017.
Deferred acquisition and origination costs increased to US$24,626 million at 31 December 2018 compared with
US$21,847 million at 30 November 2017, largely reflecting new business growth.
Other assets increased to US$11,793 million at 31 December 2018 compared with US$10,970 million at 30 November
2017, reflecting an increase in reinsurance recoveries, accrued interest and prepayments.
LIABILITIESTotal liabilities increased to US$190,400 million at 31 December 2018 from US$173,319 million at 30 November 2017.
Insurance and investment contract liabilities grew to US$172,649 million at 31 December 2018 compared with
US$156,979 million at 30 November 2017, reflecting the underlying growth of the in-force portfolio offset by negative
mark-to-market movements on equities backing unit-linked and participating policies and negative foreign exchange
translation.
Borrowings increased to US$4,954 million at 31 December 2018, due to the net proceeds of the issuances of medium-
term notes totalling US$1,490 million during the period, partly offset by the redemption of medium-term notes of US$500
million upon maturity. Medium-term notes with a notional amount of US$500 million issued in 2014 will mature in March
2019 as disclosed in note 29 to the financial statements. Leverage ratio, which is defined as borrowings expressed as a
percentage of total borrowings and equity, was 11.2 per cent, compared with 8.5 per cent at 30 November 2017.
Other liabilities were US$12,797 million at 31 December 2018, compared with US$12,382 million at 30 November
2017, reflecting an increase in deferred tax liabilities and investment-related payables.
ANNUAL REPORT 2018 |
OV
ER
VIE
WF
INA
NC
IAL
AN
D O
PE
RA
TIN
G R
EV
IEW
CO
RP
OR
AT
E G
OV
ER
NA
NC
EF
INA
NC
IAL
STA
TE
ME
NT
SA
DD
ITIO
NA
L IN
FO
RM
AT
ION
CONDENSED BUSINESS AND FINANCIAL REVIEW FOR THE THIRTEEN MONTHS ENDED 31 DECEMBER 2018

304
INFORMATION FOR SHAREHOLDERS
ANALYSIS OF REGISTERED SHAREHOLDER ACCOUNTS
31 December 2018
Size of registered shareholding
Number of shareholder
accounts
% of total number of shareholder
accountsNumber of
shares% of total number
of shares
1,000 shares or below 15,959 79.49 6,083,233 0.05
1,001 – 5,000 shares 3,485 17.36 7,949,364 0.07
5,001 – 10,000 shares 396 1.97 3,045,370 0.03
10,001 – 100,000 shares 228 1.14 5,312,881 0.04
100,001 shares or above 8 0.04 12,054,672,933 99.81
20,076 100.00 12,077,063,781 100.00
FINANCIAL CALENDARAnnouncement of 2018 Annual Results for the thirteen-month period ended 31 December 2018 15 March 2019
Book Close Period for the AGM 14 May 2019 to 17 May 2019 (both days inclusive)
Date of the AGM 17 May 2019
Announcement of 2019 Interim Results 23 August 2019
ANNUAL GENERAL MEETINGThe AGM will be held at 11:00 a.m. (Hong Kong time) on Friday, 17 May 2019 at the Grand Ballroom, 2/F, New World
Millennium Hong Kong Hotel, 72 Mody Road, Tsim Sha Tsui East, Kowloon, Hong Kong. Details of the business to be
transacted at the AGM are set out in the circular to the shareholders of the Company to be sent together with this Annual
Report.
Details of voting results at the AGM can be found on the websites of both the Hong Kong Stock Exchange at www.hkex.com.hk
and the Company at www.aia.com on Friday, 17 May 2019 after the AGM.
DIVIDENDSThe Board has recommended an increase in the payment of a final dividend of 14 per cent to 84.80 Hong Kong cents per
share for the thirteen-month period ended 31 December 2018 (for the twelve-month period ended 30 November 2017:
74.38 Hong Kong cents per share), consistent with AIA’s established prudent, sustainable and progressive dividend policy.
The Board has also recommended the payment of a special dividend of 9.50 Hong Kong cents per share for the additional
month in the accounting period due to the change of the Company’s financial year-end date from 30 November 2018 to 31
December 2018. The dividends reflect the strength of our financial results and the Board’s continued confidence in the
future prospects of the Group.
Subject to shareholders’ approval at the AGM, the final dividend and the special dividend will be payable on Thursday,
6 June 2019 to shareholders whose names appear on the register of members of the Company at the close of business on
Wednesday, 22 May 2019, being the record date for determining the entitlements to the final dividend and the special
dividend.
Relevant Dates for the Final Dividend and the Special DividendEx-dividend date 21 May 2019
Record date 22 May 2019
Payment date 6 June 2019
| AIA GROUP LIMITED
ADDITIONAL INFORMATION

305
ANNUAL STATEMENT ISSUED PURSUANT TO THE OFFSHORE FUND TAX EXEMPTION REGIME IN SINGAPOREAn indirect wholly-owned subsidiary of the Company, AIA Investment Management Private Limited, was incorporated in
Singapore on 15 June 2016. Its businesses include the management of certain assets of the Company and its subsidiaries
and branches, and it is required by the Income Tax (Exemption of Income of Prescribed Persons Arising from Funds
Managed by Fund Manager in Singapore) Regulations 2010 to issue an annual statement to each shareholder of the
Company. To comply with the above legal requirement in Singapore, an annual statement containing the profit and market
capitalisation information of the Company is available on the Company’s website. You may visit the Company’s website by
clicking “Annual Statements issued pursuant to The Offshore Fund Tax Exemption Regime In Singapore” under the sub-
section headed “Shareholder Centre” in the section headed “Investor Relations” to view the annual statement.
SHARE REGISTRARIf you have any enquiries relating to your shareholding, please contact the Company’s share registrar with the contact
details set out below:
Computershare Hong Kong Investor Services Limited
17M Floor, Hopewell Centre, 183 Queen’s Road East, Wanchai, Hong Kong
Telephone: +852 2862 8555
Email: [email protected] (for general enquiries)
[email protected] (for printed copies of the Company’s corporate communications)
Website: www.computershare.com
ANNUAL REPORTThis Annual Report is printed in English and Chinese and is available on the website of the Company. If you would like to
have a printed version of this Annual Report, please contact the Company’s share registrar using the contact details given
above.
The Company makes every effort to ensure consistency between the Chinese and English versions of this Annual Report.
In the event of any inconsistency, however, the English version shall prevail.
For environmental and cost reasons, shareholders are encouraged to elect to receive corporate communications (as
defined in the Listing Rules) electronically. You may at any time send written notice to the Company c/o the Company’s
share registrar or via email at [email protected] specifying your name, address and request to change your
choice of language or means of receipt of all corporate communications.
INVESTMENT COMMUNITY AND NEWS MEDIAEnquiries may be directed to:
Investment Community News Media
Lance Burbidge +852 2832 1398 Stephen Thomas +852 2832 6178
Evelyn Lam +852 2832 1633 Mark Walters +852 2832 1978
Feon Lee +852 2832 4704 Emerald Ng +852 2832 4720
Rachel Poon +852 2832 4792
ANNUAL REPORT 2018 |
OV
ER
VIE
WF
INA
NC
IAL
AN
D O
PE
RA
TIN
G R
EV
IEW
CO
RP
OR
AT
E G
OV
ER
NA
NC
EF
INA
NC
IAL
STA
TE
ME
NT
SA
DD
ITIO
NA
L IN
FO
RM
AT
ION
INFORMATION FOR SHAREHOLDERS

306
FORWARD-LOOKING STATEMENTSThis document may contain certain forward-looking statements relating to the Group that are based on the beliefs of the
Group’s management as well as assumptions made by and information currently available to the Group’s management.
These forward-looking statements are, by their nature, subject to significant risks and uncertainties. These forward-looking
statements include, without limitation, statements relating to the Group’s business prospects, future developments, trends
and conditions in the industry and geographical markets in which the Group operates, its strategies, plans, objectives and
goals, its ability to control costs, statements relating to prices, volumes, operations, margins, overall market trends, risk
management and exchange rates.
When used in this document, the words “anticipate”, “believe”, “could”, “estimate”, “expect”, “going forward”, “intend”,
“may”, “ought to”, “plan”, “project”, “seek”, “should”, “will”, “would” and similar expressions, as they relate to the Group or
the Group’s management, are intended to identify forward-looking statements. These forward-looking statements reflect
the Group’s views as of the date hereof with respect to future events and are not a guarantee of future performance or
developments. You are strongly cautioned that reliance on any forward-looking statements involves known and unknown
risks and uncertainties. Actual results and events may differ materially from information contained in the forward-looking
statements as a result of a number of factors, including any changes in the laws, rules and regulations relating to any
aspects of the Group’s business operations, general economic, market and business conditions, including capital market
developments, changes or volatility in interest rates, foreign exchange rates, equity prices or other rates or prices, the
actions and developments of the Group’s competitors and the effects of competition in the insurance industry on the
demand for, and price of, the Group’s products and services, various business opportunities that the Group may or may not
pursue, changes in population growth and other demographic trends, including mortality, morbidity and longevity rates,
persistency levels, the Group’s ability to identify, measure, monitor and control risks in the Group’s business, including its
ability to manage and adapt its overall risk profile and risk management practices, its ability to properly price its products
and services and establish reserves for future policy benefits and claims, seasonal fluctuations and factors beyond the
Group’s control. Subject to the requirements of the Listing Rules, the Group does not intend to update or otherwise revise
the forward-looking statements in this document, whether as a result of new information, future events or otherwise. As a
result of these and other risks, uncertainties and assumptions, forward-looking events and circumstances discussed in this
document might not occur in the way the Group expects, or at all. Accordingly, you should not place reliance on any
forward-looking information or statements. All forward-looking statements in this document are qualified by reference to
the cautionary statements set forth in this section.
| AIA GROUP LIMITED
ADDITIONAL INFORMATIONINFORMATION FOR SHAREHOLDERS

307
CORPORATE INFORMATION
Risk CommitteeMr. Chung-Kong Chow (Chairman)
Mr. John Barrie Harrison
Professor Lawrence Juen-Yee Lau
Ms. Swee-Lian Teo
Mr. Edmund Sze-Wing Tse
Mr. Ng Keng Hooi
REGISTERED OFFICE35/F, AIA Central
No. 1 Connaught Road Central
Hong Kong
WEBSITEwww.aia.com
COMPANY SECRETARYMr. Mitchell New
AUTHORISED REPRESENTATIVESMr. Ng Keng Hooi
Mr. Mitchell New
SHARE REGISTRARComputershare Hong Kong Investor Services Limited
17M Floor
Hopewell Centre
183 Queen’s Road East, Wanchai
Hong Kong
PRINCIPAL BANKERSThe Hongkong and Shanghai Banking Corporation Limited
Citibank, N.A.
Standard Chartered Bank
AUDITORPricewaterhouseCoopers
Certified Public Accountant
BOARD OF DIRECTORS
Independent Non-executive Chairman and Independent Non-executive DirectorMr. Edmund Sze-Wing Tse
Executive Director,Group Chief Executive and PresidentMr. Ng Keng Hooi
Independent Non-executive DirectorsMr. Jack Chak-Kwong So
Mr. Chung-Kong Chow
Mr. John Barrie Harrison
Mr. George Yong-Boon Yeo
Mr. Mohamed Azman Yahya
Professor Lawrence Juen-Yee Lau
Ms. Swee-Lian Teo
Dr. Narongchai Akrasanee
Mr. Cesar Velasquez Purisima
AUDIT COMMITTEEMr. John Barrie Harrison (Chairman)
Mr. Jack Chak-Kwong So
Mr. George Yong-Boon Yeo
Dr. Narongchai Akrasanee
NOMINATION COMMITTEEMr. Edmund Sze-Wing Tse (Chairman)
Mr. Jack Chak-Kwong So
Mr. Chung-Kong Chow
Mr. John Barrie Harrison
Mr. George Yong-Boon Yeo
Mr. Mohamed Azman Yahya
Professor Lawrence Juen-Yee Lau
Ms. Swee-Lian Teo
Dr. Narongchai Akrasanee
Mr. Cesar Velasquez Purisima
REMUNERATION COMMITTEEMr. Jack Chak-Kwong So (Chairman)
Mr. George Yong-Boon Yeo
Mr. Mohamed Azman Yahya
Mr. Edmund Sze-Wing Tse
ANNUAL REPORT 2018 |
OV
ER
VIE
WF
INA
NC
IAL
AN
D O
PE
RA
TIN
G R
EV
IEW
CO
RP
OR
AT
E G
OV
ER
NA
NC
EF
INA
NC
IAL
STA
TE
ME
NT
SA
DD
ITIO
NA
L IN
FO
RM
AT
ION
ADDITIONAL INFORMATION

308
GLOSSARY
active agent An agent who sells at least one policy per month.
active market A market in which all the following conditions exist:
• the items traded within the market are homogeneous;
• willing buyers and sellers can normally be found at any time; and
• prices are available to the public.
A financial instrument is regarded as quoted in an active market if quoted prices are readily and regularly available from an exchange, dealer, broker, industry group, pricing service or regulatory agency, and those prices represent actual and regularly occurring market transactions on an arm’s length basis.
adjusted net worth or ANW ANW is the market value of assets in excess of the assets backing the policy reserves and other liabilities of the life (and similar) business of AIA, plus the IFRS equity value of other activities, such as general insurance business, less the value of intangible assets. It excludes any amounts not attributable to shareholders of AIA Group Limited. ANW for AIA is stated after adjustment to reflect consolidated reserving requirements. ANW by market is stated before adjustment to reflect consolidated reserving requirements, and presented on a local statutory basis.
AER Actual exchange rates.
AGM 2019 Annual General Meeting of the Company to be held at 11:00 a.m. (Hong Kong time) on Friday, 17 May 2019.
AIA or the Group AIA Group Limited and its subsidiaries.
AIA Co. AIA Company Limited, a company incorporated in Hong Kong and a subsidiary of the Company.
AIA International AIA International Limited, a company incorporated in Bermuda and an indirect subsidiary of the Company.
AIA Vitality A science-backed wellness programme that provides participants with the knowledge, tools and motivation to help them achieve their personal health goals. The programme is a partnership between AIA and Discovery Limited, a specialist insurer headquartered in South Africa.
AIG American International Group, Inc.
ALC The AIA Leadership Centre located in Bangkok, Thailand.
| AIA GROUP LIMITED
ADDITIONAL INFORMATION

309
amortised cost The amount at which the financial asset or financial liability is measured at initial recognition minus principal repayments, plus or minus the cumulative amortisation using the effective interest method of any difference between the initial amount and the maturity amount, and minus any reduction for impairment or uncollectibility.
annualised new premiums or ANP ANP represents 100 per cent of annualised first year premiums and 10 per cent of single premiums, before reinsurance ceded. It is an internally used measure of new business sales or activity for all entities within AIA. ANP excludes new business of pension business, personal lines and motor insurance. For group renewable business, it includes any premium payable on existing schemes that exceeds the prior year’s premiums.
ASPP Agency Share Purchase Plan, adopted by the Company on 23 February 2012, a share purchase plan with matching offer to facilitate and encourage AIA share ownership by agents.
available for sale (AFS) financial assets
Financial assets that may be sold before maturity and that are used to back insurance and investment contract liabilities and shareholders’ equity, and which are not managed on a fair value basis. Non-derivative financial assets that are designated as available for sale or are not classified as loans and receivables or as at fair value through profit or loss. Available for sale financial instruments are measured at fair value, with movements in fair value recorded in other comprehensive income.
bancassurance The distribution of insurance products through banks or other financial institutions.
Board The board of Directors.
CER Constant exchange rates. Change on constant exchange rates is calculated for all figures for the current year and for the prior year, using constant average exchange rates, other than for balance sheet items as at the end of the current year and as at the end of the prior year, which is translated using the constant exchange rates
Company AIA Group Limited, a company incorporated in Hong Kong with limited liability, whose shares are listed on the Main Board of the Hong Kong Stock Exchange (stock code: 1299).
consolidated investment funds Investment funds in which the Group has interests and power to direct their relevant activities that affect the return of the funds.
Corporate Governance Code Corporate Governance Code set out in Appendix 14 to the Listing Rules.
cost of capital or CoC CoC is calculated as the face value of the required capital as at the valuation date less the present value of the net-of-tax investment return on the shareholder assets backing the required capital and the present value of projected releases from the assets backing the required capital. Where the required capital may be covered by policyholder assets such as surplus assets in participating funds, there is no associated cost of capital included in the VIF or VONB. CoC for AIA is stated after adjustment to reflect consolidated capital requirements. CoC by market is stated before adjustment to reflect consolidated capital requirements, and presented on a local statutory basis.
ANNUAL REPORT 2018 |
OV
ER
VIE
WF
INA
NC
IAL
AN
D O
PE
RA
TIN
G R
EV
IEW
CO
RP
OR
AT
E G
OV
ER
NA
NC
EF
INA
NC
IAL
STA
TE
ME
NT
SA
DD
ITIO
NA
L IN
FO
RM
AT
ION
GLOSSARY

310
Dealing Policy Directors’ and Chief Executive’s Dealing Policy of the Company
deferred acquisition costs or DAC Acquisition costs are expenses of an insurer which are incurred in connection with the acquisition of new insurance contracts or the renewal of existing insurance contracts. They include commissions and other variable sales inducements and the direct costs of issuing the policy, such as underwriting and other policy issue expenses. These costs are deferred and expensed to the consolidated income statement on a systematic basis over the life of the policy. Such assets are tested for recoverability at least annually.
deferred origination costs or DOC Origination costs are expenses which are incurred in connection with the origination of new investment contracts or the renewal of existing investment contracts. For contracts that involve the provision of investment management services, these include commissions and other incremental expenses directly related to the issue of each new contract. Origination costs on contracts with investment management services are deferred and recognised as an asset in the consolidated statement of financial position and expensed to the consolidated income statement on a systematic basis in line with the revenue generated by the investment management services provided. Such assets are tested for recoverability.
Director(s) The director(s) of the Company.
embedded value or EV An actuarially determined estimate of the economic value of a life insurance business based on a particular set of assumptions as to future experience, excluding any economic value attributable to future new business. EV for AIA is stated after adjustments to reflect consolidated reserving and capital requirements and the after-tax value of unallocated Group Office expenses. EV by market is stated before adjustments to reflect consolidated reserving and capital requirements and unallocated Group Office expenses, and presented on a local statutory basis.
EPS Earnings per share.
equity attributable to shareholders of the Company on the embedded value basis or EV Equity
EV Equity is the total of embedded value, goodwill and other intangible assets attributable to shareholders of the Company.
ESPP Employee Share Purchase Plan, adopted by the Company on 25 July 2011 (as amended), a share purchase plan with matching offer to facilitate and encourage AIA share ownership by employees.
ExCo The Executive Committee of the Group.
fair value through profit or loss or FVTPL
Financial assets that are held to back unit-linked contracts and participating funds or financial assets and liabilities that are held for trading. A financial asset or financial liability that is measured at fair value in the statement of financial position with gains and losses arising from movements in fair value being presented in the consolidated income statement as a component of the profit or loss for the year.
| AIA GROUP LIMITED
ADDITIONAL INFORMATION

311
first half The six months from 1 January to 30 June.
first year premiums First year premiums are the premiums received in the first year of a recurring premium policy. As such, they provide an indication of the volume of new policies sold.
free surplus ANW in excess of the required capital. Free surplus for AIA is stated after adjustment to reflect consolidated reserving and capital requirements.
group insurance An insurance scheme whereby individual participants are covered by a master contract held by a single group or entity on their behalf.
Group Office Group Office includes the activities of the Group Corporate Centre segment consisting of the Group’s corporate functions, shared services and eliminations of intragroup transactions.
HKFRS Hong Kong Financial Reporting Standards.
HKIA Insurance Authority established under the Insurance Companies (Amendment) Ordinance 2015 or prior to 26 June 2017, the Office of the Commissioner of Insurance.
HKICPA Hong Kong Institute of Certified Public Accountants.
Hong Kong The Hong Kong Special Administrative Region of the PRC; in the context of our reportable segments, Hong Kong includes Macau.
Hong Kong Companies Ordinance Companies Ordinance (Chapter 622 of the Laws of Hong Kong), as amended from time to time.
Hong Kong Insurance Ordinance or HKIO
Insurance Ordinance (Chapter 41 of the Laws of Hong Kong), as amended from time to time. It provides a legislative framework for the prudential supervision of the insurance industry in Hong Kong.
Hong Kong Stock Exchange or HKSE The Stock Exchange of Hong Kong Limited.
IAIS International Association of Insurance Supervisors.
IAS International Accounting Standards.
IASB International Accounting Standards Board.
IFA Independent financial adviser.
ANNUAL REPORT 2018 |
OV
ER
VIE
WF
INA
NC
IAL
AN
D O
PE
RA
TIN
G R
EV
IEW
CO
RP
OR
AT
E G
OV
ER
NA
NC
EF
INA
NC
IAL
STA
TE
ME
NT
SA
DD
ITIO
NA
L IN
FO
RM
AT
ION
GLOSSARY

312
IFRS Standards and interpretations adopted by the IASB comprising:
• International Financial Reporting Standards;
• IAS; and
• Interpretations developed by the IFRS Interpretations Committee (IFRS IC) or the former Standing Interpretations Committee (SIC).
ING Malaysia ING Management Holdings (Malaysia) Sdn. Bhd.
interactive Mobile Office or iMO iMO is a mobile office platform with a comprehensive suite of applications that allow agents and agency leaders to manage their daily activities from lead generation, sales productivity and recruitment activity through to development training and customer analytics.
interactive Point of Sale or iPoS iPoS is a secure, mobile point-of-sale technology that features a paperless sales process from the completion of the customer’s financial-needs analysis to proposal generation with electronic biometric signature of life insurance applications on tablet devices. It is part of iMO.
investment experience Realised and unrealised investment gains and losses recognised in the consolidated income statement.
investment income Investment income comprises interest income, dividend income and rental income.
investment return Investment return consists of investment income plus investment experience.
IPO Initial Public Offering.
liability adequacy testing An assessment of whether the carrying amount of an insurance liability needs to be increased or the carrying amount of related deferred acquisition and origination costs or related intangible assets decreased based on a review of future cash flows.
Listing Rules Rules Governing the Listing of Securities on The Stock Exchange of Hong Kong Limited.
LOMA LOMA is an international trade association for the insurance and financial services industry.
Million Dollar Round Table or MDRT MDRT is a global professional trade association of life insurance and financial services professionals that recognises significant sales achievements and high service standards.
Model Code Model code for Securities Transactions by Directors of Listed Issuers set out in Appendix 10 to the Listing Rules.
net funds to Group Corporate Centre In presenting net capital in/(out) flows to reportable segments, capital outflows consist of dividends and profit distributions to the Group Corporate Centre segment and capital inflows consist of capital injections into reportable segments by the Group Corporate Centre segment. For the Group, net capital in/(out) flows reflect the net amount received from shareholders by way of capital contributions less amounts distributed by way of dividends.
| AIA GROUP LIMITED
ADDITIONAL INFORMATION

313
n/a Not available.
n/m Not meaningful.
operating profit after tax or OPAT Operating profit is determined using, among others, expected long-term investment return for equities and real estate. Short-term fluctuations between expected long-term investment return and actual investment return for these asset classes are excluded from operating profit. The investment return assumptions used to determine expected long-term investment return are based on the same assumptions used by the Group in determining its embedded value and are disclosed in the Supplementary Embedded Value Information.
operating return on EV or operating ROEV
Operating return on EV is calculated as EV operating profit, expressed as a percentage of the opening embedded value.
operating return on shareholders’ allocated equity or operating ROE
Operating return on shareholders’ allocated equity is calculated as operating profit after tax attributable to shareholders of the Company, expressed as a percentage of the simple average of opening and closing shareholders’ allocated equity.
OTC Over-the-counter.
Other participating business with distinct portfolios
Business where it is expected that the policyholder will receive, at the discretion of the insurer, additional benefits based on the performance of underlying segregated investment assets where this asset segregation is supported by an explicit statutory reserve and reporting in the relevant territory.
Participating funds Participating funds are distinct portfolios where the policyholders have a contractual right to receive, at the discretion of the insurer as to the timing, additional benefits based on factors such as the performance of a pool of assets held within the fund, as a supplement to any guaranteed benefits. The allocation of benefits from the assets held in the participating funds is subject to minimum policyholder participation mechanisms established by regulation.
persistency The percentage of insurance policies remaining in force from month to month in the past 12 months, as measured by premiums.
Philam Life The Philippine American Life and General Insurance (PHILAM LIFE) Company, a subsidiary of AIA Co.
policyholder and shareholder investments
Investments other than those held to back unit-linked contracts as well as assets from consolidated investment funds.
pps Percentage points.
PRC The People’s Republic of China.
protection gap The difference between the resources needed and resources available to maintain dependants’ living standards after the death of the primary wage-earner.
ANNUAL REPORT 2018 |
OV
ER
VIE
WF
INA
NC
IAL
AN
D O
PE
RA
TIN
G R
EV
IEW
CO
RP
OR
AT
E G
OV
ER
NA
NC
EF
INA
NC
IAL
STA
TE
ME
NT
SA
DD
ITIO
NA
L IN
FO
RM
AT
ION
GLOSSARY

314
puttable liabilities A puttable financial instrument is one in which the holder of the instrument has the right to put the instrument back to the issuer for cash (or another financial asset). Units in investment funds such as mutual funds and open-ended investment companies are typically puttable instruments. As these can be put back to the issuer for cash, the non-controlling interests in any such funds which have to be consolidated by AlA are treated as financial liabilities.
PVNBP margin VONB excluding pension business, expressed as a percentage of present value of new business premiums (PVNBP). PVNBP margin for AIA is stated after adjustments to reflect consolidated reserving and capital requirements and the after-tax value of unallocated Group Office expenses.
regulatory minimum capital Net assets held to meet the minimum solvency margin requirement set by the HKIO that an insurer must meet in order to be authorised to carry on insurance business in or from Hong Kong.
renewal premiums Premiums receivable in subsequent years of a recurring premium policy.
rider A supplemental plan that can be attached to a basic insurance policy, typically with payment of additional premiums.
Risk-Based Capital or RBC RBC represents an amount of capital based on an assessment of risks that a company should hold to protect customers against adverse developments.
RMF Risk Management Framework.
RSPUs Restricted stock purchase units.
RSSUs Restricted stock subscription units.
RSU Scheme Restricted Share Unit Scheme, adopted by the Company on 28 September 2010 (as amended), under which the Company may award restricted share units to employees, directors (excluding independent non-executive directors) or officers of the Company or any of its subsidiaries.
second half The six months from 1 July to 31 December.
SFO Securities and Future Ordinance (Chapter 571 of the laws of Hong Kong), as amended from time to time.
share(s) For the Company, shall mean ordinary share(s) in the capital of the Company.
shareholders’ allocated equity Shareholders’ allocated equity is total equity attributable to shareholders of the Company less fair value reserve.
Singapore The Republic of Singapore; in the context of our reportable segments, Singapore includes Brunei.
single premium A single payment that covers the entire cost of an insurance policy.
| AIA GROUP LIMITED
ADDITIONAL INFORMATION

315
SO Scheme Share Option Scheme, adopted by the Company on 28 September 2010 (as amended), under which the Company may award share options to employees, directors (excluding independent non-executive directors) or officers of the Company or any of its subsidiaries.
solvency The ability of an insurance company to satisfy its policyholder benefits and claims obligations.
solvency ratio The ratio of the total available capital to the regulatory minimum capital applicable to the insurer pursuant to relevant regulations.
Sovereign AIA Sovereign Limited (formerly ASB Group (Life) Limited) and its subsidiaries, including Sovereign Assurance Company Limited, a licensed insurer in New Zealand.
takaful Islamic insurance which is based on the principles of mutual assistance and risk sharing.
Tata AIA Tata AIA Life Insurance Company Limited.
total weighted premium income or TWPI
TWPI consists of 100 per cent of renewal premiums, 100 per cent of first year premiums and 10 per cent of single premiums, before reinsurance ceded. As such it provides an indication of AIA’s longer-term business volumes as it smoothes the peaks and troughs in single premiums.
unit-linked investments Financial investments held to back unit-linked contracts.
unit-linked products Unit-linked products are insurance products where the policy value is linked to the value of underlying investments (such as collective investment schemes, internal investment pools or other property) or fluctuations in the value of underlying investment or indices. Investment risk associated with the product is usually borne by the policyholder. Insurance coverage, investment and administration services are provided for which the charges are deducted from the investment fund assets. Benefits payable will depend on the price of the units prevailing at the time of death of the insured or surrender or maturity of the policy, subject to surrender charges.
universal life A type of insurance product where the customer pays flexible premiums, subject to specified limits, which are accumulated in an account balance which are credited with interest at a rate either set by the insurer or reflecting returns on a pool of matching assets. The customer may vary the death benefit and the contract may permit the policyholder to withdraw the account balance, typically subject to a surrender charge.
ANNUAL REPORT 2018 |
OV
ER
VIE
WF
INA
NC
IAL
AN
D O
PE
RA
TIN
G R
EV
IEW
CO
RP
OR
AT
E G
OV
ER
NA
NC
EF
INA
NC
IAL
STA
TE
ME
NT
SA
DD
ITIO
NA
L IN
FO
RM
AT
ION
GLOSSARY

316
value of business acquired or VOBA VOBA in respect of a portfolio of long-term insurance and investment contracts acquired is recognised as an asset, calculated using discounted cash flow techniques, reflecting all future cash flows expected to be realised from the portfolio. VOBA is amortised over the estimated life of the contracts in the acquired portfolio on a systematic basis. The rate of amortisation reflects the profile of the additional value of the business acquired. The carrying value of VOBA is reviewed annually for impairment and any impairment is charged to the consolidated income statement.
value of in-force business or VIF VIF is the present value of projected after-tax statutory profits emerging in the future from the current in-force business less the cost arising from holding the required capital (CoC) to support the in-force business. VIF for AIA is stated after adjustments to reflect consolidated reserving and capital requirements and the after-tax value of unallocated Group Office expenses. VIF by market is stated before adjustments to reflect consolidated reserving and capital requirements and unallocated Group Office expenses, and presented on a local statutory basis.
value of new business or VONB VONB is the present value, measured at the point of sale, of projected after-tax statutory profits emerging in the future from new business sold in the period less the cost of holding the required capital in excess of regulatory reserves to support this business. VONB for AIA is stated after adjustments to reflect consolidated reserving and capital requirements and the after-tax value of unallocated Group Office expenses. VONB by market is stated before adjustments to reflect consolidated reserving and capital requirements and unallocated Group Office expenses, and presented on a local statutory basis.
VONB margin VONB excluding pension business, expressed as a percentage of ANP. VONB margin for AIA is stated after adjustments to reflect consolidated reserving and capital requirements and the after-tax value of unallocated Group Office expenses. VONB margin by market is stated before adjustments to reflect consolidated reserving and capital requirements and unallocated Group Office expenses, and presented on a local statutory basis.
working capital Working capital comprises debt and equity securities, deposits and cash and cash equivalents held at the Group Corporate Centre. These liquid assets are available to invest in building the Group’s business operations.
| AIA GROUP LIMITED
ADDITIONAL INFORMATION

AIA.COM
AN
NU
AL
RE
PO
RT
20
18
AIA
GR
OU
P L
IMIT
ED
友邦保險控股有限公司