leading causes of death of new hampshire residents, … · leading causes of death of new hampshire...
TRANSCRIPT

Leading Causes of Death ofNew Hampshire Residents, 1999 - 2001
New Hampshire Department of Health and Human Services Division of Public Health Services
Bureau of Disease Control and Health Statistics
John H. Lynch, Governor
John A. Stephen, Commissioner Department of Health and Human Services
Mary Ann Cooney, DirectorDivision of Public Health Services
April 2005

Leading Causes of Death ofNew Hampshire Residents, 1999 - 2001
New Hampshire Department of Health and Human Services Division of Public Health Services Bureau of Disease Control and Health Statistics
John H. Lynch, Governor
John A. Stephen, Commissioner Department of Health and Human Services
Mary Ann Cooney, DirectorDivision of Public Health Services
April 2005
Requests for additional copies should be directed to:
New Hampshire Department of Health and Human Services Division of Public Health Services, Health Statistics Section 29 Hazen DriveConcord, NH 03301-6504
603-271-5926 or 1-800-852-3345, ext. 7308 TDD Access 1-800-735-2964
An electronic version of this report is available on the DPHS web site: http://www.dhhs.nh.gov/DHHS/DPHS
Suggested citation:
Chalsma, A., Reichel, D., Taylor, C., Leading Causes of Death of New Hampshire Residents, 1999-2001; Concord, NH: New Hampshire Department of Health and Human Services, Division of Public HealthServices, Health Statistics and Data Management Section, 2005 (Data from death certificate data, New Hampshire Division of Vital Records Administration, New Hampshire Department of State).
NH DHHS, DIVISION OF PUBLIC HEALTH SERVICES — HEALTH STATISTICS AND DATA MANAGEMENTLEADING CAUSES OF DEATH OF NEW HAMPSHIRE RESIDENTS, 1999 – 2001 ii APRIL 2005

AcknowledgementsAuthorsAndrew Chalsma, Section Administrator David Reichel, Epidemiologist Christopher S. Taylor, Planning Analyst
Contributors and ReviewersHealth Statistics and Data Management:
Janet Horne, Planning Analyst/GIS Ann Bennett, Program Assistant Madhuri Palnati, Intern Jody Wilson, BRFSS Coordinator David Swenson, Program Planner
Jesse F. Greenblatt, State Epidemiologist and Chief, Bureau of DiseaseControl and Health Statistics, Division of Public Health Services
Susan Bascom, Communicable Disease Surveillance Section, Division ofPublic Health Services
Kim Fallon, Communicable Disease Surveillance Section, Division of PublicHealth Services
Andy Pelletier, Chronic Disease Epidemiologist, Division of Public Health Services
Greg Moore, Office of the Commissioner, Department of Health and HumanServices
Anna Thomas, Manchester Health Department Rosemary Caron, Manchester Health Department
NH DHHS, DIVISION OF PUBLIC HEALTH SERVICES — HEALTH STATISTICS AND DATA MANAGEMENTLEADING CAUSES OF DEATH OF NEW HAMPSHIRE RESIDENTS, 1999 – 2001 APRIL 2005 iii


Table of Contents EXECUTIVE SUMMARY........................................................................................................vii
INTRODUCTION ......................................................................................................................... 1HOW TO UNDERSTAND AND USE THIS REPORT............................................................................2DATA SOURCE...............................................................................................................................6
FREQUENTLY ASKED QUESTIONS ...................................................................................... 8
OVERVIEW ................................................................................................................................ 11DEATH RATES FOR ALL DEATHS COMBINED .............................................................................11OVERVIEW OF LEADING CAUSES OF DEATH IN NEW HAMPSHIRE .............................................17YEARS OF POTENTIAL LIFE LOST ...............................................................................................18LEADING CAUSES OF DEATH BY RACE AND HISPANIC ETHNICITY............................................20
LEADING CAUSE OF DEATH BY AGE................................................................................ 21INFANTS ......................................................................................................................................23AGE 1 TO 4 ..................................................................................................................................24AGE 5 TO 14 ................................................................................................................................24AGE 15 TO 24 ..............................................................................................................................25AGE 25 TO 34 ..............................................................................................................................25AGE 35 TO 44 ..............................................................................................................................26AGE 45 TO 55 ..............................................................................................................................27AGE 55 TO 64 ..............................................................................................................................28AGE 65 TO 74 ..............................................................................................................................29AGE 75 TO 84 ..............................................................................................................................30AGE 85 AND OLDER ....................................................................................................................31
DETAIL ON THE TEN LEADING CAUSES OF DEATH IN NEW HAMPSHIRE........... 33DISEASES OF THE HEART ............................................................................................................33INVASIVE CANCER ......................................................................................................................37CEREBROVASCULAR DISEASE ....................................................................................................41CHRONIC LOWER RESPIRATORY DISEASE..................................................................................45UNINTENTIONAL INJURIES (ACCIDENTS)....................................................................................49DIABETES ....................................................................................................................................55ALZHEIMER’S DISEASE ...............................................................................................................58INFLUENZA AND PNEUMONIA .....................................................................................................62SUICIDE .......................................................................................................................................67NEPHRITIS ...................................................................................................................................71
LEADING CAUSES OF DEATH FOR SELECTED CITIES AND TOWNS ...................... 76BEDFORD.....................................................................................................................................77BERLIN ........................................................................................................................................78CLAREMONT ...............................................................................................................................79CONCORD....................................................................................................................................80DERRY.........................................................................................................................................81DOVER.........................................................................................................................................82EXETER .......................................................................................................................................83KEENE .........................................................................................................................................84LACONIA .....................................................................................................................................85
NH DHHS, DIVISION OF PUBLIC HEALTH SERVICES — HEALTH STATISTICS AND DATA MANAGEMENTLEADING CAUSES OF DEATH OF NEW HAMPSHIRE RESIDENTS, 1999 – 2001 APRIL 2005 v

MANCHESTER..............................................................................................................................86NASHUA ......................................................................................................................................87PORTSMOUTH..............................................................................................................................88ROCHESTER.................................................................................................................................89SALEM.........................................................................................................................................90
TECHNICAL APPENDIX ......................................................................................................... 91AGE-ADJUSTED RATES................................................................................................................91CONFIDENCE INTERVAL CALCULATIONS ...................................................................................92LEADING CAUSE OF DEATH DESCRIPTIONS................................................................................93LEADING CAUSE OF DEATH CODING CRITERIA..........................................................................95POPULATION ESTIMATES ............................................................................................................97
REFERENCES ............................................................................................................................ 99
ENDNOTES............................................................................................................................... 102
NH DHHS, DIVISION OF PUBLIC HEALTH SERVICES — HEALTH STATISTICS AND DATA MANAGEMENTLEADING CAUSES OF DEATH OF NEW HAMPSHIRE RESIDENTS, 1999 – 2001 vi APRIL 2005

Executive Summary
Executive Summary Introduction
This report focuses on deaths in New Hampshire between 1999 and 2001. Efforts to improve human health and prevent disease should start with a good understanding of the causes of death in society. It is our hope that the information presented in this report will contribute to a healthier New Hampshire.
Overview of Leading Causes of Death in New Hampshire
Figure 1. Deaths by Leading Cause, New Hampshire Residents, 1999-2001
0500
1 ,0001 ,5002 ,0002 ,5003 ,0003 ,5004 ,0004 ,5005 ,0005 ,5006 ,0006 ,5007 ,0007 ,5008 ,0008 ,5009 ,000
Dis
ease
s of
Hea
rt
Inva
sive
Can
cer
Cer
ebro
vasc
ular
Dis
ease
Chr
onic
Low
. Res
p.*
Uni
nten
tiona
l Inj
urie
sD
iabe
tes
Alzh
eim
er's
Flu
& Pn
eum
onia
Sui
cide
Nep
hriti
s
Live
r Dis
ease
Aor
tic A
neur
ysm
Park
inso
n's
Athe
rosc
lero
sis
Beni
gn N
eopl
asm
sH
yper
tens
ion
Sep
ticem
ia
Per
inat
al C
ondi
tions
Pneu
mon
itis
Con
geni
tal A
bnor
mal
ities
Hom
icid
e
Pep
tic U
lcer
Gal
lbla
dder
Dis
orde
rs
Nut
ritio
nal D
efic
ienc
ies
Anem
ias
Med
ical
Com
plic
atio
ns HIV
Vira
l Hep
atiti
s
Her
nia
Dea
ths
* Chronic lower respiratory disease includes most of the same causes of death as the group chronic obstructive pulmonarydisease, used as leading cause of death group prior to 1999.
NH DHHS, DIVISION OF PUBLIC HEALTH SERVICES — HEALTH STATISTICS AND DATA MANAGEMENTLEADING CAUSES OF DEATH OF NEW HAMPSHIRE RESIDENTS, 1999 – 2001 APRIL 2005 vii

Executive Summary
Table 1. Leading Causes of Death, New Hampshire Residents, 1999-2001
Leading Cause DeathsAge-Adjusted Rate /
100,000(95% Confidence Interval)
US Rate /100,000
Diseases of Heart 8408 236.1 (231.0, 241.1) 258.3
Invasive Cancer 7287 202.0 (197.4, 206.7) 198.6
Cerebrovascular Disease 1968 55.7 (53.3, 58.2) 60.0
Chronic Low. Resp.* 1791 50.7 (48.3, 53.0) 44.4
Unintentional Injuries 1038 28.4 (26.7, 30.1) 33.9
Diabetes 885 24.8 (23.2, 26.5) 25.1
Alzheimer’s 846 24.1 (22.4, 25.7) 17.8
Flu & Pneumonia 591 16.7 (15.4, 18.1) 23.0
Suicide 455 12.1 (11.0, 13.2) 10.5
Nephritis 335 9.5 (8.4, 10.5) 13.5Note: This table includes only leading causes of death where 20 or more deaths have occurred
indicates NH rate is lower than US rate, indicates NH rate is higher than US rate
* Chronic lower respiratory disease includes most of the same causes of death as the group chronic obstructive pulmonary disease,used as leading cause of death group prior to 1999.
Compared to the US, New Hampshire has higher death rates for chronic lower respiratory disease, Alzheimer’s disease, suicide, and atherosclerosis. NH has lower rates for heart disease, cerebrovascular disease, unintentional injuries, influenza and pneumonia, nephritis, liver disease, hypertension, septicemia, perinatal conditions, pneumonitis, congenital abnormalities, homicide, anemias, HIV, and viral hepatitis.
NH DHHS, DIVISION OF PUBLIC HEALTH SERVICES — HEALTH STATISTICS AND DATA MANAGEMENTLEADING CAUSES OF DEATH OF NEW HAMPSHIRE RESIDENTS, 1999 – 2001 viii APRIL 2005

Executive Summary
Years of Potential Life Lost
Figure 2. Years of Potential Life Lost, Life Expectancy of 75 Years, New Hampshire Residents, 1999–2001
0
5 ,00 0
10 ,00 0
15 ,00 0
20 ,00 0
25 ,00 0
30 ,00 0
35 ,00 0
40 ,00 0
45 ,00 0
50 ,00 0
55 ,00 0
60 ,00 0In
vasi
ve C
ance
r
Dis
ease
s of
Hea
rt
Uni
nten
tiona
l Inj
urie
s
Sui
cide
Per
inat
al C
ondi
tions
Chr
onic
Low
. Res
p.
Con
geni
tal A
bnor
mal
ities
Dia
bete
s
Cer
ebro
vasc
ular
Live
r Dis
ease
Hom
icid
e
Flu
& P
neum
onia
Nep
hriti
s
HIV
Sep
ticem
ia
Ben
ign
Neo
plas
ms
Vira
l Hep
atiti
s
Aor
tic A
neur
ysm
Hyp
erte
nsio
n
Pep
tic U
lcer
Alz
heim
er's
Ath
eros
cler
osis
Par
kins
on's
Note: Years of potential life lost were calculated when 20 or more individuals under age 75 died of a particular cause of death.
While heart disease is the leading cause of death, it is second to invasive cancer in terms of years of potential life lost when age 75 is set as the upper limit. Unintentional injuries rank third.
Diseases of the Heart
Heart disease is the leading cause of death in New Hampshire and the US.25% of New Hampshire adults smoke. 23% of New Hampshire adults engage in vigorous physical activity 3 or more times per week. 23% of New Hampshire adults are obese. 42% are at a healthy weight. 26% of New Hampshire adults consume 5 or more fruits and vegetables a day. 85% of heart disease deaths occur after age 65, but the life style factors that can contribute to this cause of death can begin as early as childhood. Manchester has a higher heart disease death rate than the US or NH.
Invasive Cancer
Invasive cancer is the leading cause of death in New Hampshire for all age groups between ages 35 and 75. It is the second leading cause of death across all ages.
NH DHHS, DIVISION OF PUBLIC HEALTH SERVICES — HEALTH STATISTICS AND DATA MANAGEMENTLEADING CAUSES OF DEATH OF NEW HAMPSHIRE RESIDENTS, 1999 – 2001 APRIL 2005 ix

Executive Summary
Cerebrovascular Disease
More women die from cerebrovascular disease mainly because this is a disease of the elderly and women tend to live longer. Death rates are not different between men and women. NH cerebrovascular death rates are lower that US rates except in the 85+-age group. The death rate for women is higher in this age category.
Chronic Lower Respiratory Disease
Chronic lower respiratory disease includes most of the same causes of death as the group chronic obstructive pulmonary disease (COPD), used as leading cause of death group prior to 1999. Chronic lower respiratory disease is primarily a disease of the elderly with 87% of deaths occurring after age 65. While there are more deaths among females in the 85+ age group, the rate is higher for males.
Unintentional Injuries (Accidents)
Unintentional injuries are the third leading cause of years of potential life lost in NH and are the leading cause of death for all age groups between ages 1 and 34. Two thirds of injury deaths involve men. Men suffer 300 more deaths a year in NH compared to females. The highest rates of injury are found among the oldest age groups. This fact is often hidden by the relatively larger number of deaths in the elderly from other causes. Rural areas tend to have higher injury rates, which may account for higher rates in the northern counties of Coos and Carroll. Berlin, in rural Coos County, has a death rate that is over twice the NH rate.
Diabetes
Obesity and lack of exercise are associated with increased risk of diabetes.One-half of adults in New Hampshire are overweight; one-quarter of adults report no leisure-time physical activity in the previous month; and only one-quarter eat the recommended 5 servings of fruits and vegetables daily. Between 1999 and 2001, 2,931 NH residents died with diabetes listed as an underlying or contributing cause of death.
Alzheimer’s Disease
The number of people with the disease doubles every 5 years beyond age 65. As many as 10 percent of all people 65 years of age and older have Alzheimer’s and as many as 50 percent of all people 85 and older have the disease.
NH DHHS, DIVISION OF PUBLIC HEALTH SERVICES — HEALTH STATISTICS AND DATA MANAGEMENTLEADING CAUSES OF DEATH OF NEW HAMPSHIRE RESIDENTS, 1999 – 2001 x APRIL 2005

Executive Summary
Alzheimer’s disease is the 5th leading cause of death among NH residents over age 65. NH age-adjusted date rates for Alzheimer’s disease are higher than the US for ages above 75.
Influenza and Pneumonia
Patients 65 years or older are at particular risk for death. Deaths in these patients account for 89% of all pneumonia and/or influenza deaths.Since 1960, influenza (flu) and pneumonia have been the leading cause of infectious disease deaths in the US. 94% percent of underlying cause of death codes in this category in NH list pneumonia and 6% list influenza. 93% of New Hampshire deaths from influenza and pneumonia occur in the 65+ age group.More women die of influenza and pneumonia than men. This is due to the greater number of women in the older age groups. While their total deaths are lower, rates are higher for men in older age groups. There is an increase of influenza and pneumonia deaths during the flu season. It is uncertain how many of these additional deaths are related to flu because the same risk factors generally increase pneumonia deaths.
Suicide
More people die from suicide each year than homicide (In the US in 2000 there were 29,350 suicide deaths (an average of 80 per day) and 16,765 homicide deaths). Females are more likely to attempt suicide; males are 4 times more likely to die.Nationally, males over age 65 have the highest suicide rates. Nearly half of all suicides in New Hampshire involve firearms. Males account for 10 times more firearm-related suicide deaths than females in NH.NH suicide deaths increased in 2001 and became higher than US rates.Suicide rates tend to be higher in rural areas nationally, and this may relate to higher rates seen in rural Carroll, Coos, and Sullivan counties.
Death Rates by Age for All Deaths Combined
Infant deaths (<1 year) exceed total deaths between 1 and 14 years. The death rate for infants is higher than the death rates for all age groups under age 55. 87% of deaths occur after age 54; 79% after age 64. Male death rates are higher than female death rates for every age group.
NH DHHS, DIVISION OF PUBLIC HEALTH SERVICES — HEALTH STATISTICS AND DATA MANAGEMENTLEADING CAUSES OF DEATH OF NEW HAMPSHIRE RESIDENTS, 1999 – 2001 APRIL 2005 xi

Executive Summary
New Hampshire total death rates are lower than US death rates for every age group except 85 plus.
Leading Causes of Death by Age
Nearly 25% of the 50 NH deaths to children ages 1 to 4 were the result of unintentional injury. This percentage increases to 60% of 5 to 14 year olds and 55% of 15 to 24 year olds.The suicide rate for NH residents between ages 15 and 34 year olds is higher than the US rate while homicide rates are lower. Invasive cancer is the number one cause of death in the 35 to 44 year old age group. There are nearly as many deaths from cancer in this age group as total deaths in the next younger (25 to 34) age group. Even though heart disease is the overall leading cause of death in New Hampshire, invasive cancer ranks highest in all age groups from age 35 to 75. For 35 to 44 year olds, HIV rates, though lower than the US rate, are highest in the 35 to 44 year old age group. Heart disease becomes a major cause of death in the 35 to 44 year old age group (11.4% of deaths) and the percentage of total deaths from unintentional injury (12.9%) and suicide (10.0%) are still significant portion of total deaths. There is a pattern beginning in this age group of NH rates comparing favorably with US rates. Other causes of death are more prominent in this age group, such as liver, cerebrovascular, chronic lower respiratory, and diabetes For 55 to 64 year olds, death rates increase by nearly a factor of 3 compared to the previous age group with invasive cancer still the leading cause of death.For 65 to 74 year olds, each of the top 6 leading causes of death increase by 2 to 3 times over the rates for the previous age group. Unintentional injuries drop from 5th to 7th in ranking but death rates from unintentional injuries increase. The rate for CLRD is higher than the US rate. For 75 to 84 year olds, heart disease becomes the leading cause of death, but is lower than the US rate. Invasive cancer, CLRD, and Alzheimer’s are high compared to US rates. For deaths of people 85 and older, heart disease becomes the overwhelming leading cause of death. Invasive cancer, CLRD, and Alzheimer’s disease again exceed US rates. Diabetes rates exceed the US rate for the first time.
NH DHHS, DIVISION OF PUBLIC HEALTH SERVICES — HEALTH STATISTICS AND DATA MANAGEMENTLEADING CAUSES OF DEATH OF NEW HAMPSHIRE RESIDENTS, 1999 – 2001 xii APRIL 2005

Introduction
IntroductionThe study of disease in populations (epidemiology) is as old as medicine itself, but the first attempt to measure the impact of disease on society was based on the analysis of births and deaths in London, in 1662, by a hat maker named John Graunt. His recognition of the value of administrative data in providing information about human health forms the basis of modern epidemiology1.
This report focuses on deaths in New Hampshire between 1999 and 2001. Instead of simply providing data in tables for others to analyze, an attempt is made to present the most useful and interesting findings in the form of graphs and charts. Notes are added to highlight results of special interest, offer explanations, and raise questions for further study.
Graphs facilitate comparisons and help generate questions. Why does one New Hampshire county have a higher death rate than another? How do various causes of death compare in terms of loss of potential years of life? Which causes of death are most common? What are the different patterns of death among age groups and gender?What is the cost to society of premature deaths and what can we do about it? Are we doing better or worse than the rest of the nation?
Death is studied to better understand life. How an individual or a society dies has much to say about how it lives. This report is ultimately about how people live, and should lead to questions such as: “What can we do to improve our lives and maximize our potential as human beings?” If we have lower death rates than another region or compared to the US as a whole, is that good enough, or should we set higher standards?To what extent can life be prolonged and quality of life improved by efforts to promote healthy lifestyles? Opportunities may exist to improve the treatment of disease, increase access to medical care, reduce injury, and clean up our environment. This data should help us ask questions about what we can do better.
A recent paper (2004) published in the Journal of the American Medical Association (JAMA) by Mokdad, Stroup, and Gerberding, “Actual Causes of Death in the United States, 2000” presents findings concerning the impact of modifiable behavioral risk factors as actual causes of death2. Based on a study of relevant articles published between 1980 and 2002, 18.1% of US deaths are caused by tobacco, 16.6% by poor diet and physical inactivity, 3.5% by alcohol consumption, 3.1% by microbial agents, 2.3% by toxic agents, 1.8% by motor vehicle crashes, 1.2% by firearms, 0.8% by sexual behaviors, and 0.7% by illicit use of drugs. The study concluded that smoking remains the leading cause of mortality, but that poor diet and physical inactivity may soon outrank tobacco.These findings suggest the potential value of focusing on modifiable behavioral riskfactors to help reduce death rates.
NH DHHS, DIVISION OF PUBLIC HEALTH SERVICES — HEALTH STATISTICS AND DATA MANAGEMENTLEADING CAUSES OF DEATH OF NEW HAMPSHIRE RESIDENTS, 1999 – 2001 APRIL 2005 1

Introduction
Efforts to improve human health and prevent disease should start with a good understanding of the causes of death in society. It is our hope that the information presented in this report will contribute to a healthier New Hampshire.
This report is organized into three major sections. The first section presents an overview of the leading causes of death in New Hampshire. The next section looks at the leading causes by age groups, and the final section provides more detailed information on each of the ten leading causes of death in New Hampshire (e.g., Diseases of the Heart).
How to Understand and Use This Report
New Hampshire Residents
This report is about deaths of New Hampshire residents. New Hampshire residents who die in New Hampshire or in other states are counted. Residents of other states who die in New Hampshire are not included.
Use of Statistics
Data in this report is presented in a variety of ways and is intended to be valuable and educational for individuals with different levels of knowledge about statistics.Information is provided here and in the Frequently Asked Questions section to help explain important statistical concepts. More detailed information is provided in the technical appendix. Frequencies, percentages, and rates are reported in the form of tables, graphs, and charts. Confidence intervals are often displayed. Age-adjusted rates are calculated to allow comparison between geographic areas with different age-group distributions. The reader is encouraged to pay close attention to figure and table titles and legends to know what statistics are being reported. A variety of statistics may be used in a single section.
Frequencies
A frequency is a count of events. For example, the frequency of yearly overall deaths in NH increased from 9549 to 9813 from years 1999 to 2001, while death rates dropped due to increased population. Frequencies are valuable when it is important to know the exact number of events, perhaps as an indication of burden on available resources.
Rates
Rates are often used to make comparisons. In this report, crude rates are the number of deaths in a given population, divided by population. Age-specific rates are simply crude rates for a specific age group, such as children under 5. Standardized (age-adjusted) rates are somewhat more complicated because adjustments are made to account for the fact that different populations may have different age distributions. Standardized rates are explained in detail in the technical appendix, but the basic idea is that the age-specific rates in a population are first calculated and then these rates are applied to a standard population. The standard population used in this report (and used by the National Center for Health Statistics) is the US 2000 estimated population3. The
NH DHHS, DIVISION OF PUBLIC HEALTH SERVICES — HEALTH STATISTICS AND DATA MANAGEMENTLEADING CAUSES OF DEATH OF NEW HAMPSHIRE RESIDENTS, 1999 – 2001 2 APRIL 2005

Introduction
standardized rate is the rate that a population would have if its age-distribution were the same as the standard population. For example, Hillsborough County has a higher proportion of younger people than Coos County, which has a higher proportion of older people. Using age-standardized rates allows us to compare the two counties despite the differences in age distribution of their populations.
Confidence Intervals Most statistical estimates in this report include 95% confidence intervals (CIs). A 95% confidence interval is a range of values in which the true value can be expected, under similar circumstances, 95% of the time. The confidence intervals are indicated by the symbol I in the charts.
Confidence intervals are not used with US rates because the numbers are large enough to allow for a high level of certainty. Please refer to the technical appendix for more information.
Comparing Rates
When comparing rates over time or between groups it is necessary to consider the influence of random variation on the data. To make comparisons, we wish to know what differences are caused by natural variability in the data (noise) and what differences are real differences (because the underlying risk is different). Confidence intervals are constructed to suggest the variability of a single rate estimate. A simple test to compare rates is to determine if their confidence intervals overlap. To interpret this test, if confidence intervals overlap, there is no “statistically significant” difference and if they do not overlap, there is a “statistically significant” difference. For example, the NH rate for Invasive Cancer is 202 with a 95% CI of 197 to 207. The US rate for Invasive Cancer is 199. NH’s rate appears higher than the US rate until we check the CI and find that the US rate overlaps, or is contained within, the confidence intervals for NH’s rate.
In this report, we avoid the cumbersome phrase: “statistically significant difference” and simply say “different”.
Classifying Underlying Cause of Death
Deaths are classified by the information recorded on death certificates by the certifier of the death. The standard coding system used to classify deaths in the US since 1999 is the International Classification of Diseases, Tenth Revision (ICD-10), developed by the World Health Organization (WHO)4. An underlying cause of death is defined as the cause of death that initiates the chain of events leading to a person’s death. However, it is sometimes difficult to select the appropriate underlying cause of death among the many cause of death terms represented on a typical death certificate, some of which may be ill-defined causes that do not contain useful information (e.g., “sudden death”).WHO designed a standardized set of rules to select an underlying cause of death from information on the death certificate. To improve the ease and consistency of classifying deaths, the National Center for Health Statistics (NCHS) has been developing computerized systems since 1967 to automate the entry, classification, and retrieval of cause-of-death information reported on death certificates. New Hampshire relies on these automated systems for nearly all the coded causes of death in its certificate
NH DHHS, DIVISION OF PUBLIC HEALTH SERVICES — HEALTH STATISTICS AND DATA MANAGEMENTLEADING CAUSES OF DEATH OF NEW HAMPSHIRE RESIDENTS, 1999 – 2001 APRIL 2005 3

Introduction
database. A small percentage (<5%) of records are coded by hand using the same rules as the automated system.
Leading Cause of Death Groups
The National Center for Health Statistics (NCHS) developed a protocol to classify most of the commonly used underlying causes of death into cause of death groups. For ICD-10, NCHS defined 113 selected causes of death (for all age groups) and 130 selected causes of infant death. For ranking causes of death, NCHS selected a subset of the 113 selected causes to form the 50 leading cause of death group5. NCHS cause of death group names are used in this report with the exception of “Accidents”. We prefer to use the group name “Unintentional Injuries”, which better reflects the preferences of the injury prevention and epidemiology community.
Data Quality and the Death Classification Process
The procedure of adding the underlying cause of death to the electronic death certificate database involves a multi-step process that takes text entries from death certificates and translates this information into the cause of death codes6. Additional standard procedures are then used to select the underlying cause of death from among these codes. Every step of this process is open to potential error, from the entries on the death certificate to the final assignment of the underlying cause of death. Some of the error is due to subjectivity and imprecision in diagnosis; physicians might disagree on an individual’s cause of death or might fill out the certificate in different ways. The true underlying cause of death may be unknown. Recording errors are possible. Individuals may die of more than one cause, but only one cause is selected as the underlying cause of death. Within a given cause of death category, such as Diseases of the Heart, not all deaths caused by heart disease are the same and most heart disease deaths have contributing causes other than heart disease. In fact, it can be argued that no two human deaths are exactly the same and any system to group deaths is subject to error and loss of information. However, the classification system, with all of its uncertainty and potential for error, is still valuable from a public health perspective. If there is error and misclassification, it is believed that the error and misclassification is consistent across populations and that valid comparisons can be made.
Combining Multiple Years of Data
This report includes three years of data, 1999-2001, primarily to increase the number of events used to estimate rates and frequencies. The result is statistics that are less likely to be affected by random variability and the ability to report on some causes of death that could not otherwise be reported due to small numbers for a single year.
Reporting at the Town Level
New Hampshire is divided into 10 counties, and further divided into 235 cities and towns and 24 unincorporated areas. New Hampshire residents are often interested in what is happening at the town or sub-town level. Because of small numbers, it is not possible to come up with meaningful statistics for every town. Based on the problem of small numbers and graphical considerations, the decision was made to omit town-level data for towns with less than 450 total deaths during the three-year period. In addition,
NH DHHS, DIVISION OF PUBLIC HEALTH SERVICES — HEALTH STATISTICS AND DATA MANAGEMENTLEADING CAUSES OF DEATH OF NEW HAMPSHIRE RESIDENTS, 1999 – 2001 4 APRIL 2005

Introduction
rates are not shown whenever there are less than 10 deaths in a category because the small numbers result in uncertain rate calculations that are apt to be highly variable and not useful for comparisons.
Age Groups
We generally employ the age group distribution used for standardized rate calculations by NCHS for mortality statistics7. One frequently asked question is why we do not present data for a single age group of 65 years and older. Since most deaths occur in the elderly, it is valuable to include data for the separate age groups of 65-74, 75-84, and 85 years and over. To combine these age groups into a single 65 plus age group results in loss of information. On the other hand, it is sometimes desirable to pool age groups when there are a small number of deaths in a category.
Race/Ethnicity
New Hampshire’s population has become more racially and ethnically diverse over the past 20 years. However, New Hampshire still has a predominately white, non-Hispanic population with just over 95% of residents reporting race/ethnicity as white, non-Hispanic on the 2000 US Census8. Because of this fact, there are small numbers of non-white and/or Hispanic deaths based on overall population percentages.
An additional factor relating to fewer deaths among non-whites and Hispanics is that this population is generally younger than the white population in New Hampshire.Over 78% of New Hampshire deaths occur among individuals age 65 and over.According to the 2000 Census in New Hampshire, this age group was composed of only a quarter of a percent black/African, less than half a percent Asian, and less than half a percent Hispanic. People reporting two or more races made up slightly less than half of a percent of the 65 and older population. In contrast, over 98% of the people in 65 and older age group reported themselves to be white and non-Hispanic9.
The small number of deaths of non-white and non-Hispanics does not lessen the importance of minority health issues, but does make it difficult to report substantive numbers for non-white death rates due to small numbers. Tables are presented to show the frequencies of deaths among major race categories and by Hispanic/ non-Hispanic ethnicity. Numbers are sufficient to report standardized rates for African American’s for Invasive Cancer and Diseases of Heart, but confidence intervals are too wide to state with certainty that rates for African American’s are different than for whites in New Hampshire. CDC Wonder was used to estimate populations and deaths because it is necessary to use special “bridging” procedures to combine Census data, which allows for multiple race classifications, with Vital Records Death Certificate data, which uses an older race classification system that doesn’t allow individuals to claim more than one race. We added confidence intervals to the data obtained from CDC Wonder. CDC Wonder did not have information to help us estimate standardized Asian death rates.Hispanic rates were not calculated because the high number of unknowns makes it difficult to estimate the correct denominators, but frequencies are shown for deaths where Hispanic ethnicity was known10.
NH DHHS, DIVISION OF PUBLIC HEALTH SERVICES — HEALTH STATISTICS AND DATA MANAGEMENTLEADING CAUSES OF DEATH OF NEW HAMPSHIRE RESIDENTS, 1999 – 2001 APRIL 2005 5

Introduction
New Chronic Lower Respiratory Disease Classification
Chronic lower respiratory disease (CLRD) is the fourth leading cause of death nationally. Prior to 1999, CLRD was called chronic obstructive pulmonary disease (COPD). The recent ICD-10 disease classifications (1999) slightly altered the grouping of respiratory diseases included in CLRD from the previous COPD grouping. For trend analysis, this new grouping cannot be compared directly with the International Classification of Diseases, Ninth Revision (ICD-9) for COPD used in previous years. (See “Frequently Asked Questions” #6 for comments about the use of trend data in this report.)
Risk Factors and Interventions
Risk factors are factors associated with increased risk of disease and death. This paper restricts discussion of risk factors to those that are well accepted by reputable sources.Other risk factors may be known but not validated, or simply unknown. Factors that increase risk of disease may vary in their impact on risk of death. Some risk factors are modifiable and some are not. Interventions to reduce known risk factors vary in effectiveness and the degree of effectiveness may be unknown. Outcome measurements help to evaluate the effectiveness of interventions and reports such as this are one source of data to assist with such measurements. This report does not attempt to provide a comprehensive discussion of the important subject of risk factors and interventions, but attempts to suggest the more important and currently accepted ideas as an introduction to the subject.
Since everyone dies from some cause, reducing the risk of one cause of death may result in more people dying from other causes. For example, reducing cancer rates may result in increasing Alzheimer’s or heart disease deaths. The data from this report can be used to suggest possible shifts in death rates resulting from successful interventions.From a public health perspective, it may not be enough to simply reduce death rates.We should examine available data to help clarify and prioritize our goals and objectives, and give careful thought to how we can work most effectively to improve both quality and length of life.
Data Source
The Division of Vital Records Administration within the New Hampshire Department of State is responsible for collecting information on deaths to NH residents and deaths occurring in NH, as mandated by RSA 5-C. Information about out-of-state deaths to NH residents is collected by the state where the death occurs and reported to NH through an interstate exchange agreement.
Death data consists of information from a Death Certificate including but not limited to:sex, age, residence, occupation and education of the deceased, location and date of death, and the underlying cause of death as well as up to 14 contributing causes of death. Much of the information on the certificate is collected specifically for public health purposes. Under RSA 126:24, the Department of Health and Human Services has access to death certificate data and is responsible for analyzing it for health-related needs, such as this report.
NH DHHS, DIVISION OF PUBLIC HEALTH SERVICES — HEALTH STATISTICS AND DATA MANAGEMENTLEADING CAUSES OF DEATH OF NEW HAMPSHIRE RESIDENTS, 1999 – 2001 6 APRIL 2005

Introduction
Information is complete and available for analysis approximately 18 months after the close of a calendar year. The most recent death data available for analysis at the time of this report is calendar year 2001.
NH DHHS, DIVISION OF PUBLIC HEALTH SERVICES — HEALTH STATISTICS AND DATA MANAGEMENTLEADING CAUSES OF DEATH OF NEW HAMPSHIRE RESIDENTS, 1999 – 2001 APRIL 2005 7

Frequently Asked Questions
Frequently Asked Questions 1. How do I know if differences are “statistically significant?”
Confidence intervals are valuable to give us an indication of the uncertainty of an estimate and to suggest possible differences for further research. Overlapping or non-overlapping confidence intervals function as a test of statistical significance. There is always some degree of uncertainty with such tests.
Type I error is deciding there is a difference when there really isn’t one. With a 95%confidence interval, the probability of a Type I error is 5%. When making multiple comparisons, the probability of making at least one Type I error increases.
A second type of error is the Type II error, which is the probability of deciding there is no difference when there really is one. The probability of a Type II error increases when there are small numbers. Overlapping confidence intervals (suggesting no difference) may be a Type II error. One source of Type II error is that the comparison of confidence intervals is based on separate variance estimates for each rate, while the preferred comparison test uses a pooled variance calculation and is more accurate.
2. Why aren’t rates reported with less than 10 events in the numerator?
The relative width of confidence intervals (as a percentage of the rate) increases rapidly with fewer than 10 numerator events. While some degree of uncertainty is always present (the reason for confidence intervals in the first place), this uncertainty increases exponentially as the numerator becomes smaller. Rates based on numerators with fewer than 10 events are not reported to avoid the risk of these numbers being misinterpreted.
3. I don’t understand rates. It seems that everyone who reaches age 85 will die in the 85 plus age group so why aren’t all the rates in the 85 plus age group the same (100%)?
Rates are explained in the technical appendix. Crude rates or age-specific rates are simply the number of deaths per year divided by population. The phrase “per year” is important. Consider one population where there are 100 individuals over 85-years-old and they all die in one year. The rate would be equivalent to 100% or “1”. However, consider another population of 100 85-year-olds where 10 of them die each year. Each year the rate will be 10%. Even though all members of both groups eventually die, the rates of 100% and 10% are certainly different, and can be used to compare the relative risk of dying in each group.
NH DHHS, DIVISION OF PUBLIC HEALTH SERVICES — HEALTH STATISTICS AND DATA MANAGEMENTLEADING CAUSES OF DEATH OF NEW HAMPSHIRE RESIDENTS, 1999 – 2001 8 APRIL 2005

Frequently Asked Questions
4. Why set an upper limit of age 75 in the Years of Potential Life Lost table?
The years of potential life lost table is intended to show the impact of the age of death in ranking the causes of death. Some tables like this use age 65 or age 85 as the upper limit. An arbitrary upper limit must be defined because life expectancy changes as an individual ages. Every year a person survives pushes up that person’s life expectancy. For example, an individual who is 80 years old has a better chance of living to age 85 than a 20 year-old does. Limits such as age 65 give more emphasis to deaths affecting young people and may be an arbitrary limit for quality of life and ability to perform useful work in society. While using age 85 includes more years of potential life lost, the deaths affecting younger people are less prominent in the ranking and deaths from heart disease and invasive cancer rank more highly. Age 75 serves as a compromise upper limit.
5. It is now 2005, why doesn’t the report include more recent data?
While most data are collected on a reasonably timely basis, some data (especially data collected by other states) are not available for a considerable period of time. There are also necessary delays in data release related to acquisition, data quality evaluation and correction, and database management. Health Statistics and Data Management (HSDM) is committed to doing what it can to improve the timeliness of data availability.At the time of this report, the most recent available data was 2001.
6. Why is there so little trend data in this report?
Most of the data examined by year between 1999 and 2001 failed to show significant trends, possibly as a result of small numbers. Pooling 3 years of data produced tighter confidence intervals and allowed meaningful rates for several less common causes of death in New Hampshire. For the ten leading causes of death, the report does include annual rates for the state.
A larger issue is that the cause of death classification system changed from ICD-9 to ICD-10 in 1999. For trend analysis going further back, the ICD-9 coding system and code groups used before 1999 are not equivalent to those used in ICD-10. Attempts to trend data for many cause of death groups show a discontinuity in graph lines between 1998 and 1999. To address this problem, the National Center for Health Statistics (NCHS) developed comparability ratios based on one year (1996) of deaths nationally, classified both by the ICD-9 and ICD-10 systems. While comparability ratios are not used in this report, it may be of interest, as an example, that the NCHS study obtained a comparability ratio of 1.0478 for Lower Respiratory Disease, thus approximately 5 percent more deaths were classified as CLRD under ICD-10 than as COPD under ICD-911.
7. Are age-adjusted rates within this report comparable to age-adjusted rates from prior reports?
NCHS has instructed states to treat ICD-10 as the standard, and adjust data counts and rates prior to 1999 using modified ICD-9 codes and comparability ratios. Therefore, mortality statistics provided in this report are not comparable to previously published mortality statistics based on ICD-9 codes.
NH DHHS, DIVISION OF PUBLIC HEALTH SERVICES — HEALTH STATISTICS AND DATA MANAGEMENTLEADING CAUSES OF DEATH OF NEW HAMPSHIRE RESIDENTS, 1999 – 2001 APRIL 2005 9

Frequently Asked Questions
8. How does New Hampshire compare to the rest of the US?
Most tables show US rates for comparison. If the US rate is not contained in the NH confidence interval, then NH may be different than the US. Confidence intervals for the US rate are not shown because they involve relatively high numbers and very narrow confidence intervals. One factor to consider is that the US population is more ethnically and racially diverse than NH. Since some ethnic groups have higher rates for certain causes of death, NH rates may be different because the underlying populations are not ethnically equivalent. However, the overall US rate is a commonly used standard and the comparison is valuable.
9. Why is the term “Diseases of the Heart” used instead of “Heart Disease”?
Heart disease is any condition that causes the heart to malfunction and should be considered interchangeable with “diseases of the heart”. However, when the words "heart disease" are used generically, most people only think of coronary heart disease, which leads to heart attacks and angina, and is caused by atherosclerosis. It is important to know that there are a wide range of other diseases of the heart including congestive heart failure, valvular heart disease (heart valves), diseases of the pericardium (sac around the heart), diseases of the myocardium (heart muscle), endocarditis (infection of heart valves), and congenital heart disease (birth defects of the heart).
10. Why are some towns and cities and not others chosen for study within the leading causes of death section of this report?
The decision was made to omit town-level data for towns with fewer than 150 average deaths per year. This decision was made based on the number of leading causes death that would be reportable for the smaller towns. Causes with fewer than 5 deaths are not reportable at the town-level because of confidentiality concerns. In addition, rates are not shown for any towns where there are fewer than 10 deaths in a category because the small numbers lead to unstable rate calculations.
11. Who can I contact if I have additional questions or need more information?
Please feel free to contact Health Statistics and Data Management:
Ann Bennett, Program Assistant Department of Health and Human Services OMBP, BHCR 129 Pleasant Street Concord, NH 03301-3857 Telephone: 603-271-5926 or 1-800-852-3345, Ext. 5926
An electronic version of this report is available on the DHHS web site: http://www.dhhs.nh.gov/DHHS/DPHS
NH DHHS, DIVISION OF PUBLIC HEALTH SERVICES — HEALTH STATISTICS AND DATA MANAGEMENTLEADING CAUSES OF DEATH OF NEW HAMPSHIRE RESIDENTS, 1999 – 2001 10 APRIL 2005
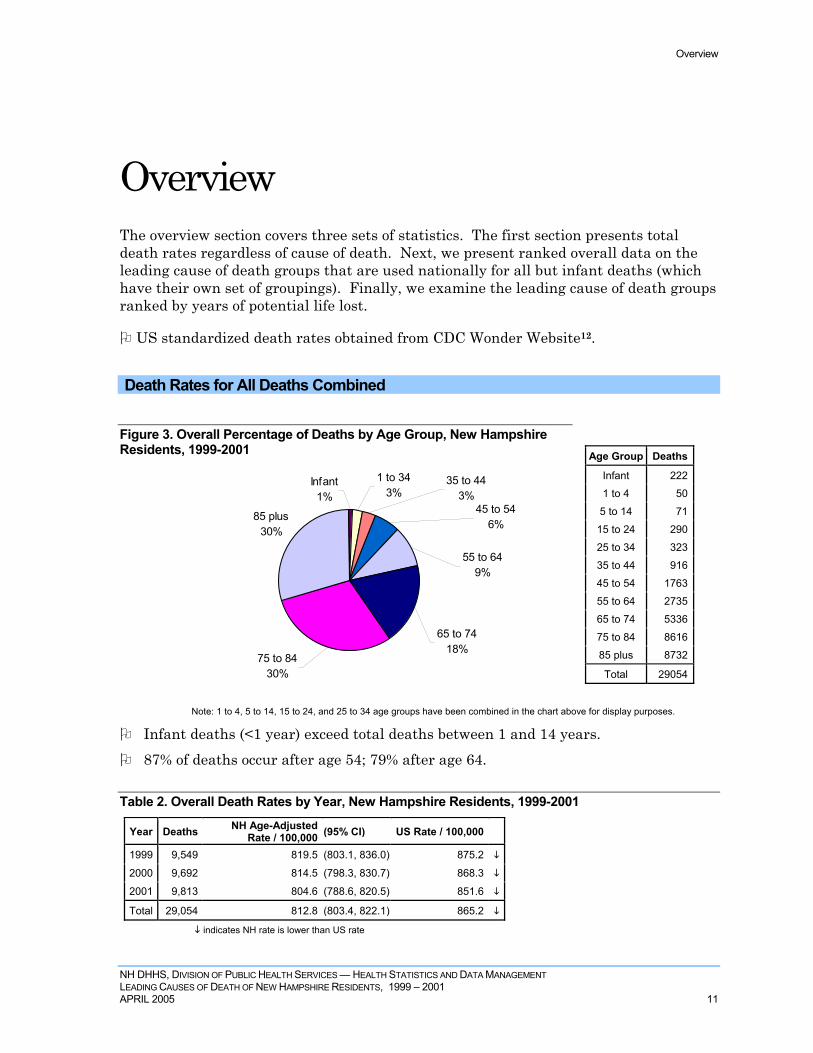
Overview
OverviewThe overview section covers three sets of statistics. The first section presents total death rates regardless of cause of death. Next, we present ranked overall data on the leading cause of death groups that are used nationally for all but infant deaths (which have their own set of groupings). Finally, we examine the leading cause of death groups ranked by years of potential life lost.
US standardized death rates obtained from CDC Wonder Website12.
Death Rates for All Deaths Combined
Figure 3. Overall Percentage of Deaths by Age Group, New Hampshire Residents, 1999-2001
85 plus30%
55 to 649%
45 to 546%
35 to 443%
1 to 343%
Infant1%
65 to 7418%
75 to 8430%
Age Group Deaths
Infant 222
1 to 4 50
5 to 14 71
15 to 24 290
25 to 34 323
35 to 44 916
45 to 54 1763
55 to 64 2735
65 to 74 5336
75 to 84 8616
85 plus 8732
Total 29054
Note: 1 to 4, 5 to 14, 15 to 24, and 25 to 34 age groups have been combined in the chart above for display purposes.
Infant deaths (<1 year) exceed total deaths between 1 and 14 years. 87% of deaths occur after age 54; 79% after age 64.
Table 2. Overall Death Rates by Year, New Hampshire Residents, 1999-2001
Year Deaths NH Age-AdjustedRate / 100,000 (95% CI) US Rate / 100,000
1999 9,549 819.5 (803.1, 836.0) 875.2
2000 9,692 814.5 (798.3, 830.7) 868.3
2001 9,813 804.6 (788.6, 820.5) 851.6
Total 29,054 812.8 (803.4, 822.1) 865.2
indicates NH rate is lower than US rate
NH DHHS, DIVISION OF PUBLIC HEALTH SERVICES — HEALTH STATISTICS AND DATA MANAGEMENTLEADING CAUSES OF DEATH OF NEW HAMPSHIRE RESIDENTS, 1999 – 2001 APRIL 2005 11

Overview
Overall deaths increased each year from 1999 to 2001, while age-adjusted death rates have decreased. The overall New Hampshire rate is lower than the US rate, although the US rate appears to have declined more quickly over the period. NH rates are lower mainly because New Hampshire has much lower rates than the US for diseases of the heart, homicide, and HIV.
Figure 4. Overall Death Rates by Age Group and Gender, New Hampshire Residents, 1999-2001
02,0004,0006,0008,000
10,00012,00014,00016,00018,00020,000
Infa
nt
1 to
4
5 to
14
15 to
24
25 to
34
35 to
44
45 to
54
55 to
64
65 to
74
75 to
84
85 p
lus
Age
-Spe
cific
Rat
e / 1
00,0
00 Male
Female
Total
Note: 95% confidence interval for the statistic is indicated through the use of the error bars above and below the top of each linein this graph. Overlapping confidence bars indicate a lack of significant difference.
Figure 5. Detail on Deaths for Under 55 Year Old Age Groups, New Hampshire Residents, 1999-2001
0
100
200
300
400
500
600
700
Infa
nt
1 to
4
5 to
14
15 to
24
25 to
34
35 to
44
45 to
54
Age
-Spe
cific
Rat
e / 1
00,0
00 Male
Female
Total
Note: 95% confidence interval for the statistic is indicated through the use of the error bars above and below the top of each linein this graph. Overlapping confidence bars indicate a lack of significant difference.
NH DHHS, DIVISION OF PUBLIC HEALTH SERVICES — HEALTH STATISTICS AND DATA MANAGEMENTLEADING CAUSES OF DEATH OF NEW HAMPSHIRE RESIDENTS, 1999 – 2001 12 APRIL 2005

Overview
Note that the death rate for infants is higher that the death rates for all age groups under age 55. Male death rates are higher than female death rates for every age group. There are more male deaths than female deaths for every age group under age 75.
Table 3. Overall Death Rates by Age Group and Sex, New Hampshire Residents, 1999-2001
Male Female Total USAgeGroup Deaths Rate /
100,000 95% CI Deaths Rate / 100,000 95% CI Deaths Rate /
100,000 95% CI Rate
Infant 121 545.6 (448.4, 642.8) 101 478.5 (385.2, 571.9) 222 512.9 (445.4, 580.3) 693.6
1 to 4 27 28.2 (18.6, 41.1) 23 25.6 (16.3, 38.5) 50 27.0 (20.0, 35.6) 33.3
5 to 14 44 15.8 (11.5, 21.2) 27 10.1 (6.7, 14.7) 71 13.0 (10.2, 16.4) 18.0
15 to 24 209 88.2 (76.3, 100.2) 81 34.8 (27.6, 43.2) 290 61.7 (54.6, 68.8) 79.9
25 to 34 231 96.2 (83.8, 108.6) 92 37.7 (30.4, 46.2) 323 66.7 (59.4, 74.0) 102.8
35 to 44 598 182.9 (168.2, 197.5) 318 95.7 (85.2, 106.2) 916 138.9 (129.9, 147.9) 200.0
45 to 54 1,083 393.9 (370.4, 417.3) 680 246.3 (227.8, 264.8) 1,763 319.9 (305.0, 334.8) 424.2
55 to 64 1,672 1,014.4 (965.8, 1,063.0) 1,063 634.1 (596.0, 672.2) 2,735 822.6 (791.8, 853.5) 986.7
65 to 74 3,092 2,827.7 (2,728.0, 2,927.4) 2,244 1,793.6 (1,719.4, 1,867.8) 5,336 2,275.9 (2,214.8, 2,336.9) 2402.9
75 to 84 4,204 6,872.6 (6,664.9, 7,080.4) 4,412 4,771.9 (4,631.1, 4,912.7) 8,616 5,608.4 (5,489.9, 5,726.8) 5652.5
85 plus 2,746 18,175.4 (17,495.6,18,855.3) 5,986 14,968.5 (14,589.3, 15,347.7) 8,732 15,847.8 (15,515.4, 16,180.2) 15,339.2
Age-Adjusted
Total14,027 984.4 (967.6, 1001.2) 15,027 687.8 (676.7, 698.9) 29,054 812.8 (803.4, 822.1) 865.2
Notice that New Hampshire total death rates are lower than US death rates for every age group except 85 plus. Although the NH total 85 plus group appears to have a higher death rate, the confidence intervals overlap, so there is no reason to believe they are statistically different.
NH DHHS, DIVISION OF PUBLIC HEALTH SERVICES — HEALTH STATISTICS AND DATA MANAGEMENTLEADING CAUSES OF DEATH OF NEW HAMPSHIRE RESIDENTS, 1999 – 2001 APRIL 2005 13

Overview
Figure 6. Overall Death Rates by County, New Hampshire Residents, 1999-2001
0
200
400
600
800
1000
1200
Bel
knap
Car
roll
Che
shire
Coo
s
Gra
fton
Hill
sbor
ough
Mer
rimac
k
Roc
king
ham
Stra
fford
Sul
livan
Stan
dard
ized
Rat
e / 1
00,0
00
US Rate
NH Rate
Note: 95% confidence interval for the statistic is indicated through the use of the error bars above and below the top of each column in this graph. Overlapping confidence bars indicate a lack of significant difference.
Coos County has a higher death rate than the rest of NH, but not different from the US rate. Carroll and Grafton counties have lower rates. Please see the frequently askedquestion about interpretation of confidence intervals on page 8.
Table 4. Overall Death Rates by County, New Hampshire Residents, 1999-2001
County DeathsAge-
AdjustedRate
(95% CI)
Belknap 1,658 847.1 (806.2, 888.0) Carroll 1,261 752.8 (710.7, 794.9) Cheshire 2,036 850.2 (813.2, 887.2) Coos 1,278 925.1 (873.6, 976.6) Grafton 1,999 766.6 (733.0, 800.3) Hillsborough 8,124 807.1 (789.5, 824.7) Merrimack 3,397 796.2 (769.2, 823.1) Rockingham 5,560 812.1 (790.6, 833.7) Strafford 2,479 827.4 (794.7, 860.0) Sullivan 1,251 870.9 (822.5, 919.4) Unknown 11
NH 29,054 812.8 (803.4, 822.1)
US 865.2
NH DHHS, DIVISION OF PUBLIC HEALTH SERVICES — HEALTH STATISTICS AND DATA MANAGEMENTLEADING CAUSES OF DEATH OF NEW HAMPSHIRE RESIDENTS, 1999 – 2001 14 APRIL 2005

Overview
Figure 7. Overall Death Rates by Selected Cities and Towns, New Hampshire Residents, 1999-2001
0
200
400
600
800
1,000
1,200
Bed
ford
Ber
lin
Cla
rem
ont
Con
cord
Der
ry
Dov
er
Exe
ter
Kee
ne
Laco
nia
Man
ches
ter
Nas
hua
Por
tsm
outh
Roc
hest
er
Sal
em
Age
-Adj
uste
d R
ate
/ 100
,000
US Rate
NH Rate
Note: Only cities and towns with a total of 300 or more resident deaths between the years 1999 and 2001 are included in this table.
Town data does not always coincide with respective county data. With the exception of Berlin in Coos County, Manchester, Derry, Rochester, and Claremont show high death rates while their respective counties have normal rates. One possibility is a difference between rural vs. urban within counties. Another possibility is location of nursing homes. For example, Claremont has one of the largest nursing homes in NH.10% of deaths in New Hampshire occur to Manchester residents.43% of NH deaths occur to residents of the 14 largest towns (listed below).
NH DHHS, DIVISION OF PUBLIC HEALTH SERVICES — HEALTH STATISTICS AND DATA MANAGEMENTLEADING CAUSES OF DEATH OF NEW HAMPSHIRE RESIDENTS, 1999 – 2001 APRIL 2005 15

Overview
Table 5. Overall Death Rates by Selected Cities and Towns, New Hampshire Residents, 1999-2001
City / Town Deaths
Age-Adjusted
Rate / 100,000
(95% CI)
Bedford 452 801.7 (725.9, 877.5) Berlin 475 921.3 (833.9, 1,008.7) Claremont 493 980.4 (893.0, 1,067.7) Concord 1,224 809.5 (762.4, 856.6) Derry 524 920.7 (838.3, 1,003.0) Dover 782 842.4 (782.4, 902.5) Exeter 511 792.5 (720.6, 864.5) Keene 726 865.3 (801.3, 929.3) Laconia 610 876.9 (805.6, 948.2) Manchester 2,916 867.1 (835.5, 898.7) Nashua 1,918 790.5 (755.0, 825.9) Portsmouth 719 870.1 (805.4, 934.8) Rochester 817 937.6 (873.2, 1,002.0) Salem 584 778.5 (714.5, 842.6)
NH 29,054 812.8 (803.4, 822.1) US 865.2
NH DHHS, DIVISION OF PUBLIC HEALTH SERVICES — HEALTH STATISTICS AND DATA MANAGEMENTLEADING CAUSES OF DEATH OF NEW HAMPSHIRE RESIDENTS, 1999 – 2001 16 APRIL 2005

Overview
Overview of Leading Causes of Death in New Hampshire
Figure 8, below, shows frequencies of deaths by category. This is useful for comparing the relative burden of deaths in society from different causes.
Figure 8. Total Number of Deaths by Leading Cause, New Hampshire Residents, 1999-2001
0500
1,0001,5002,0002,5003,0003,5004,0004,5005,0005,5006,0006,5007,0007,5008,0008,5009,000
Dis
ease
s of
Hea
rtIn
vasi
ve C
ance
rC
ereb
rova
scul
ar D
isea
seC
hron
ic L
ow. R
esp.
Uni
nten
tiona
l Inj
urie
sD
iabe
tes
Alz
heim
er's
Flu
& P
neum
onia
Sui
cide
Nep
hriti
sLi
ver D
isea
seA
ortic
Ane
urys
mP
arki
nson
'sA
ther
oscl
eros
isB
enig
n N
eopl
asm
sH
yper
tens
ion
Sep
ticem
iaP
erin
atal
Con
ditio
nsP
neum
oniti
sC
onge
nita
l Abn
orm
aliti
esH
omic
ide
Pep
tic U
lcer
Gal
lbla
dder
Dis
orde
rsN
utrit
iona
l Def
icie
ncie
sA
nem
ias
Med
ical
Com
plic
atio
nsH
IVV
iral H
epat
itis
Her
nia
Dea
ths
Ten leadingcauses of death
Note: This table includes infant deaths grouped in accordance with the National Center for Health Statistics list of 113 selectedcauses of death.
Heart disease is the leading cause of death in New Hampshire with invasive cancer second. Together, cancer and heart disease account for 54% of all deaths.
NH DHHS, DIVISION OF PUBLIC HEALTH SERVICES — HEALTH STATISTICS AND DATA MANAGEMENTLEADING CAUSES OF DEATH OF NEW HAMPSHIRE RESIDENTS, 1999 – 2001 APRIL 2005 17

Overview
Table 6. Leading Causes of Death, New Hampshire Residents, 1999-2001
Leading Cause DeathsAge-
AdjustedRate /
100,000(95% CI) US Rate /
100,000Comparison
ofNH to US
Diseases of Heart 8,408 236.1 (231.0, 241.1) 258.3
Invasive Cancer 7,287 202.0 (197.4, 206.7) 198.6
Cerebrovascular Disease 1,968 55.7 (53.3, 58.2) 60.0
Chronic Low. Resp. 1,791 50.7 (48.3, 53.0) 44.4
Unintentional Injuries 1,038 28.4 (26.7, 30.1) 33.9
Diabetes 885 24.8 (23.2, 26.5) 25.1
Alzheimer’s 846 24.1 (22.4, 25.7) 17.8
Flu & Pneumonia 591 16.7 (15.4, 18.1) 23.0
Suicide 455 12.1 (11.0, 13.2) 10.5
Nephritis 335 9.5 (8.4, 10.5) 13.5
Liver Disease 297 8.0 (7.1, 8.9) 10.9
Aortic Aneurysm 229 6.5 (5.6, 7.3) 5.6
Parkinson’s 226 6.5 (5.6, 7.3) 5.6
Atherosclerosis 218 6.2 (5.4, 7.0) 5.2
Benign Neoplasms 202 5.7 (4.9, 6.5) 4.9
Hypertension 196 5.5 (4.8, 6.3) 15.1
Septicemia 188 5.3 (4.5, 6.0) 11.3
Perinatal Conditions 123 3.7 (3.1, 4.4) 4.8
Pneumonitis 130 3.7 (3.1, 4.3) 5.9
Congenital Abnormalities 106 3.0 (2.5, 3.6) 3.7
Homicide 65 1.8 (1.4, 2.2) 6.3
Peptic Ulcer 66 1.8 (1.4, 2.3) 1.6
Gallbladder Disorders 41 1.2 (0.8, 1.6) 1.0
Nutritional Deficiencies 41 1.2 (0.8, 1.6) 1.4
Anemias 40 1.1 (0.8, 1.5) 1.6
Medical Complications 37 1.0 (0.7, 1.4) 1.1
HIV 39 1.0 (0.7, 1.4) 5.1
Viral Hepatitis 35 0.9 (0.6, 1.2) 1.9
Hernia 22 0.6 (0.4, 0.9) 0.5Note: This table includes only leading causes of death where 20 or more deaths have occurred
indicates NH rate is lower than US rate, indicates NH rate is higher than US rate
Compared to the US, New Hampshire has higher death rates for chronic lower respiratory disease, Alzheimer’s disease, suicide, and atherosclerosis. New Hampshire has lower rates for heart disease, cerebrovascular disease, unintentional injuries, influenza and pneumonia, nephritis, liver disease, hypertension, septicemia, perinatal conditions, pneumonitis, congenital abnormalities, homicide, anemias, HIV, and viral hepatitis.
Years of Potential Life Lost
When calculating the years of potential life lost, it is assumed that an individual’s life expectancy will be 75 years. The difference between a person’s age at death and 75
NH DHHS, DIVISION OF PUBLIC HEALTH SERVICES — HEALTH STATISTICS AND DATA MANAGEMENTLEADING CAUSES OF DEATH OF NEW HAMPSHIRE RESIDENTS, 1999 – 2001 18 APRIL 2005

Overview
amounts to the number of years of potential life lost for that individual. Individuals who live beyond 75 years of age are excluded from these results.
While heart disease is the leading cause of death, cancer is responsible for more years of potential life lost when age 75 is set as the upper limit. Unintentional injuries rank third. Causes of death more common among young people will rank higher in this chart, such as unintentional injuries, suicide, perinatal conditions, and congenital deformities.
Figure 9. Years of Potential Life Lost, Life Expectancy of 75 Years, New Hampshire Residents, 1999–2001
389
520
7557871225
1247
129013071604
2067
359245044702
4793
59959132
14633
26560
3317155354
335319
119
0
5,00
0
10,0
00
15,0
00
20,0
00
25,0
00
30,0
00
35,0
00
40,0
00
45,0
00
50,0
00
55,0
00
60,0
00
Parkinson's
AtherosclerosisA lzheimer's
Peptic UlcerHypertension
Aortic AneurysmViral Hepatitis
Benign NeoplasmsSepticemia
HIVNephritis
Flu & PneumoniaHomicide
Liver Disease
CerebrovascularDiabetes
Congenital AbnormalitiesChronic Low . Resp.
Perinatal ConditionsSuicide
Unintentional InjuriesDiseases of Heart
Invasive Cancer
Note: Years of potential life lost are calculated only when 20 or more individuals under age 75 died of a particular cause of death.
NH DHHS, DIVISION OF PUBLIC HEALTH SERVICES — HEALTH STATISTICS AND DATA MANAGEMENTLEADING CAUSES OF DEATH OF NEW HAMPSHIRE RESIDENTS, 1999 – 2001 APRIL 2005 19

Overview
Leading Causes of Death by Race and Hispanic Ethnicity
Table 7. Leading Causes of Death by Race, New Hampshire Residents, 1999-2001
Leading Causes of Death Asian
AfricanAmerican
/ BlackHawaiian American
Indian Other Unknown White
Diseases of Heart 20 21 1 12 0 4 8350Invasive Cancer 29 27 0 5 0 8 7218Cerebrovascular 6 9 0 0 0 2 1951CLRD 4 4 0 2 1 0 1780Unintentional Injuries 5 11 0 0 0 5 1017Diabetes 3 4 0 1 0 1 876Alzheimer's 0 4 0 0 0 0 842Flu & Pneumonia 3 2 0 1 0 0 585Suicide 7 2 0 1 0 2 443Nephritis 1 2 0 0 0 1 331Other 15 25 1 7 0 18 5384Total 93 111 2 29 1 41 28777
Note: race groupings are based on Vital Records race codes in use for the period reported. Hawaiian includes part Hawaiian; American Indian Includes North, Central, and South American, Eskimo & Aleut; Asian includes non-Hawaiian Pacific islanders, Filipinos, as well as other non-white Asian populations.
Table 8. Leading Causes of Death by Ethnicity (any Race), New Hampshire Residents, 1999-2001 Leading Causes of Death Hispanic Non-
Hispanic Unknown
Diseases of Heart 13 8134 261Invasive Cancer 17 7081 189Cerebrovascular 7 1905 56CLRD 4 1722 65Unintentional Injuries 15 970 53Diabetes 2 864 19Alzheimer's 1 816 29Flu & Pneumonia 2 570 19Suicide 3 437 15Nephritis 1 316 18Other 25 5220 205Total 90 28035 929
Note: ethnicity groupings are based on Vital Records ancestry codes in use for the period reported. Hispanic is made up of the codes for Mexican, Puerto Rican, Cuban, Central or South American, and Other Hispanic. Either Hispanic or non-Hispanic ethnicity could be for anyrace.
NH DHHS, DIVISION OF PUBLIC HEALTH SERVICES — HEALTH STATISTICS AND DATA MANAGEMENTLEADING CAUSES OF DEATH OF NEW HAMPSHIRE RESIDENTS, 1999 – 2001 20 APRIL 2005

Leading Cause of Death by Age
Leading Cause of Death by Age The following chapter presents data by age group. We have chosen to use the age groups that are used nationally for Leading Cause of Death reporting. The age groups are as follows:
Infants (less than one year old) 1 to 4 5 to 14 15 to 24 25 to 34 35 to 44 45 to 54 55 to 64 65 to 74 75 to 84 85 and older
These age groups, with the exception of the infant group, are also used later in the chapter on the ten leading causes of death.
The series of pie charts on the next page present an overview of causes of death by age.Causes of death vary by age. Age groups are arranged in order and colors are consistent by cause of death category. It is useful to scan the pie charts from top to bottom in each column to compare proportions. Total deaths are shown on the left of each chart.Because these are percentages of the total and not rates based on the population, pie slices that are larger only indicate the relative burden within the age group. If a pie slice is larger in one age group than another, it only indicates that the cause is a greater proportion of the total for that group, not necessarily that it has a higher number of deaths or a higher rate.
Notice that invasive cancer increases as a proportion of age-specific deaths into middle age and then decreases among the elderly.Unintentional injury deaths increase among young people and then become proportionately less prominent after age 55.
NH DHHS, DIVISION OF PUBLIC HEALTH SERVICES — HEALTH STATISTICS AND DATA MANAGEMENTLEADING CAUSES OF DEATH OF NEW HAMPSHIRE RESIDENTS, 1999 – 2001 APRIL 2005 21

Leading Cause of Death by Age
Figure 10. Leading Causes of Death by Age, New Hampshire Residents, 1999–2001*
Ages1-4
Ages45-54
50Deaths
Other76%
UnintentInjuries
24%
1,763Deaths
Diseases ofHeart22%
UnintentInjuries
6%
Suicide5%
Other29%
InvasiveCancer
38%
Ages5-14
Ages55-64
71Deaths
InvasiveCancer
17%
Other31%
UnintentInjuries
58%2,735
Deaths
Diseasesof Heart
25%
ChronicLow.Resp.
6%
Other28% Invasive
Cancer41%
Ages15-24
Ages65-74
290Deaths
Other22%
InvasiveCancer
5%
Suicide22%
UnintentInjuries
51% 5,336Deaths
Invasive Cancer36%
Diseases of Heart26%
Chronic Low. Resp.8%
Cerebrovascular5%
Other25%
Ages25-34
Ages75-84
323Deaths
8,616Deaths
InvasiveCancer
25%
Cerebro-vascular
8%
ChronicLow.Resp.
8%
Other30%
Diseasesof Heart
29%
Ages35-44
Ages85
andOlder
916Deaths
8,732Deaths
InvasiveCancer
12%
Diseasesof Heart
38%
Other34%
Alzheimer6%
Cerebro-vascular
10%
UnintentInjuries
30%
Suicide25%
InvasiveCancer
12%
Diseases ofHeart7%
Homicide3%
Other23%
Other29%
UnintentInjuries
18%
InvasiveCancer
26%
Diseasesof Heart
14%
Suicide13%
*Only causes of death responsible for 4% or more of all deaths are represented
NH DHHS, DIVISION OF PUBLIC HEALTH SERVICES — HEALTH STATISTICS AND DATA MANAGEMENTLEADING CAUSES OF DEATH OF NEW HAMPSHIRE RESIDENTS, 1999 – 2001 22 APRIL 2005

Leading Cause of Death by Age
Infants
Figure 11. Leading Causes of Death for Infants, NewHampshire Residents, 1999-2001
Other42%
CongenitalAbnormalities
19%
Short Gestation10%
SIDS9%
PlacentaComplications
9%
MaternalComplications
6%
IntrauterineHypoxia
5%
Infant deaths (defined as deaths in first year of life) are shown separately because they have their own list of leading causes.
For further information about infant deaths, please consult:
1. Child Fatality Review in the United States: A National Overview
2. New Hampshire Births: 1999-2000, (infant mortality section)
(See reference section for detailed citation.)
Table 9. Leading Causes of Death for Infants, New Hampshire Residents, 1999-2001
Infant Leading DeathsCause Groups Male Female Total
Congenital Anomalies 24 18 42
Short Gestation 10 13 23
SIDS 13 8 21
Placenta Complications 14 5 19
Maternal Complications 9 4 13
Intrauterine Hypoxia 3 9 12
Atelectasis 4 3 7
Interstitial Emphysema 1 5 6
Respiratory Distress 1 3 4
Neonatal Hemorrhage 2 2 4
Homicide 2 2 4
Complications of Labor 0 4 4
Circulatory System 3 1 4
Chronic Resp. Disease 3 1 4
Unintentional Injuries 1 2 3
Renal Failure 1 1 2
Noxious Influences 2 0 2
Maternal Conditions 1 1 2
Hydrops Fetalis 0 2 2
Flu & Pneumonia 1 1 2
Bacterial Sepsis 2 0 2
Volume Depletion 1 0 1
Spinal Muscular Atrophy 1 0 1
Septicemia 1 0 1
Pulmonary Hemorrhage 0 1 1
Neonatal Aspiration 0 1 1
Necrotizing Entercolitis 0 1 1
Invasive Cancer 1 0 1
Congenital Pneumonia 1 0 1
Birth Trauma 1 0 1
Benign Neoplasms 1 0 1
Anoxic Brain Damage 0 1 1
Other 17 12 29
Total 121 101 222
NH DHHS, DIVISION OF PUBLIC HEALTH SERVICES — HEALTH STATISTICS AND DATA MANAGEMENTLEADING CAUSES OF DEATH OF NEW HAMPSHIRE RESIDENTS, 1999 – 2001 APRIL 2005 23

Leading Cause of Death by Age
Age 1 to 4
Table 10. Leading Causes of Deaths for Ages 1 to 4 by Gender, New Hampshire Residents, 1999-2001
Age 1 to 4 Deaths
Leading Causes Male Female Total
Unintentional Injuries 7 5 12
Congenital Abnormalities 5 2 7
Invasive Cancer 3 4 7
Benign Neoplasms 0 2 2
Flu & Pneumonia 1 1 2
Homicide 0 1 1
Chronic Lower Respiratory 1 0 1
Diseases of Heart 1 0 1
Infections of Kidney 0 1 1
Other 9 7 16
Total 27 23 50Note: rates not presented due to small numbers
Deaths to infants and children involve relatively small numbers but are important because of the large social weight they carry.
Age 5 to 14
Table 11. Leading Causes of Death Rates for Ages 5 to 14 by Gender, New Hampshire Residents, 1999-2001
Age 5 to 14 Male Female Total
Leading Causes Deaths Rate / 100,000 (95% CI) Deaths Rate /
100,000 (95% CI) Deaths Rate / 100,000 (95% CI) US Rate /
100,000Unintentional Injuries 25 9.0 (5.8, 13.3) 12 4.5 (2.3, 7.9) 37 6.8 (4.8, 9.4) 7.2
Invasive Cancer 7 * 5 * 12 2.2 (1.1, 3.8) 2.5
Suicide 4 * 2 * 6 * 0.7
Cerebrovascular 1 * 0 * 1 * 0.3
Diabetes 0 * 1 * 1 * 0.1
Benign Neoplasms 0 * 1 * 1 * 0.2
Septicemia 1 * 0 * 1 * 0.2
Homicide 0 * 1 * 1 * 0.9
Anemias 0 * 1 * 1 * 0.1Meningococcalinfection 1 * 0 * 1 * 0.1
* Rates are suppressed when based upon fewer than 10 deaths.
Injury prevention may be the best means of reducing deaths among children of all ages.
NH DHHS, DIVISION OF PUBLIC HEALTH SERVICES — HEALTH STATISTICS AND DATA MANAGEMENTLEADING CAUSES OF DEATH OF NEW HAMPSHIRE RESIDENTS, 1999 – 2001 24 APRIL 2005

Leading Cause of Death by Age
Age 15 to 24
Table 12. Leading Causes of Death Rates for Ages 15 to 24 by Gender, New Hampshire Residents, 1999-2001
Age 15 to 24 Male Female Total
Leading Causes Deaths Rate / 100,000 (95% CI) Deaths Rate /
100,000 (95% CI) Deaths Rate / 100,000 (95% CI) US Rate /
100,000UnintentionalInjuries 105 44.3 (35.8, 52.8) 44 18.9 (13.7, 25.4) 149 31.7 (26.6, 36.8) 34.6
Suicide 56 23.6 (17.8, 30.6) 7 * 63 13.4 (10.3, 17.1) 10.1
Invasive Cancer 6 * 9 * 15 3.2 (1.8, 5.3) 4.4
Diseases of Heart 6 * 3 * 9 * 0.4
Homicide 4 * 2 * 6 * 5.0
CLRD 2 * 2 * 4 * 0.2CongenitalAnomalies 3 * 1 * 4 * 0.6
Benign Neoplasms 1 * 2 * 3 * 0.1
Cerebrovascular 1 * 1 * 2 * 0.1
Diabetes 2 * 0 * 2 * 0.1* Rates are suppressed when based upon fewer than 20 deaths.
The suicide rate for 15 to 24 year olds in NH is higher than the US rate.
Age 25 to 34
Figure 12. Leading Causes of Death Rates for Ages 25 to 34 by Gender, New Hampshire Residents, 1999-2001
05
1015202530354045
Uni
nten
tiona
lIn
jurie
s
Sui
cide
Inva
sive
Can
cer
Dis
ease
s of
Hea
rt
Hom
icid
e
Age
-Spe
cific
Rat
e / 1
00,0
00 TotalMaleFemale
* * *
* Age-specific rates have been suppressed when based upon fewer than 10 deaths
Unintentional injuries are the leading cause of death in this age group, but NH has a lower rate than the US rate. Similar to the 15 to 24 year old rate, the suicide rate for 25 to 34 year olds is higher than the US rate.
NH DHHS, DIVISION OF PUBLIC HEALTH SERVICES — HEALTH STATISTICS AND DATA MANAGEMENTLEADING CAUSES OF DEATH OF NEW HAMPSHIRE RESIDENTS, 1999 – 2001 APRIL 2005 25

Leading Cause of Death by Age
Homicide is lower than the US rate.
Table 13. Leading Causes of Death Rates for Ages 25 to 34 by Gender, New Hampshire Residents, 1999-2001
Age 25 to 34 Male Female Total
Leading Causes Deaths Rate / 100,000 (95% CI) Deaths Rate /
100,000 (95% CI) Deaths Rate / 100,000 (95% CI) US Rate /
100,000UnintentionalInjuries 80 33.3 (26.4, 41.4) 15 6.1 (3.4, 10.1) 95 19.6 (15.9, 24.0) 28.4
Suicide 64 26.6 (20.5, 34.0) 17 7 (4.1, 11.2) 81 16.7 (13.3, 20.8) 12.5
Invasive Cancer 23 9.6 (6.1, 14.4) 16 6.6 (3.8, 10.7) 39 8.1 (5.8, 11.1) 9.9
Diseases of Heart 17 7.1 (4.1, 11.4) 7 * 24 5.0 (3.2, 7.4) 7.8
Homicide 7 * 4 * 11 2.3 (1.1, 4.1) 11.3CongenitalAnomalies 3 * 5 * 8 * 1.2
Diabetes 4 * 2 * 6 * 1.5
HIV 5 * 1 * 6 * 6.1ComplicatedPregnancy 0 * 5 * 5 * 0.5
Cerebrovascular 2 * 2 * 4 * 1.5* Rates are suppressed when based upon fewer than 10 deaths.
Age 35 to 44
Figure 13. Leading Causes of Death Rates for Ages 35 to 44 by Gender, New Hampshire Residents, 1999-2001
05
101520253035404550
Inva
sive
Can
cer
Uni
nten
tiona
lIn
jurie
s
Dis
ease
s of
Hea
rt
Sui
cide
Dia
bete
s
HIV
Cer
ebro
vasc
ular
Live
r Dis
ease
Hom
icid
e
Age
-Spe
cific
Rat
e / 1
00,0
00 TotalMaleFemale
* * * * **
* Age-specific rates have been suppressed when based upon fewer than 10 deaths
Invasive cancer becomes the number one cause of death in this age group. There are nearly as many deaths from cancer in this age group as total deaths in the next younger (25 to 34) age group.HIV, though rare and much lower than the US rate, is most prominent in this age group.
NH DHHS, DIVISION OF PUBLIC HEALTH SERVICES — HEALTH STATISTICS AND DATA MANAGEMENTLEADING CAUSES OF DEATH OF NEW HAMPSHIRE RESIDENTS, 1999 – 2001 26 APRIL 2005

Leading Cause of Death by Age
Heart disease makes an alarming appearance as a major cause of death in this age group.The injury rate is still high (number 2), but it is lower than the US rate. The high suicide rate should be of concern. Notice a pattern beginning in this age group of NH rates comparing favorably with US rates.
Table 14. Leading Causes of Death Rates for Ages 35 to 44 by Gender, New Hampshire Residents, 1999-2001
Age 35 to 44 Male Female Total
Leading Causes Deaths Rate / 100,000 (95% CI) Deaths Rate /
100,000 (95% CI) Deaths Rate / 100,000 (95% CI) US Rate /
100,000Invasive Cancer 119 36.4 (29.9, 42.9) 119 35.8 (29.4, 42.2) 238 36.1 (31.5, 40.7) 36.8UnintentionalInjuries 118 36.1 (29.6, 42.6) 46 13.8 (10.1, 18.4) 164 24.9 (21.1, 28.7) 32.8
Diseases of Heart 104 31.8 (25.7, 37.9) 28 8.4 (5.6, 12.1) 132 20.0 (16.6, 23.4) 30.0
Suicide 92 28.1 (22.7, 34.5) 24 7.2 (4.6, 10.7) 116 17.6 (14.4, 20.8) 14.5
Diabetes 14 4.3 (2.4, 7.2) 7 * 21 3.2 (2.0, 4.9) 4.3
HIV 12 3.7 (1.9, 6.5) 7 * 19 2.9 (1.7, 4.5) 13.3
Cerebrovascular 10 3.1 (1.5, 5.7) 7 * 17 2.6 (1.5, 4.2) 5.7
Liver Disease 12 3.7 (1.9, 6.5) 5 * 17 2.6 (1.5, 4.2) 7.4
Homicide 8 * 4 * 12 1.8 (0.9, 3.1) 7.9
Flu & Pneumonia 5 * 2 * 7 * 2.3* Rates are suppressed when based upon fewer than 10 deaths.
Age 45 to 55
Figure 14. Top 10 Leading Causes of Death Rates for Ages 45 to 54 by Gender, New Hampshire Residents, 1999-2001
0
20
40
60
80
100
120
140
Inva
sive
Can
cer
Dis
ease
s of
Hea
rt
Uni
nten
tiona
lIn
jurie
s
Sui
cide
Live
r Dis
ease
Cer
ebro
vasc
ular
Chr
onic
Low
.R
esp.
Dia
bete
s
Vira
l hep
atiti
s
Flu
& P
neum
onia
Age
-Spe
cific
Rat
e / 1
00,0
00 Total
Male
Female
* * *
* Age-specific rates have been suppressed when based upon fewer than 10 deaths
NH DHHS, DIVISION OF PUBLIC HEALTH SERVICES — HEALTH STATISTICS AND DATA MANAGEMENTLEADING CAUSES OF DEATH OF NEW HAMPSHIRE RESIDENTS, 1999 – 2001 APRIL 2005 27

Leading Cause of Death by Age
Even though heart disease is the overall leading cause of death in New Hampshire,invasive cancer ranks highest in this age group.Other causes of death are more prominent in this age group, such as liver, cerebrovascular and chronic lower respiratory diseases, and diabetes. This age group compares favorably with most US rates. CLRD in the table refers to chronic lower respiratory disease.
Table 15. Top 10 Leading Causes of Death Rates for Ages 45 to 54 by Gender, New Hampshire Residents, 1999-2001
Age 35 to 44 Male Female Total
Leading Causes Deaths Rate / 100,000 (95% CI) Deaths Rate /
100,000 (95% CI) Deaths Rate / 100,000 (95% CI) US Rate /
100,000Invasive Cancer 323 117.5 (104.7,130.3) 332 120.2 (107.3, 133.1) 655 118.9 (109.8, 128.0) 127.1
Diseases of Heart 286 104.0 (91.9, 116.1) 102 36.9 (29.7, 44.1) 388 70.4 (63.4, 77.4) 95.2
Unintentional Injuries 83 30.2 (24.1, 37.4) 28 10.1 (6.7, 14.6) 111 20.1 (16.4, 23.8) 31.3
Suicide 66 24.0 (18.6, 30.5) 23 8.3 (5.3, 12.5) 89 16.1 (12.9, 19.8) 14.5
Liver Disease 47 17.1 (12.6, 22.7) 13 4.7 (2.5, 8.0) 60 10.9 (8.3, 14.0) 17.9
Cerebrovascular 27 9.8 (6.5, 14.3) 25 9.1 (5.9, 13.4) 52 9.4 (7.0, 12.3) 15.4
CLRD 18 6.5 (3.9, 10.3) 27 9.8 (6.5, 14.3) 45 8.2 (6.0, 11.0) 8.5
Diabetes 29 10.5 (7.0, 15.1) 16 5.8 (3.3, 9.4) 45 8.2 (6.0, 11.0) 13.2
Viral Hepatitis 16 5.8 (3.3, 9.4) 1 * 17 3.1 (1.8, 5.0) 4.8
Flu & Pneumonia 9 * 2 * 11 2 (1.0, 3.6) 4.6* Rates are suppressed when based upon fewer than 10 deaths.
Age 55 to 64
Figure 15. Top 10 Leading Causes of Death Rates for Ages 55 to 64 by Gender, New Hampshire Residents, 1999-2001
050
100150200250300350400450
Inva
sive
Can
cer
Dis
ease
s of
Hea
rt
Chr
onic
Low
.R
esp.
Dia
bete
s
Uni
nten
tiona
lIn
jurie
s
Cer
ebro
vasc
ular
Live
r Dis
ease
Sui
cide
Sep
ticem
ia
Nep
hriti
s
Age
-Spe
cific
Rat
e / 1
00,0
00 Total
Male
Female
*
* Age-specific rates have been suppressed when based upon fewer than 10 deaths
Death rates increase by a factor of nearly three compared to the previous age group, with invasive cancer still the leading cause of death.
NH DHHS, DIVISION OF PUBLIC HEALTH SERVICES — HEALTH STATISTICS AND DATA MANAGEMENTLEADING CAUSES OF DEATH OF NEW HAMPSHIRE RESIDENTS, 1999 – 2001 28 APRIL 2005

Leading Cause of Death by Age
Table 16. Top 10 Leading Causes of Death Rates for Ages 55 to 64 by Gender, New Hampshire Residents, 1999-2001
Age 55 to 64 Male Total
Leading Causes Deaths (95% CI) Deaths Rate / 100,000(95% CI) Deaths (95% CI) US Rate
/ 100,000Invasive Cancer 611 (341.3, 400.1) 514 306.6(280.1, 333.1) 1,125
FemaleRate /
100,000Rate /
100,000370.7 338.4(318.6, 358.2) 365.7
Diseases of Heart 513 311.2(284.3, 338.1) 183 109.2(93.4, 125.0) 209.3(193.8, 224.8) 261.4
CLRD 85 51.6(41.2, 63.8) 74 44.1(34.6, 55.4) 47.8(40.4, 55.2) 45.3
Diabetes 59 35.8(27.3, 46.2) 33 19.7(13.6, 27.7) 27.7(22.3, 34.0) 38.0UnintentionalInjuries 60 36.4(27.8, 46.9) 27 16.1(10.6, 23.4) 26.2(21.0, 32.3) 29.0
Cerebrovascular 38 23.1(16.3, 31.7) 32 19.1(13.1, 27.0) 21.1(16.4, 26.7) 39.8
Liver Disease 40 24.3(17.4, 33.1) 28 16.7(11.1, 24.1) 20.5(15.9, 26.0) 23.4
Suicide
696
159
92
87
70
68
31 18.8(12.8, 26.7) 8 * 39 11.7(8.3, 16.0) 12.5
Septicemia 10 6.1(2.9, 11.2) 13 7.8(4.2, 13.3) 23 6.9(4.4, 10.4) 11.9Nephritis 10 6.1(2.9, 11.2) 10 6.0(2.9, 11.0) 6.0(3.7, 9.3) 12.620
* Rates are suppressed when based upon fewer than 10 deaths.
Age 65 to 74
Figure 16. Top 10 Leading Causes of Death Rates for Ages 65 to 74 by Gender, New Hampshire Residents, 1999-2001
0
200
400
600
800
1000
1200
Inva
sive
Can
cer
Dis
ease
s of
Hea
rt
Chr
onic
Low
.R
esp.
Cer
ebro
vasc
ular
Dia
bete
s
Uni
nten
tiona
lIn
jurie
s
Live
r Dis
ease
Flu
& P
neum
onia
Nep
hriti
s
Aor
ticA
neur
ysm
Age
-Spe
cific
Rat
e / 1
00,0
00
Total
Male
Female
Invasive cancer continues to lead. The top 6 leading causes of death in this age group increase by a magnitude of 2 to 3 times over the previous age group. Unintentional injuries drop from 5th to 7th in ranking but death rates from unintentional injuries increase. The rate for CLRD is higher than the US rate.
NH DHHS, DIVISION OF PUBLIC HEALTH SERVICES — HEALTH STATISTICS AND DATA MANAGEMENTLEADING CAUSES OF DEATH OF NEW HAMPSHIRE RESIDENTS, 1999 – 2001 APRIL 2005 29

Leading Cause of Death by Age
Table 17. Top 10 Leading Causes of Death Rates for Ages 65 to 74 by Gender, New Hampshire Residents, 1999-2001
Age 65 to 74 Male Female Total
Leading Causes Deaths Rate / 100,000 (95% CI) Deaths Rate /
100,000 (95% CI) Deaths Rate / 100,000 (95% CI) US Rate /
100,000Invasive Cancer 1,090 996.8 (937.6,1056.0) 851 680.2 (634.5, 725.9) 1,941 827.9 (791.1, 864.7) 815.3
Diseases of Heart 888 812.1 (758.7, 865.5) 474 378.9 (344.8, 413.0) 1,362 580.9 (550.0, 611.8) 674.4
CLRD 238 217.7 (190.0, 245.4) 211 168.6 (145.9, 191.3) 449 191.5 (173.8, 209.2) 171.5
Cerebrovascular 125 114.3 (94.3, 134.3) 110 87.9 (71.5, 104.3) 235 100.2 (87.4, 113.0) 127.6
Diabetes 122 111.6 (91.8, 131.4) 89 71.1 (57.1, 87.5) 211 90.0 (77.9, 102.1) 91.3
Unintentional Injuries 58 53.0 (40.2, 68.5) 29 23.2 (15.5, 33.3) 87 37.1 (29.7, 45.8) 30.1
Liver Disease 50 45.7 (33.9, 60.2) 29 23.2 (15.5, 33.3) 79 33.7 (26.7, 42.0) 37.5
Flu & Pneumonia 37 33.8 (23.8, 46.6) 30 24.0 (16.2, 34.3) 67 28.6 (22.2, 36.3) 37.5
Nephritis 25 22.9 (14.8, 33.8) 35 28.0 (19.5, 38.9) 60 25.6 (19.5, 33.0) 38.4
Aortic Aneurysm 40 36.6 (26.1, 49.8) 12 9.6 (5.0, 16.8) 52 22.2 (16.6, 29.1) 20.9
Age 75 to 84
Figure 17. Top 10 Leading Causes of Death Rates for Ages 75 to 84 by Gender, New Hampshire Residents, 1999-2001
0
500
1000
1500
2000
2500
Dis
ease
s of
Hea
rt
Inva
sive
Can
cer
Cer
ebro
vasc
ular
Chr
onic
Low
.R
esp.
Dia
bete
s
Alz
heim
er's
Flu
& P
neum
onia
Uni
nten
tiona
lIn
jurie
s
Par
kins
on’s
Nep
hriti
s
Age
-Spe
cific
Rat
e / 1
00,0
00 Total
Male
Female
Heart disease becomes the leading cause of death, but is lower than the US rate. Invasive cancer, CLRD, and Alzheimer’s disease are higher than the US rates.
NH DHHS, DIVISION OF PUBLIC HEALTH SERVICES — HEALTH STATISTICS AND DATA MANAGEMENTLEADING CAUSES OF DEATH OF NEW HAMPSHIRE RESIDENTS, 1999 – 2001 30 APRIL 2005

Leading Cause of Death by Age
Table 18. Top 10 Leading Causes of Death Rates for Ages 75 to 84 by Gender, New Hampshire Residents, 1999-2001
Age 75 to 84 Male Female Total
Leading Causes Deaths Rate / 100,000 (95% CI) Deaths Rate /
100,000 (95% CI) Deaths Rate / 100,000 (95% CI) US Rate /
100,000
Diseases of Heart 1,251 2,045.1 (1931.8, 2158.4) 1,259 1,361.7 (1286.5, 1436.9) 2,510 1,633.8 (1569.9, 1697.7) 1,805.2
Invasive Cancer 1,132 1,850.6 (1742.8, 1958.4) 1,035 1,119.4 (1051.2, 1187.6) 2,167 1,410.6 (1351.2, 1470.0) 1,327.2
Cerebrovascular 280 457.7 (404.1, 511.3) 412 445.6 (402.6, 488.6) 692 450.4 (416.8, 484.0) 458.1
CLRD 342 559.1 (499.8, 618.4) 340 367.7 (328.6, 406.8) 682 443.9 (410.6, 477.2) 387.7
Diabetes 132 215.8 (179.0, 252.6) 171 185 (157.3, 212.7) 303 197.2 (175.0, 219.4) 179.6
Alzheimer's 98 160.2 (130.1, 195.2) 165 178.5 (151.3, 205.7) 263 171.2 (150.5, 191.9) 138.9
Flu & Pneumonia 92 150.4 (121.2, 184.5) 84 90.9 (72.5, 112.5) 176 114.6 (97.7, 131.5) 155.2UnintentionalInjuries 77 125.9 (99.4, 157.4) 75 81.1 (63.8, 101.7) 152 98.9 (83.2, 114.6) 95.9
Parkinson’s 74 121 (95.0, 151.9) 38 41.1 (29.1, 56.4) 112 72.9 (59.4, 86.4) 61.4
Nephritis 51 83.4 (62.1, 109.7) 57 61.7 (46.7, 79.9) 108 70.3 (57.0, 83.6) 100.8
Age 85 and Older
Figure 18. Top 10 Leading Causes of Death Rates for Ages 85 and Older by Gender, NewHampshire Residents, 1999-2001
010002000300040005000600070008000
Dis
ease
s of
Hea
rt
Inva
sive
Can
cer
Cer
ebro
vasc
ular
Alz
heim
er's
Chr
onic
Low
.R
esp.
Flu
& P
neum
onia
Dia
bete
s
Uni
nten
tiona
lIn
jurie
s
Nep
hriti
s
Ath
eros
cler
osis
Age
-Spe
cific
Rat
e / 1
00,0
00
Total
Male
Female
Heart disease becomes the overwhelming leading cause of death.Invasive cancer, CLRD, and Alzheimer’s disease again exceed US rates. The diabetes death rate also exceeds the US rate.
NH DHHS, DIVISION OF PUBLIC HEALTH SERVICES — HEALTH STATISTICS AND DATA MANAGEMENTLEADING CAUSES OF DEATH OF NEW HAMPSHIRE RESIDENTS, 1999 – 2001 APRIL 2005 31

Leading Cause of Death by Age
Table 19. Top 10 Leading Causes of Death Rates for Ages 85 and Older by Gender, NewHampshire Residents, 1999-2001
Age 85 and Older Male Female Total
Leading Cause Deaths Rate / 100,000 (95% CI) Deaths Rate /
100,000 (95% CI) Deaths Rate / 100,000 (95% CI) US Rate /
100,000
Diseases of Heart 1,003 6,638.7 (6227.8, 7049.6) 2,282 5,706.3 (5472.2, 5940.4) 3,285 5,962.0 (5758.1, 6165.9) 5,920.0
Invasive Cancer 461 3,051.3 (2772.8, 3329.8) 626 1,565.4 (1442.8, 1688.0) 1,087 1,972.8 (1855.5, 2090.1) 1,790.2
Cerebrovascular 221 1,462.8 (1269.9, 1655.7) 671 1,677.9 (1550.9, 1804.9) 892 1,618.9 (1512.7, 1725.1) 1,561.5
Alzheimer's 116 767.8 (628.1, 907.5) 409 1,022.7 (923.6, 1121.8) 525 952.8 (871.3, 1034.3) 658.5
CLRD 182 1,204.6 (1029.6, 1379.6) 263 657.7 (578.2, 737.2) 445 807.6 (732.6, 882.6) 644.1
Flu & Pneumonia 96 635.4 (514.7, 775.9) 208 520.1 (449.4, 590.8) 304 551.7 (489.7, 613.7) 723.9
Diabetes 65 430.2 (332.0, 548.3) 139 347.6 (289.8, 405.4) 204 370.2 (319.4, 421.0) 318.5UnintentionalInjuries 55 364 (274.2, 473.8) 86 215 (172.0, 265.5) 141 255.9 (213.7, 298.1) 272.9
Nephritis 49 324.3 (239.9, 428.7) 78 195 (154.1, 243.4) 127 230.5 (190.4, 270.6) 277.3
Atherosclerosis 27 178.7 (117.8, 260.0) 76 190 (149.7, 237.8) 103 186.9 (150.8, 223.0) 189.1
NH DHHS, DIVISION OF PUBLIC HEALTH SERVICES — HEALTH STATISTICS AND DATA MANAGEMENTLEADING CAUSES OF DEATH OF NEW HAMPSHIRE RESIDENTS, 1999 – 2001 32 APRIL 2005

Detail on the Ten Leading Causes of Death in New Hampshire The ten leading causes of death in New Hampshire by the number of deaths are:
1. Diseases of Heart 2. Invasive Cancer3. Cerebrovascular Disease4. Chronic Lower Respiratory Disease 5. Unintentional Injuries (Accidents, in NCHS publications) 6. Diabetes 7. Alzheimer’s Disease8. Influenza and Pneumonia 9. Suicide 10. Nephritis
This section provides additional information on the ten leading causes of death.
Four of these causes (cancer, unintentional injuries, diabetes, and suicide) are thoroughly addressed in recent NH special reports. Asthma, which is part of the chronic lower respiratory disease group, has its own report. Suicide is covered in the injury report. The Behavioral Risk Factor Surveillance System report has general information on prevention and risk factors. (Please see reference section. Contact HSDM to order copies.)
Diseases of the Heart
Overview:
Heart disease is the leading cause of death in New Hampshire and the US.Heart disease includes deaths from coronary heart disease, congestive heart failure, valvular heart disease, diseases of the pericardium, diseases of the myocardium, endocarditis, and congenital heart disease.
Risk Factors and Prevention (from the American Heart Association and CDC):
Avoid use of tobacco products. It is estimated that smoking causes 98,000 US heart disease deaths a year. Exercise on a regular basis. Maintain normal body weight.
NH DHHS, DIVISION OF PUBLIC HEALTH SERVICES — HEALTH STATISTICS AND DATA MANAGEMENTLEADING CAUSES OF DEATH OF NEW HAMPSHIRE RESIDENTS, 1999 – 2001 APRIL 2005 33

Disease of the Heart
Eat plenty of fruits and vegetables. Education regarding the early warning signs of heart attack, including calling 911 for medical emergencies, can reduce death and disability due to heart disease.
New Hampshire Facts (data from 2003 NH BRFSS):
21% of New Hampshire adults smoke.54% of NH adults engaged in at least 30 min of moderate physical activity 5 or more times per week or at least 20 min of vigorous physical activity 3 or more times a week. 20% of NH adults engaged in no leisure time physical activity in the past30 days. 20% of New Hampshire adults are obese.57% of adults are overweight or obese. 43% of New Hampshire adults are at a healthy weight. 29% of New Hampshire adults consume 5 or more fruits and vegetablesa day. 23% of NH adults have been told by a doctor or other health professional that they have high blood pressure 33% of NH adults have been told by a doctor or other health professional that they have high cholesterol
Resources:
National Center for Health Statistics, Center for Disease Control, Fast Stats, Heart Disease: http://www.cdc.gov/nchs/fastats/heart.htmCenters for Disease Control: Cardiovascular Disease:http://www.cdc.gov/doc.do/id/0900f3ec802720b8American Heart Association: http://www.americanheart.org
NH DHHS, DIVISION OF PUBLIC HEALTH SERVICES — HEALTH STATISTICS AND DATA MANAGEMENTLEADING CAUSES OF DEATH OF NEW HAMPSHIRE RESIDENTS, 1999 – 2001 34 APRIL 2005

Diseases of the Heart
Figure 19. Proportion of Diseases of the Heart Deaths by Age Group and Sex, New Hampshire Residents, 1999-2001
Age Group
65 to 74 16%
75 to 84 30%
85 plus39%
45 to 545%
55 to 648%
35 to 44 2%
1 to 34 < 1%
Sex
Male48%Female
52%
85% of heart disease deaths occur after age 65, but the life-style factors contributing to this cause of death begin in childhood.
Table 20. Diseases of the Heart Deaths by Year, New Hampshire Residents, 1999-2001
Year DeathsNH Age-
AdjustedRate /
100,000(95% CI)
US Age-Adjusted
Rate / 100,000
1999 2,757 237.9 (229.0, 246.8) 267.7
2000 2,819 237.9 (229.1, 246.7) 259.2
2001 2,832 232.6 (224.0, 241.2) 248.5
Total 8,408 236.1 (231.0, 241.1) 258.3Note: Includes 1 infant death grouped by the same rules as non-infant deaths.
New Hampshire rates are lower than the US. One reason may be that rates for heart disease deaths are higher among African Americans, and New Hampshire has a relatively small African American population.
NH DHHS, DIVISION OF PUBLIC HEALTH SERVICES — HEALTH STATISTICS AND DATA MANAGEMENTLEADING CAUSES OF DEATH OF NEW HAMPSHIRE RESIDENTS, 1999 – 2001 APRIL 2005 35

Disease of the Heart
Figure 20. Diseases of Heart Deaths by Age Group and Sex, New Hampshire Residents, 1999-2001
0
1000
2000
3000
4000
5000
6000
7000
8000
1 to
4
5 to
14
15 to
24
25 to
34
35 to
44
45 to
54
55 to
64
65 to
74
75 to
84
85 p
lus
Rat
e / 1
00,0
00TotalMaleFemale
Table 21. Diseases of Heart Deaths by Age Group and Sex, New Hampshire Residents, 1999-2001
Male Female Total
AgeGroup Deaths Rate /
100,000 (95% CI) Deaths Rate / 100,000 (95% CI) Deaths Rate /
100,000 (95% CI) USRate
1 to 4 1 * 0 * 1 * 1.3
5 to 14 0 * 0 * 0 * 0.7
15 to 24 6 * 3 * 9 * 2.6
25 to 34 17 7.1 (4.1, 11.4) 7 * 24 5.0 (3.2, 7.4) 7.8
35 to 44 104 31.8 (25.7, 37.9) 28 8.4 (5.6, 12.1) 132 20.0 (16.6, 23.4) 30.0
45 to 54 286 104.0 (91.9, 116.1) 102 36.9 (29.7, 44.1) 388 70.4 (63.4, 77.4) 95.2
55 to 64 513 311.2 (284.3, 338.1) 183 109.2 (93.4, 125.0) 696 209.3 (193.8, 224.8) 261.4
65 to 74 888 812.1 (758.7, 865.5) 474 378.9 (344.8, 413.0) 1,362 580.9 (550.0, 611.8) 674.4
75 to 84 1,251 2,045.1 (1,931.8, 2,158.4) 1,259 1,361.7 (1,286.5, 1,436.9) 2,510 1,633.8 (1569.9, 1697.7) 1,805.2
85 plus 1,003 6,638.7 (6,227.8, 7,049.6) 2,282 5,706.3 (5,472.2, 5,940.4) 3,285 5962 (5758.1, 6165.9) 5,920.0
Age-Adjusted
Total4,069 113.5 (110.0, 117.0) 4,338 122.6 (119.0, 126.3) 8,407 236.1 (231.0, 241.1) 258.3
* Rates are suppressed when based upon fewer than 10 deaths.
Note: Excludes 1 female infant death (0 year old).
NH DHHS, DIVISION OF PUBLIC HEALTH SERVICES — HEALTH STATISTICS AND DATA MANAGEMENTLEADING CAUSES OF DEATH OF NEW HAMPSHIRE RESIDENTS, 1999 – 2001 36 APRIL 2005

Diseases of the Heart
Figure 21. Diseases of Heart Death Rates by County, New Hampshire Residents, 1999–2001
0
50
100
150
200
250
300
350
Bel
knap
Car
roll
Che
shire
Coo
s
Gra
fton
Hill
sbor
ough
Mer
rimac
k
Roc
king
ham
Stra
fford
Sul
livan
Age
-Adj
uste
d R
ate
/ 100
,000
US Rate
NH Rate
Carroll County has lower death rates for heart disease than NH and the US.
Table 22. Diseases of Heart Death Rates by County, New Hampshire Residents, 1999–2001
County DeathsAge-
AdjustedRate /
100,000(95% CI)
Belknap 475 241.8 (220.0, 263.6) Carroll 338 197.3 (176.2, 218.4) Cheshire 619 256.6 (236.4, 276.8) Coos 400 278.4 (251.0, 305.9) Grafton 583 221.6 (203.6, 239.6) Hillsborough 2383 239.6 (230.0, 249.3) Merrimack 1032 238.0 (223.4, 252.6) Rockingham 1541 230.7 (219.1, 242.3) Strafford 696 235.5 (218.0, 253.0) Sullivan 337 232.1 (207.3, 256.9) Unknown 4 *NH 8408 236.1 (231.0, 241.1) US 258.3* Rates are suppressed when based upon fewer than 10 deaths.
Note: Includes 1 infant death in Belknap County grouped by the same rules as non-infant deaths.
Invasive Cancer
Overview:
This leading cause of death includes any of the various types of malignant neoplasms, most of which can invade surrounding tissues, may metastasize to several sites, and are likely to recur after attempted removal. For some types of cancer, death can be avoided with early diagnosis and adequate treatment.
NH DHHS, DIVISION OF PUBLIC HEALTH SERVICES — HEALTH STATISTICS AND DATA MANAGEMENTLEADING CAUSES OF DEATH OF NEW HAMPSHIRE RESIDENTS, 1999 – 2001 APRIL 2005 37

Invasive Cancer
Risk Factors and Prevention (from the National Cancer Institute):
Avoid excessive alcohol consumption. Don’t use tobacco products.Reduce exposure to carcinogenic chemicals in the workplace and environment.Females should be screened with breast exams and those women over 40 should also be screened with exams and mammograms. Males should be screened as recommended by their health provider for prostate cancer. Adults over age 50 should be screened for colon cancer. Increase consumption of fruits and vegetables. Avoid obesity. Avoid exposure to radiation and excessive exposure to sunlight.
New Hampshire Facts:
Invasive cancer is the leading cause of death in New Hampshire for all age groups between ages 35 and 75. It is the second leading cause of death across all ages.
From the 2003 NH BRFSS:21% of NH adults are current smokers. 20% of New Hampshire adults are obese.43% of New Hampshire adults are at a healthy weight. 71% of New Hampshire adults do not consume 5 or more fruits and vegetables a day. 8% of NH adult males are chronic heavy alcohol drinkers (consuming an average of 2 or more drinks per day). 7% of NH adult females are chronic heavy alcohol drinkers (consuming an average of 1 or more drinks per day) 51% of NH residents claim that they have heard of radon, know how to have their homes tested, and have had tests performed. (2000 data)41% of NH adults had sunburn in the past 12 months and 38% had 3 or more sunburns.81% of NH women age 40 and older reported having a mammogram in the past 2 years. (2002 data) 55% of NH adults aged 50 and older report having either a fecal occult blood test within the past year or a sigmoidoscopy or colonoscopy exam within the past 5 years. (2002 data)
NH DHHS, DIVISION OF PUBLIC HEALTH SERVICES — HEALTH STATISTICS AND DATA MANAGEMENTLEADING CAUSES OF DEATH OF NEW HAMPSHIRE RESIDENTS, 1999 – 2001 38 APRIL 2005

Invasive Cancer
Resources:
National Center for Health Statistics, Center for Disease Control, Fast Stats, Cancer: http://www.cdc.gov/nchs/fastats/cancer.htmLiu, CF. Cancer in New Hampshire, 1999, An Annual Report on Cancer Incidence and Mortality. http://www.dhhs.nh.gov/DHHS/HSDM/cancer-data.htmNational Cancer Institute: http://www.cancer.gov/
Figure 22. Proportion of Invasive Cancer Deaths by Age Group and Sex, New Hampshire Residents, 1999–2001
Age Group
85 plus15%
75 to 8430%
65 to 7427%
55 to 64 15%
45 to 549%
35 to 443%
1 to 34 1%
Sex
Male52%
Female48%
Table 23. Invasive Cancer Deaths by Year, New Hampshire Residents, 1999-2001
Year DeathsNH Age-
AdjustedRate /
100,000(95% CI)
US Age-Adjusted
Rate / 100,000
1999 2,410 204.4 (196.2, 212.6) 200.8
2000 2,485 207.0 (198.9, 215.2) 172.5
2001 2,392 195.0 (187.1, 202.8) 195.6
Total 7,287 202.0 (197.4, 206.7) 198.6
NH DHHS, DIVISION OF PUBLIC HEALTH SERVICES — HEALTH STATISTICS AND DATA MANAGEMENTLEADING CAUSES OF DEATH OF NEW HAMPSHIRE RESIDENTS, 1999 – 2001 APRIL 2005 39

Invasive Cancer
Figure 23. Invasive Cancer Death Rates by Age Group and Sex, New Hampshire Residents, 1999–2001
0
500
1,000
1,500
2,000
2,500
3,000
3,500
1 to
4
5 to
14
15 to
24
25 to
34
35 to
44
45 to
54
55 to
64
65 to
74
75 to
84
85 p
lus
Rat
e / 1
00,0
00
Male
Female
Total
Table 24. Invasive Cancer Death Rates by Age Group and Sex, New Hampshire Residents, 1999–2001
Male Female TotalAge
Group Deaths Rate / 100,000 (95% CI) Deaths Rate /
100,000 (95% CI) Deaths Rate / 100,000 (95% CI) US
Rate
1 to 4 4 * 4 * 8 * 2.6
5 to 14 7 * 5 * 12 2.2 (1.1, 3.8) 2.5
15 to 24 6 * 9 * 15 3.2 (1.8, 5.3) 4.4
25 to 34 23 9.6 (6.1, 14.4) 16 6.6 (3.8, 10.7) 39 8.1 (5.8, 11.1) 9.9
35 to 44 119 36.4 (29.9, 42.9) 119 35.8 (29.4, 42.2) 238 36.1 (31.5, 40.7) 36.8
45 to 54 323 117.5 (104.7, 130.3) 332 120.2 (107.3, 133.1) 655 118.9 (109.8, 128.0) 127.1
55 to 64 611 370.7 (341.3, 400.1) 514 306.6 (280.1, 333.1) 1,125 338.4 (318.6, 358.2) 365.7
65 to 74 1,090 996.8 (937.6, 1,056.0) 851 680.2 (634.5, 725.9) 1,941 827.9 (791.1, 864.7) 815.3
75 to 84 1,132 1,850.6 (1,742.8, 1,958.4) 1,035 1,119.4 (1,051.2, 1,187.6) 2,167 1,410.6 (1,351.2, 1,470.0) 1,327.2
85 plus 461 3,051.3 (2,772.8, 3,329.8) 626 1,565.4 (1,442.8, 1,688.0) 1,087 1,972.8 (1,855.5, 2,090.1) 1,790.2Age-
AdjustedTotal
3,776 252.5 (244.2, 260.8) 3,511 170.1 (164.5, 175.8) 7,287 202.0 (197.4, 206.7) 198.6
* Rates are suppressed when based upon fewer than 10 deaths.
NH DHHS, DIVISION OF PUBLIC HEALTH SERVICES — HEALTH STATISTICS AND DATA MANAGEMENTLEADING CAUSES OF DEATH OF NEW HAMPSHIRE RESIDENTS, 1999 – 2001 40 APRIL 2005

Invasive Cancer
Figure 24. Invasive Cancer Deaths by County, New Hampshire Residents, 1999–2001
0
50
100
150
200
250
300
Bel
knap
Car
roll
Che
shire
Coo
s
Gra
fton
Hill
sbor
ough
Mer
rimac
k
Roc
king
ham
Stra
fford
Sul
livan
Age
-Adj
uste
d R
ate
/ 100
,000
US Rate
NH Rate
Note: The NH Rate and the US Rate are too close to be distinguished based on the scale of this graph.
Table 25. Invasive Cancer Deaths by County, New Hampshire Residents, 1999–2001
County DeathsAge-
AdjustedRate /
100,000(95% CI)
Belknap 446 222.5 (201.8, 243.1)
Carroll 323 184.9 (164.6, 205.2)
Cheshire 506 211.8 (193.3, 230.2)
Coos 298 218.5 (193.4, 243.5)
Grafton 513 197.6 (180.5, 214.7)
Hillsborough 1985 195.9 (187.3, 204.6)
Merrimack 771 186.1 (172.9, 199.3)
Rockingham 1493 208.1 (197.4, 218.8)
Strafford 625 206.6 (190.4, 222.8)
Sullivan 324 221.3 (197.2, 245.5)
NH 7287 202.0 (197.4, 206.7)
US 198.6
Cerebrovascular Disease
Overview:
Cerebrovascular disease (often called “stroke”) is defined as a pathological change in the blood supply to the brain due to hemorrhage or occlusion of blood vessels.Cerebrovascular disease is the third leading cause of death in NH and the US.
NH DHHS, DIVISION OF PUBLIC HEALTH SERVICES — HEALTH STATISTICS AND DATA MANAGEMENTLEADING CAUSES OF DEATH OF NEW HAMPSHIRE RESIDENTS, 1999 – 2001 APRIL 2005 41

Cerebrovascular Disease
Risk Factors and Prevention (from the National Center for Chronic Disease Prevention and Health Promotion):
Control blood pressure with diet, salt restriction, exercise, and possibly medications.Exercise moderately on a regular basis. Eat plenty of fruits and vegetables. Avoid use of tobacco products. Control diabetes if present. (Diabetes doubles the risk of stroke.) Control blood cholesterol by avoiding cholesterol and fats in the diet, especially saturated fats. Reduce high-fat meat and dairy product consumption.Avoid excessive alcohol consumption. Maintain normal body weight. Female smokers over age 30 should avoid using oral contraceptives. Education regarding the early warning signs of stroke, including accessing 911 for medical emergencies, can reduce death and disability.
New Hampshire Facts:
The Healthy New Hampshire 2010 goal is to reduce the overall death rate from strokes from the 1998 benchmark of 55.8 per 100,000 to 44.6. The combined 1999 to 2001 NH rate is 55.7 (53.3, 58.2) showing no change from the 1998 benchmark.
Resources:
National Center for Health Statistics, Center for Disease Control, Fast Stats, Stroke/Cerebrovascular Disease: http://www.cdc.gov/nchs/fastats/stroke.htmNational Center for Chronic Disease Prevention and Health Promotion, Stroke Fact Sheet: http://www.cdc.gov/cvh/library/fs_stroke.htmCenters for Disease Control, Stroke: http://www.cdc.gov/health/cardiov.htm
NH DHHS, DIVISION OF PUBLIC HEALTH SERVICES — HEALTH STATISTICS AND DATA MANAGEMENTLEADING CAUSES OF DEATH OF NEW HAMPSHIRE RESIDENTS, 1999 – 2001 42 APRIL 2005

Cerebrovascular Disease
Figure 25. Proportion of Cerebrovascular Disease Deaths by Age Group and Sex, New Hampshire Residents, 1999-2001
Age Group
75 to 84 35%
65 to 74 12%
55 to 64 4%
35 to 441%1 to 34
< 1%
45 to 543%
85 plus45%
Sex
Male36%
Female64%
More women die from cerebrovascular disease mainly because this is a disease of the elderly and women tend to live longer. Death rates are not different between men and women.
Table 26. Cerebrovascular Disease Deaths by Year, New Hampshire Residents, 1999-2001
Year DeathsNH Age-
AdjustedRate /
100,000(95% CI)
US Age-Adjusted
Rate / 100,000
1999 669 58.2 (53.8, 62.7) 61.6
2000 665 56.6 (52.3, 60.9) 60.8
2001 634 52.5 (48.4, 56.6) 57.7
Total 1,968 55.7 (53.3, 58.2) 60.0
NH DHHS, DIVISION OF PUBLIC HEALTH SERVICES — HEALTH STATISTICS AND DATA MANAGEMENTLEADING CAUSES OF DEATH OF NEW HAMPSHIRE RESIDENTS, 1999 – 2001 APRIL 2005 43

Cerebrovascular Disease
Figure 26. Cerebrovascular Disease Death Rates by Age Group and Sex, New Hampshire Residents, 1999-2001
0
200
400
600
800
1000
1200
1400
1600
1800
2000
1 to
4
5 to
14
15 to
24
25 to
34
35 to
44
45 to
54
55 to
64
65 to
74
75 to
84
85 p
lus
Rat
e / 1
00,0
00
FemaleMaleTotal
Table 27. Cerebrovascular Disease Death Rates by Age Group and Sex, New Hampshire Residents, 1999-2001
Male Female TotalAge
Group Deaths Rate / 100,000 (95% CI) Deaths Rate /
100,000 (95% CI) Deaths Rate / 100,000 (95% CI) US
Rate
1 to 4 0 * 0 * 0 * 0.8
5 to 14 1 * 0 * 1 * 0.2
15 to 24 1 * 1 * 2 * 0.5
25 to 34 2 * 2 * 4 * 1.5
35 to 44 10 3.1 (1.5, 5.7) 7 * 17 2.6 (1.5, 4.1) 5.7
45 to 54 27 9.8 (6.5, 14.3) 25 9.1 (5.9, 13.4) 52 9.4 (7.0, 12.4) 15.4
55 to 64 38 23.1 (16.3, 31.7) 32 19.1 (13.1, 27.0) 70 21.1 (16.4, 26.6) 39.8
65 to 74 125 114.3 (94.3, 134.3) 110 87.9 (71.5, 104.3) 235 100.2 (87.4, 113.0) 127.6
75 to 84 280 457.7 (404.1, 511.3) 412 445.6 (402.6, 488.6) 692 450.4 (416.9, 484.0) 458.1
85 plus 221 1,462.8 (1,269.9, 1,655.7) 671 1677.9 (1,550.9, 1,804.9) 892 1,618.9 (1,512.7, 1,725.1) 1,561.5Age-
AdjustedTotal
705 54.8 (50.7, 59.0) 1,260 55.2 (52.1, 58.3) 1,965 55.6 (53.2, 58.1) 60.0
Rates are suppressed when based upon fewer than 10 deaths.
NH cerebrovascular death rates are lower that US rates except in the 85+-age group.The NH cerebrovascular death rate for women is higher than for men in the 85+ age group.
NH DHHS, DIVISION OF PUBLIC HEALTH SERVICES — HEALTH STATISTICS AND DATA MANAGEMENTLEADING CAUSES OF DEATH OF NEW HAMPSHIRE RESIDENTS, 1999 – 2001 44 APRIL 2005

Cerebrovascular Disease
Figure 27. Cerebrovascular Disease Deaths by County, New Hampshire Residents, 1999-2001
0
20
40
60
80
100
Bel
knap
Car
roll
Che
shire
Coo
s
Gra
fton
Hills
boro
ugh
Mer
rimac
k
Roc
king
ham
Stra
fford
Sul
livan
Age
-Adj
uste
d R
ate
/ 100
,000
US Rate
NH Rate
The cerebrovascular death rate is higher for Belknap County and lower for Hillsborough County compared to the rest of the state.
Table 28. Cerebrovascular Disease Deaths by County, New Hampshire Residents, 1999-2001
County DeathsAge-
AdjustedRate /
100,000(95% CI)
Belknap 157 80.3 (67.8, 92.9) Carroll 98 56.8 (46.1, 69.2) Cheshire 129 53.3 (44.1, 62.5) Coos 67 46.2 (35.8, 58.6) Grafton 131 49.6 (41.1, 58.1) Hillsborough 498 50.4 (46.0, 54.8) Merrimack 255 58.5 (51.3, 65.7) Rockingham 368 57.2 (51.3, 63.1) Strafford 191 64.9 (55.7, 74.1) Sullivan 74 50.7 (39.8, 63.6) NH 1968 55.7 (53.3, 58.2) US 60.0
Chronic Lower Respiratory Disease
Overview:
Chronic lower respiratory disease includes the related diseases of COPD (chronic obstructive pulmonary disease), emphysema, asthma, and chronic bronchitis.
NH DHHS, DIVISION OF PUBLIC HEALTH SERVICES — HEALTH STATISTICS AND DATA MANAGEMENTLEADING CAUSES OF DEATH OF NEW HAMPSHIRE RESIDENTS, 1999 – 2001 APRIL 2005 45

Chronic Lower Respiratory Disease
Chronic obstructive pulmonary disease (COPD) refers to all diseases that cause a temporary or permanent narrowing of the small bronchi causing difficulty with forced expiration.Chronic bronchitis is diagnosed when a patient has excessive airway mucus secretion leading to a persistent, productive cough. In chronic bronchitis, there also may be narrowing of the large and small airways making it more difficult to move air in and out of the lungs.Emphysema is a condition where the size of air spaces in the lung increases and those spaces are reduced in number. This process is accompanied by difficulty getting enough oxygen and inability to fully expire air from the lungs. Emphysema and chronic bronchitis often go together.Asthma is also included in this group of lung diseases and is defined as an inflammatory disease characterized by reversible (in most cases) airway obstruction.Nearly half of all people with chronic lower respiratory disease are undiagnosed.
Risk Factors and Prevention (from the American Lung Association):
Quit smoking or never start. Smoking causes over 80% of chronic lower respiratory deaths. Most patients with these diseases have a long history of heavy cigarette smoking. Avoid second hand smoke. Reduce exposure to indoor air pollutants such as smoke from cooking and heating.Reduce the incidence of low birth weight births by improving maternal nutrition and health. (Low-birth-weight babies are more prone to respiratory diseases.)Avoid occupational dusts and chemicals. Avoid outdoor air pollution such as motor vehicle exhaust fumes. Reduce the incidence of severe childhood respiratory infections.
New Hampshire Facts:
NH is working to reduce air pollution transport from other states (ozone and small particles), which may relate to incidence and severity of chronic lower respiratory disease in NH13.
From the 2003 NH BRFSS:Smoking tends to be more prevalent in younger adults than in older individuals. One third (33%) of adults aged 18-34 smoke compared to 10% of adults aged 65 or older.53% of current NH smokers say they have tried to quit in the previous year.
NH DHHS, DIVISION OF PUBLIC HEALTH SERVICES — HEALTH STATISTICS AND DATA MANAGEMENTLEADING CAUSES OF DEATH OF NEW HAMPSHIRE RESIDENTS, 1999 – 2001 46 APRIL 2005

Chronic Lower Respiratory Disease
Resources:
National Center for Health Statistics, CDC, Fast Stats, Chronic Obstructive Pulmonary Disease (COPD): http://www.cdc.gov/nchs/fastats/copd.htmAmerican Lung Association: http://www.lungusa.org/
Figure 28. Proportion of Chronic Lower Respiratory Disease Deaths by Age Group and Sex, NewHampshire Residents, 1999-2001
Age Group
55 to 64 9%
45 to 54 3%
1 to 44 1%
75 to 8437%
65 to 74 25%
85 plus25%
Sex
Female51%
Male49%
Chronic lower respiratory disease is primarily a disease of the elderly with 87% of deaths occurring after age 65.
Table 29. Chronic Lower Respiratory Disease Deaths by Year, New Hampshire Residents, 1999-2001
Year DeathsNH Age-
AdjustedRate /
100,000(95% CI)
US Age-Adjusted
Rate / 100,000
1999 593 51.3 (47.2, 55.4) 45.4
2000 581 49.4 (45.3, 53.4) 44.2
2001 617 51.3 (47.2, 55.3) 43.6
Total 1,791 50.7 (48.3, 53.0) 44.4
Overall death rates for chronic lower respiratory disease are higher than US rates for each year from 1999 to 2001.
NH DHHS, DIVISION OF PUBLIC HEALTH SERVICES — HEALTH STATISTICS AND DATA MANAGEMENTLEADING CAUSES OF DEATH OF NEW HAMPSHIRE RESIDENTS, 1999 – 2001 APRIL 2005 47

Chronic Lower Respiratory Disease
Figure 29. Chronic Lower Respiratory Disease Death Rates by Age Group and Sex, New Hampshire Residents, 1999-2001
0
200
400
600
800
1000
1200
1400
1600
1 to
4
5 to
14
15 to
24
25 to
34
35 to
44
45 to
54
55 to
64
65 to
74
75 to
84
85 p
lus
Age
-Spe
cific
Rat
e / 1
00,0
00
TotalMaleFemale
Note: 95% confidence interval for the statistic is indicated through the use of the error bars above and below the top of each linein this graph. Overlapping confidence bars indicate a lack of significant difference.
Table 30. Chronic Lower Respiratory Disease Death Rates by Age Group and Sex, New HampshireResidents, 1999-2001
Male Female Total
Age Group Deaths Rate / 100,000 (95% CI) Deaths Rate /
100,000 (95% CI) Deaths Rate / 100,000 (95% CI) US
Rate
0 to 4 1 * 0 * 1 * 0.4
5 to 14 0 * 0 * 0 * 0.3
15 to 24 2 * 2 * 4 * 0.5
25 to 34 2 * 0 * 2 * 0.8
35 to 44 1 * 3 * 4 * 2.1
45 to 54 18 6.5 (3.9, 10.3) 27 9.8 (6.5, 14.3) 45 8.2 (6.0, 10.9) 8.5
55 to 64 85 51.6 (41.2, 63.8) 74 44.1 (34.6, 55.4) 159 47.8 (40.4, 55.3) 45.3
65 to 74 238 217.7 (190.0, 245.4) 211 168.6 (145.9, 191.3) 449 191.5 (173.8, 209.2) 171.5
75 to 84 342 559.1 (499.8, 618.4) 340 367.7 (328.6, 406.8) 682 443.9 (410.6, 477.2) 387.7
85 plus 182 1,204.6 (1029.6, 1379.6) 263 657.7 (578.2, 737.2) 445 807.6 (732.6, 882.7) 644.1Age-
AdjustedTotal
871 63.8 (59.5, 68.2) 920 43.3 (40.4, 46.1) 1,791 50.7 (48.3, 53.0) 44.4
* Rates are suppressed when based upon fewer than 10 deaths.
While there are more deaths among females in the 85+ age group, the rate is higher for males. This is an example of the value of comparing total deaths to death rates. NH has higher overall death rates than the US for all age groups older than age 64.
NH DHHS, DIVISION OF PUBLIC HEALTH SERVICES — HEALTH STATISTICS AND DATA MANAGEMENTLEADING CAUSES OF DEATH OF NEW HAMPSHIRE RESIDENTS, 1999 – 2001 48 APRIL 2005

Chronic Lower Respiratory Disease
Figure 30. Chronic Lower Respiratory Disease Death Rates by County, New Hampshire Residents, 1999-2001
0
10
20
30
40
50
60
70
80
Bel
knap
Car
roll
Che
shire
Coo
s
Gra
fton
Hills
boro
ugh
Mer
rimac
k
Roc
king
ham
Stra
fford
Sul
livan
Age
-Adj
uste
d R
ate
/ 100
,000
NH Rate
US Rate
Table 31. Chronic Lower Respiratory Disease Death Rates by County, New Hampshire Residents, 1999-2001
County DeathsAge-
AdjustedRate /
100,000(95% CI)
Belknap 97 48.6 (39.4, 59.2)Carroll 83 47.4 (37.8, 58.8)Cheshire 115 47.8 (39.0, 56.5)Coos 79 56.0 (44.4, 69.8)Grafton 120 45.9 (37.7, 54.1)Hillsborough 525 53.4 (48.8, 58.0) Merrimack 225 53.5 (46.4, 60.5)Rockingham 337 50.7 (45.3, 56.1) Strafford 128 42.9 (35.5, 50.4)Sullivan 81 55.1 (43.8, 68.5)
NH 1791 50.7 (48.3, 53.0)US 44.4
Unintentional Injuries (Accidents)
Overview:
Unintentional injury is the preferred term for this cause of death group because homicides and suicides are not included, and the word “accident” suggests that these events cannot be prevented, when in fact, most injuries are preventable. However, NCHS refers to this cause of death group as
NH DHHS, DIVISION OF PUBLIC HEALTH SERVICES — HEALTH STATISTICS AND DATA MANAGEMENTLEADING CAUSES OF DEATH OF NEW HAMPSHIRE RESIDENTS, 1999 – 2001 APRIL 2005 49

Unintentional Injuries (Accidents)
accidents when reporting on leading causes of death. The injury prevention and surveillance staff at CDC prefers the term unintentional injury.
Risk Factors and Prevention:
The following web-site has excellent information on injury prevention:http://www.cdc.gov/ncipc/factsheets/fworks.htm
New Hampshire Facts:
Unintentional injuries are the 5th leading cause of death in NH. Unintentional injuries are the 3rd leading cause of years of potential life lost. Unintentional injuries are the leading cause of death for all age groups between ages 1 and 34. Unintentional injuries are the only leading cause of death to be listed in the first ten leading causes for every age group except infants.
Resources:
Burns, E., Twitchell, N. New Hampshire Injuries, 1999-2001,http://www.dhhs.nh.gov/DHHS/HSDM/LIBRARY/Data-Statistical+Report/default.htm.National Center for Health Statistics, CDC, Fast Stats, All Injuries, http://www.cdc.gov/nchs/fastats/acc-inj.htmNational Center for Injury Prevention and Control: http://www.cdc.gov/ncipc/default.htm
NH DHHS, DIVISION OF PUBLIC HEALTH SERVICES — HEALTH STATISTICS AND DATA MANAGEMENTLEADING CAUSES OF DEATH OF NEW HAMPSHIRE RESIDENTS, 1999 – 2001 50 APRIL 2005

Unintentional Injuries (Accidents)
Figure 31. Proportion of Unintentional Injury Deaths by Age Group and Sex, New Hampshire Residents, 1999-2001
Age Group
65 to 748%
55 to 648% 45 to 54
11%
35 to 4416%
25 to 349%
15 to 2414%
1 to 41%
5 to 144%85 plus
14%
75 to 8415%
Sex
Female35%
Male65%
Injuries are the leading cause of death among younger age groups, but the pie chart shows that all age groups are at risk. Two thirds of unintentional injury deaths involve men. Men suffer 300 more unintentional injury deaths a year in NH than females.
Table 32. Unintentional Injury Deaths by Year, New Hampshire Residents, 1999-2001
Year DeathsNH Age-
AdjustedRate /
100,000(95% CI)
US Age-Adjusted
Rate / 100,000
1999 326 27.2 (24.3, 30.2) 33.9
2000 335 27.3 (24.4, 30.3) 33.5
2001 377 30.5 (27.4, 33.6) 34.1
Total 1,038 28.4 (26.7, 30.1) 33.9
NH overall unintentional injuries death rates are lower than US rates every year from 1999 to 2001.
NH DHHS, DIVISION OF PUBLIC HEALTH SERVICES — HEALTH STATISTICS AND DATA MANAGEMENTLEADING CAUSES OF DEATH OF NEW HAMPSHIRE RESIDENTS, 1999 – 2001 APRIL 2005 51

Unintentional Injuries (Accidents)
Figure 32. Unintentional Injury Deaths by Mechanism, New Hampshire Residents, 1999-2001
Unspecif ied8%
Other18%
Suffocation6%
Poisoning12% Fall
18%
Motor vehicle traff ic38%
New Hampshire Injuries shows a more detailed breakdown of injury by mechanism, but the above chart is sufficient to point out the large proportions of injury deaths resulting from motor vehicle traffic crashes, falls, poisonings, and suffocation. The following table shows more detail. An obvious question is how these mechanisms are distributed across age groups. As might be expected, more motor vehicle traffic deaths involve young adults and most fall deaths involve the elderly. Poisoning death rates are relatively high in the 0-4 and 75+ age group. Please see the Injury Report for more information.
Table 33. Unintentional Injury Deaths by Mechanism, New Hampshire Residents, 1999-2001
Mechanism* Deaths Age-AdjustedRate/ 100,000 (95% CI)
Motor vehicle traffic 385 10.5 (9.5, 11.6) Fall 186 5.2 (4.5, 6.0)Poisoning 128 3.3 (2.8, 3.9)Suffocation 66 1.8 (1.4, 2.3)Fire/hot object or substance- fire/flame 40 1.1 (0.8, 1.5) Drowning 29 0.8 (0.5, 1.1)Other land transport 23 0.6 (0.4, 0.9) Natural/environmental 22 0.6 (0.4, 0.9)Other 77 2.1 (1.6, 2.6)Unspecified 82 2.3 (1.8, 2.9)
Total 1,038 28.4 (26.7, 30.1)* ICD-10 code ranges for these causes of death mechanisms are included in NH Injuries, 1999-2001.
NH DHHS, DIVISION OF PUBLIC HEALTH SERVICES — HEALTH STATISTICS AND DATA MANAGEMENTLEADING CAUSES OF DEATH OF NEW HAMPSHIRE RESIDENTS, 1999 – 2001 52 APRIL 2005

Unintentional Injuries (Accidents)
Figure 33. Unintentional Injury Death Rates by Age and Sex, New Hampshire Residents, 1999–2001
0
50
100
150
200
250
300
350
400
450
500
1 to
4
5 to
14
15 to
24
25 to
34
35 to
44
45 to
54
55 to
64
65 to
74
75 to
84
85 p
lus
Age
Spe
cific
Rat
e / 1
00,0
00TotalMaleFemale
The highest rates of injury are found among the oldest age groups. This fact is often hidden by the relatively larger number of deaths in the elderly from other causes.
Table 34. Unintentional Injury Death Rates by Age and Sex, New Hampshire Residents, 1999–2001
Male Female Total
AgeGroup Deaths Rate /
100,000(95% CI) Deaths Rate /100,000(95% CI) Deaths Rate /
100,000(95% CI) USRate
0 to 4 8 * 7 * 15 6.5(3.6, 10.7) 13.1
5 to 14 25 9(5.8, 13.3) 12 4.5(2.3, 7.9) 37 6.8(4.8, 9.4) 6.5
15 to 24 105 44.3(35.8, 52.8) 44 18.9(13.7, 25.4) 149 31.7(26.6, 36.8) 34.6
25 to 34 80 33.3(26.4, 41.4) 15 6.1(3.4, 10.1) 95 19.6(15.9, 24.0) 28.4
35 to 44 118 36.1(29.6, 42.6) 46 13.8(10.1, 18.4) 164 24.9(21.1, 28.7) 32.8
45 to 54 83 30.2(24.1, 37.4) 28 10.1(6.7, 14.6) 111 20.1(16.4, 23.9) 31.3
55 to 64 60 36.4(27.8, 46.9) 27 16.1(10.6, 23.4) 87 26.2(21.0, 32.3) 29.0
65 to 74 58 53.0(40.2, 68.5) 29 23.2(15.5, 33.3) 87 37.1(29.7, 45.8) 41.4
75 to 84 77 125.9(99.4, 157.4) 75 81.1(63.8, 101.7) 152 98.9(83.2, 114.7) 95.9
85 plus 55 364.0(274.2, 473.8) 86 215.0(172.0, 265.5) 141 255.9(213.7, 298.1) 272.9Age-
AdjustedTotal
669 40.3(37.2, 43.5) 369 18.1(16.2, 19.9) 1,038 28.4(26.7, 30.1) 33.9
* Rates are suppressed when based upon fewer than 10 deaths.
NH DHHS, DIVISION OF PUBLIC HEALTH SERVICES — HEALTH STATISTICS AND DATA MANAGEMENTLEADING CAUSES OF DEATH OF NEW HAMPSHIRE RESIDENTS, 1999 – 2001 APRIL 2005 53

Unintentional Injuries (Accidents)
Figure 34. Unintentional Injury Death Rates by County, New Hampshire Residents, 1999-2001
0
10
20
30
40
50
60
70
Belk
nap
Car
roll
Che
shire
Coo
s
Gra
fton
Hills
boro
ugh
Mer
rimac
k
Roc
king
ham
Stra
fford
Sul
livan
Age
-Adj
uste
d R
ate/
100
,000
NH Rate
US Rate
Rural areas tend to have higher injury rates, which may account for higher rates in the northern counties of Coos and Carroll. Reducing injury rates is often a high priority for individuals concerned with rural public health issues.
Table 35. Unintentional Injury Death Rates by County, New Hampshire Residents, 1999-2001
County DeathsAge-
AdjustedRate /
100,000(95% CI)
Belknap 53 30.8 (23.1, 40.3)Carroll 57 42.2 (32.0, 54.7)Cheshire 73 30.6 (24.0, 38.5)Coos 57 50.4 (38.1, 65.3)Grafton 70 27.5 (21.5, 34.8)Hillsborough 283 26.2 (23.1, 29.2)Merrimack 123 29.4 (24.2, 34.7)Rockingham 189 25.3 (21.7, 29.0)Strafford 87 26.1 (20.9, 32.2)Sullivan 46 36.4 (26.6, 48.5)
NH 1,038 28.4 (26.7, 30.1) US 33.9
NH DHHS, DIVISION OF PUBLIC HEALTH SERVICES — HEALTH STATISTICS AND DATA MANAGEMENTLEADING CAUSES OF DEATH OF NEW HAMPSHIRE RESIDENTS, 1999 – 2001 54 APRIL 2005

Diabetes
Diabetes
Overview:
Diabetes is a chronic metabolic disorder caused by insulin deficiency or absence, or by insulin excess accompanied by insulin resistance. Diabetes is characterized in more severe cases by chronic high blood sugar, sugar in urine, water and electrolyte loss, ketoacidosis, and coma.Long-term complications include neuropathy, retinopathy, nephropathy, degenerative changes in blood vessels, and increased susceptibility to infection.Diabetes is a risk factor for cardiovascular disease. It is also related to lipid disorders, obesity, hypertension, and impaired kidney function.
Risk Factors and Prevention (from the American Diabetes Association):
Keep weight in control or lose weight if you are overweight. Exercise moderately on a regular basis.Eat low fat meals high in fruits, vegetables and whole grain foods.Important for persons with diabetes: control blood sugar levels with diet and medication.
New Hampshire Facts:
Between 1999 and 2001, 2,931 NH residents died with diabetes listed as an underlying or contributing cause of death.
From the 2003 NH BRFSS:57% of adults in New Hampshire are overweight or obese as classified by US Department of Health and Human Services body mass index standards. 20% of adults in New Hampshire report no leisure-time physical activity during the previous month. 71% of adults in NH do not eat the recommended 5 servings of fruits and vegetables daily. Approximately 6% of NH adults had been told by a doctor or other health professional that they have diabetes
Resources:
American Diabetes Association: http://www.diabetes.org/home.jspNational Center for Chronic Disease Prevention and Health Promotion, Diabetes Public Health Resource: http://www.cdc.gov/diabetes/National Center for Health Statistics, CDC, Fast Stats, Diabetes: http://www.cdc.gov/nchs/fastats/diabetes.htm.
NH DHHS, DIVISION OF PUBLIC HEALTH SERVICES — HEALTH STATISTICS AND DATA MANAGEMENTLEADING CAUSES OF DEATH OF NEW HAMPSHIRE RESIDENTS, 1999 – 2001 APRIL 2005 55

Diabetes
NH DHHS, Public Health Services, Diabetes Education Program,
Pelletier, A. New Hampshire Diabetes Data, 2002 http://www.dhhs.nh.gov/DHHS/CDPC/LIBRARY/Data-Statistical+Report/diabetes-data.htm
Figure 35. Proportion of Diabetes Deaths by Age Group and Sex, New Hampshire Residents, 1999-2001
Age Group
65 to 7424%
45 to 545%
55 to 6410%
1 to 341% 35 to 44
2%
75 to 8435%
85 plus23%
Sex
Male48%
Female52%
Table 36. Diabetes Deaths by Year, New Hampshire Residents, 1999-2001
Year DeathsNH Age-
AdjustedRate /
100,000(95% CI)
US Age-Adjusted
Rate / 100,000
1999 297 25.6 (22.7, 28.5) 25.0
2000 297 25.0 (22.2, 27.9) 25.0
2001 291 23.8 (21.1, 26.5) 25.2
Total 885 24.8 (23.2, 26.5) 25.1
NH DHHS, DIVISION OF PUBLIC HEALTH SERVICES — HEALTH STATISTICS AND DATA MANAGEMENTLEADING CAUSES OF DEATH OF NEW HAMPSHIRE RESIDENTS, 1999 – 2001 56 APRIL 2005

Diabetes
Figure 36. Diabetes Death Rates by Age Group and Sex, New Hampshire Residents, 1999-2001
0
100
200
300
400
500
600
700
01 to
4
05 to
14
15 to
24
25 to
34
35 to
44
45 to
54
55 to
64
65 to
74
75 to
84
85 p
lus
Rat
e / 1
00,0
00
MaleFemaleTotal
Table 37. Diabetes Death Rates by Age Group and Sex, New Hampshire Residents, 1999-2001
Male Female Total
AgeGroup Deaths Rate /
100,000(95% CI) Deaths Rate / 100,000(95% CI) Deaths Rate /
100,000(95% CI) USRate
0 to 4 0 * 0 * 0 * 0.0
5 to 14 0 * 1 * 1 * 0.1
15 to 24 2 * 0 * 2 * 0.4
25 to 34 4 * 2 * 6 * 1.5
35 to 44 14 7.2(2.4, 7.2) 7 * 21 3.2(2.0, 4.9) 4.3
45 to 54 29 15.1(7.0, 15.1) 16 9.4(3.3, 9.4) 45 8.2(6.0, 10.9) 13.2
55 to 64 59 46.2(27.3, 46.2) 33 27.7(13.6, 27.7) 92 27.7(22.3, 33.9) 38.0
65 to 74 122 131.4(91.8, 131.4) 89 87.5(57.1, 87.5) 211 90.0(77.9, 102.1) 91.3
75 to 84 132 252.6(179.0, 252.6) 171 212.7(157.3, 212.7) 303 197.2(175.0, 219.4) 179.6
85 plus 65 548.3(332.0, 548.3) 139 405.4(289.8, 405.4) 204 370.2(319.4, 421.1) 318.5Age-
AdjustedTotal
427 29.3(26.4, 32.2) 458 21.4(19.4, 23.4) 885 24.8(23.2, 26.5) 25.1
* Rates are suppressed when based upon fewer than 10 deaths.
Diabetes death rates exceed the US rate in 85+ age group.
NH DHHS, DIVISION OF PUBLIC HEALTH SERVICES — HEALTH STATISTICS AND DATA MANAGEMENTLEADING CAUSES OF DEATH OF NEW HAMPSHIRE RESIDENTS, 1999 – 2001 APRIL 2005 57

Diabetes
Figure 37. Diabetes Death Rates by County, New Hampshire Residents, 1999-2001
05
1015202530354045
Bel
knap
Car
roll
Che
shire
Coo
s
Gra
fton
Hills
boro
ugh
Mer
rimac
k
Roc
king
ham
Stra
fford
Sul
livan
Age
-Adj
uste
d R
ate
/ 100
,000
US RateNH Rate
Diabetes death rates appear to fluctuate by county but all confidence intervals include the US and NH rates.
Table 38. Diabetes Death Rates by County, New Hampshire Residents, 1999-2001
County DeathsAge-
AdjustedRate
(95% CI)
Belknap 39 19.5 (13.9, 26.7) Carroll 32 18.6 (12.8, 26.3) Cheshire 66 27.5 (21.3, 35.0) Coos 38 26.9 (19.0, 36.9) Grafton 62 23.9 (18.3, 30.6) Hillsborough 256 25.8 (22.6, 29.0) Merrimack 99 23.5 (19.1, 28.7) Rockingham 160 23.5 (19.8, 27.1) Strafford 90 30.1 (24.2, 37.0) Sullivan 43 29.3 (21.2, 39.5)
NH 885 24.8 (23.2, 26.5)
US 25.1
Alzheimer’s Disease
Overview:
Alzheimer's disease (AD) is the most common form of dementia (a brain disorder that seriously affects a person's ability to carry out daily activities)
NH DHHS, DIVISION OF PUBLIC HEALTH SERVICES — HEALTH STATISTICS AND DATA MANAGEMENTLEADING CAUSES OF DEATH OF NEW HAMPSHIRE RESIDENTS, 1999 – 2001 58 APRIL 2005

Alzheimer’s Disease
among older people. It involves the parts of the brain that control thought, memory, and language.The causes of AD are unknown, and there is no cure. AD is a slow disease, starting with mild memory problems and ending with severe brain damage. The course the disease takes and how fast changes occur vary from person to person. On average, AD patients live from 8 to 10 years after they are diagnosed, though the disease can last for as many as 20 years.The number of people with the disease doubles every 5 years beyond age 65.As many as 10% of all people 65 years of age and older have Alzheimer’s.As many as 50% of all people 85 and older have the disease.
Risk Factors and Prevention (from the National Alzheimer’s Association):
Age is the most important known risk factor for AD. A family history of the disease is a known risk factor. Reduce high blood pressure.Maintain healthy blood cholesterol levels.Avoid smoking.Exercise regularly. Eat moderately.
Maintain social connections. Remain intellectually active. Being a female may be a risk factor. The greater number of Alzheimer’s disease deaths to women is primarily due to the greater number of women in the older age groups, but the increased number of deaths to women is not totally explained by this fact.
New Hampshire Facts:
AD is the 5th leading cause of death among NH residents over age 65. AD is the 7th leading cause of death across all age groups in NH.
Resources:
National Center for Health Statistics, Fast Stats, Alzheimer’s Disease: http://www.cdc.gov/nchs/fastats/alzheimr.htm
National Alzheimer’s Association Website: http://www.alz.orgFor statewide information on services, diagnostic facilities, and support groups, call the Alzheimer's Association of Vermont and New Hampshire at 1-603-226-5868.
NH DHHS, DIVISION OF PUBLIC HEALTH SERVICES — HEALTH STATISTICS AND DATA MANAGEMENTLEADING CAUSES OF DEATH OF NEW HAMPSHIRE RESIDENTS, 1999 – 2001 APRIL 2005 59

Alzheimer’s Disease
Information on state funded respite services to assist families who care for people with Alzheimer’s disease or related disorders is available through Bureau of Elderly and Adult Services at 1-603-271-4687.
Figure 38. Proportion of Alzheimer’s Disease Deaths by Age Group and Sex, New Hampshire Residents, 1999-2001
Age Group
75 to 8431%
85 plus62%
1 to 641% 65 to 74
6%
Sex
Male29%
Female71%
Table 39. Alzheimer’s Disease Deaths by Year, New Hampshire Residents, 1999-2001
Year DeathsNH Age-
AdjustedRate /
100,000(95% CI)
US Age-Adjusted
Rate / 100,000
1999 268 23.5 (20.7, 26.3) 16.5
2000 273 23.4 (20.6, 26.2) 18.0
2001 305 25.2 (22.4, 28.0) 19.0
Total 846 24.1 (22.4, 25.7) 17.8
NH DHHS, DIVISION OF PUBLIC HEALTH SERVICES — HEALTH STATISTICS AND DATA MANAGEMENTLEADING CAUSES OF DEATH OF NEW HAMPSHIRE RESIDENTS, 1999 – 2001 60 APRIL 2005

Alzheimer’s Disease
Figure 39. Alzheimer’s Disease Death Rates by Age Group and Sex, New Hampshire Residents, 1999-2001
Table 40. Alzheimer’s Disease Death Rates by Age Group and Sex, New Hampshire Residents, 1999-2001
Female Total
AgeGroup
Rate / 100,000(95% CI) Rate /
100,000(95% CI) Rate / 100,000(95% CI)
0 to 4 * * *
5 to 14 * * *
15 to 24 * * *
25 to 34 * * *
35 to 44 *
0
200
400
600
800
1000
1200
1 to
4
5 to
14
15 to
24
25 to
34
35 to
44
45 to
54
55 to
64
65 to
74
75 to
84
85 p
lus
Age
Spe
cific
Rat
e / 1
00,0
00TotalMaleFemale
Male
Deaths Deaths Deaths USRate
0 0 0 0.0
0 0 0 0.0
0 0 0 0.0
0 0 0 0.0
0 0 * 0 * 0.0
45 to 54 0 * 1 * 1 * 0.2
55 to 64 4 * 4 * 8 * 2.0
65 to 74 24 21.9(14.0, 32.6) 25 20.0(12.9, 29.5) 49 20.9(15.5, 27.6) 18.2
75 to 84 98 160.2(130.1, 195.2) 165 178.5(151.3, 205.7) 263 171.2(150.5, 191.9) 138.9
85 plus 116 767.8(628.1, 907.5) 409 1,022.7(923.6, 1,121.8) 525 952.8(871.3, 1,034.3) 658.5Age-
AdjustedTotal
242 20.8(18.1, 23.4) 604 25.4(23.4, 27.5) 846 24.1(22.4, 25.7) 17.8
* Rates are suppressed when based upon fewer than 10 deaths.
NH age-adjusted rates for Alzheimer’s disease are higher than the US for ages above 75.
NH DHHS, DIVISION OF PUBLIC HEALTH SERVICES — HEALTH STATISTICS AND DATA MANAGEMENTLEADING CAUSES OF DEATH OF NEW HAMPSHIRE RESIDENTS, 1999 – 2001 APRIL 2005 61

Alzheimer’s Disease
Figure 40. Alzheimer’s Disease Death Rates by County, New Hampshire Residents, 1999-2001
0
10
20
30
40
50
60
Belk
nap
Car
roll
Che
shire
Coo
s
Gra
fton
Hills
boro
ugh
Mer
rimac
k
Roc
king
ham
Stra
fford
Sul
livan
Age
-Adj
uste
d R
ate
/ 100
,000
US Rate
NH Rate
It is possible that patients with Alzheimer’s disease move to nursing homes in other counties and increase the rates in those counties.
Table 41. Alzheimer’s Disease Death Rates by County, New Hampshire Residents, 1999-2001
County DeathsAge-Adjusted
Rate / 100,000
(95% CI)
Belknap 35 18.0 (12.5, 25.0)Carroll 28 16.4 (10.9, 23.8)Cheshire 55 22.4 (16.9, 29.2)Coos 35 23.1 (16.1, 32.1)Grafton 66 24.9 (19.3, 31.7)Hillsborough 221 22.6 (19.6, 25.6) Merrimack 90 19.6 (15.7, 24.1)Rockingham 188 30.1 (25.8, 34.4) Strafford 71 24.4 (19.1, 30.8)Sullivan 57 39.5 (29.9, 51.2)
NH 846 24.1 (22.4, 25.7)US 17.8
Influenza and Pneumonia
Overview:
Pneumonia encompasses over 30 different diseases that infect or inflame the lungs. The major types of pneumonia are bacterial and viral pneumonia.Pneumonia also may be caused by inhalation of food, liquid, gases or dust, and by fungi. Certain diseases, such as tuberculosis, can cause pneumonia.
NH DHHS, DIVISION OF PUBLIC HEALTH SERVICES — HEALTH STATISTICS AND DATA MANAGEMENTLEADING CAUSES OF DEATH OF NEW HAMPSHIRE RESIDENTS, 1999 – 2001 62 APRIL 2005

Influenza and Pneumonia
Pneumococcus is the most common cause of bacterial pneumonia. In healthy individuals, but especially in people whose body defenses are weakened, the bacteria can multiply and cause serious damage or death. Pneumococcal pneumonia accounts for 10-25 percent of all pneumonia, and causes an estimated 40,000 deaths annually in the US.Approximately 50% of pneumonia cases are believed to be caused by viruses and tend to result in less severe illness than bacterial-caused pneumonia. The symptoms of viral pneumonia are similar to influenza (flu) symptoms, including fever, dry cough, headache, muscle pain, weakness, high fever, and increasing breathlessness.Because many patients with pneumonia have an unspecified pathogenic etiology, the percentage of deaths due to viral rather than bacterial pathogens is unknown. In many cases, patients are infected with both viruses and bacteria.Patients 65 years or older are at particular risk for death. Deaths in these patients account for 89% of all pneumonia and/or influenza deaths.Since 1960, influenza and pneumonia have been the leading cause of infectious disease deaths in the US.
Risk factors and Prevention (from the Centers for Disease Control and Prevention):
Influenza vaccination is recommended for all adults over 50 years of age because this age group has more people with high-risk conditions.Pneumococcal vaccination is recommended for adults 65 years or older and for individuals older than age 1 with chronic illness.Smokers have a higher risk for pneumonia than do nonsmokers. People considered at high risk for pneumonia include the elderly, the very young, and those with underlying health problems, such as chronic obstructive pulmonary disease (COPD), diabetes mellitus, congestive heart failure, and sickle cell anemia. Patients with diseases that impair the immune system, such as AIDS, or patients with other chronic illnesses, such as asthma, or those undergoing cancer therapy or organ transplantation, are particularly vulnerable.Early treatment with antibiotics can cure bacterial pneumonia and speed recovery from mycoplasma pneumonia. There are generally no effective treatments for most types of viral pneumonia; patients usually recover without treatment.
New Hampshire Facts:
Influenza and Pneumonia rank as the 8th leading cause of death in NH.94% percent of underlying cause of death codes in this category in NH list pneumonia and 6% list influenza. 93% of New Hampshire deaths from influenza and pneumonia occur in the 65+ age group.
NH DHHS, DIVISION OF PUBLIC HEALTH SERVICES — HEALTH STATISTICS AND DATA MANAGEMENTLEADING CAUSES OF DEATH OF NEW HAMPSHIRE RESIDENTS, 1999 – 2001 APRIL 2005 63

Influenza and Pneumonia
From the 2003 NH BRFSS:69% of NH adults aged 65 and older reported they had received a pneumonia vaccination.A New Hampshire 2010 objective is to increase the percentage of independently living adults, age 50 or over, who report having been vaccinated against influenza in the last 12 months from the 1997 NH baseline of 46% to the 2010 target of 80%. In 2003, 56% of NH adults aged 50 and older reported they had been vaccinated against influenza in the past 12 mo.
Resources:
National Center for Health Statistics, CDC, Fast Stats, Influenza: http://www.cdc.gov/nchs/fastats/flu.htmNational Center for Health Statistics, CDC, Fast Stats, Pneumonia: http://www.cdc.gov/nchs/fastats/pneumonia.htmCenters for Disease Control and Prevention, Influenza: http://www.cdc.gov/flu/New Hampshire Department of Health and Human Services, Influenza:http://www.dhhs.nh.gov/DHHS/CDCSNH DHHS, Communicable Disease Surveillance, Influenza Surveillance Coordinator, Susan Bascom, (603) 271-8325.
Figure 41. Proportion of Influenza and Pneumonia Deaths by Age Group and Sex, New Hampshire Residents, 1999-2001
Age Group
75 to 8430%
65 to 74 11%
55 to 643%
45 to 54 2%
1 to 44 2%
85 plus52%
Sex
Male43%
Female57%
The greater number of influenza and pneumonia deaths of women is due to the greater number of women in the older age groups. While total deaths are lower, rates are higher for men in older age groups.
NH DHHS, DIVISION OF PUBLIC HEALTH SERVICES — HEALTH STATISTICS AND DATA MANAGEMENTLEADING CAUSES OF DEATH OF NEW HAMPSHIRE RESIDENTS, 1999 – 2001 64 APRIL 2005

Influenza and Pneumonia
Table 42. Influenza and Pneumonia Deaths by Year, New Hampshire Residents, 1999-2001
Year DeathsNH Age-
AdjustedRate /
100,000(95% CI)
US Age-Adjusted
Rate / 100,000
1999 183 16.0 (13.7, 18.3) 23.5
2000 192 16.4 (14.0, 18.7) 23.7
2001 216 17.8 (15.4, 20.2) 21.8
Total 591 16.7 (15.4, 18.1) 23.0
Figure 42. Influenza and Pneumonia Deaths by Age Group and Sex, New Hampshire Residents, 1999-2001
0
100
200
300
400
500
600
700
800
900
1 to
4
5 to
14
15 to
24
25 to
34
35 to
44
45 to
54
55 to
64
65 to
74
75 to
84
85 p
lus
Rat
e / 1
00,0
00
MaleFemaleTotal
Table 43. Influenza and Pneumonia Deaths by Age Group and Sex, New Hampshire Residents, 1999-2001
Male Female Total
AgeGroup Deaths Rate /
100,000(95% CI) Deaths Rate /100,000(95% CI) Deaths Rate /
100,000(95% CI) USRate
0 to 4 1 * 1 * 2 * 2.2
5 to 14 0 * 0 * 0 * 0.2
15 to 24 1 * 1 * 2 * 0.5
25 to 34 2 * 1 * 3 * 0.9
35 to 44 5 * 2 * 7 * 2.3
45 to 54 9 * 2 * 11 2.0(1.0, 3.6) 4.6
55 to 64 10 6.1(2.9, 11.2) 7 * 17 5.1(3.0, 8.2) 11.2
65 to 74 37 33.8(23.8, 46.6) 30 24.0(16.2, 34.3) 67 28.6(22.1, 36.3) 37.5
75 to 84 92 150.4(121.2, 184.5) 84 90.9(72.5, 112.5) 176 114.6(97.6, 131.5) 155.2
85 plus 96 635.4(514.7, 775.9) 208 520.1(449.4, 590.8) 304 551.7(489.7, 613.8) 723.9Age-
AdjustedTotal
253 20.3(17.7, 22.8) 336 14.5(12.9, 16.0) 589 16.7(15.3, 18.0) 23.0
* Rates are suppressed when based upon fewer than 10 deaths.
NH DHHS, DIVISION OF PUBLIC HEALTH SERVICES — HEALTH STATISTICS AND DATA MANAGEMENTLEADING CAUSES OF DEATH OF NEW HAMPSHIRE RESIDENTS, 1999 – 2001 APRIL 2005 65

Influenza and Pneumonia
Figure 43. Influenza and Pneumonia Death Rates by County, New Hampshire Residents, 1999–2001
05
1015202530354045
Bel
knap
Car
roll
Che
shire
Coo
s
Gra
fton
Hills
boro
ugh
Mer
rimac
k
Roc
king
ham
Stra
fford
Sul
livan
Age
-Adj
uste
d R
ate
/ 100
,000
US Rate
NH Rate
Higher death rates in Coos County may be of concern.
Table 44. Influenza and Pneumonia Death Rates by County, New Hampshire Residents, 1999–2001
County DeathsAge-Adjusted
Rate / 100,000
(95% CI)
Belknap 29 14.9 (10.0, 21.4)Carroll 36 22.3 (15.6, 30.8)Cheshire 48 19.7 (14.5, 26.1)Coos 46 32.0 (23.5, 42.7)Grafton 43 16.3 (11.8, 22.0)Hillsborough 143 14.5 (9.9, 19.2)Merrimack 87 19.5 (15.6, 24.1)Rockingham 100 15.5 (9.5, 21.5)Strafford 36 12.3 (8.6, 17.0)Sullivan 23 16.1 (10.2, 24.2)
NH Rate 591 16.7 (15.4, 18.1) US Rate 23.7
NH DHHS, DIVISION OF PUBLIC HEALTH SERVICES — HEALTH STATISTICS AND DATA MANAGEMENTLEADING CAUSES OF DEATH OF NEW HAMPSHIRE RESIDENTS, 1999 – 2001 66 APRIL 2005

Influenza and Pneumonia
Figure 44. Average Number of Influenza and Pneumonia Deaths Per Month, New Hampshire Residents, 1999-2001
0
5
10
15
20
25
30
Janu
ary
Febr
uary
Mar
ch
April
May
June
July
Aug
ust
Sept
embe
r
Oct
ober
Nov
embe
r
Dec
embe
r
Ave
rage
Num
ber o
f Dea
ths
Note that there is an increase of influenza (flu) and pneumonia deaths during the flu season (beginning of October to mid-May). While it is uncertain how many of these additional deaths are related to flu because the same risk factors generally increase pneumonia deaths, the increase is often attributed to flu.
Suicide
Overview:
More people die from suicide each year than homicide. In 2000, there were 29,350 suicide deaths in the US (an average of 80 per day) and 16,765 homicide deaths. Females are more likely to attempt suicide, but males are 4 times more likely to die. Nationally, males over age 65 have the highest suicide rates.
Risk Factors and Prevention (from the National Center for Injury Prevention and Control):
One of the strongest risk factors for suicide is a previous attempt; therefore, surveillance of suicide attempts can help identify high-risk populations and target prevention strategies. Substance and alcohol abuse, mental illness, and depression are risk factors for suicide.For New Hampshire young people 15-24 years old, suicide is the second leading cause of death, behind unintentional injury.
NH DHHS, DIVISION OF PUBLIC HEALTH SERVICES — HEALTH STATISTICS AND DATA MANAGEMENTLEADING CAUSES OF DEATH OF NEW HAMPSHIRE RESIDENTS, 1999 – 2001 APRIL 2005 67
Suicide
Risk factors for suicide among older persons differ from those among the young. In addition to a higher prevalence of depression, older persons are more socially isolated and more frequently use highly lethal methods.Nearly 5 million of the 32 million Americans aged 65 and older suffer from some form of depression.
New Hampshire Facts:
Suicide is the 9th leading cause of death in New Hampshire. Nearly half of all suicides in New Hampshire involve firearms.Males account for 10 times more firearm-related suicide deaths than females in NH.
Resources:
Burns, E, Twitchell, N. New Hampshire Injuries, 1999-2001.http://www.dhhs.nh.gov/DHHS/HSDM/LIBRARY/default.htmNational Center for Health Statistics, CDC, Fast Stats, Suicide: http://www.cdc.gov/nchs/fastats/suicide.htmUnited States Department of Health and Human Services, “The Surgeon General’s Call to Action to Prevent Suicide, 1999”: http://www.surgeongeneral.gov/library/calltoaction/recommendations.htmNational Center for Injury Prevention and Control, CDC, Suicide Fact Sheet: http://www.cdc.gov/ncipc/factsheets/suifacts.htm
NH DHHS, DIVISION OF PUBLIC HEALTH SERVICES — HEALTH STATISTICS AND DATA MANAGEMENTLEADING CAUSES OF DEATH OF NEW HAMPSHIRE RESIDENTS, 1999 – 2001 68 APRIL 2005

Suicide
Figure 45. Proportion of Suicide Deaths by Age Group and Sex, New Hampshire Residents, 1999-2001
Age Group
5 to 141%
1 to 4< 1%
45 to 5420%
35 to 4425%
25 to 3418%
15 to 2414%
85 plus2%
75 to 846%
65 to 745%
55 to 649%
Sex
Female21%
Male79%
Table 45. Suicide Deaths by Year, New Hampshire Residents, 1999-2001
Year DeathsNH Age-
AdjustedRate /
100,000(95% CI)
US Age-Adjusted
Rate / 100,000
1999 140 11.4 (9.5, 13.3) 10.5
2000 145 11.4 (9.6, 13.3) 10.4
2001 170 13.4 (11.4, 15.4) 10.7
Total 455 12.1 (11.0, 13.2) 10.5
NH suicide deaths increased in 2001 and became higher than US rates.
Figure 46. Suicide Deaths by Mechanism, New Hampshire Residents, 1999-2001
Suffocation22%
Other8%
Firearm48%
Poisoning22%
Most suffocation deaths are hangings. As mentioned above, firearms are used in nearly 50% of NH suicide deaths.
NH DHHS, DIVISION OF PUBLIC HEALTH SERVICES — HEALTH STATISTICS AND DATA MANAGEMENTLEADING CAUSES OF DEATH OF NEW HAMPSHIRE RESIDENTS, 1999 – 2001 APRIL 2005 69

Suicide
Table 46. Suicide Deaths by Mechanism, New Hampshire Residents, 1999-2001
Selected Mechanism* Deaths Age-AdjustedRate/ 100,000 (95% CI)
Firearm 216 5.8 (5.0, 6.6)Poisoning 102 2.6 (2.1, 3.2)Suffocation 101 2.7 (2.2, 3.2)Other 36 1.0 (0.7, 1.3)
Total 455 12.1 (11.0, 13.2)* ICD-10 code ranges for these causes of death mechanisms are included in NH Injuries, 1999-2001.
Figure 47. Suicide Death Rates by Age Group and Sex, New Hampshire Residents, 1999-2001
0
20
40
60
80
100
120
01 to
4
05 to
14
15 to
24
25 to
34
35 to
44
45 to
54
55 to
64
65 to
74
75 to
84
85 p
lus
Rat
e / 1
00,0
00
Male
Female
Total
Table 47. Suicide Death Rates by Age Group and Sex, New Hampshire Residents, 1999-2001
Male Female Total
AgeGroup Deaths Rate /
100,000(95% CI) Deaths Rate / 100,000(95% CI) Deaths Rate /
100,000(95% CI) USRate
0 to 4 0 * 0 * 0 * 0.0
5 to 14 4 * 2 * 6 * 0.7
15 to 24 56 23.6(17.8, 30.6) 7 * 63 13.4(10.3, 17.2) 10.1
25 to 34 64 26.6(20.5, 34.0) 17 7.0(4.1, 11.2) 81 16.7(13.3, 20.8) 12.5
35 to 44 92 28.1(22.7, 34.5) 24 7.2(4.6, 10.7) 116 17.6(14.4, 20.8) 14.5
45 to 54 66 24.0(18.6, 30.5) 23 8.3(5.3, 12.5) 89 16.1(13.0, 19.9) 14.5
55 to 64 31 18.8(12.8, 26.7) 8 4.8(2.1, 9.5) 39 11.7(8.3, 16.0) 12.5
65 to 74 19 17.4(10.5, 27.2) 5 4.0(1.3, 9.3) 24 10.2(6.6, 15.2) 13.1
75 to 84 20 32.7(20.0, 50.5) 7 7.6(3.1, 15.7) 27 17.6(11.6, 25.6) 17.7
85 plus 9 59.6(27.3, 113.1) 1 2.5(0.1, 13.9) 10 18.1(8.7, 33.4) 18.7Age-
AdjustedTotal
361 20.1(18.0, 22.2) 94 4.8(3.8, 5.8) 455 12.1(11.0, 13.2) 10.5
* Rates are suppressed when based upon fewer than 10 deaths.
NH DHHS, DIVISION OF PUBLIC HEALTH SERVICES — HEALTH STATISTICS AND DATA MANAGEMENTLEADING CAUSES OF DEATH OF NEW HAMPSHIRE RESIDENTS, 1999 – 2001 70 APRIL 2005

Suicide
Figure 48. Suicide Death Rates by County, New Hampshire Residents, 1999–2001
0
5
10
15
20
25
30
35
Bel
knap
Car
roll
Che
shire
Coo
s
Gra
fton
Hills
boro
ugh
Mer
imac
k
Roc
king
ham
Stra
fford
Sul
livan
Age
-Adj
uste
d R
ate
/ 100
,000
NH RateUS Rate
Suicide rates tend to be higher in rural areas and may account for higher rates in Carroll, Coos, and Sullivan counties.
Table 48. Suicide Death Rates by County, New Hampshire Residents, 1999–2001
County DeathsAge-
AdjustedRate /
100,000(95% CI)
Belknap 22 12.1 (7.6, 18.3)Carroll 27 21.4 (14.1, 31.2)Cheshire 28 12.4 (8.2, 17.9)Coos 20 20.8 (12.7, 32.2)
27 10.9 (7.2, 15.9)138 11.7 (9.8, 13.7)
51 12.3 (9.1, 16.1)80 9.9 (7.8, 12.3)40 11.9 (8.5, 16.2)21 17.0 (10.5, 25.9)
455 12.1 (11.0, 13.2)10.5
GraftonHillsboroughMerrimackRockinghamStraffordSullivan
NHUS
Nephritis
Overview:
Nephritis is an inflammation of the kidney.The most common form of acute nephritis is glomerulonephritis. This condition affects children and teenagers far more often than it affects adults. It is inflammation of the glomeruli, or small round filters located in the
NH DHHS, DIVISION OF PUBLIC HEALTH SERVICES — HEALTH STATISTICS AND DATA MANAGEMENTLEADING CAUSES OF DEATH OF NEW HAMPSHIRE RESIDENTS, 1999 – 2001 APRIL 2005 71

Nephritis
kidney. Acute glomerulonephritis usually develops a few weeks after a strep infection of the throat or skin. Symptoms of glomerulonephritis include fatigue, high blood pressure, and swelling. Swelling is most notable in the hands, feet, ankles, and face. Pyelonephritis affects adults more than children, and is an inflammation of the kidney and upper urinary tract. Pyelonephritis usually occurs suddenly, and the acute form of this disease is more common in adult women. The most common cause of this form of bacterial nephritis is the backward flow of infected urine from the bladder into the upper urinary tract. Its symptoms include fever and chills, fatigue, burning or frequent urination, cloudy or bloody urine, and aching pain on one or both sides of the lower back or abdomen.A third type of nephritis is hereditary nephritis, a rare inherited condition.Hereditary nephritis can be present at birth. This rare disease presents in many different forms and can be responsible for up to 5% of end-stage renal disease in men.
Risk Factors and Prevention (from the National Kidney Foundation):
Avoiding exposure to strep infection and obtaining prompt medical treatment for scarlet fever or other infections can prevent streptococcal infections that may lead to glomerulonephritis. Pyelonephritis can best be avoided if those with a history of urinary tract infections take care to drink plenty of fluids, urinate frequently, and practice good hygiene following urination. Hereditary nephritis cannot be prevented, but research to combat the disease continues.
New Hampshire Facts:
Nephritis is the 10th leading cause of death in NH.
Resources:
American Kidney Fund (AKF). Suite 1010,6110 Executive Boulevard, Rockville, MD 20852. (800) 638-8299. http://www.kidneyfund.org/National Kidney Foundation. 30 East 33rd St., New York, NY 10016. (800) 622-9010. http://www.kidney.orgNational Center for Health Statistics, CDC, Fast Stats, Kidney Disease: http://www.cdc.gov/nchs/fastats/kidbladd.htm
NH DHHS, DIVISION OF PUBLIC HEALTH SERVICES — HEALTH STATISTICS AND DATA MANAGEMENTLEADING CAUSES OF DEATH OF NEW HAMPSHIRE RESIDENTS, 1999 – 2001 72 APRIL 2005

Nephritis
Figure 4 . Proportion of Nephritis Deaths by Age Group and Sex, New Hampshire Residents, 91999-2001
Age Group
75 to 8432%
1 to 442% 45 to 54
3%
55 to 646%
65 to 7418%
85 plus39%
N = 455
Sex
Male44%
Female56%
Table 49. Nephritis Deaths by Year, New Hampshire Residents, 1999-2001
Year DeathsNH Age-
AdjustedRate /
100,000(95% CI)
US Age-Adjusted
Rate / 100,000
1999 92 7.9 (6.3, 9.6) 13.0
2000 106 8.9 (7.2, 10.6) 13.5
2001 137 11.3 (9.4, 13.3) 13.9
Total 9.4 (8.4, 10.4) 13.5335
NH DHHS, DIVISION OF PUBLIC HEALTH SERVICES — HEALTH STATISTICS AND DATA MANAGEMENTLEADING CAUSES OF DEATH OF NEW HAMPSHIRE RESIDENTS, 1999 – 2001 APRIL 2005 73

Nephritis
Figure 50. Nephritis Death Rates by Age Group and Sex, New Hampshire Residents, 1999-2001
050
100150200250300350400450500
0 to
4
5 to
14
15 to
24
25 to
34
35 to
44
45 to
54
55 to
64
65 to
74
75 to
84
85 p
lus
Rat
e / 1
00,0
00MaleFemaleTotal
Table 50. Nephritis Death Rates by Age Group and Sex, New Hampshire Residents, 1999-2001
Male Female Total
AgeGroup Deaths Rate /
100,000(95% CI) Deaths Rate / 100,000(95% CI) Deaths Rate /
100,000(95% CI) USRate
0 to 4 1 * 1 * 2 * 0.9
5 to 14 0 * 0 * 0 * 0.1
15 to 24 0 * 0 * 0 * 0.2
25 to 34 2 * 1 * 3 * 0.6
35 to 44 * 4 * 5 * 1.6
45 to 54 7 * 3 * 10 1.8(0.9, 3.3) 4.4
55 to 64 10 6.1(2.9, 11.2) 10 6.0(2.9, 11.0) 20 6.0(3.7, 9.3) 12.6
65 to 74 25 22.9(14.8, 33.8) 35 28.0(19.5, 38.9) 60 25.6(19.5, 32.9) 38.4
75 to 84 51 83.4(62.1, 109.7) 57 61.7(46.7, 79.9) 108 70.3(57.0, 83.6) 100.8
85 plus 49 324.3(239.9, 428.7) 78 195.0(154.1, 243.4) 127 230.5(190.4, 270.6) 277.3Age-
AdjustedTotal
146 11.4 189 8.6 335 9.5 13.5
1
* Rates are suppressed when based upon fewer than 10 deaths.
NH DHHS, DIVISION OF PUBLIC HEALTH SERVICES — HEALTH STATISTICS AND DATA MANAGEMENTLEADING CAUSES OF DEATH OF NEW HAMPSHIRE RESIDENTS, 1999 – 2001 74 APRIL 2005

Nephritis
Figure 51. Nephritis Death Rates by County, New Hampshire Residents, 1999–2001
02468
1012141618
Bel
knap
Car
roll
Che
shire
Coo
s
Gra
fton
Hills
boro
ugh
Mer
rimac
k
Roc
king
ham
Stra
fford
Sul
livan
Age
-Adj
uste
d R
ate
/ 100
,000
*
US Rate
NH Rate
* Rates are suppressed when based upon fewer than 10 deaths.
Table 51. Nephritis Death Rates by County, New Hampshire Residents, 1999–2001
County Deaths Age-AdjustedRate / 100,000 (95% CI)
Belknap 14 7.1 (3.9, 11.9)Carroll 15 8.6 (4.8, 14.3)Cheshire 16 6.7 (3.8, 10.9)Coos 13 9.1 (4.8, 15.6)Grafton 12 4.7 (2.4, 8.2)Hillsborough 97 9.9 (8.0, 12.0)Merrimack 46 11.0 (8.1, 14.7)Rockingham 78 11.8 (9.4, 14.8)Strafford 35 12.0 (8.3, 16.7)Sullivan 9 *
NH 335 9.5 (8.4, 10.5)US 13.5* Rates are suppressed when based upon fewer than 10 deaths.
NH DHHS, DIVISION OF PUBLIC HEALTH SERVICES — HEALTH STATISTICS AND DATA MANAGEMENTLEADING CAUSES OF DEATH OF NEW HAMPSHIRE RESIDENTS, 1999 – 2001 APRIL 2005 75

Leading Cause of Death for Selected Cities and Towns
Leading Causes of Death for Selected Cities and Towns Overview:
There is considerable interest in public health data at the town level. This section contains information on leading causes of death for the 14 selected cities and towns with an average of at least 150 total deaths per year in the three-year period 1999-2001.Information for other towns can be obtained by requesting the information from the department (although smaller towns will have less useful data that in some cases would need to be suppressed to ensure confidentiality). Rates are not shown for towns where there are fewer than 10 deaths in a category because the small numbers lead to unstable rate calculations.
While it is interesting to compare data between towns, apparent differences may be due to location of nursing homes or differences in procedures for recording death certificates.To reduce the temptation to put too much weight on such comparisons, we display data for each town separately.
Selected New Hampshire Cities and Towns
Selected Cities and Towns
AverageDeaths Per
YearBedford Hillsborough 151
Coos 158Claremont Sullivan 164Concord Merrimack 408Derry Rockingham 175Dover Strafford 261Exeter Rockingham 170Keene Cheshire 242
Belknap 203Manchester HillsboroughNashua Hillsborough 639Portsmouth Rockingham 240Rochester Strafford 272Salem Rockingham 195
Laconia972
County
Berlin
NH DHHS, DIVISION OF PUBLIC HEALTH SERVICES — HEALTH STATISTICS AND DATA MANAGEMENTLEADING CAUSES OF DEATH OF NEW HAMPSHIRE RESIDENTS, 1999 – 2001 76 APRIL 2005

Leading Cause of Death for Selected Cities and Towns
Bedford
Figure 52. Leading Causes of Death for Bedford, New Hampshire Residents, 1999-2001 Average
0
10
20
30
40
50
60D
isea
ses
ofH
eart
Inva
sive
Can
cer
Cer
ebro
vasc
ular
CLR
D
Uni
nten
tiona
lIn
jurie
s
Dia
bete
s
Ave
rage
Dea
ths
Per Y
ear
Table 52. Leading Cause of Death Rates for Bedford, New Hampshire Residents, 1999-2001
Rank Cause Deaths Age-AdjustedRate / 100,000 (95% CI)
1 Diseases of Heart 167 285.7 (241.2, 330.2) 2 Invasive Cancer 98 185.2 (150.3, 225.7) 3 Cerebrovascular 38 63.5 (44.9, 87.2)4 CLRD 31 53.5 (36.4, 76.0)5 Unintentional Injuries 14 25.1 (13.7, 42.2) 6 Diabetes 13 24.3 (12.9, 41.5)7 Flu & Pneumonia 6 *8 Suicide 5 *
NH DHHS, DIVISION OF PUBLIC HEALTH SERVICES — HEALTH STATISTICS AND DATA MANAGEMENTLEADING CAUSES OF DEATH OF NEW HAMPSHIRE RESIDENTS, 1999 – 2001 APRIL 2005 77

Leading Cause of Death for Selected Cities and Towns
Berlin
Figure 53. Leading Causes of Death for Berlin, New Hampshire Residents, 1999-2001 Average
05
101520253035404550
Dis
ease
s of
Hea
rt
Inva
sive
Can
cer
CLR
D
Cer
ebro
vasc
ular
Uni
nten
tiona
lIn
jurie
s
Dia
bete
s
Flu
& P
neum
onia
Alz
heim
er'sA
vera
ge D
eath
s Pe
r Yea
r
Table 53. Leading Causes of Death Rates for Berlin, New Hampshire Residents, 1999-2001
Rank Cause Deaths Age-AdjustedRate / 100,000 (95% CI)
1 Diseases of Heart 139 254.0 (210.3, 297.6) 2 Invasive Cancer 120 236.4 (192.5, 280.2) 3 CLRD 27 51.5 (33.9, 75.0)4 Cerebrovascular 26 47.9 (31.3, 70.2)5 Unintentional Injuries 21 61.5 (38.1, 94.0) 6 Diabetes 16 30.4 (17.4, 49.4)7 Flu & Pneumonia 15 23.0 (12.9, 37.9) 8 Alzheimer’s 14 22.2 (12.1, 37.2)9 Nephritis 6 *10 Aortic Aneurysm 5 *
NH DHHS, DIVISION OF PUBLIC HEALTH SERVICES — HEALTH STATISTICS AND DATA MANAGEMENTLEADING CAUSES OF DEATH OF NEW HAMPSHIRE RESIDENTS, 1999 – 2001 78 APRIL 2005

Leading Cause of Death for Selected Cities and Towns
Claremont
Figure 54. Leading Causes of Death for Claremont, New Hampshire Residents, 1999-2001 Average
05
101520253035404550
Dis
ease
s of
Hea
rt
Inva
sive
Can
cer
CLR
D
Alz
heim
er's
Cer
ebro
vasc
ular
Uni
nten
tiona
lIn
jurie
s
Dia
bete
sAve
rage
Dea
ths
Per Y
ear
Table 54. Leading Causes of Death Rates for Claremont, New Hampshire Residents, 1999-2001
Rank Cause Deaths Age-AdjustedRate / 100,000 (95% CI)
1 Diseases of Heart 135 262.3 (217.8, 306.8) 2 Invasive Cancer 112 221.9 (180.4, 263.3) 3 CLRD 35 68.2 (47.5, 94.8)4 Alzheimer’s 34 64.4 (44.6, 90.0)5 Cerebrovascular 26 49.6 (32.4, 72.7)6 Unintentional Injuries 16 39.5 (22.6, 64.2) 7 Diabetes 15 29.7 (16.6, 49.0)8 Liver Disease 8 *9 Flu & Pneumonia 7 *10 Suicide 6 *
NH DHHS, DIVISION OF PUBLIC HEALTH SERVICES — HEALTH STATISTICS AND DATA MANAGEMENTLEADING CAUSES OF DEATH OF NEW HAMPSHIRE RESIDENTS, 1999 – 2001 APRIL 2005 79

Leading Cause of Death for Selected Cities and Towns
Concord
Figure 55. Leading Causes of Death for Concord, New Hampshire Residents, 1999-2001 Average
020406080
100120140
Dis
ease
s of
Hea
rt
Inva
sive
Can
cer
Cer
ebro
vasc
ular
CLR
D
Alz
heim
er's
Flu
& P
neum
onia
Uni
nten
tiona
lIn
jurie
s
Dia
bete
s
Nep
hriti
s
Sui
cideA
vera
ge D
eath
s Pe
r Yea
r
Table 55. Leading Causes of Death Rates for Concord, New Hampshire Residents, 1999-2001
Rank Cause Deaths Age-AdjustedRate / 100,000 (95% CI)
1 Diseases of Heart 355 221.5 (197.5, 245.5) 2 Invasive Cancer 249 181.0 (157.8, 204.1) 3 Cerebrovascular 98 59.3 (48.1, 72.2)4 CLRD 89 63.1 (50.7, 77.6)5 Alzheimer’s 47 24.6 (18.1, 32.8)
Flu & Pneumonia 41 22.6 (16.2, 30.7) 7 Unintentional Injuries 40 28.4 (20.3, 38.7) 8 Diabetes 38 28.0 (19.8, 38.4)9 Nephritis 15 10.8 (6.1, 17.8)10 Suicide 11 8.6 (4.3, 15.3)
6
NH DHHS, DIVISION OF PUBLIC HEALTH SERVICES — HEALTH STATISTICS AND DATA MANAGEMENTLEADING CAUSES OF DEATH OF NEW HAMPSHIRE RESIDENTS, 1999 – 2001 80 APRIL 2005

Leading Cause of Death for Selected Cities and Towns
Derry
Figure 56. Leading Causes of Death for Derry, New Hampshire Residents, 1999-2001 Average
0
10
20
30
40
50
60In
vasi
ve C
ance
r
Dis
ease
s of
Hea
rt CLR
D
Cer
ebro
vasc
ular
Uni
nten
tiona
lIn
jurie
s
Dia
bete
s
Alz
heim
er'sA
vera
ge D
eath
s Pe
r Yea
r
Table 56. Leading Causes of Death Rates for Derry, New Hampshire Residents, 1999-2001
Rank Cause Deaths Age-AdjustedRate / 100,000 (95% CI)
1 Invasive Cancer 156 262.9 (219.8, 305.9) 2 Diseases of Heart 142 276.4 (229.8, 323.0) 3 CLRD 32 59.7 (40.9, 84.3)4 Cerebrovascular 28 53.3 (35.4, 77.0)5 Unintentional Injuries 24 31.5 (20.2, 46.9)
15 24.4 (13.7, 40.2)7 Alzheimer’s 10 21.7 (10.4, 39.8)8 Suicide 8 *9 Parkinson’s 8 *10 Flu & Pneumonia 7 *
6 Diabetes
NH DHHS, DIVISION OF PUBLIC HEALTH SERVICES — HEALTH STATISTICS AND DATA MANAGEMENTLEADING CAUSES OF DEATH OF NEW HAMPSHIRE RESIDENTS, 1999 – 2001 APRIL 2005 81

Leading Cause of Death for Selected Cities and Towns
Dover
Figure 57. Leading Causes of Death for Dover, New Hampshire Residents, 1999-2001 Average
01020304050607080
Dis
ease
s of
Hea
rt
Inva
sive
Can
cer
Cer
ebro
vasc
ular
Alz
heim
er's
CLR
D
Dia
bete
s
Uni
nten
tiona
lIn
jurie
s
Nep
hriti
s
Sep
ticem
ia
Sui
cideA
vera
ge D
eath
s Pe
r Yea
r
Table 57. Leading Causes of Death Rates for Dover, New Hampshire Residents, 1999-2001
Rank Cause Deaths Age-AdjustedRate / 100,000 (95% CI)
1 Diseases of Heart 215 222.4 (192.1, 252.7) 2 Invasive Cancer 179 203.4 (173.2, 233.7) 3 Cerebrovascular 67 70.8 (54.9, 89.9)4 Alzheimer’s 34 32.5 (22.5, 45.5)5 CLRD 33 37.0 (25.5, 52.0)6 Diabetes 26 27.7 (18.1, 40.6)7 Unintentional Injuries 20 22.7 (13.8, 35.0) 8 Nephritis 11 10.9 (5.4, 19.4)9 Septicemia 10 11.4 (5.5, 21.0)10 Suicide 10 12.3 (5.9, 22.6)
NH DHHS, DIVISION OF PUBLIC HEALTH SERVICES — HEALTH STATISTICS AND DATA MANAGEMENTLEADING CAUSES OF DEATH OF NEW HAMPSHIRE RESIDENTS, 1999 – 2001 82 APRIL 2005

Leading Cause of Death for Selected Cities and Towns
Exeter
Figure 58. Leading Causes of Death for Exeter, New Hampshire Residents, 1999-2001 Average
0
10
20
30
40
50
60D
isea
ses
ofH
eart
Inva
sive
Can
cer
Cer
ebro
vasc
ular
CLR
D
Alz
heim
er's
Flu
& P
neum
oniaA
vera
ge D
eath
s Pe
r Yea
r
Table 58. Leading Causes of Death Rates for Exeter, New Hampshire Residents, 1999-2001
Rank Cause Deaths Age-AdjustedRate / 100,000 (95% CI)
1 Diseases of Heart 146 210.4 (174.8, 246.0) 2 Invasive Cancer 106 188.7 (151.7, 225.6) 3 Cerebrovascular 57 78.7 (59.6, 102.0)4 CLRD 33 51.1 (35.2, 71.7)5 Alzheimer’s 22 28.1 (17.6, 42.5)6 Flu & Pneumonia 10 12.7 (6.1, 23.3) 7 Diabetes 8 *8 Parkinson’s 8 *9 Unintentional Injuries 8 *10 Benign Neoplasms 7 *
NH DHHS, DIVISION OF PUBLIC HEALTH SERVICES — HEALTH STATISTICS AND DATA MANAGEMENTLEADING CAUSES OF DEATH OF NEW HAMPSHIRE RESIDENTS, 1999 – 2001 APRIL 2005 83

Leading Cause of Death for Selected Cities and Towns
Keene
Figure 59. Leading Causes of Death for Keene, New Hampshire Residents, 1999-2001 Average
01020304050607080
Dis
ease
s of
Hea
rt
Inva
sive
Can
cer
Cer
ebro
vasc
ular
CLR
D
Dia
bete
s
Flu
& P
neum
onia
Alz
heim
er's
Sui
cide
Uni
nten
tiona
lIn
jurie
s
Ave
rage
Dea
ths
Per Y
ear
Table 59. Leading Causes of Death Rates for Keene, New Hampshire Residents, 1999-2001
Rank Cause Deaths Age-AdjustedRate / 100,000 (95% CI)
1 Diseases of Heart 225 260.9 (226.4, 295.4) 2 Invasive Cancer 163 203.9 (172.2, 235.6) 3 Cerebrovascular 53 58.5 (43.8, 76.5)4 CLRD 40 46.7 (33.3, 63.5)5 Diabetes 25 31.6 (20.5, 46.7)6 Flu & Pneumonia 20 21.4 (13.0, 33.0) 7 Alzheimer’s 15 16.0 (9.0, 26.4)8 Suicide 14 19.6 (10.7, 32.9)9 Unintentional Injuries 14 17.0 (9.3, 28.4) 10 Atherosclerosis 9 *
NH DHHS, DIVISION OF PUBLIC HEALTH SERVICES — HEALTH STATISTICS AND DATA MANAGEMENTLEADING CAUSES OF DEATH OF NEW HAMPSHIRE RESIDENTS, 1999 – 2001 84 APRIL 2005

Leading Cause of Death for Selected Cities and Towns
Laconia
Figure 60. Leading Causes of Death for Laconia, New Hampshire Residents, 1999-2001 Average
010203040506070
Dis
ease
s of
Hea
rt
Inva
sive
Can
cer
Cer
ebro
vasc
ular
CLR
D
Alz
heim
er's
Dia
bete
s
Uni
nten
tiona
lIn
jurie
s
Ave
rage
Dea
ths
Per Y
ear
Table 60. Leading Causes of Death Rates for Laconia, New Hampshire Residents, 1999-2001
Rank Cause Deaths Age-AdjustedRate / 100,000 (95% CI)
1 Diseases of Heart 175 245.3 (208.1, 282.5) 2 Invasive Cancer 150 225.6 (188.9, 262.4) 3 Cerebrovascular 81 102.9 (81.7, 127.9)4 CLRD 30 41.5 (28.0, 59.3)5 Alzheimer’s 16 19.1 (10.9, 31.0)6 Diabetes 14 22.2 (12.1, 37.3)7 Unintentional Injuries 13 24.3 (13.0, 41.6) 8 Atherosclerosis 9 *9 Flu & Pneumonia 9 *10 Liver Disease 9 *
NH DHHS, DIVISION OF PUBLIC HEALTH SERVICES — HEALTH STATISTICS AND DATA MANAGEMENTLEADING CAUSES OF DEATH OF NEW HAMPSHIRE RESIDENTS, 1999 – 2001 APRIL 2005 85

Leading Cause of Death for Selected Cities and Towns
Manchester
Figure 61. Leading Causes of Death for Manchester, New Hampshire Residents, 1999-2001 Average
050
100150200250300350
Dis
ease
s of
Hea
rt
Inva
sive
Can
cer
CLR
D
Cer
ebro
vasc
ular
Dia
bete
s
Uni
nten
tiona
lIn
jurie
s
Alz
heim
er's
Nep
hriti
s
Sui
cide
Flu
& P
neum
oniaAve
rage
Dea
ths
Per Y
ear
Table 61. Leading Causes of Death Rates for Manchester, New Hampshire Residents, 1999-2001
Rank Cause Deaths Age-AdjustedRate / 100,000 (95% CI)
1 Diseases of Heart 978 284.7 (266.8, 302.6) 2 Invasive Cancer 642 198.3 (182.9, 213.7) 3 CLRD 217 64.8 (56.1, 73.4)4 Cerebrovascular 180 51.8 (44.2, 59.4)5 Diabetes 96 28.5 (23.1, 34.8)6 Unintentional Injuries 81 24.9 (19.8, 31.0) 7 Alzheimer’s 56 15.7 (11.8, 20.3)8 Nephritis 46 13.4 (9.8, 17.9)9 Suicide 42 12.7 (9.1, 17.2)10 Flu & Pneumonia 41 11.9 (8.6, 16.2)
NH DHHS, DIVISION OF PUBLIC HEALTH SERVICES — HEALTH STATISTICS AND DATA MANAGEMENTLEADING CAUSES OF DEATH OF NEW HAMPSHIRE RESIDENTS, 1999 – 2001 86 APRIL 2005

Leading Cause of Death for Selected Cities and Towns
Nashua
Figure 62. Leading Causes of Death for Nashua, New Hampshire Residents, 1999-2001 Average
020406080
100120140160180
Inva
sive
Can
cer
Dis
ease
s of
Hea
rt
Cer
ebro
vasc
ular
CLR
D
Uni
nten
tiona
lIn
jurie
s
Dia
bete
s
Alz
heim
er's
Sui
cide
Flu
& P
neum
onia
Live
r Dis
easeA
vera
ge D
eath
s Pe
r Yea
r
Table 62. Leading Causes of Death Rates for Nashua, New Hampshire Residents, 1999-2001
Rank Cause Deaths Age-AdjustedRate / 100,000 (95% CI)
1 Invasive Cancer 477 196.7 (179.1, 214.4) 2 Diseases of Heart 471 195.6 (177.9, 213.3) 3 Cerebrovascular 120 50.3 (41.3, 59.2)4 CLRD 112 46.7 (38.1, 55.4)5 Unintentional Injuries 76 29.9 (23.6, 37.4) 6 Diabetes 75 31.3 (24.6, 39.2)7 Alzheimer’s 63 26.4 (20.3, 33.8)8 Suicide 43 15.7 (11.3, 21.1)9 Flu & Pneumonia 35 14.6 (10.2, 20.4) 10 Liver Disease 26 10.4 (6.8, 15.2)
NH DHHS, DIVISION OF PUBLIC HEALTH SERVICES — HEALTH STATISTICS AND DATA MANAGEMENTLEADING CAUSES OF DEATH OF NEW HAMPSHIRE RESIDENTS, 1999 – 2001 APRIL 2005 87

Leading Cause of Death for Selected Cities and Towns
Portsmouth
Figure 63. Leading Causes of Death for Portsmouth, New Hampshire Residents, 1999-2001 Average
0
10
20
30
40
50
60
70
Dis
ease
s of
Hea
rt
Inva
sive
Can
cer
Cer
ebro
vasc
ular
Alz
heim
er's
CLR
D
Uni
nten
tiona
lIn
jurie
s
Dia
bete
s
Flu
& P
neum
onia
Nep
hriti
s
Par
kins
on's
Ave
rage
Dea
ths
Per Y
ear
Table 63. Leading Causes of Death Rates for Portsmouth, New Hampshire Residents, 1999-2001
Rank Cause Deaths Age-AdjustedRate / 100,000 (95% CI)
1 Diseases of Heart 197 226.5 (194.4, 258.7) 2 Invasive Cancer 169 217.7 (184.5, 250.9) 3 Cerebrovascular 56 62.9 (47.5, 81.7)4 Alzheimer’s 48 51.8 (38.2, 68.7)5 CLRD 45 55.3 (40.3, 74.0)6 Unintentional Injuries 19 26.3 (15.8, 41.0) 7 Diabetes 19 23.2 (14.0, 36.3)8 Flu & Pneumonia 12 12.8 (6.6, 22.4) 9 Nephritis 11 12.7 (6.4, 22.8)10 Parkinson’s 10 11.2 (5.4, 20.6)
NH DHHS, DIVISION OF PUBLIC HEALTH SERVICES — HEALTH STATISTICS AND DATA MANAGEMENTLEADING CAUSES OF DEATH OF NEW HAMPSHIRE RESIDENTS, 1999 – 2001 88 APRIL 2005

Leading Cause of Death for Selected Cities and Towns
Rochester
Figure 64. Leading Causes of Death for Rochester, New Hampshire Residents, 1999-2001 Average
0102030405060708090
Dis
ease
s of
Hea
rt
Inva
sive
Can
cer
Cer
ebro
vasc
ular
CLR
D
Dia
bete
s
Uni
nten
tiona
lIn
jurie
s
Alz
heim
er's
Flu
& P
neum
onia
Sui
cide
Nep
hriti
sAve
rage
Dea
ths
Per Y
ear
Table 64. Leading Causes of Death Rates for Rochester, New Hampshire Residents, 1999-2001
Rank Cause Deaths Age-AdjustedRate / 100,000 (95% CI)
1 Diseases of Heart 234 271.8 (236.9, 306.6) 2 Invasive Cancer 187 210.8 (180.6, 241.1) 3 Cerebrovascular 63 73.0 (56.1, 93.4)4 CLRD 54 61.0 (45.8, 79.6)5 Diabetes 37 41.8 (29.4, 57.6)6 Unintentional Injuries 25 29.3 (18.9, 43.2) 7 Alzheimer’s 20 23.3 (14.2, 35.9)8 Flu & Pneumonia 14 16.1 (8.8, 27.1) 9 Suicide 12 13.9 (7.2, 24.3)10 Nephritis 12 14.1 (7.3, 24.7)
NH DHHS, DIVISION OF PUBLIC HEALTH SERVICES — HEALTH STATISTICS AND DATA MANAGEMENTLEADING CAUSES OF DEATH OF NEW HAMPSHIRE RESIDENTS, 1999 – 2001 APRIL 2005 89

Leading Cause of Death for Selected Cities and Towns
Salem
Figure 65. Leading Causes of Death for Salem, New Hampshire Residents, 1999-2001 Average
010203040506070
Dis
ease
s of
Hea
rt
Inva
sive
Can
cer
CLR
D
Cer
ebro
vasc
ular
Dia
bete
s
Uni
nten
tiona
lIn
jurie
s
Alz
heim
er's
Flu
& P
neum
onia
Nep
hriti
sAve
rage
Dea
ths
Per Y
ear
Table 65. Leading Causes of Death Rates for Salem, New Hampshire Residents, 1999-2001
Rank Cause Deaths Age-AdjustedRate / 100,000 (95% CI)
1 Diseases of Heart 172 233.7 (198.3, 269.1) 2 Invasive Cancer 151 189.9 (159.2, 220.6) 3 CLRD 43 58.7 (42.5, 79.0)4 Cerebrovascular 32 46.2 (31.6, 65.3)5 Diabetes 21 26.3 (16.3, 40.2)6 Unintentional Injuries 17 22.0 (12.8, 35.2) 7 Alzheimer's 15 23.0 (12.9, 37.9)8 Flu & Pneumonia 12 16.4 (8.5, 28.7) 9 Nephritis 11 15.4 (7.7, 27.5)10 Aortic Aneurysm 7 *
NH DHHS, DIVISION OF PUBLIC HEALTH SERVICES — HEALTH STATISTICS AND DATA MANAGEMENTLEADING CAUSES OF DEATH OF NEW HAMPSHIRE RESIDENTS, 1999 – 2001 90 APRIL 2005
Technical Appendix
Technical Appendix Age-adjusted Rates
Age-adjusted or standardized rates are calculated so that rates from populations with different age distributions are comparable. For example, if two counties are compared for rates of fall deaths and one of the counties has a higher percentage of elderly adults, the county with the higher percentage of elderly will probably show higher rates of fall deaths as a result of the different age distribution alone. Standardization makes the two populations look similar in regards to age distribution. This makes it possible to know that a difference in rates, if it exists, is not the result of differences in age distribution.
To accomplish this, a “standard” population is chosen. The standard population used in this report is the US Census 2000 population. For each age group in the standard population, a proportion of the total population is calculated. For example, the 0-4 age group comprises .069136 of the total US population in 2000. These proportions are calculated so that the sum of proportions equals one (1). For each age group, the age group proportion is multiplied times the age-specific rate of the population of interest.Basically, this proportion is used to “weight” the age-specific rate calculated for the population of interest. Once the age-specific rates are “weighted”, all weighted age-specific rates are summed and the result is the age-adjusted or standardized rate.Standardized rates can be compared to each other as long as the same standard population is used for each calculation.
More generally, the calculation is as follows:
R = w i R i = standardized rate (per 100,000) "
where
w i = i age specific population proportion in the standard population such that ) = 1.0
th
iw(
R i = age-specific rate (per 100,000) for the i age group.th
D i = total number of events for the i th age group upon which age-specific rate is based.
NH DHHS, DIVISION OF PUBLIC HEALTH SERVICES — HEALTH STATISTICS AND DATA MANAGEMENTLEADING CAUSES OF DEATH OF NEW HAMPSHIRE RESIDENTS, 1999 – 2001 APRIL 2005 91

Technical Appendix
Confidence Interval Calculations
To allow comparison of statistics, whenever possible, confidence intervals were calculated at the 95% level and presented in the charts and graphs. The methods used were based on those used by the National Center for Health Statistics at the Centers for Disease Control and Prevention in their reports on death (refer to NCHS reports on deaths for further explanation).
While we have an exact count of deaths in New Hampshire (no uncertainty and no need for confidence intervals), we expect that with a given level of risk in a population, the number of deaths will vary from year to year. When comparing populations, we use the observed death rate to give us information about the underlying risk of death.Confidence intervals are a good way to represent the degree of uncertainty we have about this underlying risk.
A good example of this concept is the experiment of flipping coins. Flipping a coin one hundred times and getting 48 heads is like having a population of 100 individuals and having 48 deaths. The “risk” of getting heads may be .48 or it might be .50 or perhaps .64. We don’t know for sure. Some coins are not “fair” and it cannot be automatically assumed that the probability of getting a heads is exactly .50, to fit a preconceived opinion, or that the probability is exactly .48 because that is the result of one experiment. If we could do this experiment many times, we would expect to have more information about the true probability. If the coin is fair, we expect that we will usually get around 50 heads, but we might not be overly surprised if we sometimes get less than 40 or more than 60 heads. In fact, the 95% confidence interval for this experiment (with a fair coin) is between 40 and 60 heads. In the same way, we consider the number of deaths in a population as a sample of one of many possible outcomes based on an unknown risk of death. There is more certainty with larger numbers (more “experiments” leading to tighter confidence intervals). With small numbers, there is sufficient uncertainty about the underlying risk of death so that we don’t report rates involving less than 10 deaths.
Confidence intervals for age specific rates are calculated in the following way. When the number of events the rate is based on is 100 or greater, the following formula is used:
Lower 95% limit = R – (1.96 * R / D )
Upper 95% limit = R + (1.96 * R / D )
where
R = the rate D = the number of deaths or hospitalizations in the rate
When the number of events is less than 100, the Poisson distribution is used to estimate the confidence interval:
Lower 95% limit = R * L
NH DHHS, DIVISION OF PUBLIC HEALTH SERVICES — HEALTH STATISTICS AND DATA MANAGEMENTLEADING CAUSES OF DEATH OF NEW HAMPSHIRE RESIDENTS, 1999 – 2001 92 APRIL 2005

Technical Appendix
Upper 95% limit = R * U where
R = the birth rate L and U = values in a table derived from the Poisson distribution for the 95% level.
The confidence interval calculation for age-adjusted rates is the same for rates based on fewer than 100 events. When based on more than 100 events a different procedure is used that is more complex.
Lower 95% limit = R – (1.96*S(R ))" "
Upper 95% limit = R + (1.96*S(R ))" "
where
R = standardized rate per 100,000 "
S(R " ) = ( (w i R i (2 2
iD1 )))
w i = i age specific population proportion in the standard population such that ) = 1.0
th
iw(
R i = age-specific rate (per 100,000) for the i age group.th
D i = total number of events for the i th age group upon which age-specific rate is based.
Leading Cause of Death Descriptions
Throughout this report, New Hampshire’s leading causes of death have been listed.Though the description or label of the leading causes differs somewhat from the leading cause of death descriptions used by the National Center of Health Statistics, the definitions of these cause of death categories match exactly. The following table compares the description or label used within this report to the descriptions used by the National Center for Health Statistics.
Table 66. Comparison of Leading Cause of Death Descriptions used within this Report to Descriptions Used by the National Center for Health Statistics
New Hampshire National Center For Health Statistics Unintentional injuries Accidents
Alzheimer’s Alzheimer's disease
Anemias Anemias
Aortic Aneurysm Aortic aneurysm and dissection
Atherosclerosis Atherosclerosis
NH DHHS, DIVISION OF PUBLIC HEALTH SERVICES — HEALTH STATISTICS AND DATA MANAGEMENTLEADING CAUSES OF DEATH OF NEW HAMPSHIRE RESIDENTS, 1999 – 2001 APRIL 2005 93

Technical Appendix
New Hampshire National Center For Health Statistics Benign Neoplasms In situ neoplasms, benign neoplasms and neoplasms of uncertain or unknown behavior
Cerebrovascular Cerebrovascular Diseases
Chronic Low. Resp. (CLRD) Chronic lower respiratory diseases
Congenital Abnormalities Congenital malformations, deformations and chromosomal abnormalities
Diabetes Diabetes mellitus
Diseases of heart Diseases of heart
Flu & Pneumonia Influenza and pneumonia
Gallbladder Disorders Cholelithiasis and other disorders of gallbladder
Hernia Hernia
HIV Human immunodeficiency virus disease - HIV
Homicide Assault (homicide)
Hypertension Essential (primary) hypertension and hypertensive renal disease
Invasive Cancer Malignant neoplasms
Liver Disease Chronic liver disease and cirrhosis
Medical Complications Complications of medical and surgical care
Nephritis Nephritis, nephrotic syndrome and nephrosis
Nutritional Deficiencies Nutritional deficiencies
Parkinson’s Parkinson’s disease
Peptic Ulcer Peptic ulcer
Perinatal Conditions Certain conditions originating in the perinatal period
Pneumonitis Pneumonitis due to solids and liquids
Septicemia Septicemia
Suicide Intentional self-harm (suicide)
Viral Hepatitis Viral hepatitis
Table 67. Comparison of Leading for Infant Causes of Death Descriptions used within this Report to Descriptions Used by the National Center for Health Statistics
New Hampshire National Center For Health Statistics Abdominal Hernia Hernia of abdominal cavity and intestinal obstruction without hernia
Unintentional injuries Accidents
Anoxic Brain Damage Anoxic brain damage not elsewhere classified
Atelectasis Atelectasis
Bacterial Sepsis Bacterial sepsis of newborn
Benign Neoplasms In situ neoplasms, benign neoplasms, neoplasms of uncertain or unknownbehavior
Birth Trauma Birth trauma
Chronic Resp. Disease Chronic respiratory disease originating in the perinatal period
Circulatory System Diseases of the circulatory system
Complications of Labor Newborn affected by other complications of labor and delivery
Congenital Abnormalities Congenital malformations, deformations and chromosomal abnormalities
Congenital Pneumonia Congenital pneumonia
Flu & Pneumonia Influenza and pneumonia
Homicide Assault (homicide)
Hydrops Fetalis Hydrops fetalis not due to hemolytic disease
Interstitial Emphysema Interstitial emphysema and related conditions originating in the perinatal period
Intrauterine Hypoxia Intrauterine hypoxia and birth asphyxia
Invasive Cancer Malignant neoplasms
NH DHHS, DIVISION OF PUBLIC HEALTH SERVICES — HEALTH STATISTICS AND DATA MANAGEMENTLEADING CAUSES OF DEATH OF NEW HAMPSHIRE RESIDENTS, 1999 – 2001 94 APRIL 2005

Technical Appendix
New Hampshire National Center For Health Statistics Maternal Complications Newborn affected by maternal complications of pregnancy
Maternal Conditions Newborn affected by other maternal conditions which may be unrelated to present pregnancy
Necrotizing Entercolitis Necrotizing entercolitis of newborn
Neonatal Aspiration Neonatal aspiration syndromes
Neonatal Hemorrhage Neonatal hemorrhage
Noxious Influences Newborn affected by noxious influences transmitted via placenta or breast milk
Placenta Complications Newborn affected by complications of placenta, cord and membranes
Pulmonary Hemorrhage Pulmonary hemorrhage originating in the perinatal period
Renal Failure Renal failure and other disorders of kidney
Respiratory Distress Respiratory distress of newborn
Septicemia Septicemia
Short Gestation Disorders related to short gestation and low birth weight, not elsewhereclassified
SIDS Sudden infant death syndrome
Spinal Muscular Atrophy Infantile spinal muscular atrophy, type I (Werdnig-Hoffman)
Volume Depletion Volume depletion, disorders of fluid, electrolyte and acid-base balance
Leading Cause of Death Coding Criteria
Table 68. Leading Cause of Death Classifications for ICD 10, Ages 1 and Older Leading Cause of Death Group ICD 10 Code Range(s)Salmonella infections A01 - A02 Shigellosis and amebiasis A03, A06 Tuberculosis A16 - A19 Whooping cough A37Scarlet fever and erysipelas A38, A46 Meningococcal infection A39Septicemia A40 - A41 Syphilis A50 - A53 Acute poliomyelitis A80Arthropod-borne viral encephalitis A83 - A84, A85.2 Measles B05Viral hepatitis B15 - B19 Human immunodeficiency virus disease - HIV B20 - B24 Malaria B50 - B54 Malignant neoplasms C00 - C97 In situ neoplasms, benign neoplasms and neoplasms of uncertain or unknownbehavior
D00 - D48
Anemias D50 - D64 Diabetes mellitus E10 - E14 Nutritional deficiencies E40 - E64 Meningitis G00, G03Parkinson’s disease G20 - G21 Alzheimer's disease G30Diseases of heart I00 - I09, I11, I13, I20 - I51 Essential (primary) hypertension and hypertensive renal disease I10, I12Cerebrovascular Diseases I60 - I69 Atherosclerosis I70Aortic aneurysm and dissection I71Influenza and pneumonia J10 - J18 Acute bronchitis and bronchiolitis J20 - J21
NH DHHS, DIVISION OF PUBLIC HEALTH SERVICES — HEALTH STATISTICS AND DATA MANAGEMENTLEADING CAUSES OF DEATH OF NEW HAMPSHIRE RESIDENTS, 1999 – 2001 APRIL 2005 95

Technical Appendix
Leading Cause of Death Group ICD 10 Code Range(s)Chronic lower respiratory diseases J40 - J47 Pneumoconioses and chemical effects J60 - J66, J68 Pneumonitis due to solids and liquids J69Peptic ulcer K25 - K28 Diseases of appendix K35 - K38 Hernia K40 - K46 Chronic liver disease and cirrhosis K70, K73 - K74 Cholelithiasis and other disorders of gallbladder K80 - K82 Nephritis, nephrotic syndrome and nephrosis N00 - N07, N17 - N19, N25 -
N27Infections of kidney N10 - N12, N13.6, N15.1 Hyperplasia of prostate N40Inflammatory diseases of female pelvic organs N70 - N76 Pregnancy, childbirth and the puerperium O00 - O99 Certain conditions originating in the perinatal period P00 - P96 Congenital malformations, deformations and chromosomal abnormalities Q00 - Q99 Accidents V01 - X59, Y85 - Y86 Intentional self-harm (suicide) U03, X60 - X84, Y87.0 Assault (homicide) U01, U02, X85-Y09, Y87.1 Legal intervention Y35, Y89.0 Operations of war and their sequelae Y36, Y89.1 Complications of medical and surgical care Y40 - Y84, Y88
Table 69. Infant Leading Cause of Death Classifications for ICD 10 Leading Cause of Death Group ICD 10 Code Range(s)Diarrhea and gastroenteritis of infectious origin A09Tuberculosis A16-A19Tetanus A33, A35Diphtheria A36Whooping cough A37Meningococcal infection A39Septicemia A40-A41Congenital syphilis A50Gonococcal infection A54Acute poliomyelitis A80Varicella (chickenpox) B01Measles B05Human Immunodeficiency Virus (HIV) disease B20-B24Mumps B26Candidiasis B37Malaria B50-B54Pneumocystosis B59Malignant neoplasms C00-C97In situ neoplasms, benign neoplasms, neoplasms of uncertain or unknownbehavior
D00-D48
Diseases of the blood and blood forming organs and certain disorders involving the immune mechanism
D50-D89
Short stature not elsewhere classified E343Malnutrition and other nutritional deficiencies E40-E64Cystic fibrosis E84Volume depletion, disorders of fluid, electrolyte and acid-base balance E86-E87Meningitis G00, G03Infantile spinal muscular atrophy, type I (Werdnig-Hoffman) G120Infantile cerebral palsy G80Anoxic brain damage NEC G931
NH DHHS, DIVISION OF PUBLIC HEALTH SERVICES — HEALTH STATISTICS AND DATA MANAGEMENTLEADING CAUSES OF DEATH OF NEW HAMPSHIRE RESIDENTS, 1999 – 2001 96 APRIL 2005

Technical Appendix
Leading Cause of Death Group ICD 10 Code Range(s)Diseases of the ear and mastoid process H60-H93Diseases of the circulatory system I00-I99Acute upper respiratory infections J00-J06Influenza and pneumonia J10-J18Acute bronchitis and acute bronchiolitis J20-J21Bronchitis, chronic and unspecified J40-J42Asthma J45-J46Pneumonitis due to solids and liquids J69Gastritis, duodenitis, and noninfective enteritis and colitis K29, K50-K55Hernia of abdominal cavity and intestinal obstruction without hernia K40-K46, K56 Renal failure and other disorders of kidney N17-N19, N25, N27 Newborn affected by maternal hypertensive disorders P000Newborn affected by other maternal conditions which may be unrelated to present pregnancy
P001-P009
Newborn affected by maternal complications of pregnancy P01Newborn affected by complications of placenta, cord and membranes P02Newborn affected by other complications of labor and delivery P03Newborn affected by noxious influences transmitted via placenta or breast milk P04Slow fetal growth and fetal malnutrition P05Disorders related to short gestation and low birth weight, NEC P07Disorders related to long gestation and high birth weight P08Birth trauma P10-P15Intrauterine hypoxia and birth asphyxia P20-P21Respiratory distress of newborn P22Congenital pneumonia P23Neonatal aspiration syndromes P24Interstitial emphysema and related conditions originating in the perinatal period P25Pulmonary hemorrhage originating in the perinatal period P26Chronic respiratory disease originating in the perinatal period P27Atelectasis P280-P281Bacterial sepsis of newborn P36Omphalitis of newborn with or without mild hemorrhage P38Neonatal hemorrhage P50-P52, P54 Hemorrhagic disease of newborn P53Hemolytic disease of newborn due to isoimmunization and other perinatal jaundice
P55-P59
Hematological disorders P60-P61Syndrome of infant of a diabetic mother and neonatal diabetes mellitus P700-P702Necrotizing entercolitis of newborn P77Hydrops fetalis not due to hemolytic disease P832Congenital malformations, deformations and chromosomal abnormalities Q00-Q99Sudden infant death syndrome R95Accidents (unintentional injuries) V01-X59Assault (homicide) X85-Y09, Y871 Complications of medical and surgical care Y40-Y84
Population Estimates
The population estimate tables below were used in the calculation of rates in this report. Because the only reliable data that is typically available at the town level by age is from the US Census (the last Census was conducted in 2000), we must rely on estimated populations for 1999 and 2001. To do this, we interpolated 1999 from the
NH DHHS, DIVISION OF PUBLIC HEALTH SERVICES — HEALTH STATISTICS AND DATA MANAGEMENTLEADING CAUSES OF DEATH OF NEW HAMPSHIRE RESIDENTS, 1999 – 2001 APRIL 2005 97

Technical Appendix
1990 and 2000 US Census data, and interpolated 2001 with the 2000 Census data and 2003 estimate data from Claritas Corporation.
Population by County and Age Group, New Hampshire, 1999-2001
County 0 to 4 05 to 14 15 to 24 25 to 34 35 to 44 45 to 54 55 to 64 65 to 74 75 to 84 85 plus Total
Belknap 9,096 23,607 18,899 19,308 28,237 26,901 17,925 13,497 9,009 2,950 169,429
Carroll 6,353 17,794 12,585 13,548 21,230 21,025 15,362 12,962 7,789 2,558 131,206
Cheshire 11,601 30,632 35,669 24,887 35,024 32,986 21,001 15,889 10,471 3,864 222,025
Coos 5,060 13,253 10,774 10,916 15,590 14,951 10,635 9,335 6,485 2,422 99,421
Grafton 12,743 31,171 43,275 29,211 37,032 36,278 23,207 17,067 11,589 4,174 245,746
Hillsborough 77,596 175,253 136,793 164,445 209,239 163,987 95,154 63,092 43,040 15,287 1,143,887
Merrimack 24,486 59,954 50,854 51,184 73,868 62,243 35,900 25,580 17,543 7,619 409,231
Rockingham 54,655 129,925 87,981 110,176 162,958 129,861 73,916 46,482 28,021 9,568 833,543
Strafford 20,124 46,012 60,036 46,067 56,616 44,038 26,707 20,264 13,087 4,437 337,389
Sullivan 6,828 17,041 13,050 14,458 19,564 18,824 12,665 10,292 6,594 2,221 121,537
NH Total 228,542 544,642 469,916 484,200 659,358 551,094 332,472 234,460 153,628 55,100 3,713,414
Population by Selected City or Town and Age Group, New Hampshire, 1999-2001
Town 0 to 4 5 to 14 15 to 24 25 to 34 35 to 44 45 to 54 55 to 64 65 to 74 75 to 84 85 plus Total
Bedford 3,958 9,392 4,690 5,110 10,402 9,642 5,238 3,062 2,049 1,132 54,674Berlin 1,595 3,795 3,291 3,514 4,709 4,126 3,052 3,426 2,510 1,056 31,074 Claremont 2,348 5,323 4,662 5,126 6,111 5,482 3,861 3,234 2,621 804 39,572 Concord 7,153 16,129 15,102 18,635 21,552 17,378 9,548 7,080 6,262 3,376 122,213 Derry 7,404 18,360 12,718 15,616 20,764 14,540 6,672 3,625 1,916 779 102,394 Dover 4,597 9,359 12,010 13,936 13,349 10,159 6,338 5,218 3,997 1,859 80,822 Exeter 2,328 6,008 4,028 5,239 7,301 6,194 3,941 3,032 2,702 1,413 42,186 Keene 2,871 7,879 15,399 7,564 9,203 8,934 5,777 4,877 3,830 1,553 67,887 Laconia 2,654 6,352 6,473 6,468 7,375 6,857 4,803 4,021 3,065 1,406 49,473 Manchester 21,622 42,644 42,844 54,555 52,479 41,416 24,678 19,806 16,198 5,615 321,856 Nashua 17,038 37,209 31,129 41,489 45,370 35,420 22,417 15,815 10,452 3,728 260,064 Portsmouth 3,121 6,028 6,420 12,156 10,535 8,833 5,664 4,874 3,634 62,907 Rochester 5,827 12,193 10,236 12,194 14,690 11,474 7,448 6,198 4,024 1,269 85,553 Salem 5,365 12,456 8,815 10,805 15,876 12,801 8,690 5,502 3,236 939 84,484
1,641
NH DHHS, DIVISION OF PUBLIC HEALTH SERVICES — HEALTH STATISTICS AND DATA MANAGEMENTLEADING CAUSES OF DEATH OF NEW HAMPSHIRE RESIDENTS, 1999 – 2001 98 APRIL 2005

References
ReferencesAlcalde MG, Elster NR. Child Fatality Review in the United States: A National Overview. Institute for Bioethics, Health Policy and Law, University of Louisville School of Medicine at http://www.louisville.edu/medschool/ibhpl/publications/
Infant Mortality section of New Hampshire Births: 1999-2000 published by the New Hampshire Department of Health and Human Services
Andersonn RN, Minino AM, Hoyert DL, Rosenberg HM, Comparability of Cause of Death Between ICD-9 and ICD-10: Preliminary Estimates, National Vital Statistics Reports, Volume 49, Number 2, May 2001.
Anderson, RN. Deaths: Leading Causes for 1999. National vital statistics reports; vol 49 no 11. Hyattsville, Maryland: National Center for Health Statistics. 2001.
Arias E, Anderson RN, Hsiang-Ching K, Murphy SL, Kochanek KD. Deaths: Final Data for 2001. National vital statistics reports; vol 52 no 3. Hyattsville, Maryland: National Center for Health Statistics. 2003.
Anderson RN, Deaths: Leading Causes for 1999, National Vital Statistics Reports, Volume 49, Number 11, October 2001.
Burns E, Twitchell, N. New Hampshire Injuries, 1999-2001. New Hampshire Department of Health and Human Services, Office of Community and Public Health, Division of Epidemiology and Vital Statistics, Bureau of Health Statistics and Data Management, Concord, New Hampshire, 2003.
CDC Wonder for US rates and Race/Ethnicity rates and frequencies: http://wonder.cdc.gov/mortICD10J.html
Claritas, Population by Age & Sex (1990, 2000,2002,2007), 53 Brown Road, Ithaca NY 14850-1262.
Healthy New Hampshire 2010. New Hampshire Department of Health and Human Services, Office of Community and Public Health. Concord, New Hampshire, 2001.
Hennekens CH, Buring SL. Epidemiology in Medicine. Boston: Little, Brown and Company, 1987.
ICD-10, International Statistical Classification of Diseases and Related Health Problems, Tenth Revision, World Health Organization, Geneva.
NH DHHS, DIVISION OF PUBLIC HEALTH SERVICES — HEALTH STATISTICS AND DATA MANAGEMENTLEADING CAUSES OF DEATH OF NEW HAMPSHIRE RESIDENTS, 1999 – 2001 APRIL 2005 99

References
Klein RJ, Schoenborn CA, Age adjustment using the 2000 projected U.S. population.Healthy People Statistical Notes, no. 20. Hyattsville, Maryland: National Center for Health Statistics. January 2001.
Lagana E, Chalsma A, Porter J., New Hampshire Births, 1999-2000, New Hampshire Department of Health and Human Services, Office of Community and Public Health, Bureau of Health Statistics and Data Management, 2003.
Liu, CF. Cancer in New Hampshire, 1999, An Annual Report on Cancer Incidence and Mortality. New Hampshire Department of Health and Human Services, Office of Community and Public Health, Division of Epidemiology and Vital Statistics, Bureau of Health Statistics and Data Management, Concord, New Hampshire, 2002.
Minino AM, Arias E, Kochanek KD, Murphy SL, Smith BL. Deaths: Final Data for 2000. National vital statistics reports; vol 50 no 15. Hyattsville, Maryland: National Center for Health Statistics. 2002.
Mokdad AH, Marks JS, Stroup DF, Gerberding JL. Actual causes of death in the United States, 2000. JAMA. 2004; 291(10):1238-1246.http://www.cdc.gov/nccdphp/publications/actual_causes.htm
National Death Index Plus: Coded Causes of Death, Supplement to the NDI User’s Manual, Division of Vital Statistics, National Center for Health statistics, Centers for disease Control and Prevention, Hyattsville, Maryland, July, 1999.
National Vital Statistics Reports, Vol. 49, No. 1, April 17, 2001, pages 93-97 http://www.cdc.gov/nchs/data/nvsr/nvsr49/nvsr49_01.pdf
National Vital Statistics Reports, Vol. 52, No. 21, June 2nd, 2004, pages 83-86. http://www.cdc.gov/nchs/data/nvsr/nvsr52/nvsr52_21acc.pdf
New Hampshire Department of Environmental Services, "Air Pollution Transport and How it Affects New Hampshire", R-ARD 04-1, May 2004.
Pelletier, AR. New Hampshire Diabetes Data, 2001. New Hampshire Department of Health and Human Services, Office of Community and Public Health, Division of Disease Prevention and Health Promotion, Diabetes Education Program. Concord, New Hampshire, 2001.
Porter, BJ. Findings From the Behavioral Risk Factor surveillance System in New Hampshire, 2000. New Hampshire Department of Health and Human Services, Office of Community and Public Health, Division of Epidemiology and Vital Statistics, Concord, New Hampshire. 2001.
2000 US Census Bureau, New Hampshire Quick Facts http://quickfacts.census.gov/qfd/states/33000.html and American Fact Finder, Census 2000 Summary File 1 (SF 1) 100-Percent Data, Detailed Tableshttp://factfinder.census.gov/servlet/DatasetMainPageServlet?_program=DEC&_lang=en&_ts=(Race/ethnicity population statistics for New Hampshire)
NH DHHS, DIVISION OF PUBLIC HEALTH SERVICES — HEALTH STATISTICS AND DATA MANAGEMENTLEADING CAUSES OF DEATH OF NEW HAMPSHIRE RESIDENTS, 1999 – 2001 100 APRIL 2005

References
United States Department of Health and Human Services (US DHHS), Centers for Disease Control and Prevention (CDC), National Center for Health Statistics (NCHS), Office of Analysis, Epidemiology, and Health Promotion (OAEHP), Compressed Mortality File (CMF) compiled from CMF 1968-1988, Series 20, No. 2A 2000, CMF 1989-1998, Series 20, No. 2E 2003 and CMF 1999-2001, Series 20, No. 2G 2004 on CDC WONDER at http://wonder.cdc.gov/mortICD10J.html on April 19, 2004 through May 5, 2004.
Vital Statistics of the United States: Mortality, 1995 Technical Appendix, pages 22 - 23http://www.cdc.gov/nchs/data/dvs/morttechappn95.pdf
Wilson, JR. Asthma in New Hampshire, 1990-2002. New Hampshire Department of Health and Human Services, Office of Community and Public Health, Division of Disease Prevention and Health Promotion, Asthma Education Program. Concord, New Hampshire, 2004.
NH DHHS, DIVISION OF PUBLIC HEALTH SERVICES — HEALTH STATISTICS AND DATA MANAGEMENTLEADING CAUSES OF DEATH OF NEW HAMPSHIRE RESIDENTS, 1999 – 2001 APRIL 2005 101

Endnotes
NH DHHS, DIVISION OF PUBLIC HEALTH SERVICES — HEALTH STATISTICS AND DATA MANAGEMENTLEADING CAUSES OF DEATH OF NEW HAMPSHIRE RESIDENTS, 1999 – 2001 102 APRIL 2005
Endnotes1 Hennekens CH, Buring JE, Epidemiology in Medicine, Boston, Little, Brown and Company, 1987.2 Mokdad AH, Marks JS, Stroup DF, Gerberding JL. Actual causes of death in the United States, 2000. JAMA. 2004;291(10):1238-1246. http://www.cdc.gov/nccdphp/publications/actual_causes.htm3 Klein RJ, Schoenborn CA, Age adjustment using the 2000 projected U.S. population. Healthy People Statistical Notes, no. 20. Hyattsville, Maryland: National Center for Health Statistics.January 2001. 4 ICD-10, International Statistical Classification of Diseases and Related Health Problems, Tenth Revision, Instruction Manual, Part 2e, Volume 1, 2003, World Health Organization, Geneva.5 Anderson RN, Deaths: Leading Causes for 1999, National Vital Statistics Reports, Volume 49, Number 11, October 2001. 6 National Death Index Plus: Coded Causes of Death, Supplement to the NDI User’s Manual, Division of Vital Statistics, National Center for Health statistics, Centers for disease Control and Prevention, Hyattsville, Maryland, July, 1999. 7 Klein, Distribution 1, Table 2, page 3. 8 2000 US Census Bureau, New Hampshire Quick Facts, http://quickfacts.census.gov/qfd/states/33000.html9 US Census Bureau, American Fact Finder, Census 2000 Summary File 1 (SF 1) 100-Percent Data, Detailed Tables http://factfinder.census.gov/servlet/DatasetMainPageServlet?_program=DEC&_lang=en&_ts=10 CDC Wonder, http://wonder.cdc.gov/mortICD10J.html11 Andersonn RN, Minino AM, Hoyert DL, Rosenberg HM, Comparability of Cause of Death Between ICD-9 and ICD-10: Preliminary Estimates, National Vital Statistics Reports, Volume 49, Number 2, May 2001. 12 CDC Wonder for US rates: http://wonder.cdc.gov/mortICD10J.html13 New Hampshire Department of Environmental Services, "Air Pollution Transport and How it Affects New Hampshire", R-ARD 04-1, May 2004.