leaf-out dates highlight a changing...
TRANSCRIPT

The arrival of spring is heralded each year by striking displays of flowers on trees and shrubs. Perhaps less conspicuous
than the blooming of flowers, the emergence of new leaves on woody plants marks the onset of the growing season and controls a host of eco-system functions. While to the untrained eye it may seem as though the leaves come out at the same time each year in one big burst, there
are actually relatively consistent differences among species in leaf-out dates, as well as large differences from year to year in the timing of leaf out. The study of the timing of leaf out (and other natural annual phenomena) is known as phenology.
Much of what we know about the physiology of leaf and bud development, and the mecha-nisms behind various leaf-out strategies, comes
Leaf-out Dates Highlight a Changing Climate
Caroline Polgar and Richard Primack
Clockwise from top left: Birches tend to leaf out early in the spring, while hickories tend to leaf out in late spring. Red oaks and beeches tend to leaf out in the middle of spring.
Ric
ha
Rd
PR
iMa
ck
an
d c
aR
ol
ine
Po
lg
aR

from research done in the past by tree physi-ologists and foresters who were interested in the connections to tree growth and timber har-vests. over the past few years, however, the range of people interested in leaf-out phenol-ogy has grown, as have the methods employed to study it, largely as a result of the relevance of this phenomenon to global climate change. new technology, including satellite data, is now being used to monitor leaf-out timing over wider areas than was possible in the past. Forest and ecosystem ecologists are connecting these leaf-out date observations to larger issues of global climate change, with implications for carbon cycles, the availability of fresh water, and wood production.
Monitoring leaf outThe recent resurgence of interest in the phenol-ogy of woody plants has led to leaf-out moni-toring projects around the world. For example, over the past twenty years dr. John o’keefe and other ecologists at the harvard Forest in central Massachusetts have been recording the dates of leaf emergence of individual trees and shrubs each spring, including such common species
as red maple (Acer rubrum), white oak (Quercus alba), and red oak (Quercus rubra) (o’keefe 2010). The Japanese Meteorological agency has been recording leaf out, flowering times, autumn leaf color, and other phenological data of individual marked plants in phenological gardens at over 100 weather sta-tions since 1953 (ibanez et al. 2010). ginkgo (Ginkgo biloba ) , also known as maidenhair tree, is one of the species being moni-tored. The international Phenological gardens (iPg) project, a network of botan-ical gardens across europe, has been collecting simi-lar data on leaf-out dates of individual plants since
1951 (Menzel 2000). other leaf-out datasets go back even further, including one that henry david Thoreau compiled in the mid-nineteenth century on plants in concord, Massachusetts. Findings from these studies indicate that there can be large year-to-year variability in the tim-ing of leaf out, depending on the weather, and that there tends to be relative consistency in the order of leaf out of species from year to year (lechowicz 1984).
obtaining annual observations of leaf-out dates can be quite time and labor intensive, often limiting studies to a small area around a field station or a small number of species. To measure leaf out on a larger scale, remote sens-ing has emerged as a valuable new tool that can monitor an entire plant community or eco-system consisting of many different kinds of plants. Remote sensing studies typically use data obtained by sensors on orbiting satellites, such as the advanced Very high Resolution Radiometer (aVhRR) and the Moderate-reso-lution imaging Spectroradiometer (ModiS), or equipment on landsat satellites. Satellite sys-tems vary in their spatial resolution, frequency of coverage, and types of data gathered. Scien-
Young red maple (Acer rubrum) leaves begin to expand in the spring.
ca
Ro
lin
e P
ol
ga
R
Leaf-out Dates 15

tists use data transmitted from these satellites to calculate the changes in the amount of green vegetation (greenness) there is in a certain area over a growing season. analysis of graphs of greenness over time can be used to quantify important dates in the growing season, such as date of first leaf out in spring, the date at which half of the leaf cover has developed, and canopy senescence in autumn.
Several recent research papers have shown that regional leaf-out data from satellites accurately match ground observations. This is particularly important because there is concern that different topographic features, such as mountains, fields, cities, and lakes, might create errors in the detection of green-up dates. in one study from Rhode island, researchers using landsat data were able to incorporate land-scape features into their analysis and detect a delay in leaf out at the base of hills due to cold air drainage, a delay in coastal areas due to the cooling effects of the ocean, and a one-week delay in leaf out for deciduous forests in rural areas compared to those in the nearby urban area of Provi-dence (Fisher et al. 2006). While such changes in leaf-out dates are already known from specific ground observations, the abil-ity to detect such effects using remote sensing greatly extends our ability to map leaf out over large areas.
another interesting remote sensing approach for monitoring leaf out uses phenocams, which refers to cameras placed in fixed locations that are used to record images of the leaf canopy at regular intervals, such as every hour or once a day, throughout
16 Arnoldia 68/4
The average onset of leaf out in (A) southern New England from Landsat (1984–2002) and (B) the northeastern United States using MODIS (2000–2005). These
images demonstrate that later phenology occurs at higher elevations, such as the Adirondacks and White Mountains; at higher latitudes; and in coastal areas that
experience moderating ocean effects, such as Cape Cod and the Islands. The Boston and New York metropolitan areas leaf out earlier because of higher temper-
atures associated with the urban heat island effect; earlier leaf out is also seen in warm river valleys. Colors indicate the date on which half of the tree canopy has leafed out (from day 110 [April 20] to day 165 [June 15]), with earlier onset shown
by blue and later onset by orange and red. (image from fisher and mustard 2007)
FiSh
eR
an
d M
uST
aR
d 2
007
Km 0 25 50 100
Km 0 50 100 200
B
A
110 DateofAverageGreenLeafOnset(P )
165

the growing season. dr. andrew Richardson and others have set up phenocams in the can-opy at harvard Forest and 11 other forests in the northern continental united States. These images can be analyzed using computer pro-grams to determine the seasonal trajectory of budburst, green-up, and senescence. networks of these phenocams can fill in the spatial and temporal gaps between plant monitoring by human observers and regional remote sensing images. Seven of these sites in the united States also have towers that monitor the exchange of carbon dioxide (co2) and water between the atmosphere and the forest. This combination of data from webcams, satellites, and gas sensors is providing crucial information on the relation-ship between phenology and ecosystem pro-cesses, especially carbon uptake (Richardson et al. 2009a).
Leaf out and climate changeclimate change is already affecting many eco-logical processes, and leaf out is no exception (ibanez et al. 2010; Menzel 2000; Richardson et al. 2006). By analyzing long-term data on leaf-out dates, much can be learned about how the onset of spring has changed over time as tem-peratures have increased. From data collected at the iPg, researchers determined that trees in
northern europe have advanced their leaf out by an average of one week over the past fifty years (Menzel 2000). in Japan, woody plants such as forsythia (Forsythia viridissima var. koreana), ginkgo, mulberry (Morus bombycis), and various cherry species (Prunus spp.) leafed out an additional 2 to 7 days earlier for each 1°c increase in temperature between 1953 and 2005. at a few sites, however, ginkgo trees were actually leafing out later than they did in the past, contrary to expectations (ibanez et al. 2010).
at the hubbard Brook experimental For-est in new hampshire, the leaf out onset of three native species—american beech (Fagus grandifolia), sugar maple (Acer saccharum), and yellow birch (Betula alleghaniensis)—has advanced an average of 5 to 10 days over the past five decades (Richardson et al. 2006). historical datasets, such as those recorded by henry david Thoreau and aldo leopold, can
A sequence of two photos taken at the same spot by a pheno-cam at the Harvard Forest showing leaf out over a one-week
period. The picture on the top left was taken on April 30, 2009, the one on the top right was taken on May 7, 2009.
The photograph on the bottom was taken on April 29, 2009 and shows a view over the canopy of the Harvard Forest
with the phenocam below.
co
uR
Te
Sy o
F Jo
hn
o’k
ee
Fe a
nd
Th
e h
aR
Va
Rd
Fo
Re
ST
Leaf-out Dates 17

also be used for these types of studies by com-paring their records to contemporary observa-tions from the same place, even if there is a lack of data between the two time periods (Bradley et al. 1999; Miller-Rushing and Primack 2008).
We know that leaf out has become earlier in many areas in recent years, largely because of warmer temperatures, but what about the future? Will the advance in spring’s onset continue for all species? To answer these ques-tions, it is necessary to both be familiar with the physiology behind leaf out, and to build on what we already know about the response of leaf out to temperature.
Variation in leaf-out timesTrees and shrubs vary widely in leaf-out times, both among and within species. For instance, individuals will leaf out earlier in a warm, sunny location, such as a south-facing hill, than individuals of the same species located in a cold, shady location. Similarly, all individu-als of a given species will leaf out later during a cold spring than in a warm spring. Sometimes when a tree is growing on the edge of field, the exposed sunny side will leaf out earlier than the shady side. These differences aside, there is a fairly consistent pattern in the leaf-out timing of trees, shrubs, and vines from year to year.
in eastern Massachusetts, species leaf out over a 4 to 6 week period. among the first plants to leaf out in the spring are such introduced ornamental shrubs as common lilac (Syringa vulgaris), honeysuckles (Lonicera spp.), and Jap-anese barberry (Berberis thunbergii), and non-native fruit trees such as apple (Malus spp.). of native species, meadowsweet (Spiraea alba var. latifolia), quaking aspen (Populus tremuloides), black cherry (Prunus serotina), and grey birch (Betula populifolia) are among the first species to leaf out. consistently among the last species to leaf out are white ash (Fraxinus americana), white oak, and black tupelo (Nyssa sylvatica), with poison sumac (Toxicodendron vernix) and buttonbush (Cephalanthus occidentalis) often being the last of all. The pattern of leaf out is fairly consistent across the temperate zone of europe and north america. certain groups of plants tend to leaf out early (birches, willows, alders, many poplars and aspens) and others late (hickories, walnuts, and ashes).
So why do some species leaf out so early and other species leaf out so late? Since the func-tion of leaves is to carry out photosynthesis and provide sugars for the tree, in general it should benefit a tree to leaf out as early as possible to get the longest growing season. a tree species that leafs out in early april has four additional weeks to photosynthesize compared to a tree species that leafs out in early to mid May. how-ever, the early-leafing tree faces the danger of a late frost that will kill its leaves and damage its vessel elements, the chief water conducting tissue. This trade-off between the advantages of early growth and of late growth provides a good explanation of why certain species leaf out when they do. The stem anatomy supports this explanation, with early species tending to have smaller vessel elements that are less prone to frost damage than the larger vessel elements of later species (lechowicz 1984; Miller-Rushing and Primack 2008). also important is the evo-lutionary history of a plant group: if it orginated in a warmer climate, it may not have fully-adapted mechanisms for dealing with extreme cold and therefore may have different factors regulating leaf out than a plant group originat-ing in a colder climate.
The vulnerability of trees and other plants to frost damage was recently demonstrated when
Buttonbush (Cephalanthus occidentalis) is one of the latest native shrubs to leaf out in the spring. It is seen here blooming in midsummer.
Ro
Be
RT
Ma
ye
R18 Arnoldia 68/4
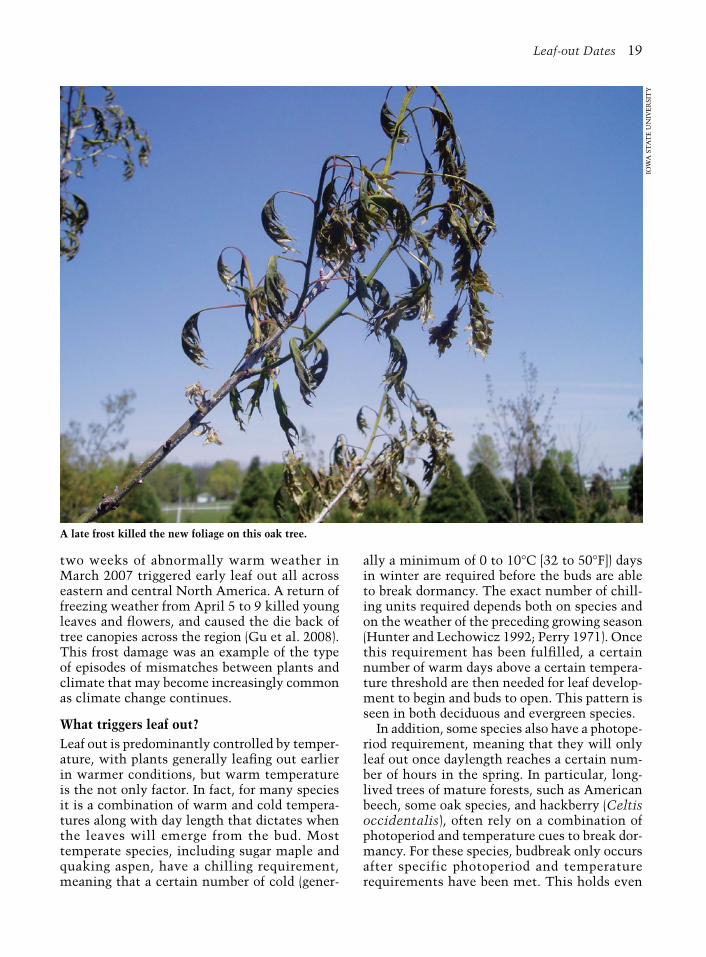
two weeks of abnormally warm weather in March 2007 triggered early leaf out all across eastern and central north america. a return of freezing weather from april 5 to 9 killed young leaves and flowers, and caused the die back of tree canopies across the region (gu et al. 2008). This frost damage was an example of the type of episodes of mismatches between plants and climate that may become increasingly common as climate change continues.
What triggers leaf out?leaf out is predominantly controlled by temper-ature, with plants generally leafing out earlier in warmer conditions, but warm temperature is the not only factor. in fact, for many species it is a combination of warm and cold tempera-tures along with day length that dictates when the leaves will emerge from the bud. Most temperate species, including sugar maple and quaking aspen, have a chilling requirement, meaning that a certain number of cold (gener-
ally a minimum of 0 to 10°c [32 to 50°F]) days in winter are required before the buds are able to break dormancy. The exact number of chill-ing units required depends both on species and on the weather of the preceding growing season (hunter and lechowicz 1992; Perry 1971). once this requirement has been fulfilled, a certain number of warm days above a certain tempera-ture threshold are then needed for leaf develop-ment to begin and buds to open. This pattern is seen in both deciduous and evergreen species.
in addition, some species also have a photope-riod requirement, meaning that they will only leaf out once daylength reaches a certain num-ber of hours in the spring. in particular, long-lived trees of mature forests, such as american beech, some oak species, and hackberry (Celtis occidentalis), often rely on a combination of photoperiod and temperature cues to break dor-mancy. For these species, budbreak only occurs after specific photoperiod and temperature requirements have been met. This holds even
A late frost killed the new foliage on this oak tree.
ioW
a S
Ta
Te
un
iVe
RSi
Ty
Leaf-out Dates 19

when individuals from these species are planted in subtropical climates with exceptionally high temperatures (korner and Basler 2010).
in contrast, many opportunistic species that are found early in forest succession, such as birches, hazelnuts (Corylus spp.), and poplars, do not have a photoperiod requirement to break winter dormancy. This somewhat risky strategy allows trees to respond more quickly to episodes of warm temperature in the early spring, but also creates more susceptibil-ity to late frosts. yet a third group of species, which includes mostly ornamental plants from warmer climates, has a leaf-out strategy linked to spring temperature with minimal chilling requirements and no photoperiod requirement. The common lilac is a local example, and is one of the first plants to leaf out each spring.
Learning from the past, predicting the futureusing information about past phenological responses to temperature and future climate scenarios, scientists can develop models to pre-dict future phenological changes both at the spe-cies and ecosystem levels. one modeling study found that the advance in leaf-out time for most species and places is likely to continue in com-ing decades as the climate continues to warm (Morin et al. 2009). Many temperate tree species will show large advances in leaf out at higher latitudes, including the northern united States and canada. delays in leaf out, or abnormal leaf-out events, could occur at the southern end of species ranges in the southern united States for some species including black ash (Fraxinus nigra) and sugar maple if those species fail to meet their winter chilling requirement. Species with photoperiod requirements are also unlikely to continue to show linear advancements in leaf-out dates with increasing temperatures since photoperiod will not change.
Because there are a host of complicated fac-tors involved in leaf-out phenology, it is hard to predict whether leaf out will continue to advance linearly with changes in tempera-ture at the whole forest level. The possibil-ity of shifts in species composition resulting from climate change, as some species expand their range and others contract theirs, adds yet another layer of uncertainty to the prediction
of leaf-out dates. if certain early successional species with minimal photoperiod and chilling requirements continue to leaf earlier in the spring, they may increase their abundance and distribution to become the dominant species, and shift the leaf-out time of the whole forest. The unmet chilling and photoperiod require-ments of other species may significantly slow the advance of leaf out at the whole forest level. These two scenarios have consequences for many ecosystem processes, including the uptake of carbon dioxide, tree growth, forest temperature, and water movement.
The earlier leaf-out times of many escaped ornamental shrubs, such as Japanese barberry and several honeysuckle species, may help to explain why these species are increasing so greatly in abundance in our forests. Their ear-lier leaf-out times may give them a competi-tive advantage over native species with more restrictive requirements for leaf out (Willis et al. 2010).
Ecological interactionsThe onset of spring affects not only plants and ecosystem processes, but also organisms that depend on those plants. leaf-out timing deter-mines the availability of food and shelter for many species, particularly insects. This timing is especially important for species that have gone through a long winter with little avail-able food, or for bird species completing an energy-demanding migration north. From his close observations of nature in concord, henry david Thoreau was aware of the ecological importance of the emergence of leaves in the spring, writing in 1854: “To-day the air is full of birds; they attend the opening of the buds. The trees begin to leaf, and the leaf-like wings of birds are in the air. The buds start, then the insects, and then the birds.”
Thoreau was aware of order of events based on what he had experienced in previous years and took for granted that the same pattern would persist, even with the large inter-annual varia-tion in weather. in the twenty-first century, we can no longer take for granted that this order of natural events will continue each year. While plants are responsive to changes in tempera-ture, other organisms that interact with plants
20 Arnoldia 68/4

in an ecosystem may not be quite so quick to respond. For instance, while certain species of birds arrive earlier in warmer years, other birds do not change their arrival dates, and some spe-cies are even arriving later (Miller-Rushing et al. 2008). insects are involved also: if certain kinds of insects feed only on the young leaves of a particular plant species that are present for a limited time in the spring, those insect species may decline in abundance if they emerge too early or late in the spring relative to their food resource. Birds that depend on those insects for food may similarly decline in abundance.
Much more work is needed to understand how climate change and rising carbon dioxide con-centrations are affecting ecosystem processes.
if trees are leafing out earlier in the spring and dropping their leaves later in the autumn, they are likely increasing the net amount of carbon being sequestered in biomass. This possibility is supported by the work done by andrew Rich-ardson and others at the harvard Forest and the howland Forest in Maine, showing that the earlier onset of spring in new england results in an increase of carbon sequestered in decid-uous forest and somewhat less in coniferous forest (Richardson et al. 2009b). if this is occur-ring over a large area and over many years, the longer growing season could allow temperate forests to withdraw more carbon dioxide from the atmosphere. The longer growing season and warmer temperatures could also mean that
Clockwise from top left: Photos of the Old North Bridge in Concord, Massachusetts, showing the development of the leaf canopy in the spring of 2010 (April 15, April 20, May 3, May 13). The meadow in the foreground is flooded in the first two photos, and dried out in the second two photos.
Ric
ha
Rd
PR
iMa
ck
Leaf-out Dates 21

trees are losing more water vapor to the atmo-sphere during the process of photosynthesis; in consequence, forest ecosystems could possibly release less water to streams and aquifers, with major implications for drinking water supplies, flood control, and ecology of aquatic organisms.
ConclusionThroughout the world, forests are being altered in many ways by the rising temperatures associ-ated with global climate change, and the earlier leaf-out dates of trees and shrubs is one such example. earlier leaf-out dates are expected to continue in coming decades across much of north america. over a longer period of time, many tree species will likely be extirpated on a local scale and shift their ranges in response to the changing climate. Because there is a wide variation among species in leaf-out times, changes in the species composition of a forest will also mean changes in leaf-out dates at the level of the whole forest. disentangling the sep-arate effects of changing species composition and changing climate is one of the great chal-lenges of detecting leaf-out trends using remote sensing. Botanical gardens such as the arnold arboretum can contribute to these efforts by quantifying the differences among species in leaf-out dates for trees, shrubs, and vines all growing at one location, which for many spe-cies is outside of their native range. Such infor-mation can then aid in calibrating leaf-out dates over a large area using remote sensing.
References
Bradley, n. l., a. c. leopold, J. Ross, and W. huffaker. 1999. Phenological changes reflect climate change in Wisconsin. Proceedings of the National Academy of Sciences of the United States of America 96: 9701–9704.
Fisher, J. i., J. F. Mustard, and M. a. Vadeboncoeur. 2006. green leaf phenology at landsat resolution: Scaling from the field to the satellite. Remote Sensing of Environment 100: 265–279.
Fisher, J.i. and J.F. Mustard. 2007. cross-scalar satellite phenology from ground, landsat, and ModiS data. Remote Sensing of Environment 109: 261–273.
gu, l., P. J. hanson, W. Mac Post, d. P. kaiser, B. yang, R. nemani, S. g. Pallardy et al. 2008. The 2007 eastern uS spring freezes: increased cold damage in a warming world? Bioscience 58: 253–262.
hunter, a. F., and M. J. lechowicz. 1992. Predicting the
timing of budburst in temperate trees. Journal of Applied Ecology 29: 597–604.
ibanez, i., R. B. Primack, a. J. Miller-Rushing, e. ellwood, h. higuchi, S. d. lee, h. kobori et al. 2010. Forecasting phenology under global warming. Philosophical Transactions of the Royal Society B-Biological Sciences 365: 3247–3260.
korner, c., and d. Basler. 2010. Phenology under global warming. Science 327: 1461–1462.
lechowicz, M. J. 1984. Why do temperate deciduous trees leaf out at different times? adaptations and ecology of forest communities. American Naturalist 124: 821–842.
Menzel, a. 2000. Trends in phenological phases in europe between 1951 and 1996. International Journal of Biometeorology 44: 76–81.
Miller-Rushing, a. J., T. l. lloyd-evans, R. B. Primack, and P. Satzinger. 2008. Bird migration times, climate change, and changing population sizes. Global Change Biology 14: 1959–1972.
Miller-Rushing, a. J., and R. B. Primack. 2008. global warming and flowering times in Thoreau’s concord: a community perspective. Ecology 89: 332–341.
Morin, X., M. J. lechowicz, c. augspurger, J. o’ keefe, d. Viner, and i. chuine. 2009. leaf phenology in 22 north american tree species during the 21st century. Global Change Biology 15: 961–975.
o’keefe J. 2010. Phenology of Woody Species. harvard Forest data archive: hF003.
Perry, T. o. 1971. dormancy of trees in winter. Science 171: 29–36.
Richardson, a. d., a. S. Bailey, e. g. denny, c. W. Martin, and J. o’keefe. 2006. Phenology of a northern hardwood forest canopy. Global Change Biology 12: 1174–1188.
Richardson, a. d., B. h. Braswell, d. y. hollinger, J. P. Jenkins, and S. V. ollinger. 2009a. near-surface remote sensing of spatial and temporal variation in canopy phenology. Ecological Applications 19: 1417–1428.
Richardson, a. d., d. y. hollinger, d. B. dail, J. T. lee, J. W. Munger, and J. o’keefe. 2009b. influence of spring phenology on seasonal and annual carbon balance in two contrasting new england forests. Tree Physiology 29: 321–331.
Willis, c. g., B. R. Ruhfel, R. B. Primack, a. J. Miller-Rushing, J. B. losos, and c. c. davis. 2010. Favorable climate change Response explains non-native Species’ Success in Thoreau’s Woods. PLoS ONE 5(1): e8878. doi:10.1371/journal.pone.0008878.
caroline Polgar is a graduate student at Boston university, where Richard Primack is a professor. For the past eight years, Richard Primack and his students have been investigating the impact of climate change on the plants and animals of Massachusetts, with much of the focus at the arnold arboretum and concord.
22 Arnoldia 68/4