lean agile scotland: using metrics as a map
TRANSCRIPT
Using Metrics as a [email protected]@praxisflow.com
7 Oct 2016 12:20-12:50pm in Pentland West#lascot16
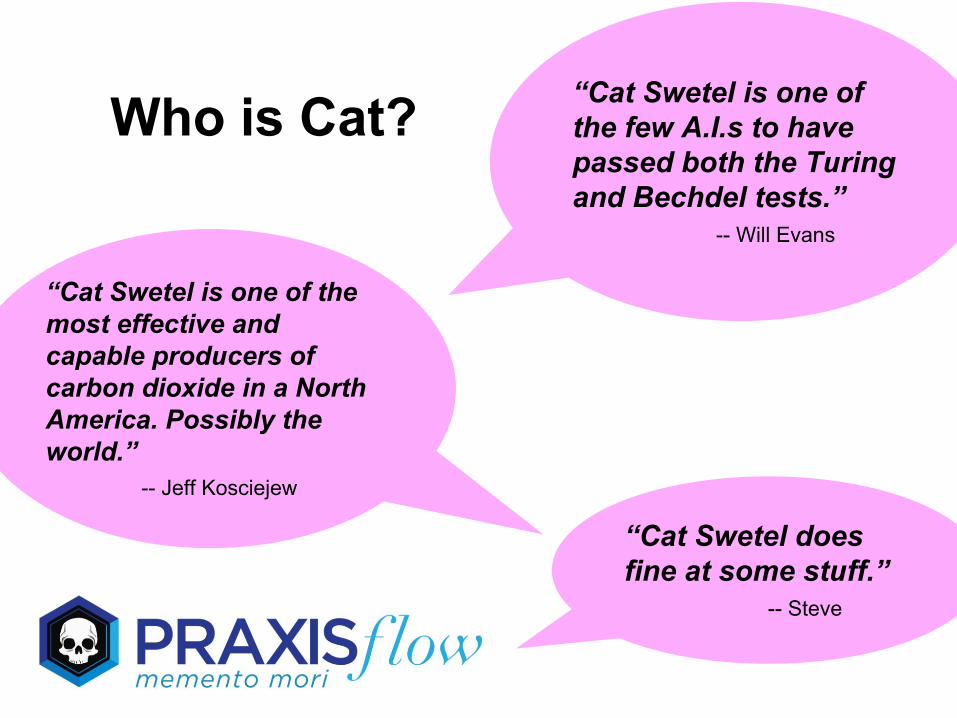
“Cat Swetel is one of the few A.I.s to have passed both the Turing and Bechdel tests.”
-- Will Evans
“Cat Swetel is one of the most effective and capable producers of carbon dioxide in a North America. Possibly the world.”
-- Jeff Kosciejew
Who is Cat?
“Cat Swetel does fine at some stuff.”
-- Steve
AGENDA
Some awesome lagging indicators
Using different views to tell different stories or different versions of the same story
Leading indicators????
Relationships@CATSWETEL
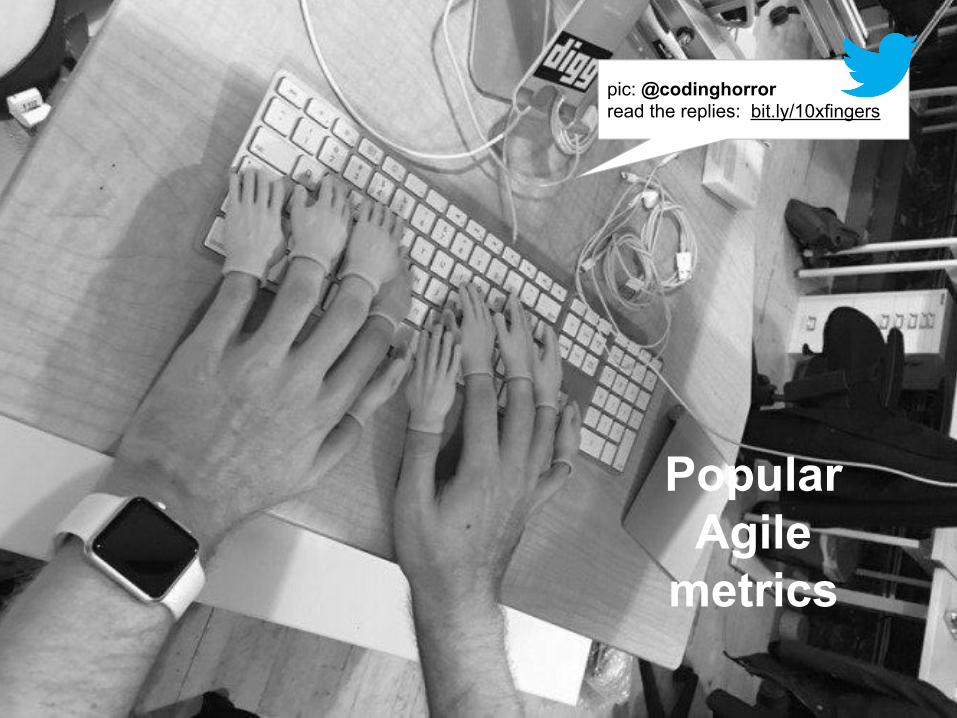
Popular Agile
metrics
pic: @codinghorrorread the replies: bit.ly/10xfingers
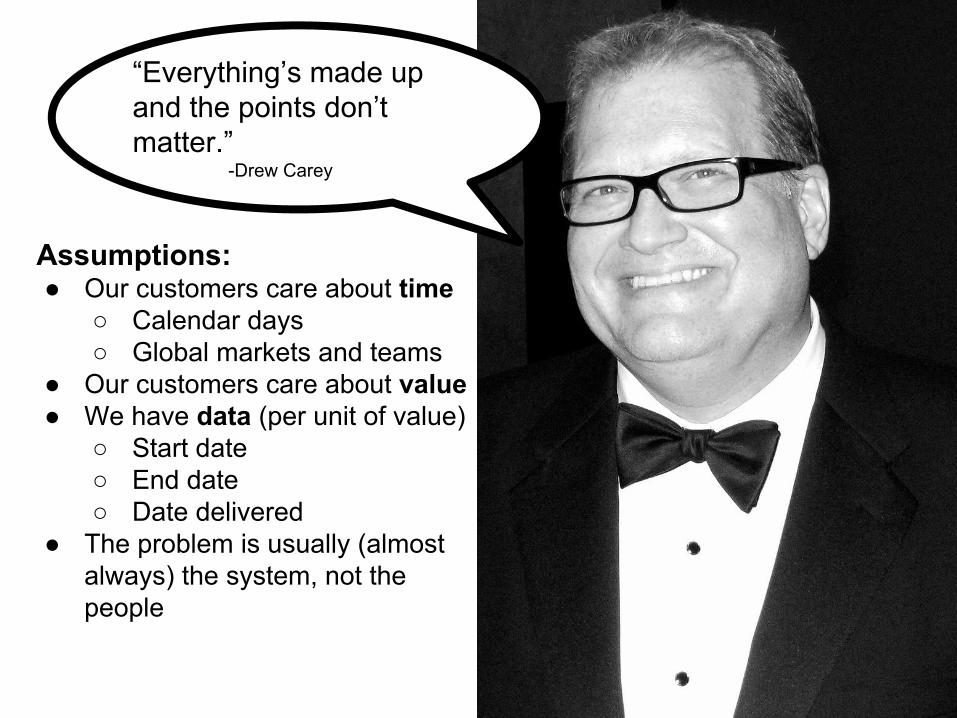
“Everything’s made up and the points don’t matter.”
-Drew Carey
Assumptions: ● Our customers care about time
○ Calendar days○ Global markets and teams
● Our customers care about value ● We have data (per unit of value)
○ Start date○ End date ○ Date delivered
● The problem is usually (almost always) the system, not the people
“Everything’s made up and the points don’t matter.”
-Drew Carey
What’s the value of metrics?
● Tell stories, build shared context
● Make decisions in context
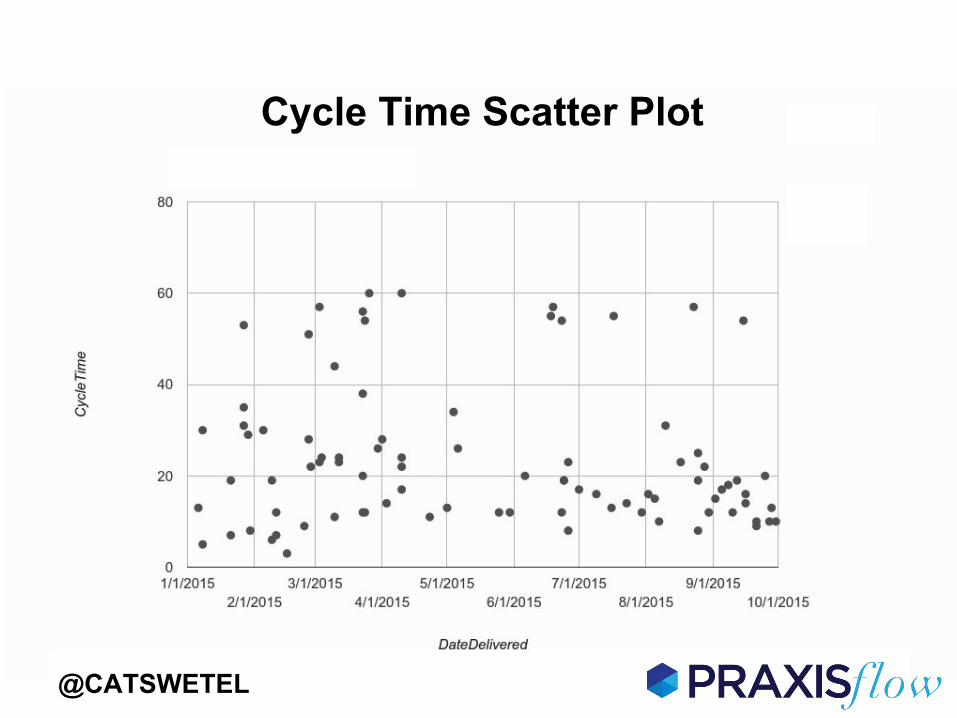
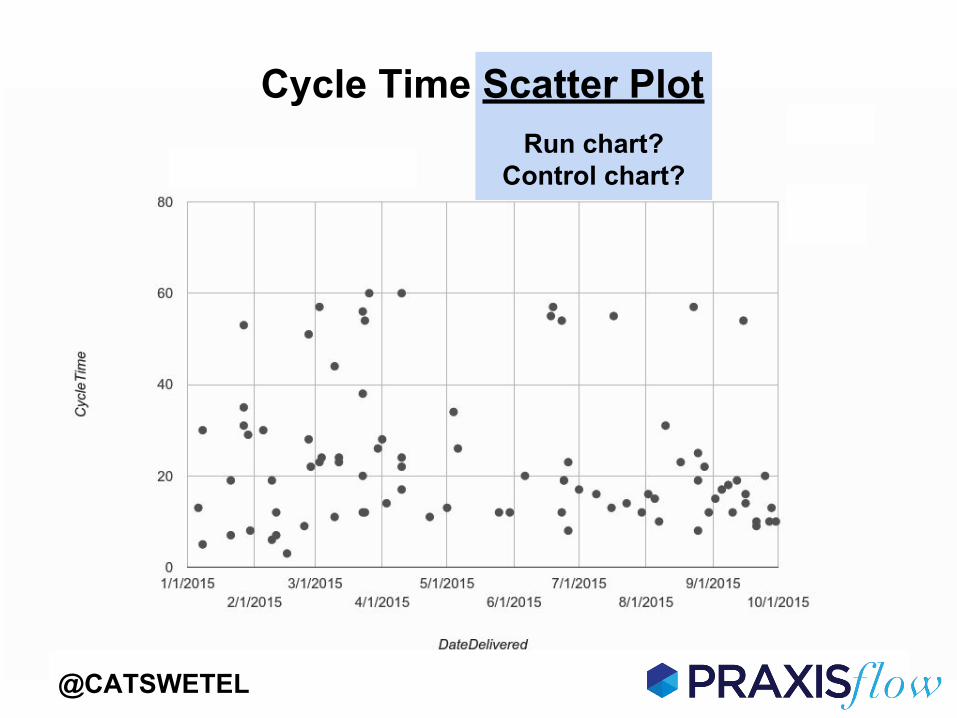
Cycle Time Scatter Plot
@CATSWETEL
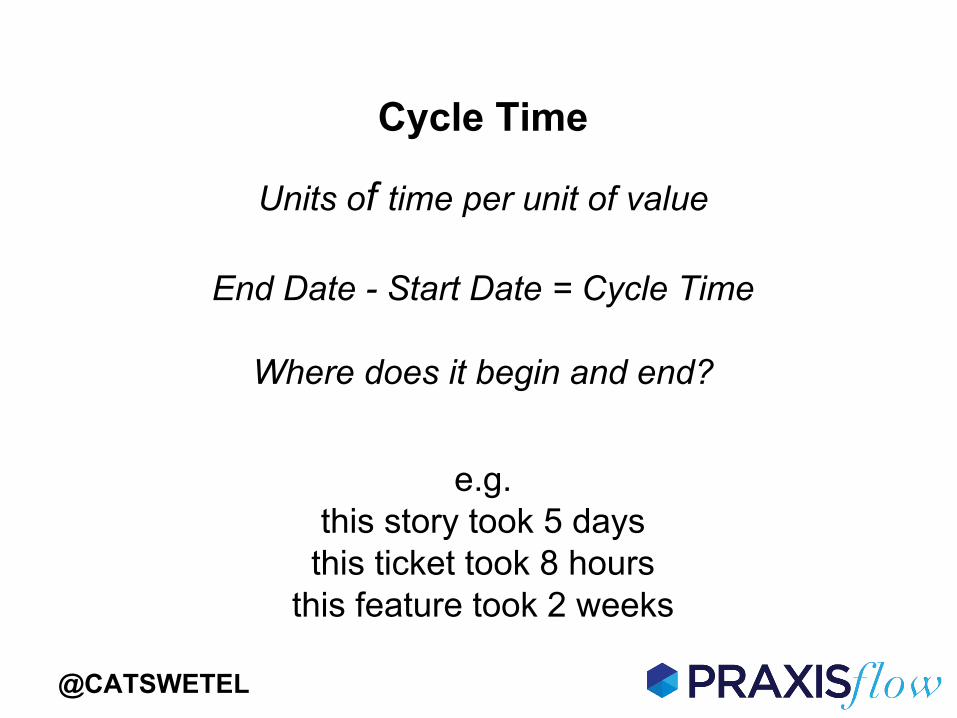
Cycle Time
Units of time per unit of value
e.g. this story took 5 days
this ticket took 8 hoursthis feature took 2 weeks
End Date - Start Date = Cycle Time
Where does it begin and end?
@CATSWETEL

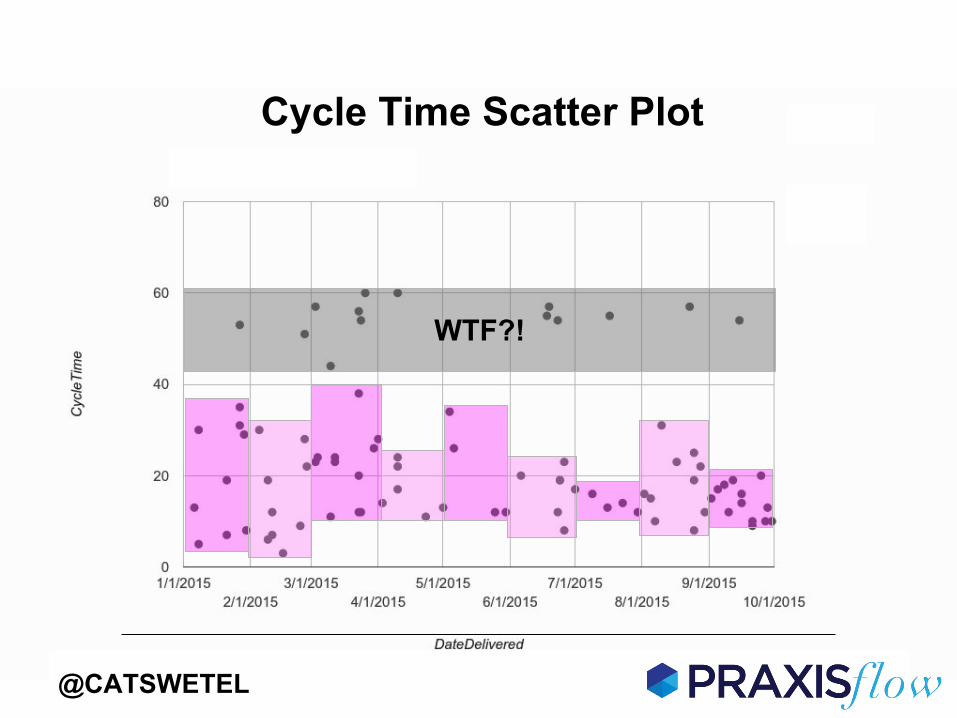
Cycle Time Scatter Plot
@CATSWETEL
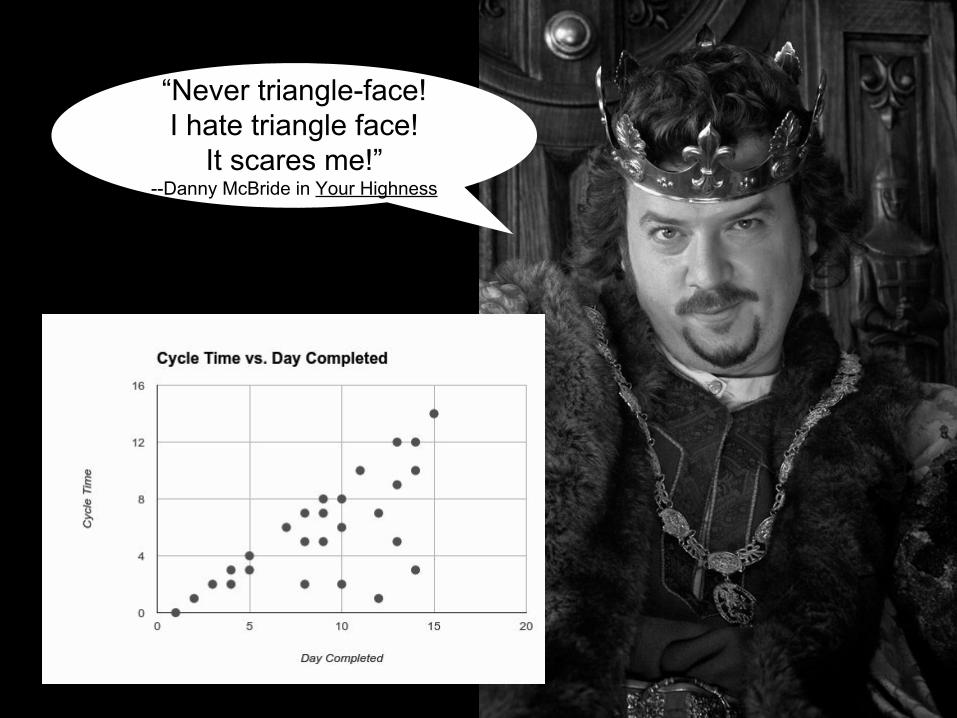
“Never triangle-face! I hate triangle face!
It scares me!” --Danny McBride in Your Highness
@CATSWETEL
Run chart? Control chart?
Cycle Time Scatter Plot
Cycle time? Is there any old way? Probably at project level or maybe in ops there will be SLAs. This is a way under utilized metric. IMO
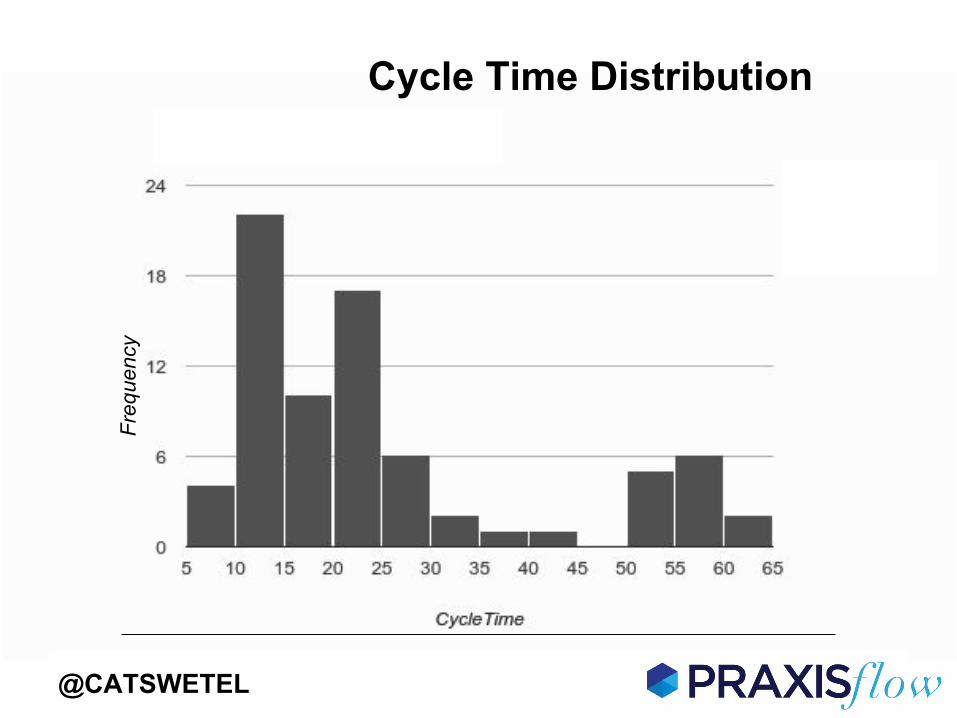
Freq
uenc
y
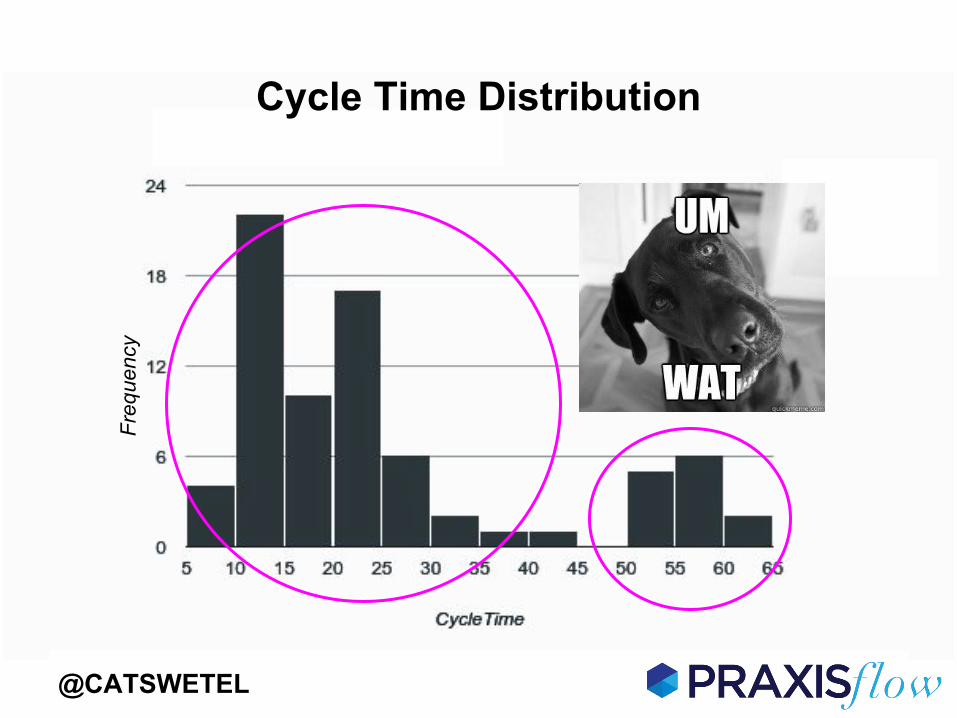
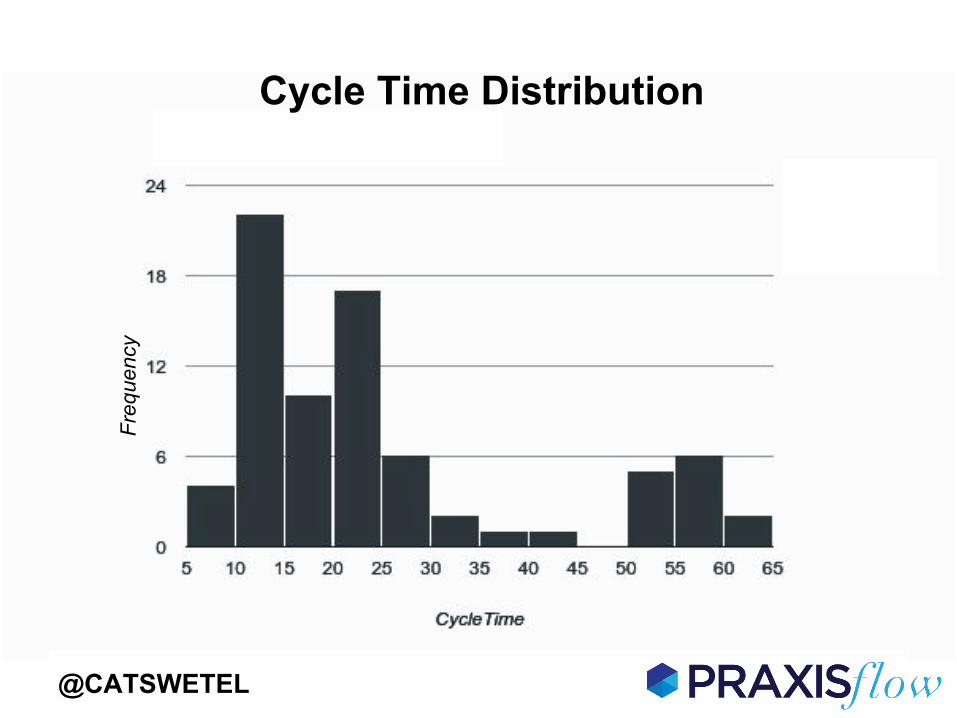
Cycle Time Distribution
@CATSWETEL
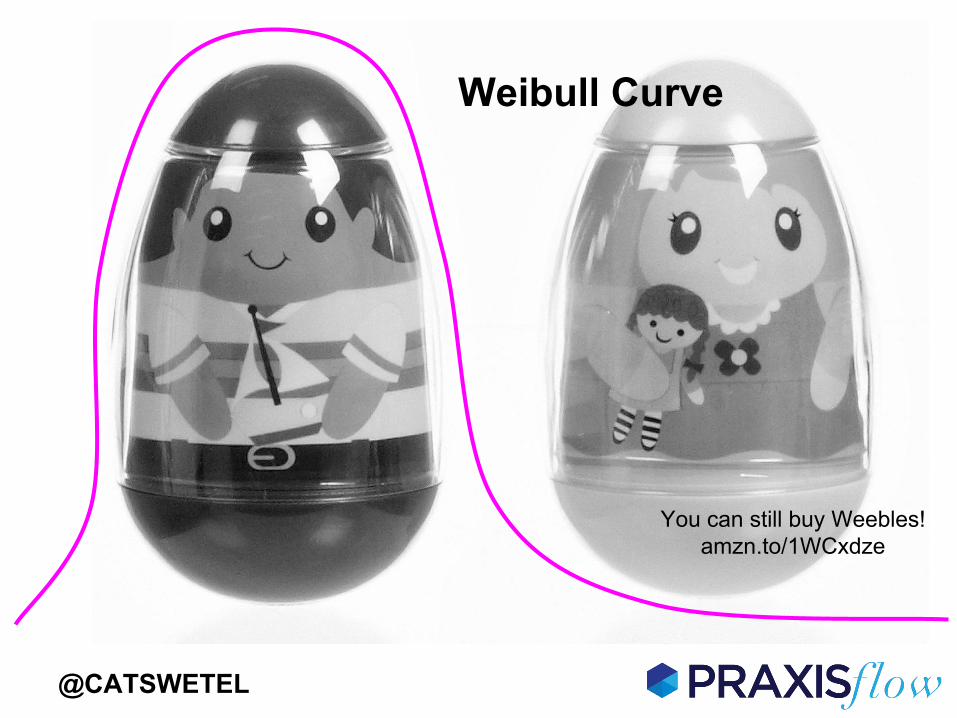
Weibull Curve
You can still buy Weebles! amzn.to/1WCxdze
@CATSWETEL
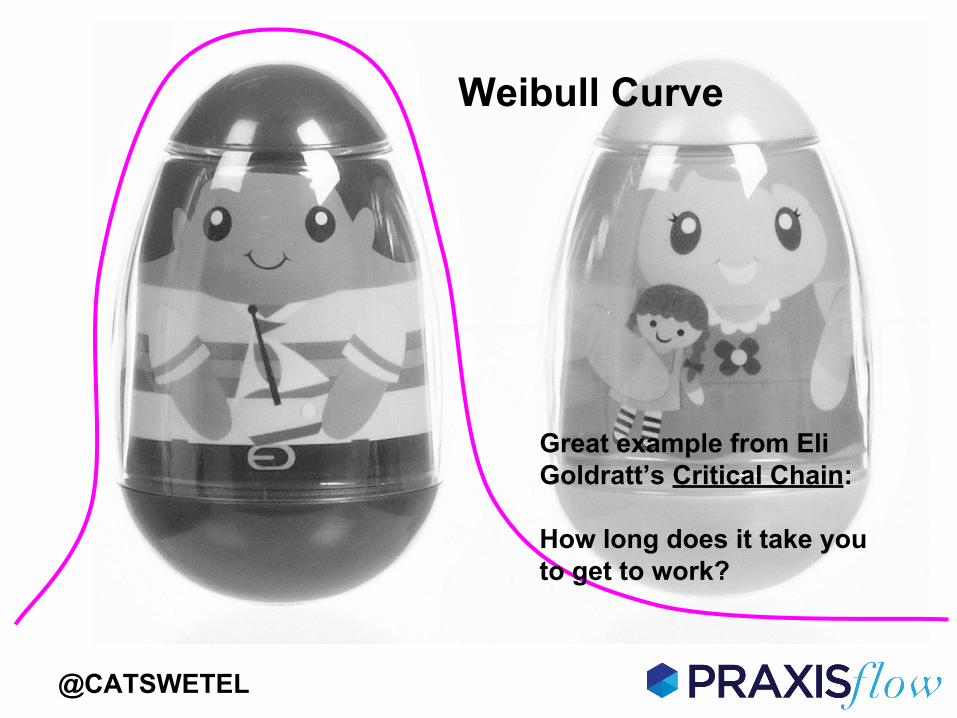
Weibull Curve
Great example from Eli Goldratt’s Critical Chain:
How long does it take you to get to work?
@CATSWETEL
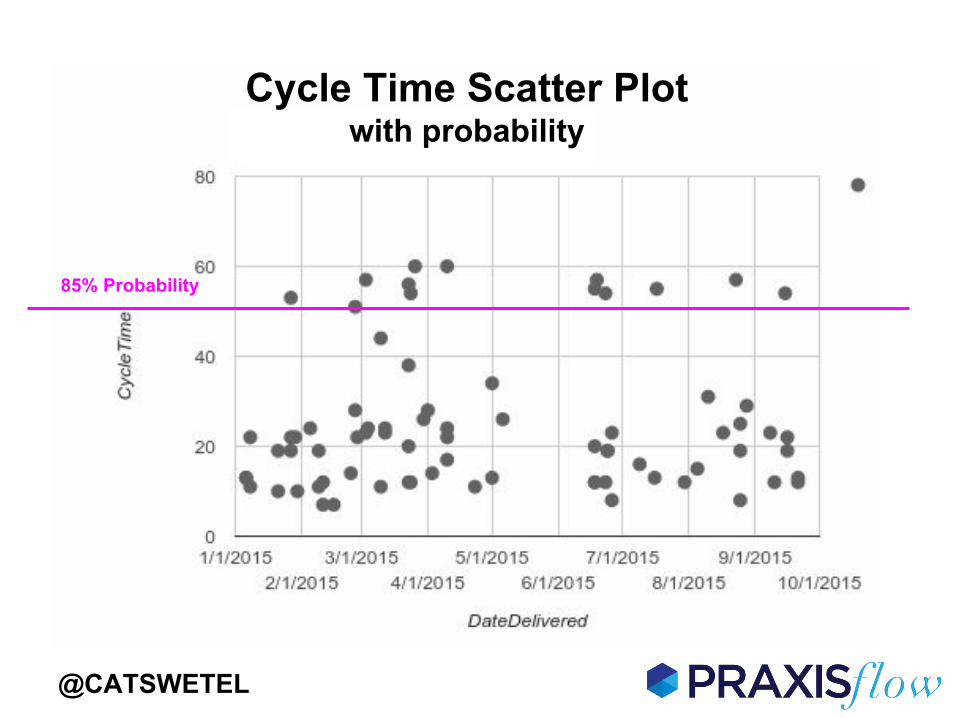
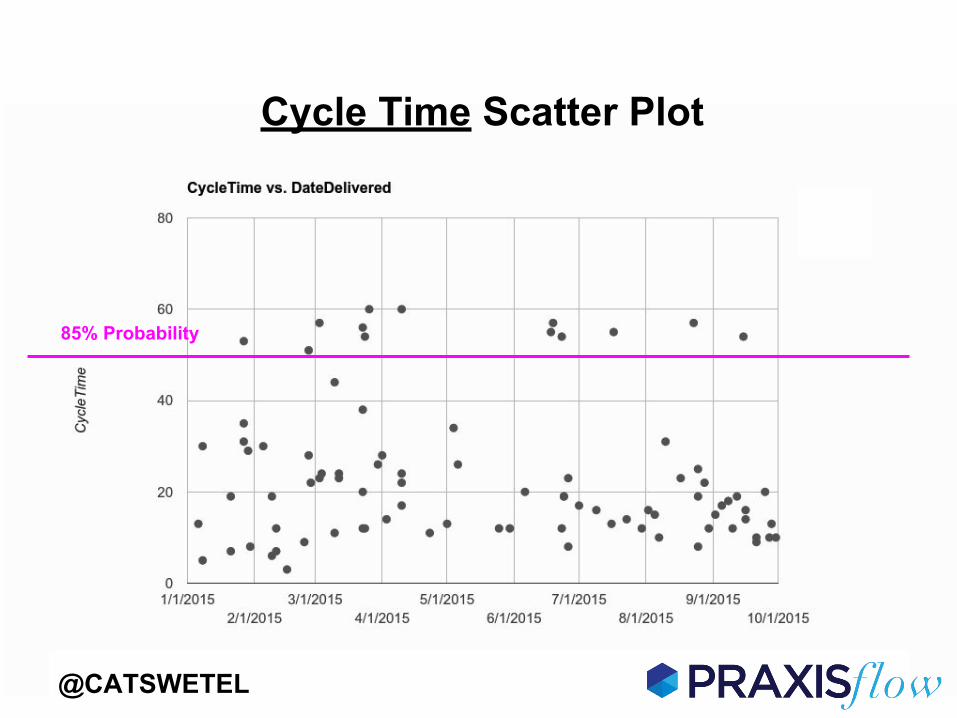
85% Probability
Cycle Time Scatter Plotwith probability
@CATSWETEL
Cycle time new way….and with PROBABILITY not a real control chart with control limits based on sigmas
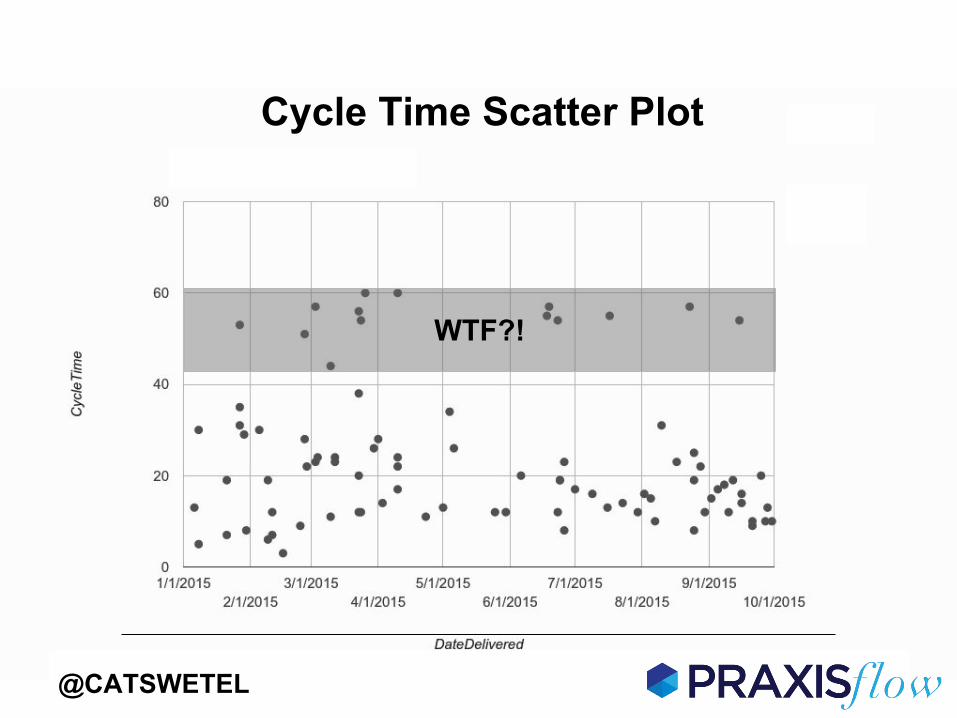
WTF?!
@CATSWETEL
Cycle Time Scatter Plot
Cycle time? Is there any old way? Probably at project level or maybe in ops there will be SLAs. This is a way under utilized metric. IMO
Freq
uenc
yCycle Time Distribution
@CATSWETEL
Cycle time new way….and with PROBABILITY not a real control chart with control limits based on sigmas
WTF?!
@CATSWETEL
Cycle Time Scatter Plot
Cycle time? Is there any old way? Probably at project level or maybe in ops there will be SLAs. This is a way under utilized metric. IMO
Freq
uenc
yCycle Time Distribution
@CATSWETEL
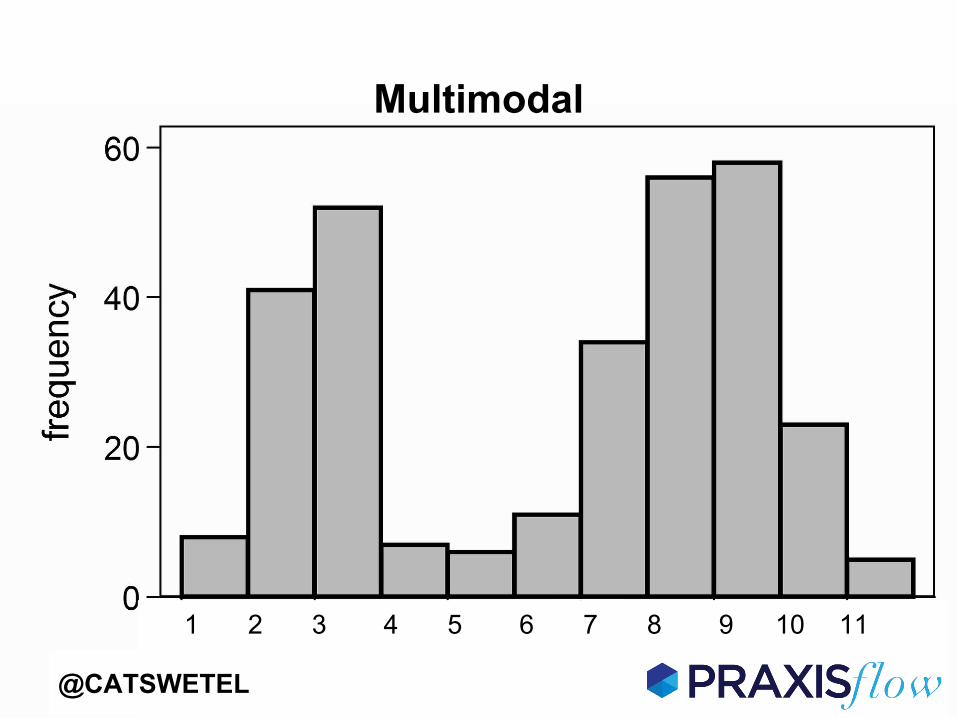
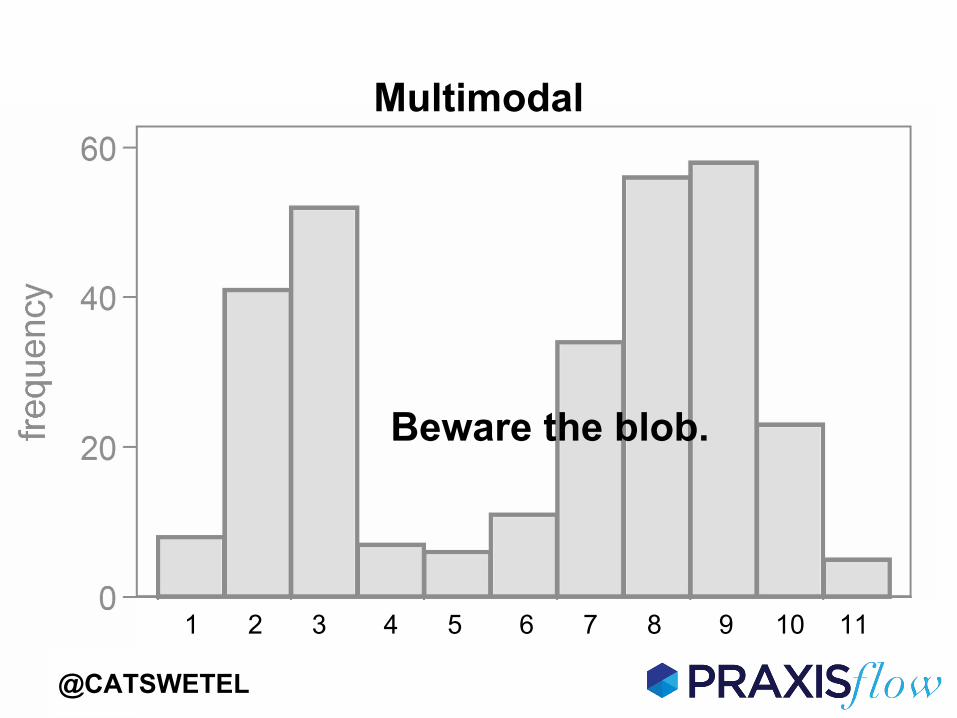
But what if it doesn’t look like that? What if it looks like a camel?
1 2 3 4 5 6 7 8 9 10 11
Multimodal
@CATSWETEL
1 2 3 4 5 6 7 8 9 10 11
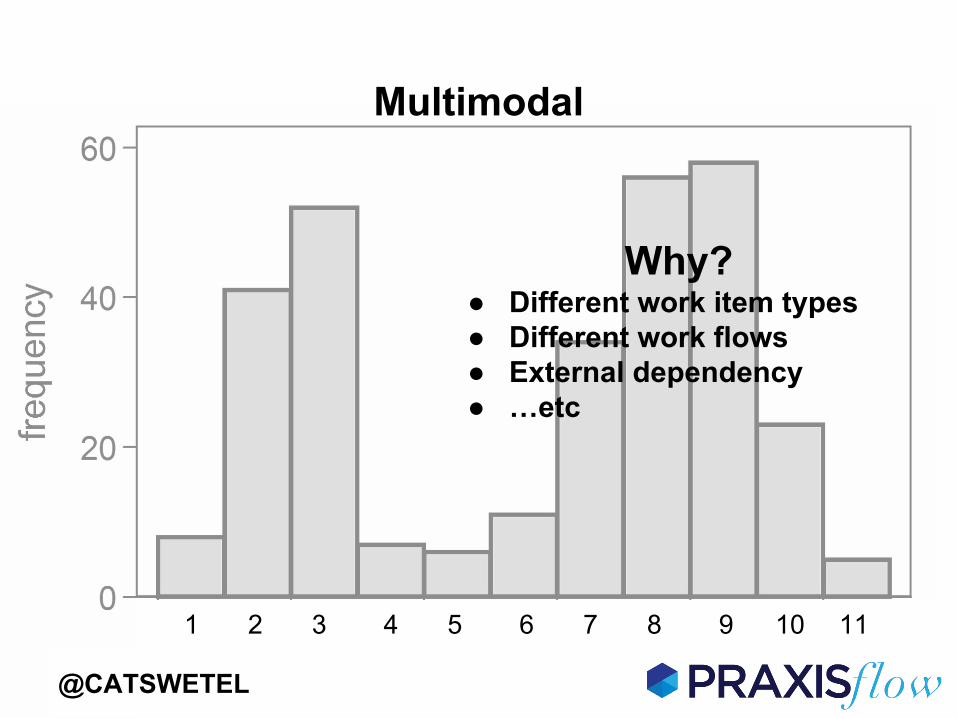
Multimodal
Why? ● Different work item types● Different work flows ● External dependency● …etc
@CATSWETEL
1 2 3 4 5 6 7 8 9 10 11
Multimodal
Beware the blob.
@CATSWETEL
@CATSWETEL
Cycle Time Scatter Plot
85% Probability
Cycle time new way….and with PROBABILITY not a real control chart with control limits based on sigmas
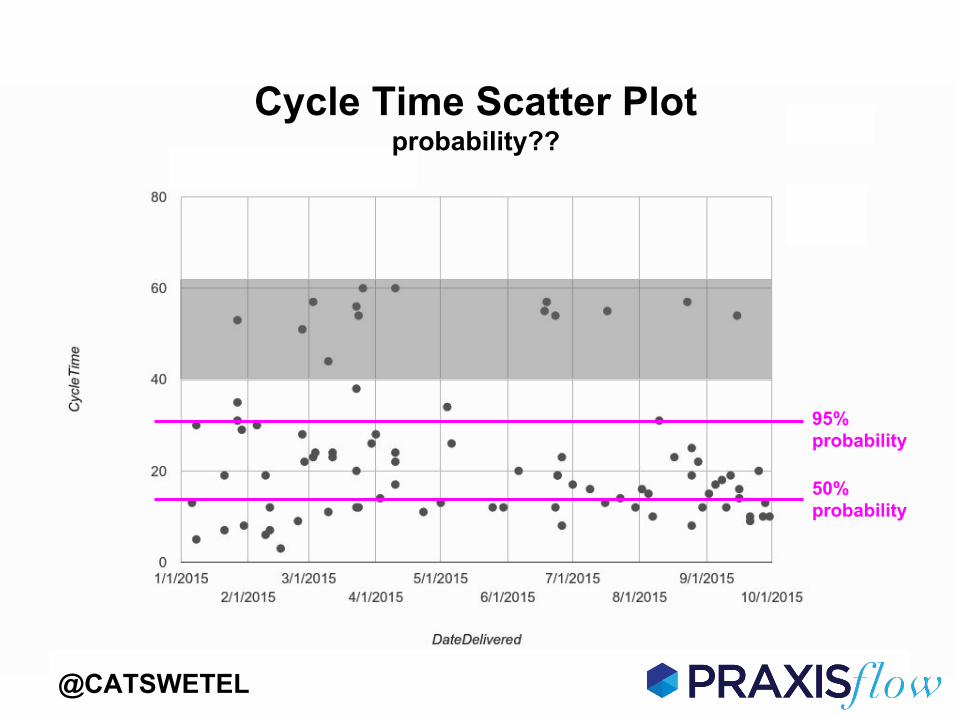
Cycle Time Scatter Plotprobability??
95% probability
50% probability
@CATSWETEL
Cycle time new way….and with PROBABILITY not a real control chart with control limits based on sigmas
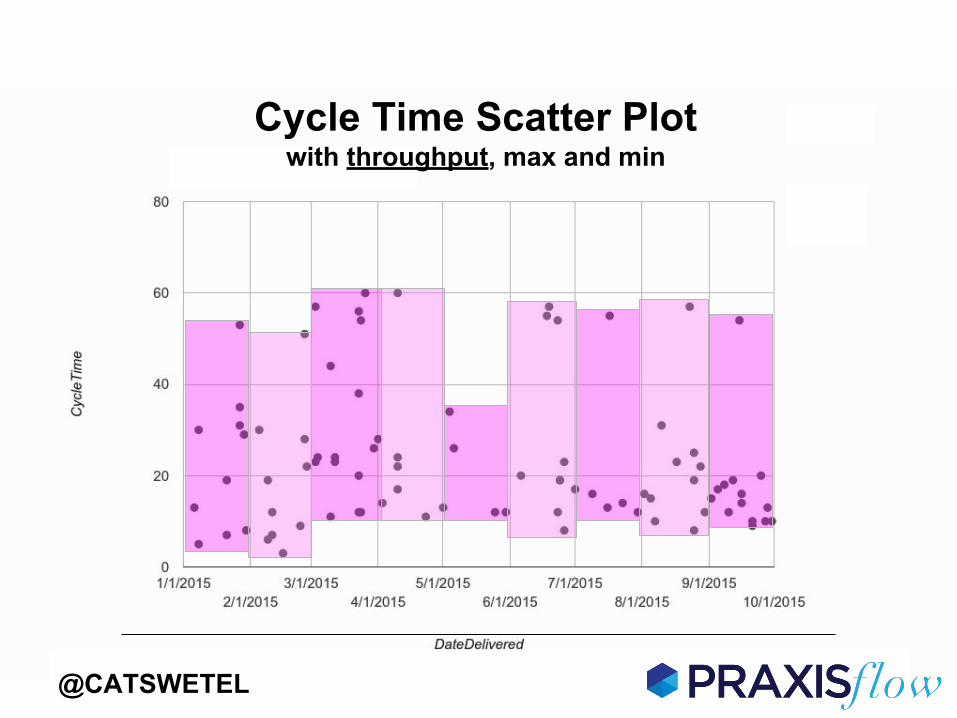
Cycle Time Scatter Plotwith throughput, max and min
@CATSWETEL
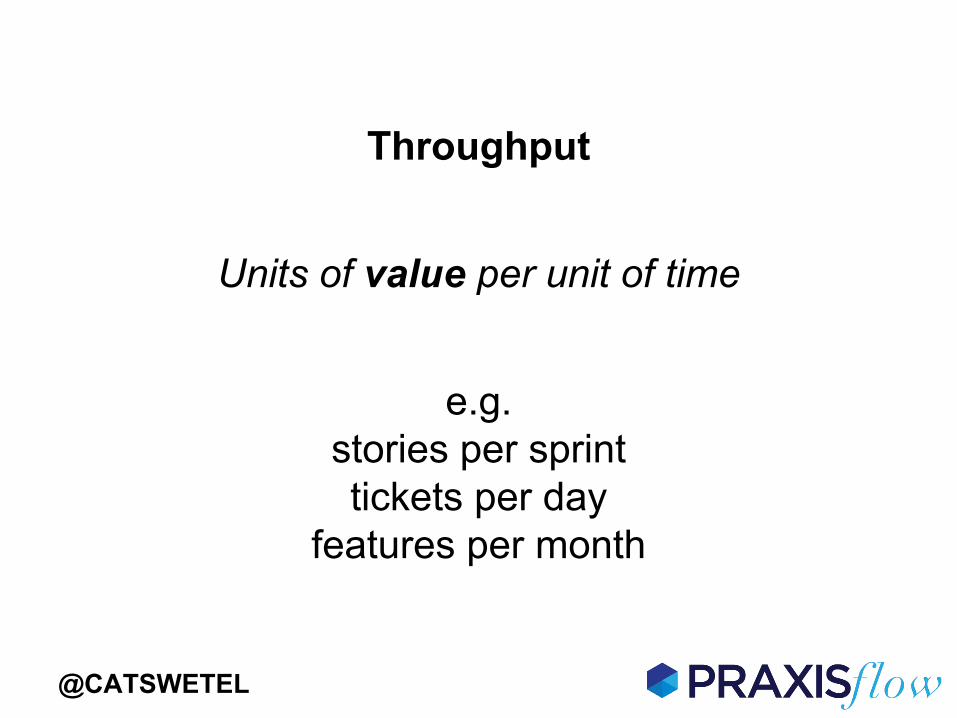
Throughput
Units of value per unit of time
e.g. stories per sprinttickets per day
features per month
@CATSWETEL
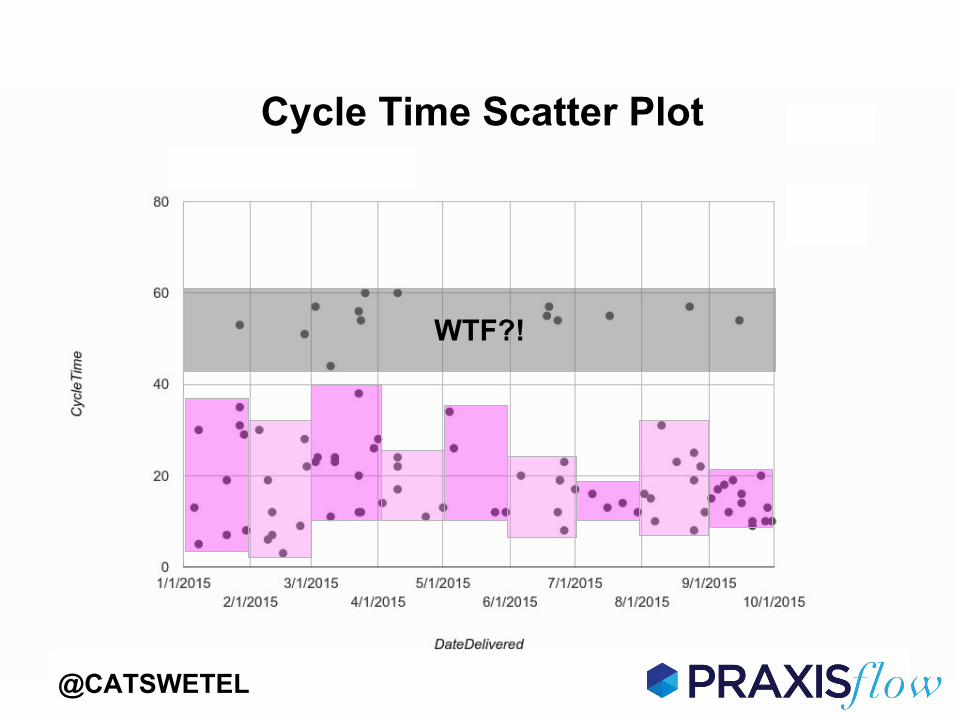
Cycle time new way….and with PROBABILITY not a real control chart with control limits based on sigmas
WTF?!
@CATSWETEL
Cycle Time Scatter Plot
Cycle time new way….and with PROBABILITY not a real control chart with control limits based on sigmas
WTF?!
@CATSWETEL
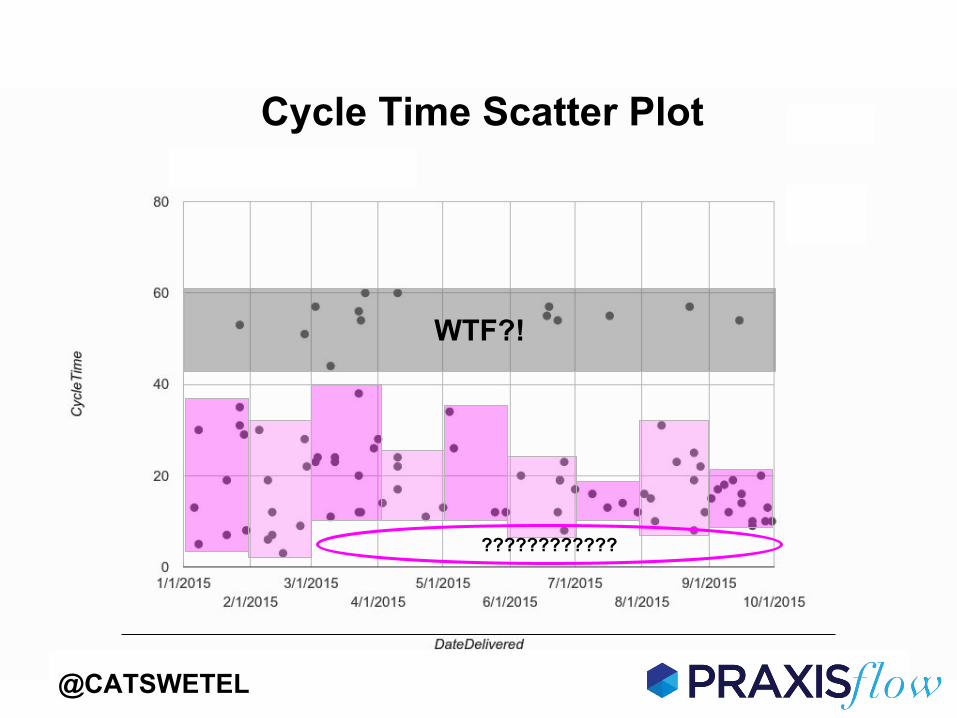
Cycle Time Scatter Plot
????????????
Cycle time new way….and with PROBABILITY not a real control chart with control limits based on sigmas
9 911
64
6 410
13
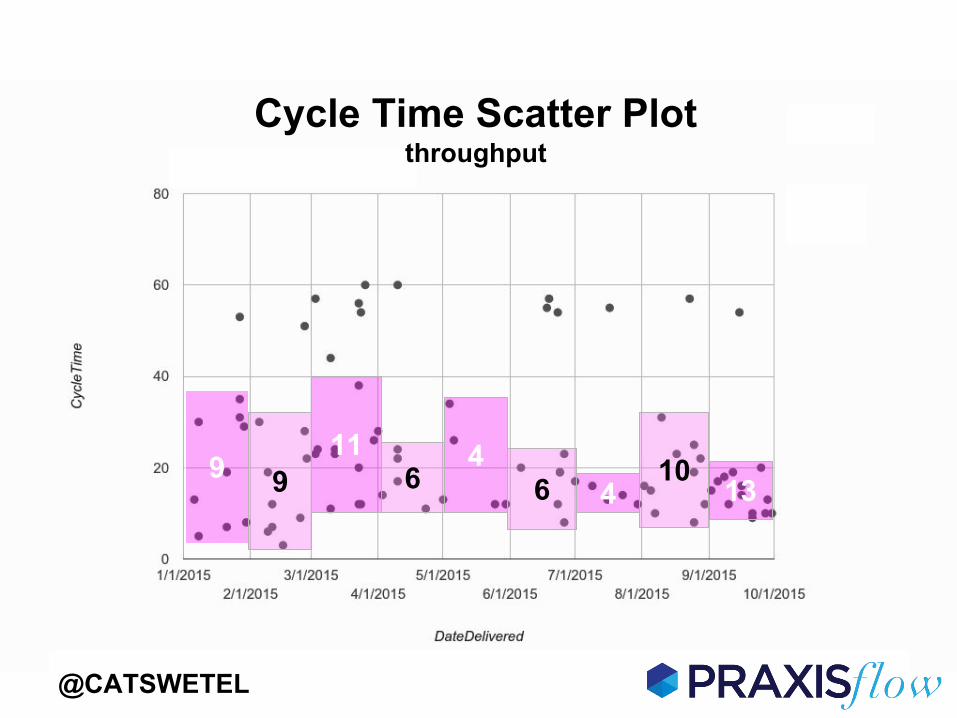
Cycle Time Scatter Plotthroughput
@CATSWETEL
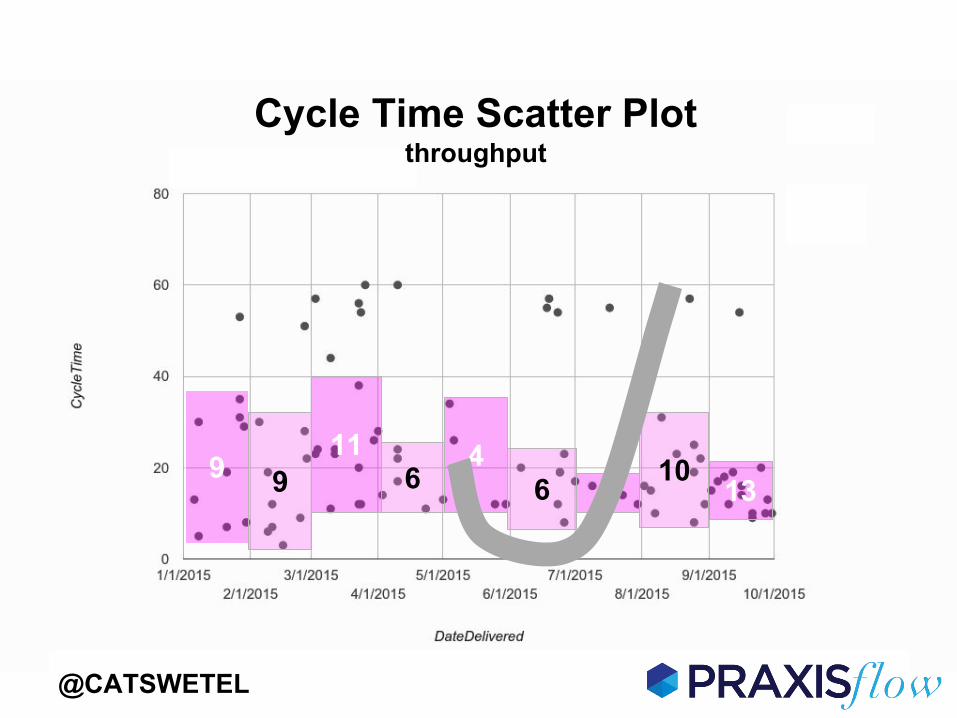
Cycle time new way….and with PROBABILITY not a real control chart with control limits based on sigmas
9 911
64
6 410
13
Cycle Time Scatter Plotthroughput
@CATSWETEL
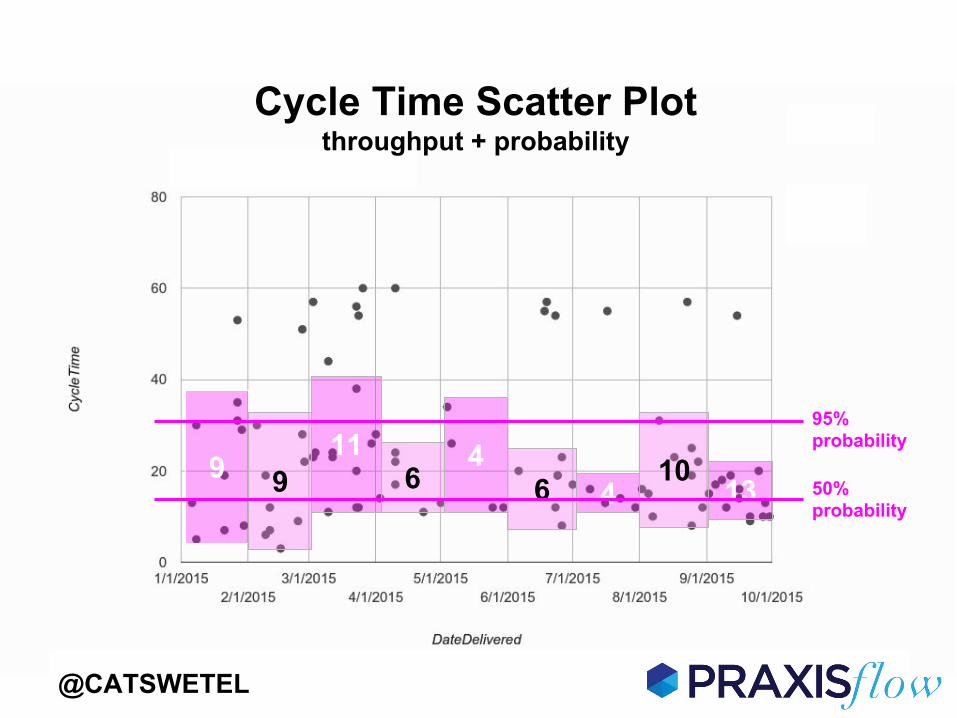
Cycle time new way….and with PROBABILITY not a real control chart with control limits based on sigmas
9 911
64
6 410
13
Cycle Time Scatter Plotthroughput + probability
95% probability
50% probability
@CATSWETEL
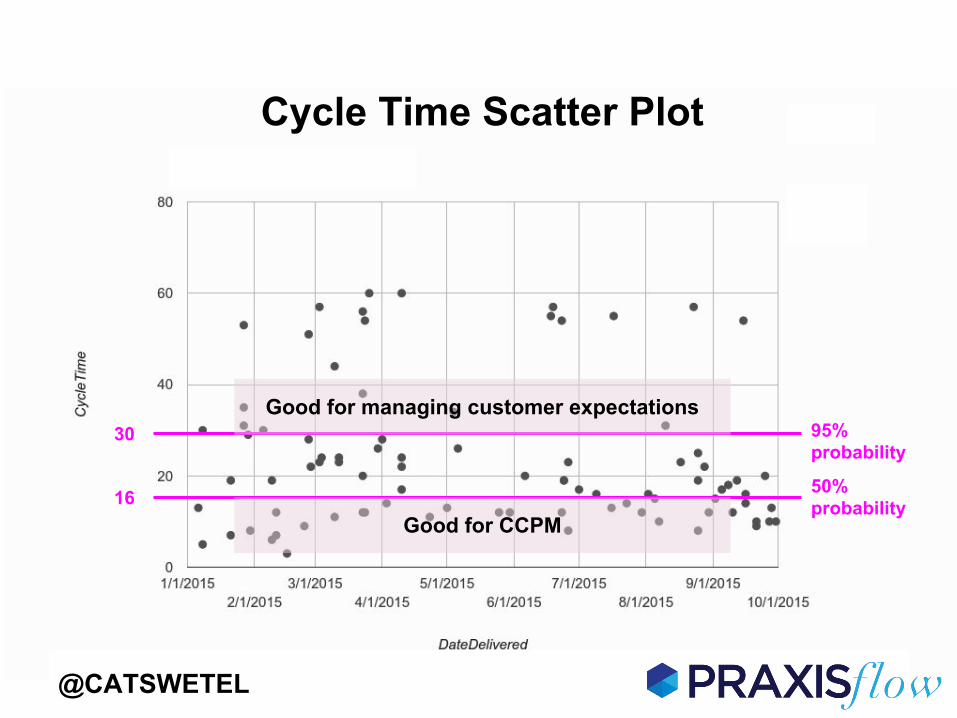
Cycle Time Scatter Plot
95% probability
50% probability
30
16
Good for managing customer expectations
Good for CCPM
@CATSWETEL
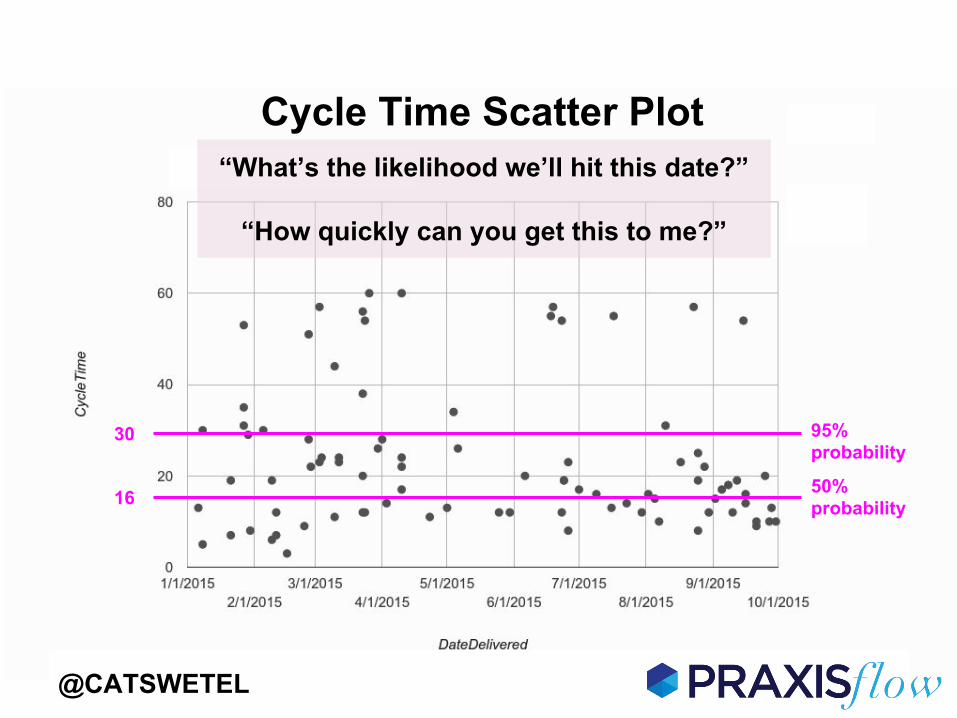
Cycle Time Scatter Plot
95% probability
50% probability
30
16
@CATSWETEL
“What’s the likelihood we’ll hit this date?”
“How quickly can you get this to me?”
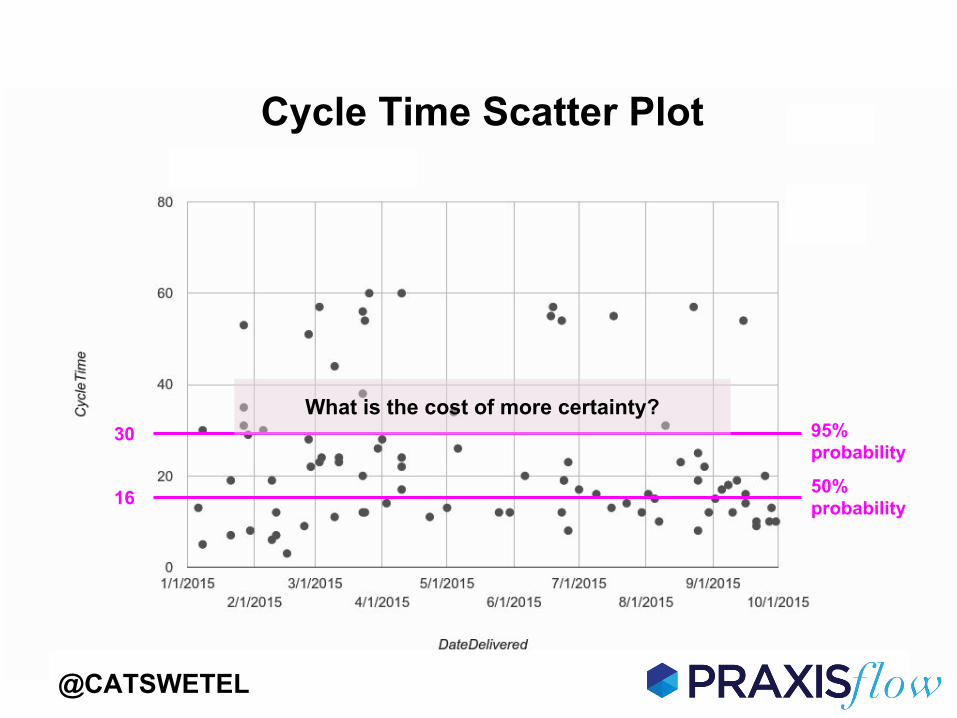
Cycle Time Scatter Plot
95% probability
50% probability
30
16
What is the cost of more certainty?
@CATSWETEL
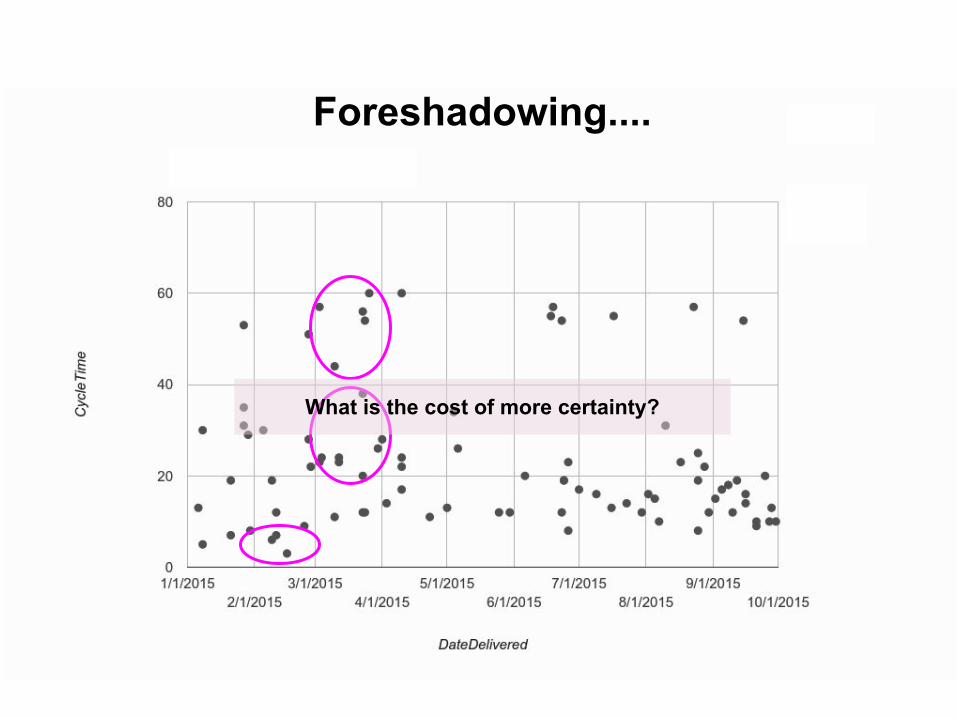
Foreshadowing....
What is the cost of more certainty?
LAGGING vs LEADINGINDICATORS
@CATSWETEL
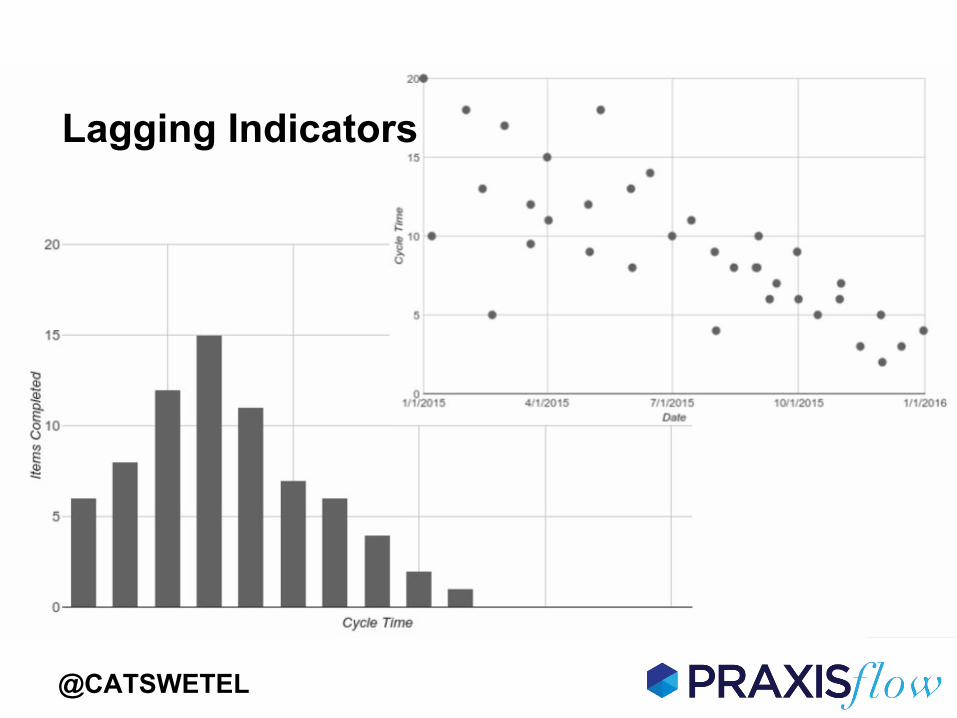
Lagging Indicators
@CATSWETEL
Predictive metrics! Is there such a thing common in agile teams today? Ummmm not really
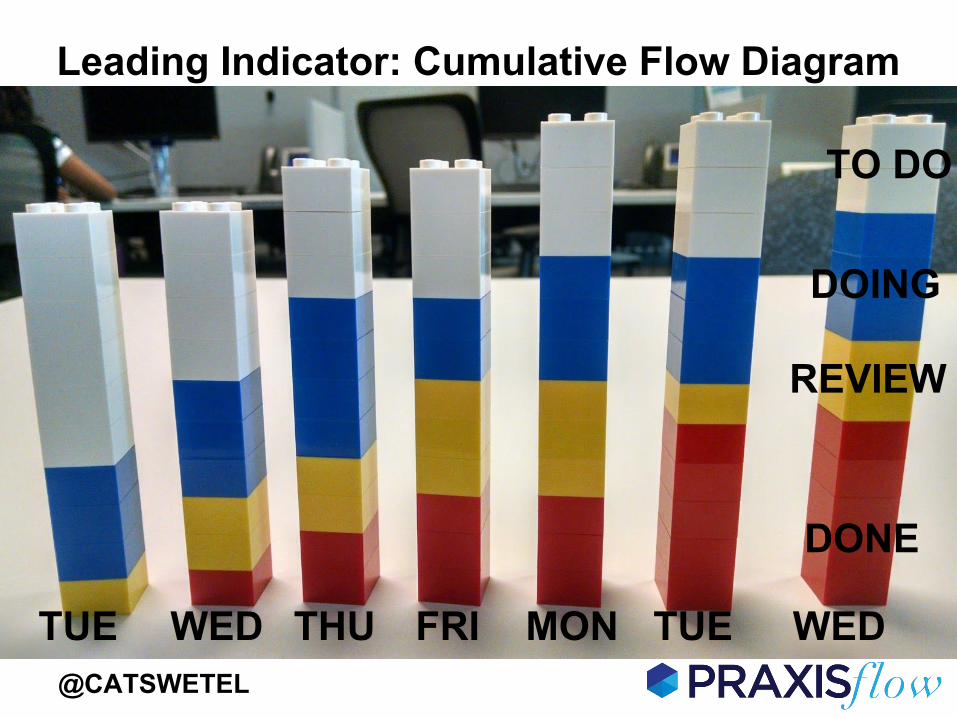
DONE
REVIEW
DOING
TO DO
TUE WED THU FRI MON TUE WED@CATSWETEL
Leading Indicator: Cumulative Flow Diagram
@CATSWETEL
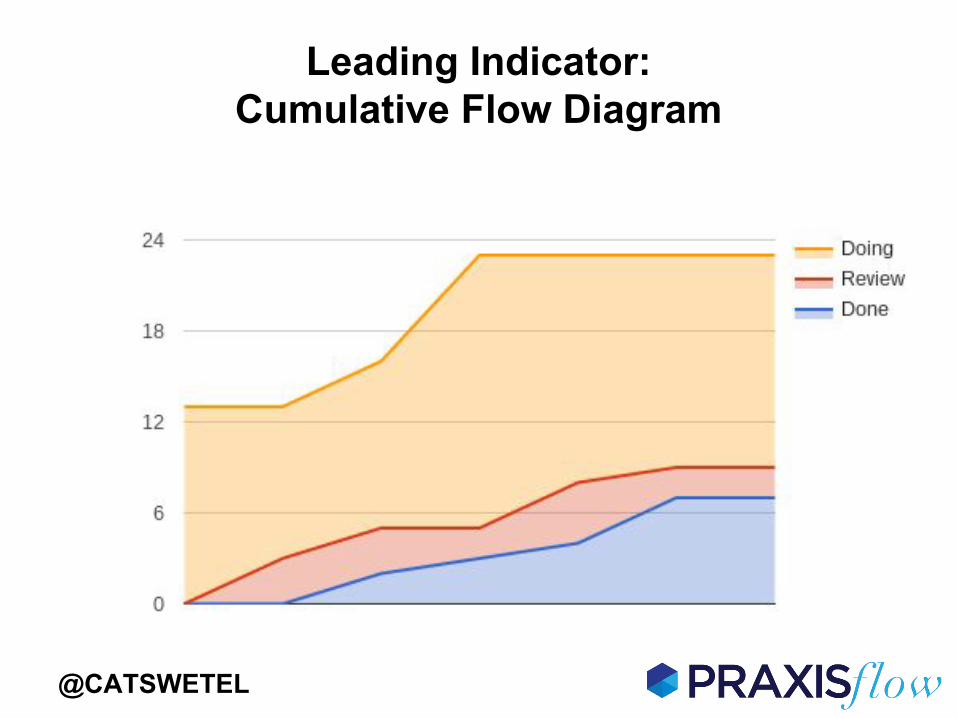
Leading Indicator: Cumulative Flow Diagram
@CATSWETEL
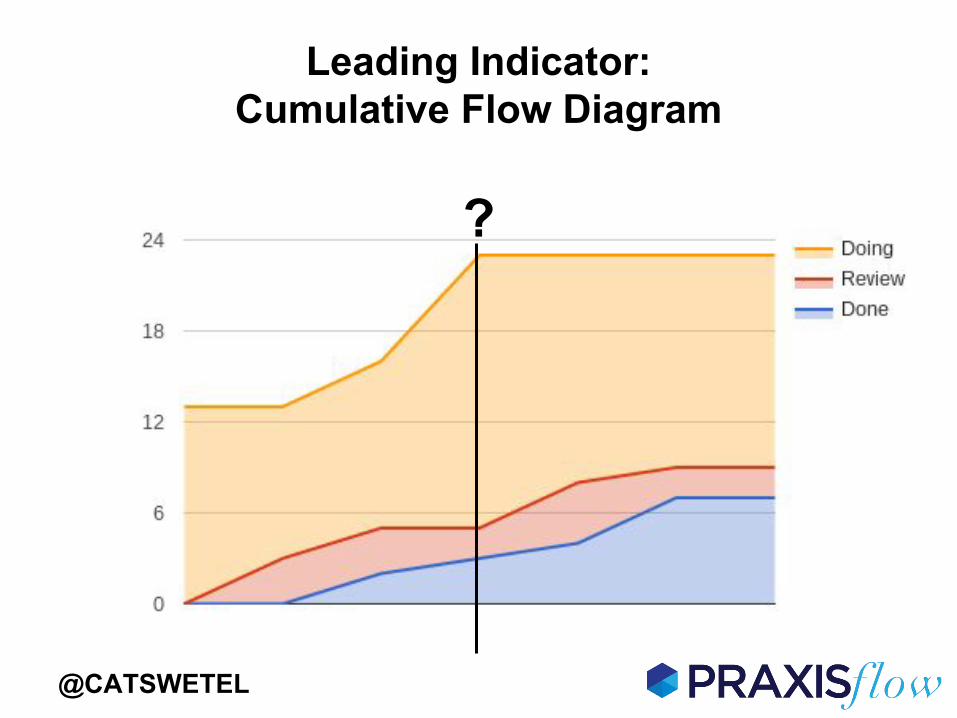
Leading Indicator: Cumulative Flow Diagram
?
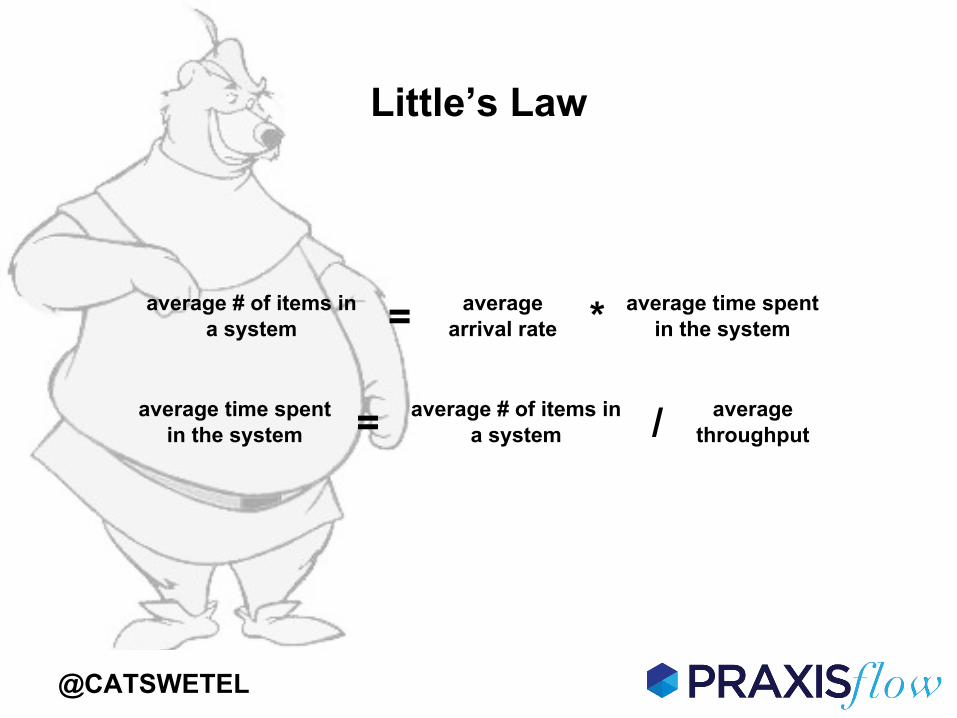
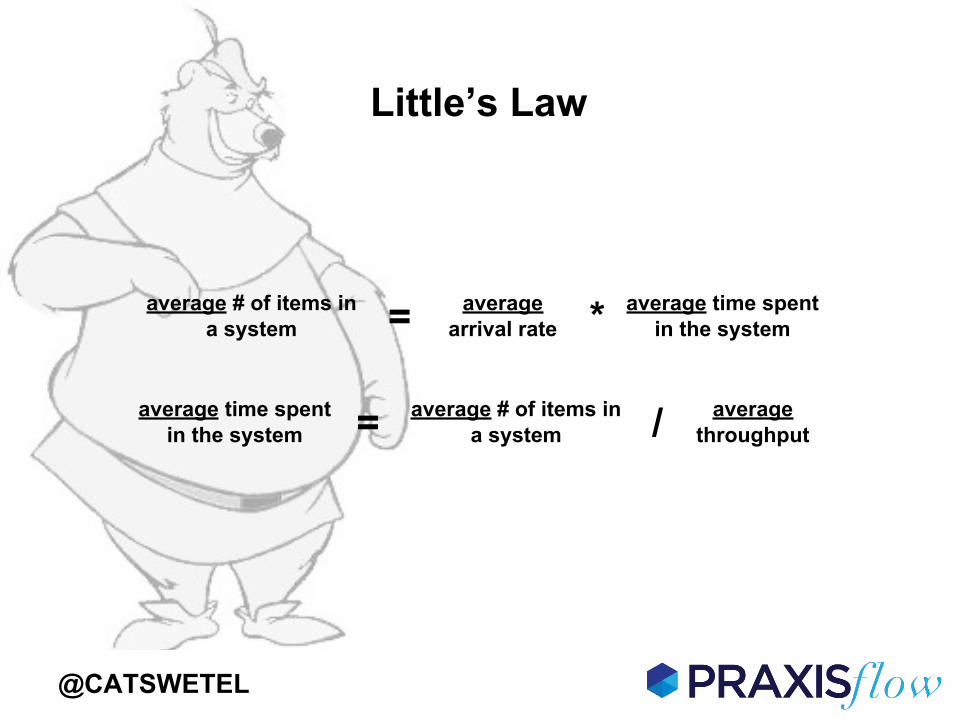
Little’s Law
average # of items in a system
average arrival rate
average time spent in the system= *
average time spent in the system = average # of items in
a system / average throughput
@CATSWETEL
Little’s Law
average # of items in a system
average arrival rate
average time spent in the system= *
average time spent in the system = average # of items in
a system / average throughput
@CATSWETEL
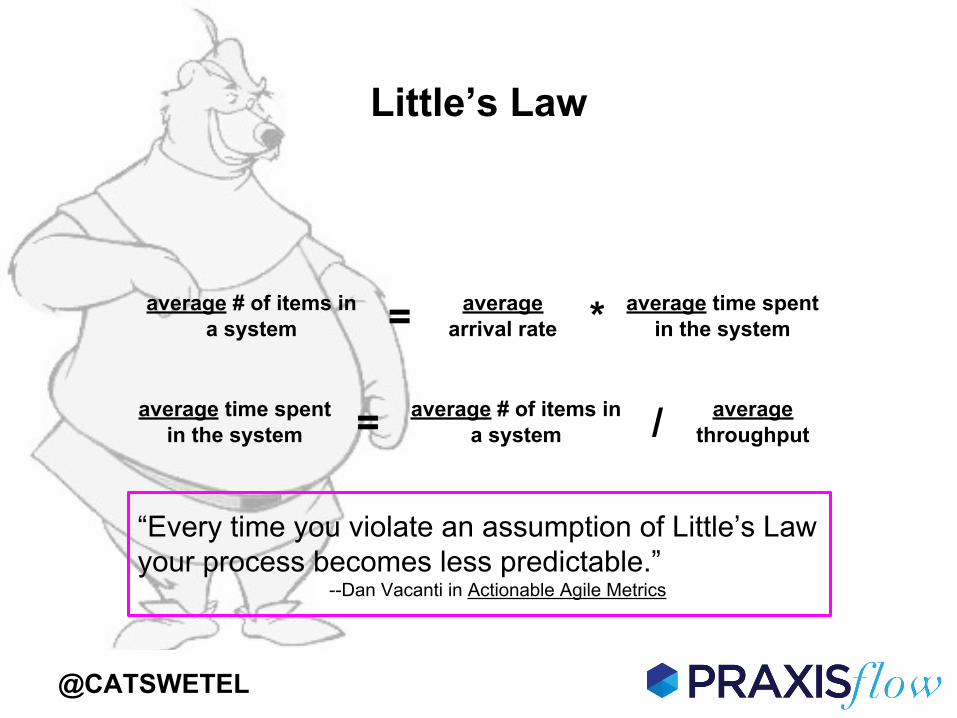
Little’s Law
average # of items in a system
average arrival rate
average time spent in the system= *
average time spent in the system = average # of items in
a system / average throughput
@CATSWETEL
“Every time you violate an assumption of Little’s Law your process becomes less predictable.”
--Dan Vacanti in Actionable Agile Metrics
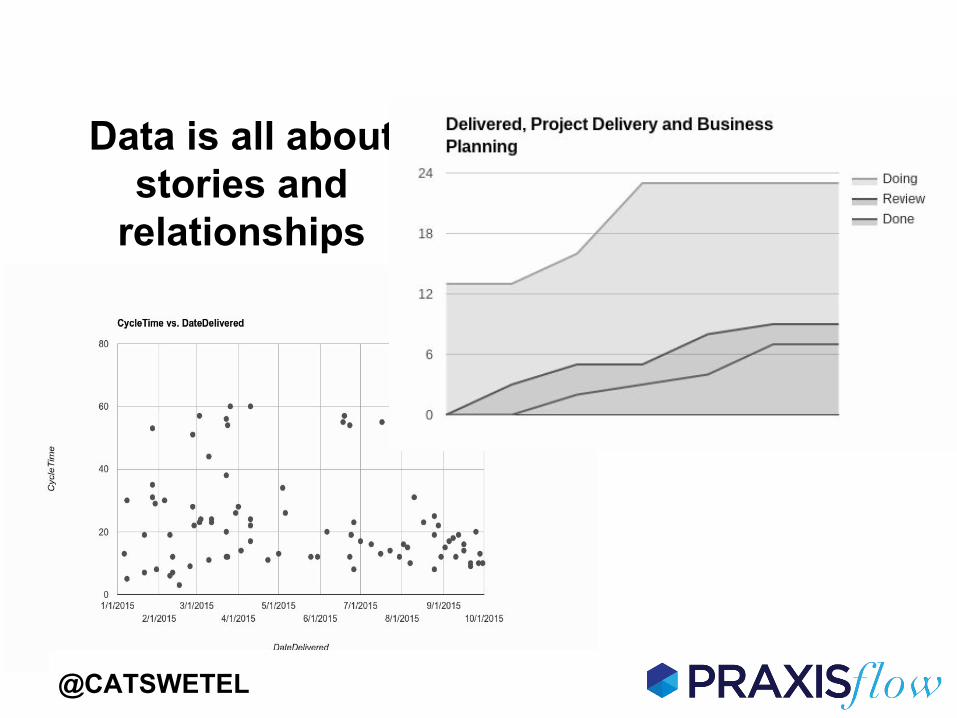
Data is all about stories and
relationships
@CATSWETEL
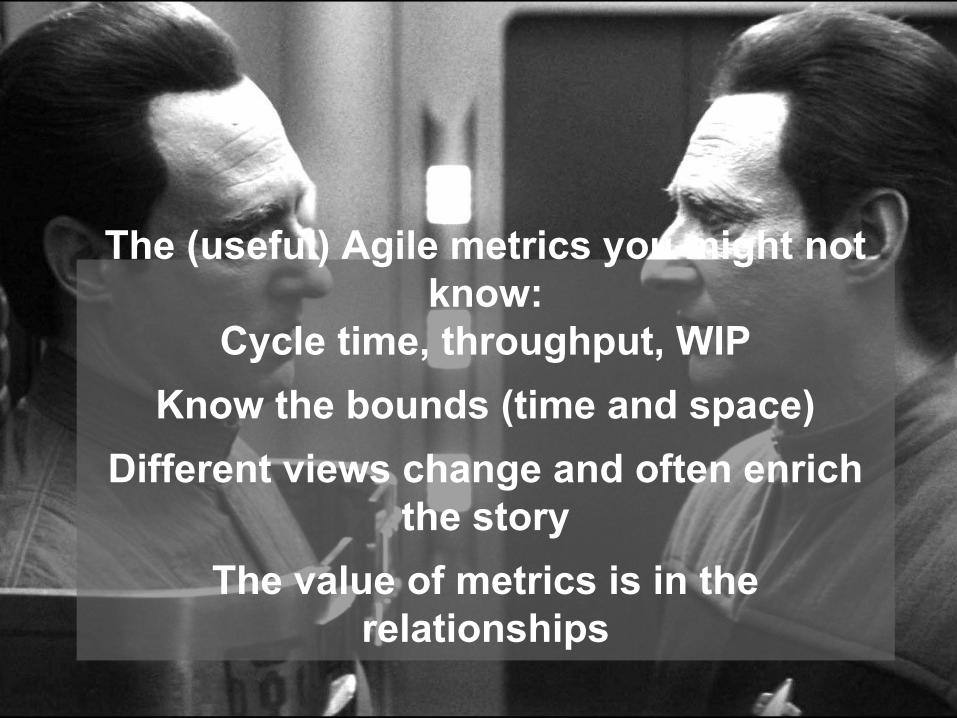
The (useful) Agile metrics you might not know:
Cycle time, throughput, WIPKnow the bounds (time and space)
Different views change and often enrich the story
The value of metrics is in the relationships
Using Metrics as a [email protected]@praxisflow.com