lean, m.e.j. (2014) validation of a short food frequency ...eprints.gla.ac.uk/92478/1/92478.pdf ·...
TRANSCRIPT
Combet, E., and Lean, M.E.J. (2014) Validation of a short food frequency questionnaire specific for iodine in UK females of childbearing age. Journal of Human Nutrition and Dietetics . ISSN 0952-3871 Copyright © 2014 Blackwell Publishing http://eprints.gla.ac.uk/92478/
Deposited on: 13 March 2014
Enlighten – Research publications by members of the University of Glasgow
http://eprints.gla.ac.uk
Validation of a short food frequency questionnaire
specific for iodine in UK females of childbearing age
This is a pre-print, pre-peer review version of the published paper, which is
available online and should be cited as
“Combet E. & Lean M.E.J. (2014) Validation of a short food frequency questionnaire specific for iodine in UK
females of childbearing age. J Hum Nutr Diet. doi:10.1111/jhn.12219”
Emilie Combet1, Michael EJ Lean1
1 Human Nutrition, School of Medicine, College of Medical Veterinary and Life Sciences, University
of Glasgow, New Lister Building, Glasgow Royal Infirmary, Glasgow G31 2ER
* Corresponding author:
Emilie Combet, School of Medicine, College of Medical Veterinary and Life Sciences, University of
Glasgow, New Lister Building, Glasgow Royal Infirmary, Glasgow G31 2ER, UK
Tel +44 141 201 8527; Fax. +44 141 201 9275
email: [email protected]
Short title: iodine FFQ
Keywords: iodine, food frequency questionnaire, triads method, validation, childbearing age,
females
Contribution statement: Funding was obtained by EC and ML. Validation data were collected and
analysed by EC. ML and EC prepared and reviewed the manuscript.
Abstract
Background: Widespread subclinical iodine insufficiently has recent been reported in Europe,
particularly amongst young women, based on urinary iodine using WHO/FAO criteria. While urinary
iodine concentration is useful measurement of the population iodine status, it does not provide an
insight in the habitual iodine intake of this population. This is compounded by the fact that very few
iodine-specific food frequency questionnaires (FFQ) have been validated so far.
Aim: to develop and validate a new, simple, rapid survey tool to assess dietary iodine exposure in
female of childbearing age.
Methodology: Iodine was measured in duplicate 24-hour urine collection. Iodine intake was
measured with duplicate 4-day semi-quantitative food diaries and the FFQ Correlation, cross-
classification and Bland Altman analyses were used to estimate agreement, bias and reliability of
method. The triangular (triad) method was used to calculate validity coefficients.
Results: 43 women, aged 19-49, took part in the validation of the 17-item FFQ. Median UI was 74
μg/L ( IQR 44) indicative of mild iodine insufficiency. The FFQ showed good agreement with food
diaries to classify iodine intake (82% of subjects to the same or adjacent quartile). The FFQ was
moderately correlated to the food diaries (rs=0.452, p=0.002) and to urinary excretion in μg/L
(rs=0.341, p=0.025) but not μg/day (p=0.316). The validity coefficients were 0.69, 0.66 and 0.52 for
the food diaries, FFQ, and urinary iodine excretion respectively.
Conclusion: The FFQ provides a rapid and reliable estimate of dietary iodine exposure to identify
population subgroups at risk of iodine deficiency.
Introduction
Iodine deficiency, which may be clinical or subclinical, is estimated to be responsible for impaired
neuro-development which causes a global reduction in IQ of 13.5 points (Bleichrodt and Born,
1994, Zimmermann and Andersson, 2012).
Following recent reports of widespread iodine insufficiency in Britain and other Europeans
countries, there has been renewed interest in assessing iodine intake, iodine status and thyroid
function in females of childbearing age. Iodine intake is crucial for the neurodevelopment of the
fetus and infant, and maternal iodine insufficiency has been linked to lower academic attainment in
children of the ALSPAC cohort (Bath et al., 2013). Iodine insufficiency results from low intake of
seafood and dairy, especially milk. Consumption of seafood is now generally low in the UK
population, (at 37g/day, (Department of Health and The Food Standards Agency, 2011), while milk
consumption has been steadily decreasing since 1975 (Elwood, 2005). Many young women avoid
these foods, for various reasons (Olsen, 2003). There is further concern that changes in
agricultural practices (withdrawal of fortified cattle feeds, and iodophore for sanitization) as well as
increased availability and consumption of organically farmed milk (lower in iodine) may affect
general status of the population (Flachowsky et al., 2013, Bath et al., 2012).
Following WHO/FAO guidelines, the iodine status of a population relies on measuring iodine
concentration in a spot urine sample, and relating the UIC outcome to established thresholds. A
median UIC above 100ug/L is the definition of a sufficient iodine status for the population (WHO-
UNICEF-ICCIDD, 2007). However, it is important to recognize that spot UIC does not provide a
valid representation of habitual iodine exposure of an individual. Indeed, most of the iodine (90%)
is excreted within a few hours of intake, and since iodine is extensively stored in the thyroid gland,
it can safely be consumed intermittently (Zimmermann, 2009, Zimmermann and Andersson, 2012).
There are only two validated food frequency questionnaires to assess iodine intake specifically,
one validated for Danish women (DanThyr study, women aged 25-30 and 60-65) (Rasmussen et
al., 2001) and the other for Australian older adults (men and women, aged 60-95) (Tan et al.,
2013). A separate questionnaire, focusing on iodine awareness and 24hours dietary recall of
iodine-rich foods was also published by Leung et al to assess iodine intake in American adults
(Leung AM, 2007). Meanwhile, the MoBa study FFQ was validated for iodine intake in Norwegian
mothers (Brantsaeter, 2009).
The present study was designed to develop and validate a practical survey tool to assess dietary
iodine exposure, using both a Food Frequency questionnaire specific to the main dietary source of
iodine in European diets, and a complete Food Diary.
Method
Subjects, samples and measurements
Healthy females were recruited to the study by local advertisement. Inclusion criteria were age
between 18 and 50 years, English speaking. Exclusion criteria were known thyroid disease, any
other active disease, pregnancy, lactation. A local institutional ethics committee approved the
protocol and all participants provided written informed consent. Height was measured to the
nearest mm using a stadiometer (Seca 213; Seca, Birmingham), weight was measured to the
nearest 0.1kg using portable scales (Tanita B.V., Hoofddorp, The Netherlands) and and waist
circumference was measured to the nearest 0.1cm using non-elasticated tape (at the mid-point
between the lowest rib and iliac crest, after expiration).
Food frequency questionnaire
A food frequency questionnaire was developed, to assess the intake of iodine rich food over the
previous 6 months, using the Dietary Target Monitor questionnaire as a template(Lean et al.,
2003). Iodine-rich foods were grouped in eight categories, including milk, oil-rich fish, white sea
fish, other seafood, cheese (hard and soft), yoghurts, milk or cream-based puddings, and cheese-
based dishes. The milk category was broken down in four sub-categories, to capture the frequency
of milk intake consumed with i) tea or coffee, ii) breakfast cereals, iii) in latte, cappuccinos, hot
chocolate or iv) just on its own. Specific examples were given for the oil-rich fish category, the
seafood category, the milk or cream-based puddings and the cheese-based dishes. Further
questions included information on consumption of organic milk (never, sometime, often, always),
and salt usage habits and salt brand. Frequency of consumption of goitrogenic foods was also
assessed alongside iodine-rich foods consumption (5 separate food categories) however, this does
not form part of this report.
Frequencies of intake were recorded per day, or per week, or per month, according to eight
categories, from less than once a month to more than 6 times per day. The Windiest 2005
database (Robert Gordon University, UK) was searched for all foods relevant to each category,
and average portion size and iodine content of a portion was derived. For each participant, total
number of servings per month for all eight food categories was calculated, and the daily estimated
iodine intake calculated.
Food diaries
Participants completed an inventory of all food and drink consumed, with semi-quantitative
estimation of portion sizes on two occasions for 4 days each with at least one week between each
recording. Each 4-day period included at least one weekend day. Food diaries were analysed with
the Windiet 2005 software to estimate average daily iodine intake.
Urine collection and iodine measurement
Two 24 hour urine collections were collected, on non-consecutive days. The first urine collection
occurred prior to the participant recording their diet on food diaries. The second urine collection
occurred on the fourth day of the food diary. The urine collections were kept in an opaque
container placed in a cool-bag, aliquoted and stored at -80C until analysis. Urinary iodine was
measured using a microplate adaptation of the Sandell-Kolthoff colorimetric method (Ohashi et al.,
2000). The CV% of the assay was 2% at 125ug/L, 2% at 62.5ug/L and 19% at 15.5ug/L. Samples
were analysed in triplicates, with all samples from the same participant analysed in the same
batch.
Statistics
Analyses were carried out in SPSS (v18 SPSS Inc., Chicago IL, USA). Normality was tested using
the Shapiro-Wilks test. Descriptive statistics were used to present the outcome variables, using
medians and inter-quartile ranges. The Wilcoxon signed rank test was used to test the differences
between the FFQ and the food diaries, and between the FFQ and urinary iodine. Relative
agreement between methods was measured using correlation coefficients and cross-classification.
The Spearman correlation coefficient was used to measure the agreement in ranking between the
FFQ and each of the two other tools (food diaries and urinary iodine). To compare the classification
of iodine intake according to FFQ, food diaries and urinary iodine, subjects were categorised into
defined quartiles. Proportions of subjects categorised in the same, adjacent or extreme quartile
were calculated. The Cohen’s kappa coefficient was calculated for agreement, using counts
allocated to either sufficient or insufficient categories. Subjects were categorised as having
sufficient or insufficient iodine intake according to the following threshold: 140μg/day for the FFQ
and the food diaries (Department of Health, 1991), and 100μg/L for urinary iodine. Specificity and
sensitivity of the FFQ as a tool to measure iodine sufficiency was calculated against food diaries
and urinary iodine as “gold-standard methods”. Finally, validity coefficients were calculated using
the Triad method (Ocke and Kaaks, 1997, Yokota et al., 2010), as implemented by others (Tan et
al., 2013, Brantsaeter, 2009, Rasmussen et al., 2001), using a R script to generate the bootstrap
sample used to obtain 95% CI (using Maximum Likelyhood Estimations which eliminate issues
relative to negative correlations and validity coefficients above one, as explained by Brantstaeter et
al. (2007).
Direction and magnitude of bias between FFQ and food diaries and FFQ and UI was assessed via
graphical representation using Bland Altman plots (Martin Bland and Altman, 1986).
Results
A total number of 43 adult female participants, aged 19 to 49, took part in the validation study, from
June to August 2012. Their median age was 27.0 (IQR 16.5), with a median weight of 60.6 kg and
BMI of 22.6 (IQR 4.8). All had resided in Britain for at least 1 year, and were mostly white British
(72%) or white Europeans (21%). Five participants reported smoking (average 5 cigarettes a day),
and eleven had been pregnant in the previous 10 years. Seven followed a vegetarian diet (6 lacto-
ovo-vegetarian and 1 lacto-vegetarian). None of the salt brand listed by participants included
iodine, and 19 participants reported never adding salt to food, with a further 22 only occasionally
adding it.
The questionnaire took between 3 and 5 minutes to complete. Fish and seafood contributed to only
12% (IQR35%) of the iodine intake measured with the FFQ, with milk contributing to half (47%) of
the iodine provided by all dairy products (88%, IQR 35%).Median daily iodine intake was estimated
at 110μg (IQR 69), using the FFQ μg and 103μg (IQR 64) with the food diaries (FD). These
estimates were not significantly different (p=0.726).
Iodine intake assessed by the FFQ was moderately correlated with the iodine intake assessed by
food diaries (rs=0.452, p<0.001).
The median urinary iodine output was 74ug/L (IQR 44), calculated as 107μg/24hours (IQR 56)
based on recorded urine volumes. Using the IOM equation (Institute of Medicine, 2001), this
equates to an iodine intake estimated at 104.3μg/day for a population with a median weight of
60kg.
While iodine intake measured by food diaries was correlated with iodine excretion (μg/day)
(rs=0.396, p=0.009), there was no such correlation between UI (μg/day) and FFQ (p=0.316). There
was however a significant correlation between FFQ and iodine excretion when expressed in ug/L
(rs=0.341, p=0.025).
Reliability of measures
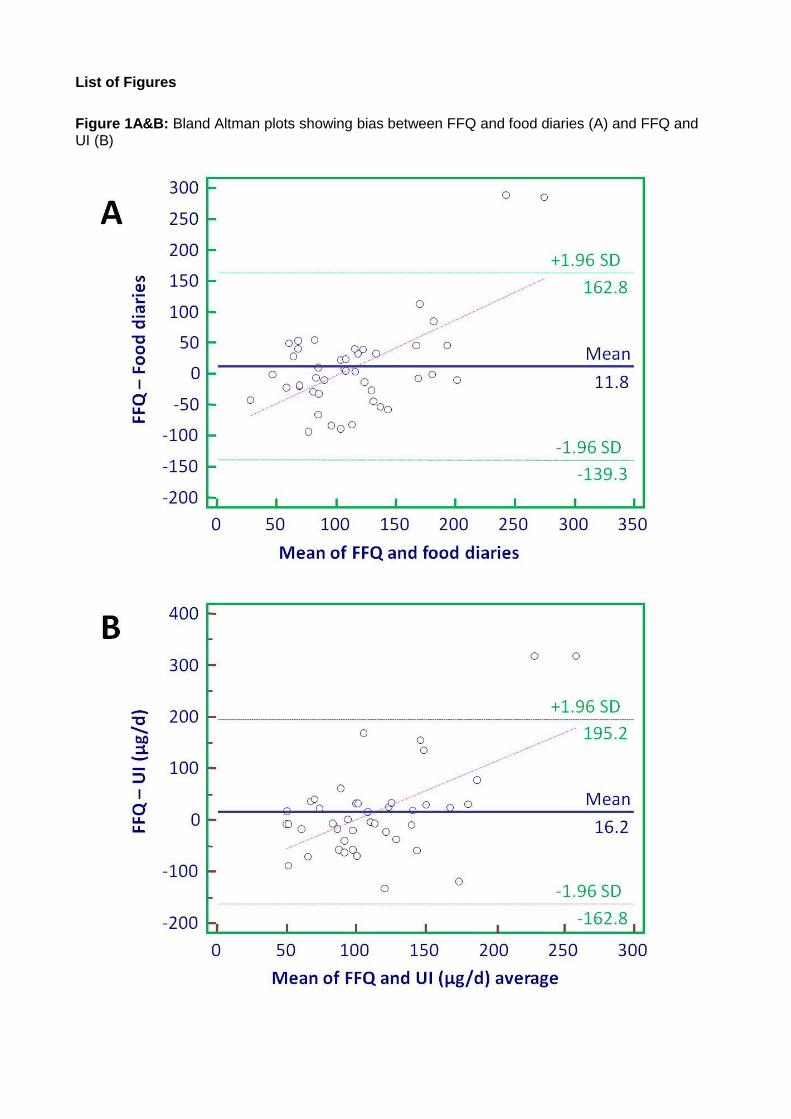
The biases between FFQ and food diaries, and FFQ and UI are relatively small (11.8 and 16.2,
respectively), as shown graphically using Bland Altman plots (Figure 1A&B), but with wide limits of
agreement (-139; 163, and -163; 195, respectively).
Comparing classification of individuals to quartiles of iodine intake, there was good agreement
between FFQ and food diaries, with 40% allocated to the same quartile, 42% to an adjacent
quartile, and only 5% misclassification (allocation to extreme quartiles).The cross-classification
agreement was not as good (but still acceptable) for FFQ and urinary iodine (μg/L), with 35% of
individuals allocated to the same quartile, 37% to adjacent quartile and no (0%) misclassification.
The Kappa statistic test between FFQ and food diaries estimation of iodine intake was 0.229,
indicative of fair agreement between the two methods. Using food diaries as the gold standard
measurement, with a threshold of 140μg/day to classify iodine intake as sufficient, the FFQ had a
specificity of 81% and a sensitivity of 42%.
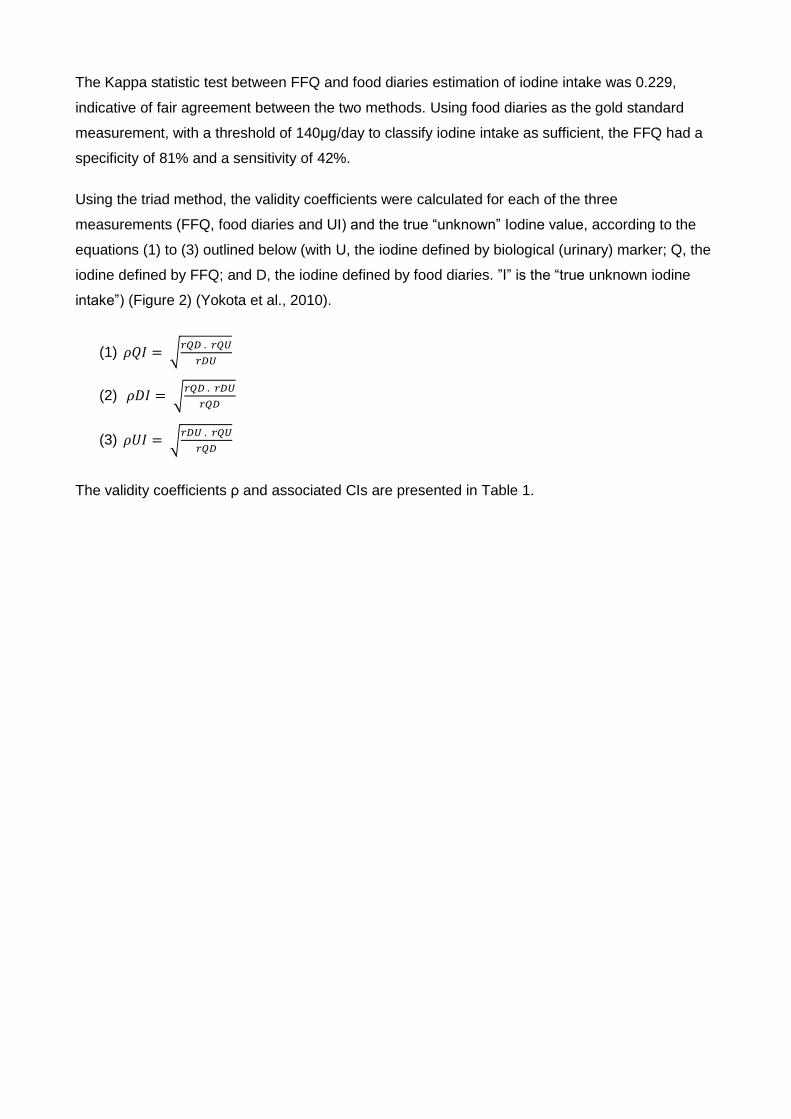
Using the triad method, the validity coefficients were calculated for each of the three
measurements (FFQ, food diaries and UI) and the true “unknown” Iodine value, according to the
equations (1) to (3) outlined below (with U, the iodine defined by biological (urinary) marker; Q, the
iodine defined by FFQ; and D, the iodine defined by food diaries. ”I” is the “true unknown iodine
intake”) (Figure 2) (Yokota et al., 2010).
(1)
(2)
(3)
The validity coefficients ρ and associated CIs are presented in Table 1.
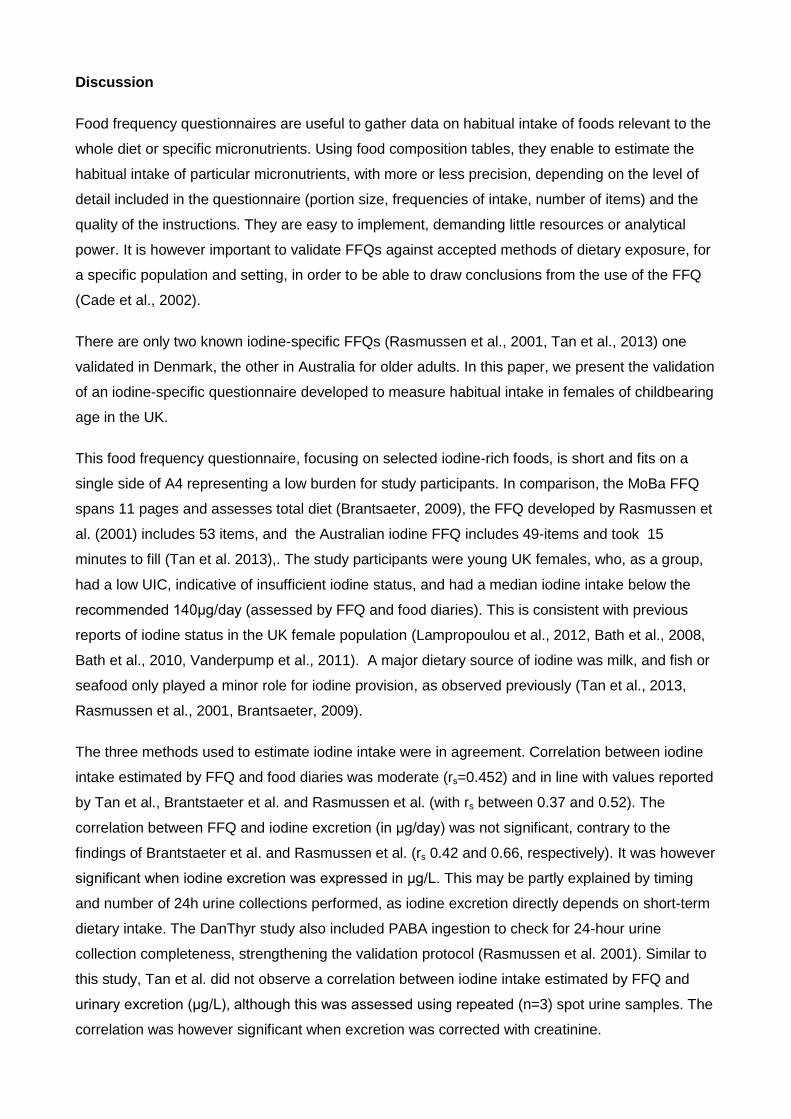
Discussion
Food frequency questionnaires are useful to gather data on habitual intake of foods relevant to the
whole diet or specific micronutrients. Using food composition tables, they enable to estimate the
habitual intake of particular micronutrients, with more or less precision, depending on the level of
detail included in the questionnaire (portion size, frequencies of intake, number of items) and the
quality of the instructions. They are easy to implement, demanding little resources or analytical
power. It is however important to validate FFQs against accepted methods of dietary exposure, for
a specific population and setting, in order to be able to draw conclusions from the use of the FFQ
(Cade et al., 2002).
There are only two known iodine-specific FFQs (Rasmussen et al., 2001, Tan et al., 2013) one
validated in Denmark, the other in Australia for older adults. In this paper, we present the validation
of an iodine-specific questionnaire developed to measure habitual intake in females of childbearing
age in the UK.
This food frequency questionnaire, focusing on selected iodine-rich foods, is short and fits on a
single side of A4 representing a low burden for study participants. In comparison, the MoBa FFQ
spans 11 pages and assesses total diet (Brantsaeter, 2009), the FFQ developed by Rasmussen et
al. (2001) includes 53 items, and the Australian iodine FFQ includes 49-items and took 15
minutes to fill (Tan et al. 2013),. The study participants were young UK females, who, as a group,
had a low UIC, indicative of insufficient iodine status, and had a median iodine intake below the
recommended 140μg/day (assessed by FFQ and food diaries). This is consistent with previous
reports of iodine status in the UK female population (Lampropoulou et al., 2012, Bath et al., 2008,
Bath et al., 2010, Vanderpump et al., 2011). A major dietary source of iodine was milk, and fish or
seafood only played a minor role for iodine provision, as observed previously (Tan et al., 2013,
Rasmussen et al., 2001, Brantsaeter, 2009).
The three methods used to estimate iodine intake were in agreement. Correlation between iodine
intake estimated by FFQ and food diaries was moderate (rs=0.452) and in line with values reported
by Tan et al., Brantstaeter et al. and Rasmussen et al. (with rs between 0.37 and 0.52). The
correlation between FFQ and iodine excretion (in μg/day) was not significant, contrary to the
findings of Brantstaeter et al. and Rasmussen et al. (rs 0.42 and 0.66, respectively). It was however
significant when iodine excretion was expressed in μg/L. This may be partly explained by timing
and number of 24h urine collections performed, as iodine excretion directly depends on short-term
dietary intake. The DanThyr study also included PABA ingestion to check for 24-hour urine
collection completeness, strengthening the validation protocol (Rasmussen et al. 2001). Similar to
this study, Tan et al. did not observe a correlation between iodine intake estimated by FFQ and
urinary excretion (μg/L), although this was assessed using repeated (n=3) spot urine samples. The
correlation was however significant when excretion was corrected with creatinine.
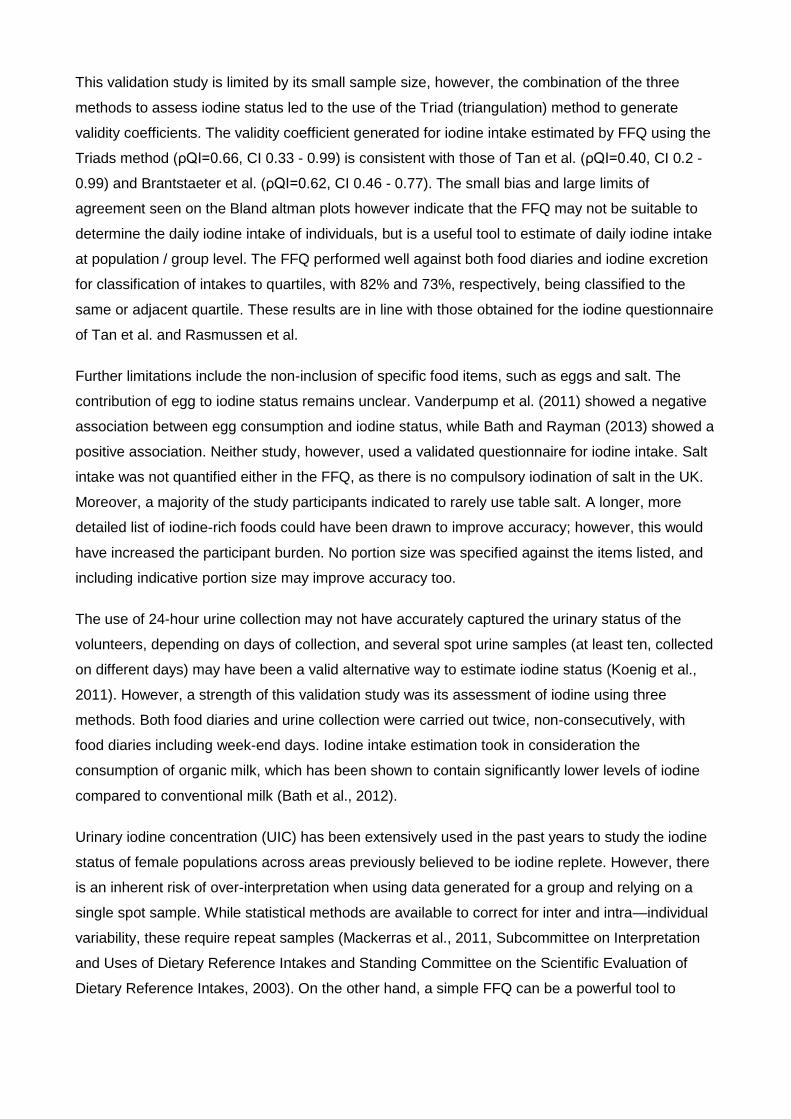
This validation study is limited by its small sample size, however, the combination of the three
methods to assess iodine status led to the use of the Triad (triangulation) method to generate
validity coefficients. The validity coefficient generated for iodine intake estimated by FFQ using the
Triads method (ρQI=0.66, CI 0.33 - 0.99) is consistent with those of Tan et al. (ρQI=0.40, CI 0.2 -
0.99) and Brantstaeter et al. (ρQI=0.62, CI 0.46 - 0.77). The small bias and large limits of
agreement seen on the Bland altman plots however indicate that the FFQ may not be suitable to
determine the daily iodine intake of individuals, but is a useful tool to estimate of daily iodine intake
at population / group level. The FFQ performed well against both food diaries and iodine excretion
for classification of intakes to quartiles, with 82% and 73%, respectively, being classified to the
same or adjacent quartile. These results are in line with those obtained for the iodine questionnaire
of Tan et al. and Rasmussen et al.
Further limitations include the non-inclusion of specific food items, such as eggs and salt. The
contribution of egg to iodine status remains unclear. Vanderpump et al. (2011) showed a negative
association between egg consumption and iodine status, while Bath and Rayman (2013) showed a
positive association. Neither study, however, used a validated questionnaire for iodine intake. Salt
intake was not quantified either in the FFQ, as there is no compulsory iodination of salt in the UK.
Moreover, a majority of the study participants indicated to rarely use table salt. A longer, more
detailed list of iodine-rich foods could have been drawn to improve accuracy; however, this would
have increased the participant burden. No portion size was specified against the items listed, and
including indicative portion size may improve accuracy too.
The use of 24-hour urine collection may not have accurately captured the urinary status of the
volunteers, depending on days of collection, and several spot urine samples (at least ten, collected
on different days) may have been a valid alternative way to estimate iodine status (Koenig et al.,
2011). However, a strength of this validation study was its assessment of iodine using three
methods. Both food diaries and urine collection were carried out twice, non-consecutively, with
food diaries including week-end days. Iodine intake estimation took in consideration the
consumption of organic milk, which has been shown to contain significantly lower levels of iodine
compared to conventional milk (Bath et al., 2012).
Urinary iodine concentration (UIC) has been extensively used in the past years to study the iodine
status of female populations across areas previously believed to be iodine replete. However, there
is an inherent risk of over-interpretation when using data generated for a group and relying on a
single spot sample. While statistical methods are available to correct for inter and intra—individual
variability, these require repeat samples (Mackerras et al., 2011, Subcommittee on Interpretation
and Uses of Dietary Reference Intakes and Standing Committee on the Scientific Evaluation of
Dietary Reference Intakes, 2003). On the other hand, a simple FFQ can be a powerful tool to
estimate habitual iodine intake, over a longer period than can be assessed using UIC or food
diaries, and to classify individuals according to their intake.
This FFQ is a useful tool relying on a succinct list of iodine rich-foods. Its restricted number of food
item did not translate in compromised performance compared to longer questionnaires. This is
particularly advantageous for large population studies which require a rapid method to estimate
habitual dietary intake.
Acknowledgements: The authors acknowledge funding from the Yorkhill Children’s Foundation,
and would like to thank Ms Frances Cousin for her assistance with the laboratory analyses. The
authors have no conflict of interest to declare.
Bath, S., Walter, A., Taylor, A. & Rayman, M. (2008) Iodine status of UK women of childbearing
age. Journal of Human Nutrition and Dietetics, 21, 379-380.
Bath, S., Wright, J., Taylor, A., Walter, A. & Rayman, M. (2010) Iodine deficiency in pregnant
women living in the South-East of the UK. Proceedings of the Nutrition Society, 69.
Bath, S. C., Button, S. & Rayman, M. P. (2012) Iodine concentration of organic and conventional
milk: implications for iodine intake. British Journal of Nutrition, 107, 935-940.
Bath, S. C. & Rayman, M. P. (2013) Iodine deficiency in the UK: an overlooked cause of impaired
neurodevelopment? Proceedings of the Nutrition Society, 72, 226-235.
Bath, S. C., Steer, C. D., Golding, J., Emmett, P. & Rayman, M. P. (2013) Effect of inadequate
iodine status in UK pregnant women on cognitive outcomes in their children: results from
the Avon Longitudinal Study of Parents and Children (ALSPAC). The Lancet.
Bleichrodt, N. & Born, M. P. (1994) A metaanalysis of research on iodine and its relationship to
cognitive development. Damaged Brain of Iodine Deficiency: Cognitive - Behavioral -
Neuromotor - Educative Aspects, 195-200.
Brantsaeter, A., Haugen, M., Julshamn, K., Alexander, J., Meltzer, H. (2009) Evaluation of urinary
iodine excretion as a biomarker for intake of milk and dairy products in pregnant women in
the Norwegian Mother and Child Cohort Study (MoBa). European Journal of Clinical
Nutrition, 633, 347-354.
Brantsaeter, A. L., Haugen, M., Rasmussen, S. E., Alexander, J., Samuelsen, S. O. & Meltzer, H.
M. (2007) Urine flavonoids and plasma carotenoids in the validation of fruit, vegetable and
tea intake during pregnancy in the Norwegian Mother and Child Cohort Study (MoBa).
Public Health Nutrition, 10, 838-847.
Cade, J., Thompson, R., Burley, V. & Warm, D. (2002) Development, validation and utilisation of
food-frequency questionnaires-a review. Public Health Nutrition, 5, 567-588.
Department of Health (1991) COMA Report: Dietary Reference Values for Food, Energy and
Nutrients for the UK. HMSO London.
Department of Health and the Food Standards Agency ( 2011) National Diet and Nutrition Survey
Headline results from Years 1 and 2 (combined) of the Rolling Programme (2008/2009 –
2009/10). IN Beverley Bates, B., Lennox, A., Bates, C. & Swan, G. (Eds.).
Elwood, P. C. (2005) Time to value milk. International journal of epidemiology, 34, 1160-1162.
Flachowsky, G., Franke, K., Meyer, U., Leiterer, M. & Schöne, F. (2013) Influencing factors on
iodine content of cow milk. European Journal of Nutrition, 1-15.
Institute of Medicine (2001) Food and Nutrition Board. Dietary Reference Intakes for Vitamin A,
Vitamin K, Arsenic, Boron, Chromium, Copper, Iodine, Iron, Manganese, Molybdenum,
Nickel, Silicon, Vanadium and Zinc. National Academy Press Washington, DC.
Koenig, F., Andersson, M., Hotz, K., Aeberli, I. & Zimmermann, M. B. (2011) Ten Repeat
Collections for Urinary Iodine from Spot Samples or 24-Hour Samples Are Needed to
Reliably Estimate Individual Iodine Status in Women. Journal of Nutrition, 141, 2049-54.
Lampropoulou, M., Lean, M. & Combet, E. (2012) Iodine status of women of childbearing age in
Scotland. Proceedings of the Nutrition Society, 71.
Lean, M., Anderson, A., Morrison, C. & Currall, J. (2003) Evaluation of a Dietary Target Monitor.
European Journal of Clinical Nutrition, 57, 667-673.
Leung Am, B. L., Pearce En (2007) A dietary iodine questionnaire: correlation with urinary iodine
and food diaries. Thyroid, 17, 755-762.
Mackerras, D. E. M., Singh, G. R. & Eastman, C. J. (2011) Iodine status of Aboriginal teenagers in
the Darwin region before mandatory iodine fortification of bread. Medical Journal of
Australia, 194, 126-130.
Martin Bland, J. & Altman, D. (1986) Statistical methods for assessing agreement between two
methods of clinical measurement. The Lancet, 327, 307-310.
Ocke, M. & Kaaks, R. J. (1997) Biochemical markers as additional measurements in dietary
validity studies: application of the method of triads with examples from the European
Prospective Investigation into Cancer and Nutrition. The American journal of clinical
nutrition, 65, 1240S-1245S.
Ohashi, T., Yamaki, M., Pandav, C. S., Karmarkar, M. G. & Irie, M. (2000) Simple microplate
method for determination of urinary iodine. Clinical Chemistry, 46, 529-536.
Olsen, S. O. (2003) Understanding the relationship between age and seafood consumption: the
mediating role of attitude, health involvement and convenience. Food Quality and
Preference, 14, 199-209.
Rasmussen, L. B., Ovesen, L., Bulow, I., Jorgensen, T., Knudsen, N., Laurberg, P. & Perrild, H.
(2001) Evaluation of a semi-quantitative food frequency questionnaire to estimate iodine
intake. European Journal of Clinical Nutrition, 55, 287-292.
Subcommittee on Interpretation and Uses of Dietary Reference Intakes & Standing Committee on
the Scientific Evaluation of Dietary Reference Intakes (2003) Appendix E - Adjustment of
Observed Intake Data to Estimate the Distribution of Usual Intakes in a Group. Dietary
Reference Intakes: Applications in Dietary Planning. Washington, DC, National Academies
Press.
Tan, L.-M., Charlton, K. E., Tan, S.-Y., Ma, G. & Batterham, M. (2013) Validity and
reproducibility of an iodine-specific food frequency questionnaire to estimate dietary iodine
intake in older Australians. Nutrition & Dietetics, 70, 71-78.
Vanderpump, M. P., Lazarus, J. H., Smyth, P. P., Laurberg, P., Holder, R. L., Boelaert, K. &
Franklyn, J. A. (2011) Iodine status of UK schoolgirls: a cross-sectional survey. The Lancet,
377, 2007-2012.
Who-Unicef-Iccidd (2007) Assessment of iodine deficiency disorders and monitoring their
elimination: A guide for programme managers. . 3rd
edition ed. Geneva.
Yokota, R. T. D. C., Miyazaki, E. S. & Ito, M. K. (2010) Applying the triads method in the
validation of dietary intake using biomarkers. Cadernos de Saúde Pública, 26, 2027-2037.
Zimmermann, M. B. (2009) Iodine deficiency in pregnancy and the effects of maternal iodine
supplementation on the offspring: a review. American Journal of Clinical Nutrition, 89,
668S-672S.
Zimmermann, M. B. & Andersson, M. (2012) Assessment of iodine nutrition in populations: past,
present, and future. Nutrition Reviews, 70, 553-70.
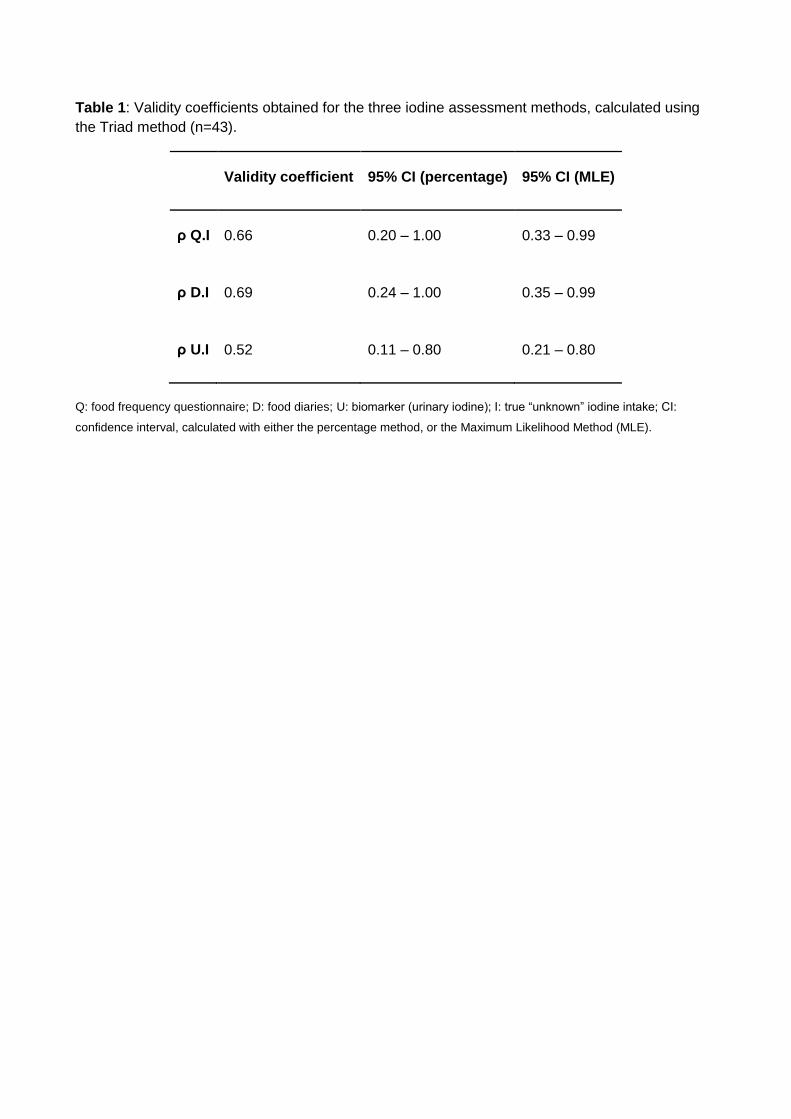
Table 1: Validity coefficients obtained for the three iodine assessment methods, calculated using
the Triad method (n=43).
Validity coefficient 95% CI (percentage) 95% CI (MLE)
ρ Q.I 0.66 0.20 – 1.00 0.33 – 0.99
ρ D.I 0.69 0.24 – 1.00 0.35 – 0.99
ρ U.I 0.52 0.11 – 0.80 0.21 – 0.80
Q: food frequency questionnaire; D: food diaries; U: biomarker (urinary iodine); I: true “unknown” iodine intake; CI:
confidence interval, calculated with either the percentage method, or the Maximum Likelihood Method (MLE).
List of Figures
Figure 1A&B: Bland Altman plots showing bias between FFQ and food diaries (A) and FFQ and UI (B)
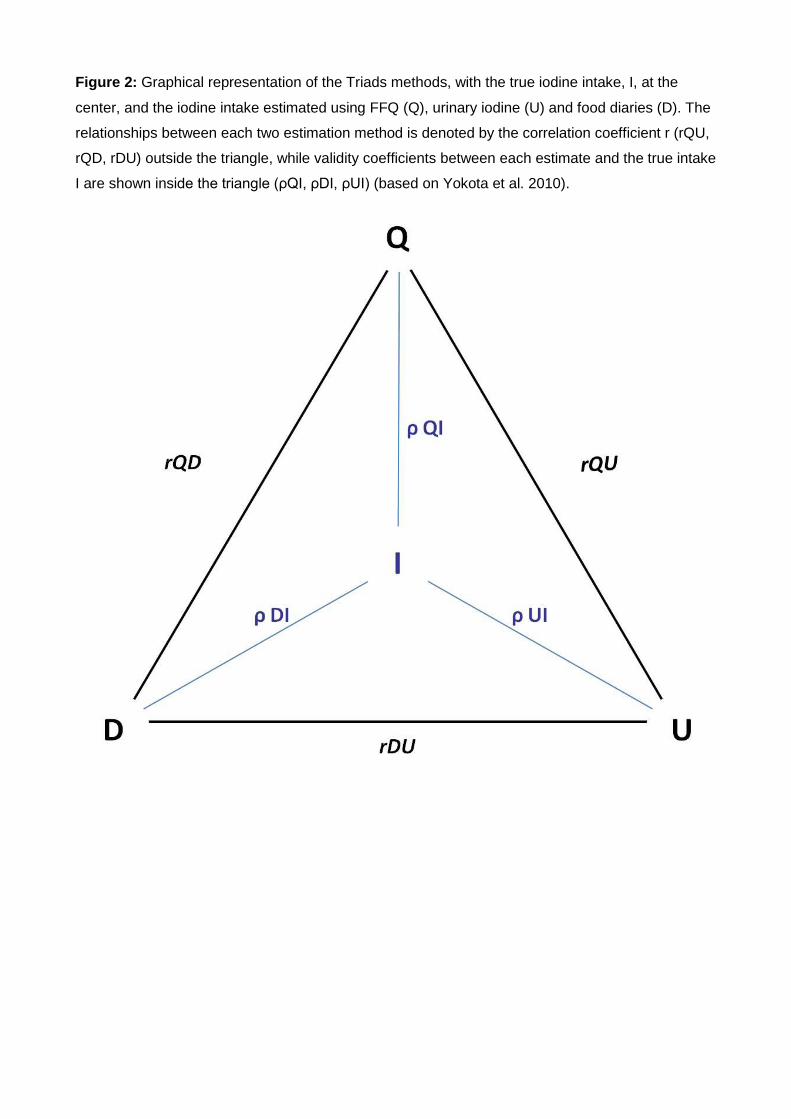
Figure 2: Graphical representation of the Triads methods, with the true iodine intake, I, at the
center, and the iodine intake estimated using FFQ (Q), urinary iodine (U) and food diaries (D). The
relationships between each two estimation method is denoted by the correlation coefficient r (rQU,
rQD, rDU) outside the triangle, while validity coefficients between each estimate and the true intake
I are shown inside the triangle (ρQI, ρDI, ρUI) (based on Yokota et al. 2010).