lean performance appraisals - capital quality and … key city! staff and! leaders in! ... (lead...
TRANSCRIPT
CQI Learning Lunch
Lean Performance Appraisals - Eliminating the Waste
Host - Dennis Sergent 517-285-5500
September 29th, 2011 10:30 AM to 2:00 PM
University Club of Michigan State
3435 Forest Road, Lansing, MI 48909 517-353-5111
Dennis Sergent 517-381-5330 - Page 2 05/02-2011
Sponsoring Organiza-ons

Dennis Sergent 517-381-5330 - Page 3 05/02-2011
Today’s Process • A Short Review
– Opera7ng Defini7ons – Process Mapping & Lean Fundamentals – Consensus
• Table Discussions – S7cky Notes to Define
• What adds value to both the persons and the organiza7on they are part of?
• What happens in sequence? • What are the choices or decision points?
• We are not going to try to argue the common sense of doing performance appraisals or not – We will gain your insight to what adds value
• And what doesn’t

09-‐15-‐11 Copyright © 2011 Sergent Results Group -‐ All Rights Reserved
4
Learning Lunch Process Map Lean Performance Appraisal
Discuss @ Tables Review Slides 4,
11,12, 3
10:45 AM – 11:30 AM
GROUP REVIEW
Get Lunch & Return
GROUP DISCUSSION
Review As Group Definitions, Process
Mapping, Lean Fundamentals
10:30 AM – 10:45 AM
Operating Definitions & Guidelines
Sticky Note Process Design
What adds value to person and organization?
Document on Sticky Notes
Document & Lunch @ Tables
11:30 AM – 12:00 PM
Lunch, Sort Notes @ Tables Group “Same”, Eliminate
Duplicates, Clarify, Sequence, Define Choices
12:00 PM – 1:00PM
Continue Lunch & Document
On Sticky Notes
Sort Sticky Notes
Review As Group Each Table Reports What Adds Value, What Does Not?
1:00 PM – 2:00 PM
Define Sequence
Define Choices Or Decision
Points
What Adds Value And
What Does Not?
Dennis Sergent 517-381-5330 - Page 5 05/02-2011
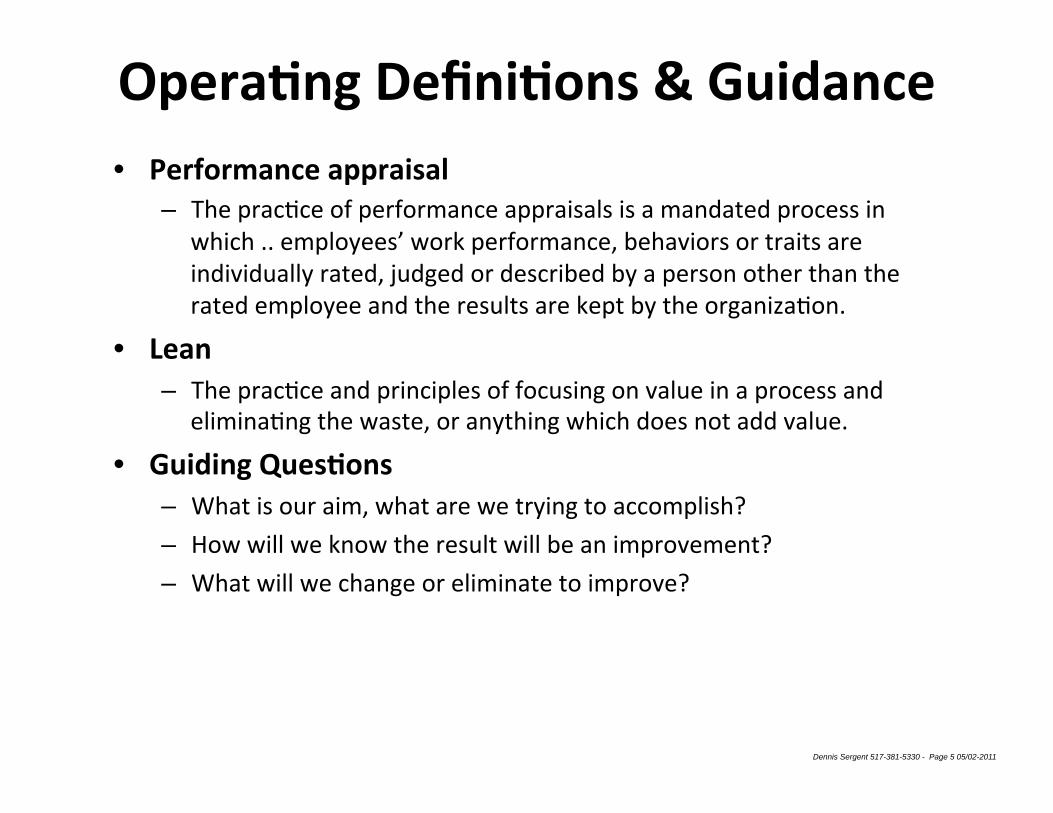
Opera7ng Defini7ons & Guidance • Performance appraisal
– The prac-ce of performance appraisals is a mandated process in which .. employees’ work performance, behaviors or traits are individually rated, judged or described by a person other than the rated employee and the results are kept by the organiza-on.
• Lean – The prac-ce and principles of focusing on value in a process and
elimina-ng the waste, or anything which does not add value.
• Guiding Ques7ons – What is our aim, what are we trying to accomplish? – How will we know the result will be an improvement? – What will we change or eliminate to improve?

10/7/11 Sergent Results Group 517-‐381-‐5330 6
What is Value? Defini7on: A capability provided to a customer at the right 7me at an appropriate price, as defined in
every case by the customer. Examples: • You hear a dial tone when you pick up your telephone • Your call is connected to and answered by the pizza shop • A pizza is delivered hot to your office when promised • The pizza has the right ingredients and enough of them • It tastes good • When it is eaten, you are le[ with a biodegradable, recyclable box • You feel sa-sfied that it was worth the cost • You recognize that you couldn’t have made it faster, cheaper or be^er • You watched your favorite show on TV while the pizza was made
Key Point • As Defined By YOU, The CUSTOMER

10/7/11 Sergent Results Group 517-‐381-‐5330 7
What Is Waste? -‐ Everything That is Not Value! 1. Defects, errors, returns
• Missing informa-on, change orders, design flaws, • Absenteeism, high employee turnover
2. Overproduc7on of things not demanded by actual customers • Printed paperwork that changes before it is needed • Processed orders before they are needed • Processing without customer demand
3. Inventories wai7ng for further processing or use • Purchasing or making things before they are needed • Things wai-ng in the “inbox”, unread mail, batch processing
4. Unnecessary over-‐processing • Relying on inspec-ons rather than designing the process to eliminate them • Reentering data in mul-ple systems, extra copies, unused reports • Complex processes
5. Unnecessary mo7on of people • Searching for people, tools & materials • Walking to offices, copier, carpool, central filing
6. Unnecessary transport and handling of goods • Paperwork handoffs, electronic data handoffs, approvals, excessive e-‐mails, copies and a^achments • Sending e-‐mails or le^ers to people who do not need to know
7. People wai7ng • Slow computer speed, down-me, awai-ng approvals, no answer to phone calls, emails, le^ers • Clarifica-on or correc-on of work from supplier or upstream process to deliver • Wai-ng for machine to finish processing, or for suppor-ng func-ons to be done, • Wai-ng for interrupted work and team members to resume
10/7/11 Sergent Results Group 517-‐381-‐5330 8
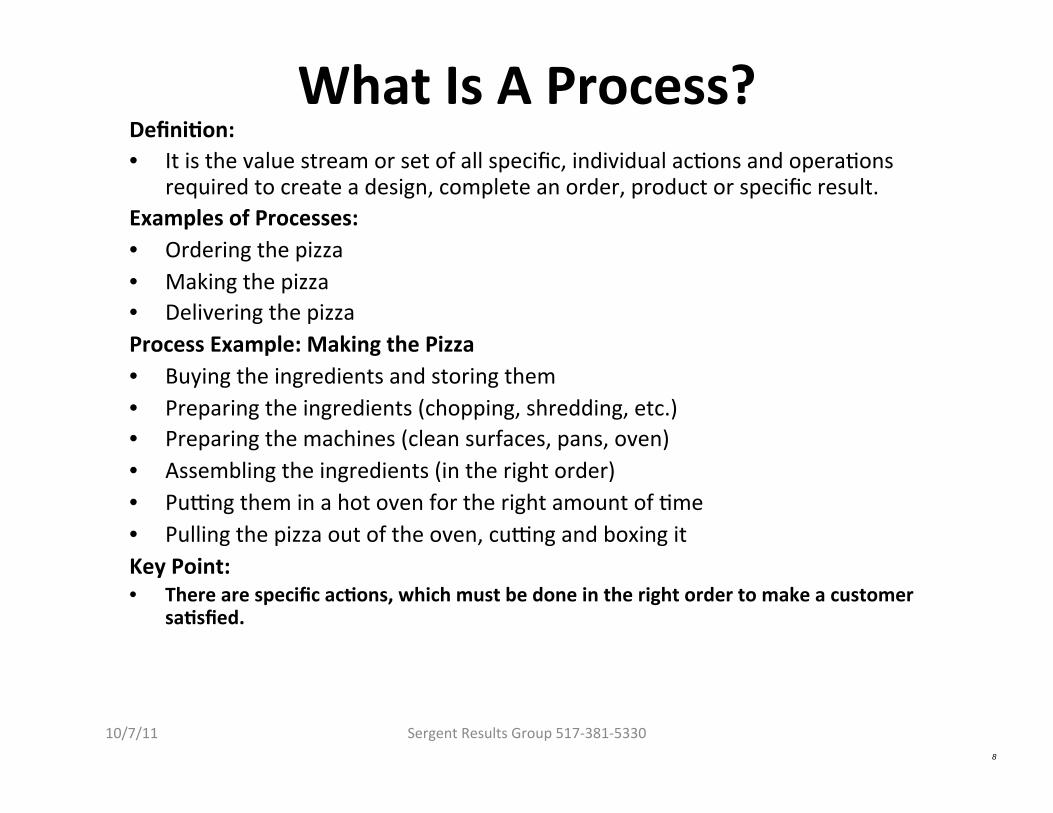
What Is A Process? Defini7on: • It is the value stream or set of all specific, individual ac-ons and opera-ons
required to create a design, complete an order, product or specific result. Examples of Processes: • Ordering the pizza • Making the pizza • Delivering the pizza Process Example: Making the Pizza • Buying the ingredients and storing them • Preparing the ingredients (chopping, shredding, etc.) • Preparing the machines (clean surfaces, pans, oven) • Assembling the ingredients (in the right order) • Puhng them in a hot oven for the right amount of -me • Pulling the pizza out of the oven, cuhng and boxing it Key Point: • There are specific ac7ons, which must be done in the right order to make a customer
sa7sfied.

10/7/11 Sergent Results Group 517-‐381-‐5330 9
Process Mapping Fundamentals Macro Level -‐ SIPOC (Supplier-‐Inputs-‐Process-‐Outputs-‐Customer)
• VERB -‐ NOUN CONSTRUCTION (Make Pizza) Micro Level
SUPPLIER
INPUTS
CUSTOMER
OUTPUTS
PROCESS NAME
• Specific Step 1 • Specific Step 2 • Specific Step 3 • etc
IMPLEMENT CHANGE���
MANAGEMENT PLAN
DEVELOP BALANCED
SCORECARD
IDENTIFY CHANGE
CHAMPIONS
DEVELOP CHANGE MANAGEMENT
PROCESS AND IMPLEMENT
TRAIN KEY CITY STAFF AND
LEADERS IN CHANGE
MANAGEMENT
DEVELOP CHANGE
MANAGEMENT PLAN LINKED
TO ERP DETERMINE &
REPORT IMPACT ON EMPLOYEES
COMPLETE TRANSITION MODIFY
PLAN AS NEEDED

System (Process) Map
Feed Forward From Supplier
Feedback To Supplier Feedback From Customer
Feed Forward To Customer
INPUT FROM SUPPLIERS External or Internal
OUTPUT TO CUSTOMER External or Internal
PROCESS Core = Profit / Support = Cost
What - Requirements, Results & Gaps How - Measured Where - Action Is Taken Why - Relevant To Value Added When - It Is Done Process Defined in Verb - Noun Structure
Who - Requirements - Results - Gaps Who - Requirements - Results - Gaps
PROCESSES SHOULD BE: • Stable • Predictable • Acceptable • Repeatable • Reproducible
REQUIREMENTS (METRICS) SHOULD BE: • SPECIFIC (What) • MEASURABLE (How) • ACTIONABLE (Where) • RELEVANT (Why) • TIMELY (When)
WHO STAKEHOLDERS ARE: • SUPPLIERS - Other Stakeholders • OWNERS - Other Stakeholders • EMPLOYEES - Other Stakeholders • CUSTOMERS = CORE STAKEHOLDERS • COMMUNITY - Other Stakeholders • REGULATORS - Other Stakeholder
METRICS (MEASUREMENTS) ARE: • DIAGNOSTIC (Lead Indicators) • PERFORMANCE (Lag Indicators) • DESIRED RESULTS
VALUE ADDED LOOPS • Information • Products • Services • Influence
VALUE ADDED LOOPS • Information • Products • Services • Influence
VALUE IN METRICS and GAPS ARE: • COST (Objective) • SPEED or TIMELINESS (Objective) • QUALITY (Can Be Objective or Subjective) • SERVICE (Subjective)
VALUE ADDED LOOPS • Information • Products • Services • Influence
VALUE ADDED LOOPS • Information • Products • Services • Influence
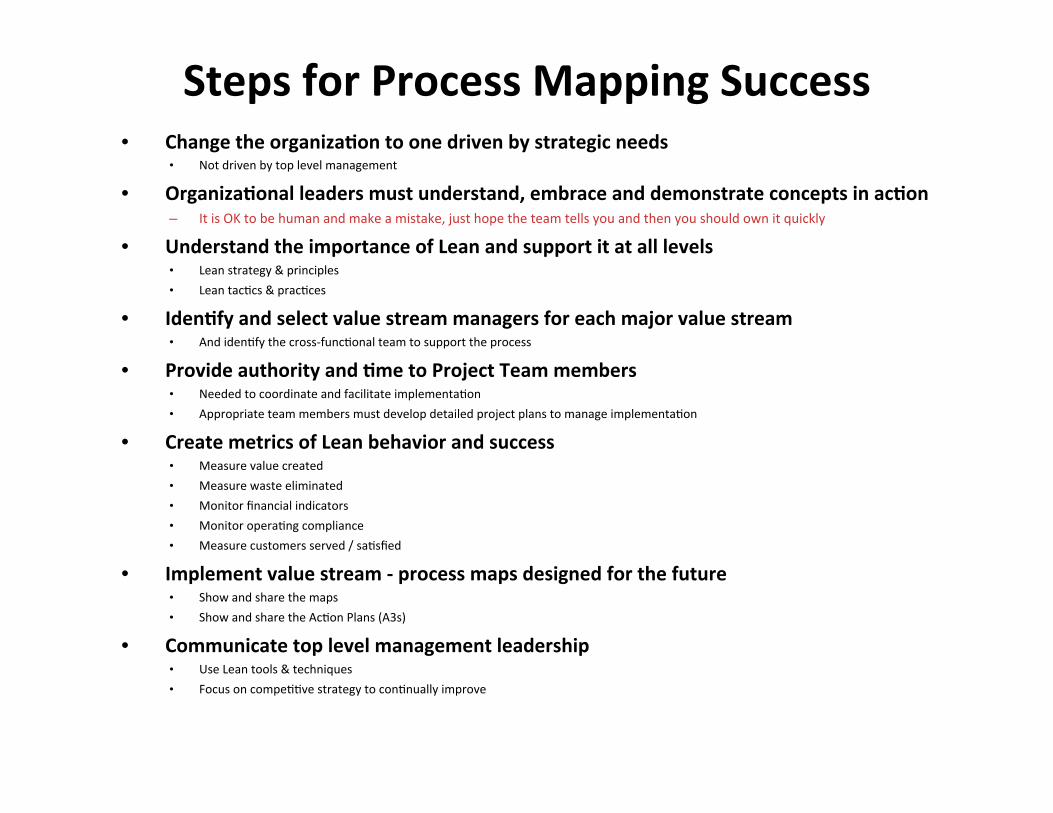
Steps for Process Mapping Success • Change the organiza7on to one driven by strategic needs
• Not driven by top level management
• Organiza7onal leaders must understand, embrace and demonstrate concepts in ac7on – It is OK to be human and make a mistake, just hope the team tells you and then you should own it quickly
• Understand the importance of Lean and support it at all levels • Lean strategy & principles • Lean tac-cs & prac-ces
• Iden7fy and select value stream managers for each major value stream • And iden-fy the cross-‐func-onal team to support the process
• Provide authority and 7me to Project Team members • Needed to coordinate and facilitate implementa-on • Appropriate team members must develop detailed project plans to manage implementa-on
• Create metrics of Lean behavior and success • Measure value created • Measure waste eliminated • Monitor financial indicators • Monitor opera-ng compliance • Measure customers served / sa-sfied
• Implement value stream -‐ process maps designed for the future • Show and share the maps • Show and share the Ac-on Plans (A3s)
• Communicate top level management leadership • Use Lean tools & techniques • Focus on compe--ve strategy to con-nually improve
10/7/11 Sergent Results Group 517-‐381-‐5330 12
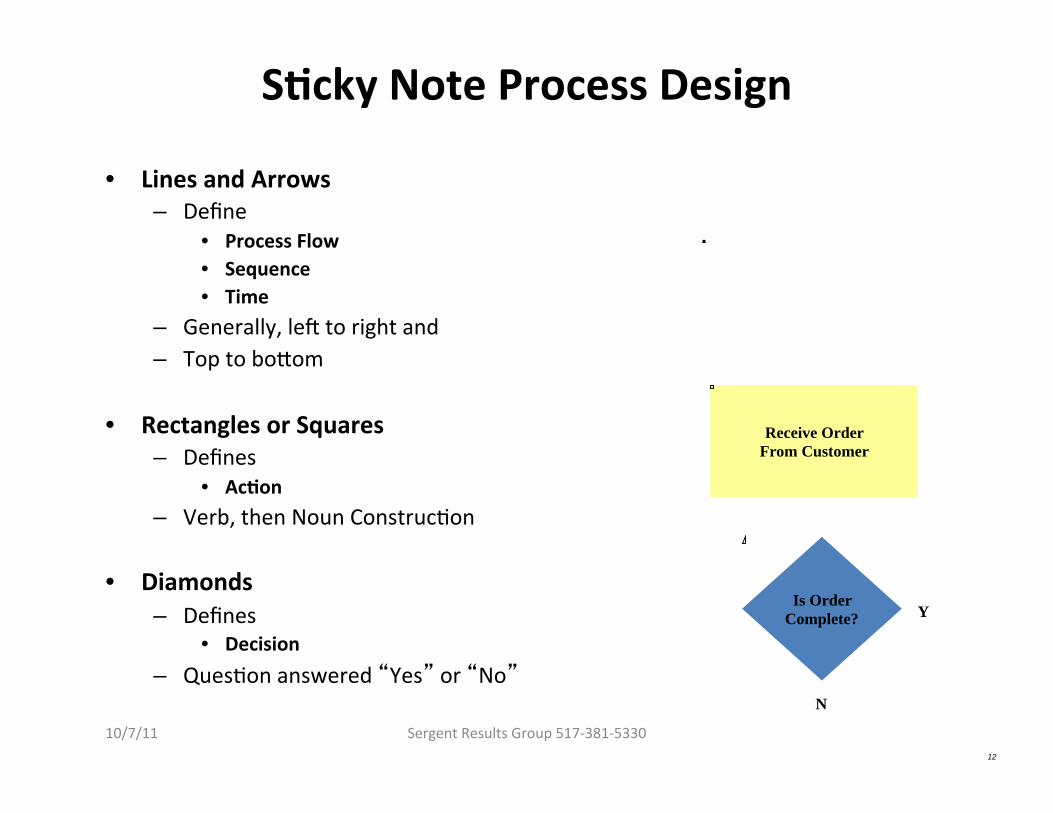
S7cky Note Process Design
• Lines and Arrows – Define
• Process Flow • Sequence • Time
– Generally, le[ to right and – Top to bo^om
• Rectangles or Squares – Defines
• Ac7on – Verb, then Noun Construc-on
• Diamonds – Defines
• Decision – Ques-on answered “Yes” or “No”
Receive Order From Customer
Is Order Complete? Y
N
10/7/11 Sergent Results Group 517-‐381-‐5330 13
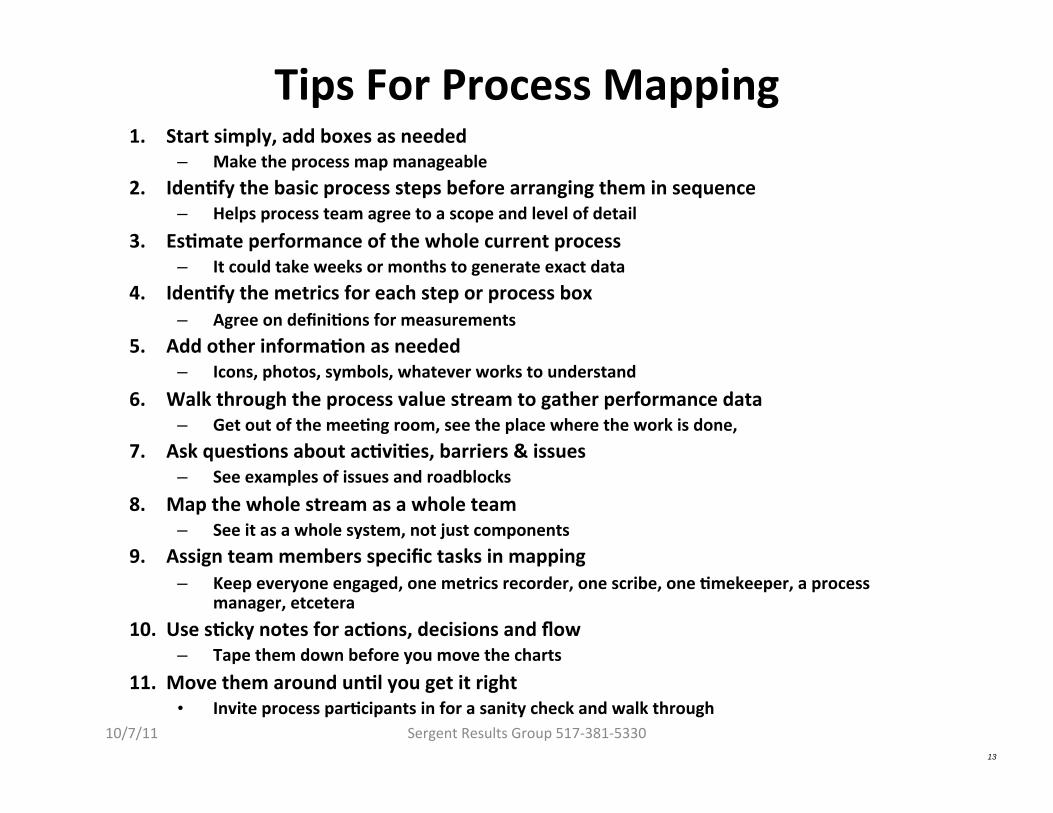
Tips For Process Mapping 1. Start simply, add boxes as needed
– Make the process map manageable 2. Iden7fy the basic process steps before arranging them in sequence
– Helps process team agree to a scope and level of detail 3. Es7mate performance of the whole current process
– It could take weeks or months to generate exact data 4. Iden7fy the metrics for each step or process box
– Agree on defini7ons for measurements 5. Add other informa7on as needed
– Icons, photos, symbols, whatever works to understand 6. Walk through the process value stream to gather performance data
– Get out of the mee7ng room, see the place where the work is done, 7. Ask ques7ons about ac7vi7es, barriers & issues
– See examples of issues and roadblocks 8. Map the whole stream as a whole team
– See it as a whole system, not just components 9. Assign team members specific tasks in mapping
– Keep everyone engaged, one metrics recorder, one scribe, one 7mekeeper, a process manager, etcetera
10. Use s7cky notes for ac7ons, decisions and flow – Tape them down before you move the charts
11. Move them around un7l you get it right • Invite process par7cipants in for a sanity check and walk through

10/7/11 Sergent Results Group 517-‐381-‐5330 14
Process & Value Metrics 1. Always include process 7me!
• Defined as: • The actual 7me it takes to complete an ac7vity or process when uninterrupted. • Can be determined by observa7on. • Varia7on expected within ranges.
2. Always include lead 7me! • Defined as:
• The elapsed 7me of an ac7vity from the 7me it arrives from the customer to the 7me it goes out to the next customer.
• Generally greater than process 7me because of queuing, wai7ng, interrup7ons, etc.
3. Do not try to use all of them! – Time -‐ process -me, lead -me, value added -me – Changeover -me – Typical batch prac-ces and sizes – Demand or pull rate – Percent complete or percent accurate – Reliability or defects per million (dpm) – Number of people (customers, staff, etc.) – Inventory – Technologies used – Availability, -me, percentage, hours, etc
4. Be careful how you measure and document your opera7onal defini7ons!
10/7/11 Sergent Results Group 517-‐381-‐5330 15
Iden7fy Cost, Value and Worth
• Costs of Waste
• Value of Correc7ng
• Costs of Correc7ve Ac7on
• Costs of Preven7ve Ac7on
• Worth of Correc7ng

Design Future Process State
• Ask Your Team Some Cri-cal Ques-ons -‐ • What does the customer really need?
• What is that worth?
• What does it cost?
• How o[en is performance checked?
• Which steps create value?
• Which steps generate waste?
• How can work flow when the customer needs it?
• How can work flow with fewer interrup-ons?
• How will work be controlled between interrup-ons?
• How will we balance workload?
• What process improvements are needed to achieve the future state?
• Then ask the rest of the team to visit or “walk through” your thinking about the current state
Define Improvement Opportunities Sort For Affinities Define Team’s
Process Priorities
Define Current States Of Value Streams
Determine Relationships
Define Project Team Members
Define Future States Of Value Streams
Define Work Plan and Implement It

Design Future Process State -‐ 2
• Document customer informa-on and needs • Understand who is the customer • Understand what they need • Understand what they supply to the process
• Iden-fy main processes and order of impact • Break down the main process into components • Inter-‐dependent, but “BITES” of the elephant
• Map the process value stream with s-ckies • Show the flow and the dependencies
• Select SMART “in-‐process” metrics of success • Show the measures of sub-‐process value & performance • Show the “DELTA” or difference
• Walk through the value stream • Discuss each step, ask the “why” ques-ons • Discuss the measures of value & performance • Confirm “Who” is customer, who performs each step as supplier • Confirm Inputs and Outputs
• Establish how the work is priori-zed • Within each process
• Determine systemic measures of success • Show the measures of value & performance for the WHOLE process • Lead -me versus process -me • Time, Cost, Service, Performance, Value • Communicate to whole team
Define Improvement Opportunities Sort For Affinities Define Team’s
Process Priorities
Define Current States Of Value Streams
Determine Relationships
Define Project Team Members
Define Future States Of Value Streams
Define Work Plan and Implement It
10/7/11 Sergent Results Group 517-‐381-‐5330 18
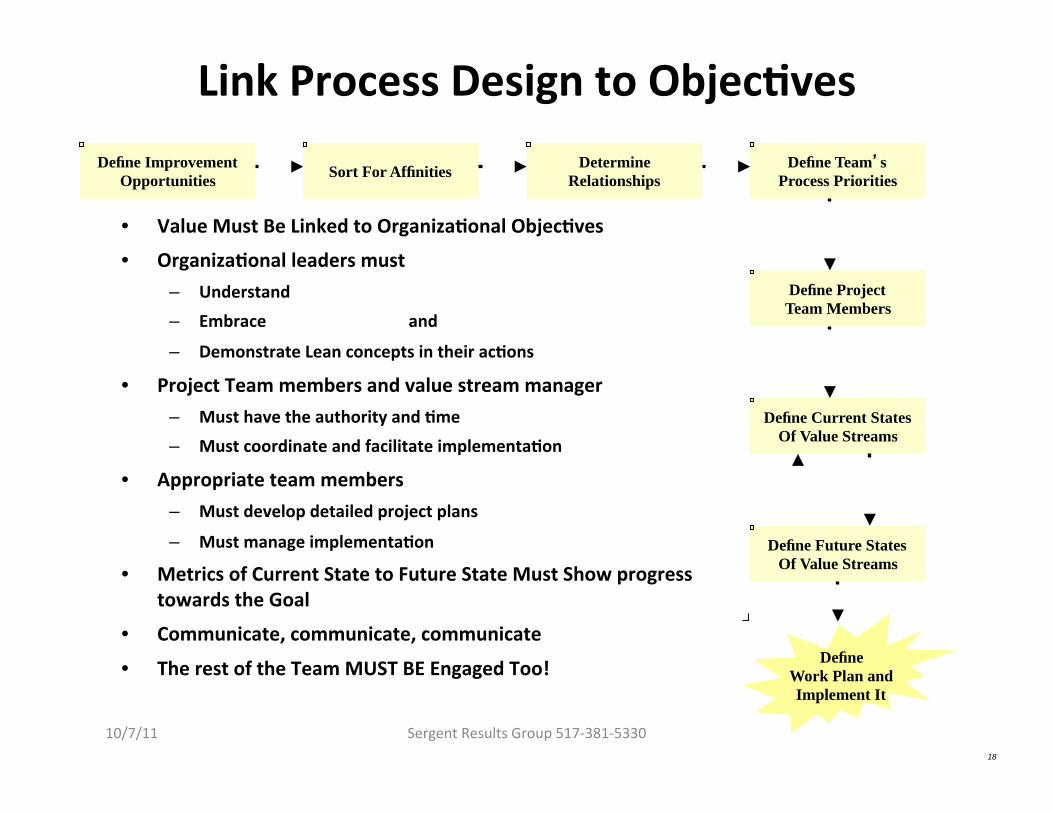
Link Process Design to Objec7ves
• Value Must Be Linked to Organiza7onal Objec7ves
• Organiza7onal leaders must – Understand – Embrace and
– Demonstrate Lean concepts in their ac7ons
• Project Team members and value stream manager – Must have the authority and 7me – Must coordinate and facilitate implementa7on
• Appropriate team members – Must develop detailed project plans
– Must manage implementa7on
• Metrics of Current State to Future State Must Show progress towards the Goal
• Communicate, communicate, communicate
• The rest of the Team MUST BE Engaged Too!
Define Improvement Opportunities Sort For Affinities Define Team’s
Process Priorities
Define Current States Of Value Streams
Determine Relationships
Define Project Team Members
Define Future States Of Value Streams
Define Work Plan and Implement It

Consensus -‐ An Opera7ng Defini7on Consensus is a general agreement among all team members who support the same decision.
• It means all team members can and will support the decision without compromising important values of the team or members.
• Consensus does not mean the decision is perfect or that everyone agrees to the same extent, it only means we have found a defini-on of unity which we can move forward with un-l we can improve it at a later date.
Table Team-‐ Value Streams
4 Tables
3.5 Hours
4 Value Stream Maps

To provide meaningful feedback for the individual to perform effec-vely in the organiza-on
Determine standard for measurement
Clarify expecta-ons and set goals
Effec-ve coaching/training for giving, receiving and implemen-ng feedback
Understanding varia-on –normal varia-on in people and process
Develop flexibility in implemen-ng 4 -mes a year ( less or more)
Need sooner
Need Later
Specific recogni-on and apprecia-on of individual
Provide tools to help improve
Posi-ve feedback tells the employee they are important
People walk away with a posi-ve experience
Evaluate process

HR no-fies manager review is due
Manager schedules mee-ng with employee
Review wri^en Mgr./emp. meet refer budget
Is raise within planned budget? YES
NO
Signed forms to HRD
Review and salary forms and memo sent to VP
Forms back from VP Emp. and Mgr. meet and sign forms a[er review
Signed forms to HRD
Review mtg. scheduled for emp. by mgr Forms back
from HRD Salary/raise determined
Mgr. and emp. meet for “pre-‐review” to discuss p.a
Removed
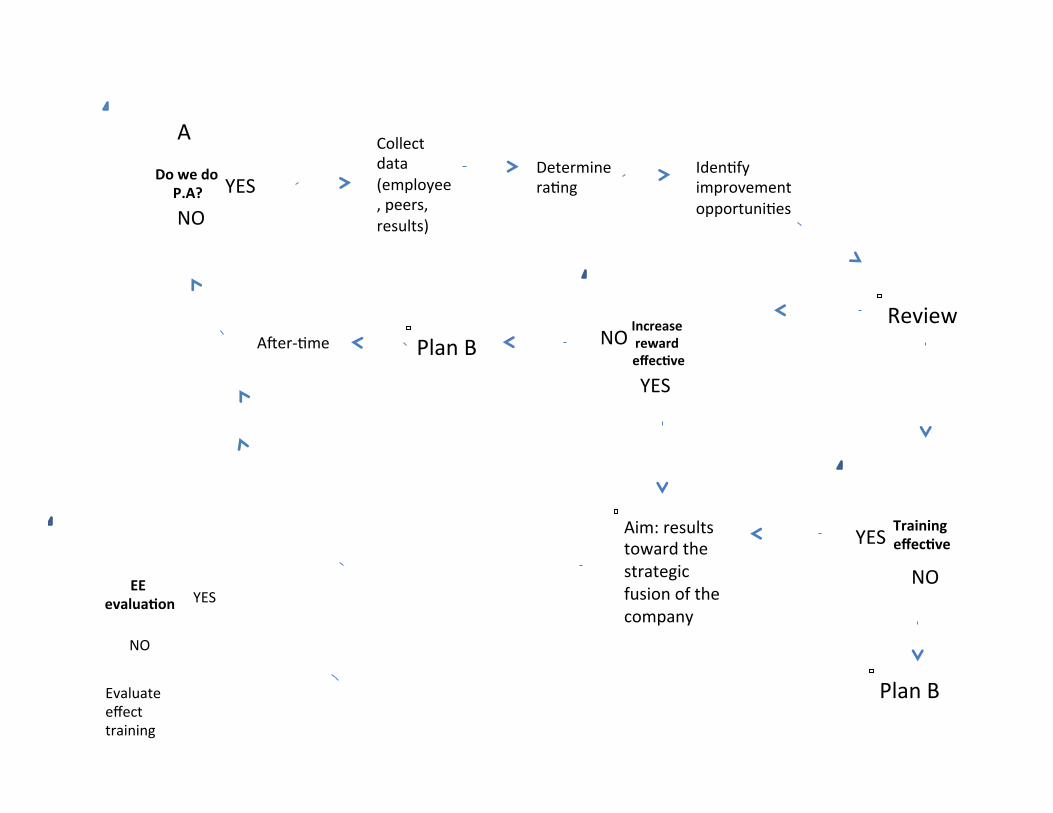
Do we do P.A? YES NO
Collect data (employee, peers, results)
Determine ra-ng
Iden-fy improvement opportuni-es
Review Increase reward effec7ve
YES
NO Plan B A[er-‐-me
A
Training effec7ve
Aim: results toward the strategic fusion of the company
YES
NO
Plan B
EE evalua7on
Evaluate effect training
YES
NO

Focus on mission
Mission-‐ why we exist Goals-‐ how do we a^empt to support mission
Reinforcing organiza-onal culture
Avoid legal and regulatory problems
Legal compliance
Mutuality in process
What is the buy in?
Relate my job to the mission
Aligning and achieving goals
Team
Co.
Cust. EE
Inden-fy obstacles-‐ internal and external
Relate obstacles to effec-veness
Link performance with rewards and outside environment
Opp. for affirma-on
Outcome
Get and keep the right people on the bus
Employer of choice

10/7/11 Sergent Results Group 517-381-5330 Dennis Sergent 517-381-5330 - Page 25 05/02-2011
Lunch! • Let’s collect our lunch!
• Room will be secure
• Staff will take your drink orders
• While you dine, discuss this
• Make sure everyone is heard from
• Be prepared to share your answers to the following questions!

10/7/11 Sergent Results Group 517-381-5330 Dennis Sergent 517-381-5330 - Page 26 05/02-2011
TABLE DISCUSSIONS AT EACH TABLE DISCUSS: • WHAT ARE OUR NEXT ACTION STEPS?
– What did I learn here?
– What do we need to discuss next?
– Who else should be here?
– What will we do with this learning?
– When do we meet again? FACILITATORSKED

10/7/11 Sergent Results Group 517-381-5330 Dennis Sergent 517-381-5330 - Page 27 05/02-2011
Future Agenda
Future Discussions = 3 Weeks + 1 Weekday – October 20th, 2011 = Comparisons of Quality Management Systems
– November 21st, 2011 = How to Plan the Perfect Meeting
– December 8th, 2011 = Six Sigma - Plans and Pitfalls
– January 6th, 2012 = Continuous Improvement Paradigms & Principles
– January 30th, 2012 = Accelerated Learning and Quality • What Are Your Ideas?
10/7/11 Sergent Results Group 517-381-5330 Dennis Sergent 517-381-5330 - Page 28 05/02-2011
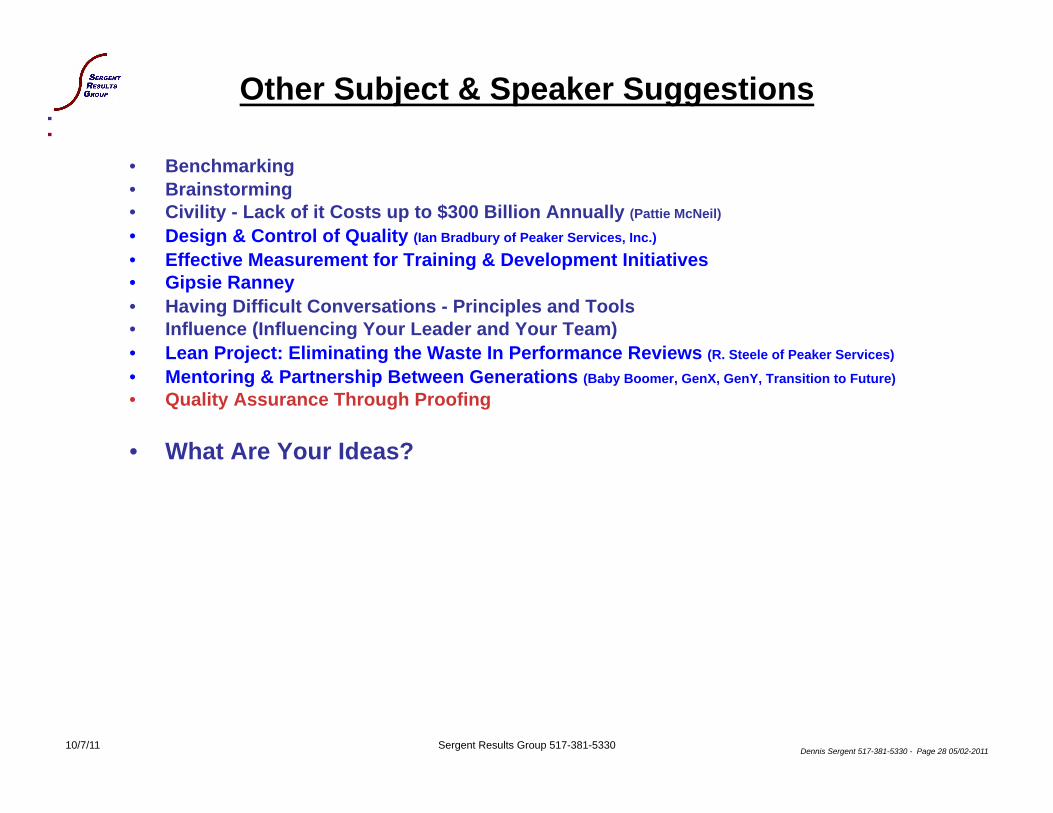
Other Subject & Speaker Suggestions
• Benchmarking • Brainstorming • Civility - Lack of it Costs up to $300 Billion Annually (Pattie McNeil) • Design & Control of Quality (Ian Bradbury of Peaker Services, Inc.) • Effective Measurement for Training & Development Initiatives • Gipsie Ranney • Having Difficult Conversations - Principles and Tools • Influence (Influencing Your Leader and Your Team) • Lean Project: Eliminating the Waste In Performance Reviews (R. Steele of Peaker Services)
• Mentoring & Partnership Between Generations (Baby Boomer, GenX, GenY, Transition to Future) • Quality Assurance Through Proofing
• What Are Your Ideas?

Dennis Sergent 517-381-5330 - Page 29 05/02-2011
Sponsoring Organiza-ons
Lean Performance Appraisals - Eliminating the Waste
CQI LEARNING LUNCH