lean systems thinking: a roadmap for operational excellence · inspiring success through...
TRANSCRIPT
© S A Partners 2011Inspiring success through pioneering, process-based solutions
Lean Systems Thinking:A Roadmap for Operational Excellence
BCCC 2011 Annual Conference6th & 7th April 2011
Professor Peter Hines
© S A Partners 2009© S A Partners, 1993-2011
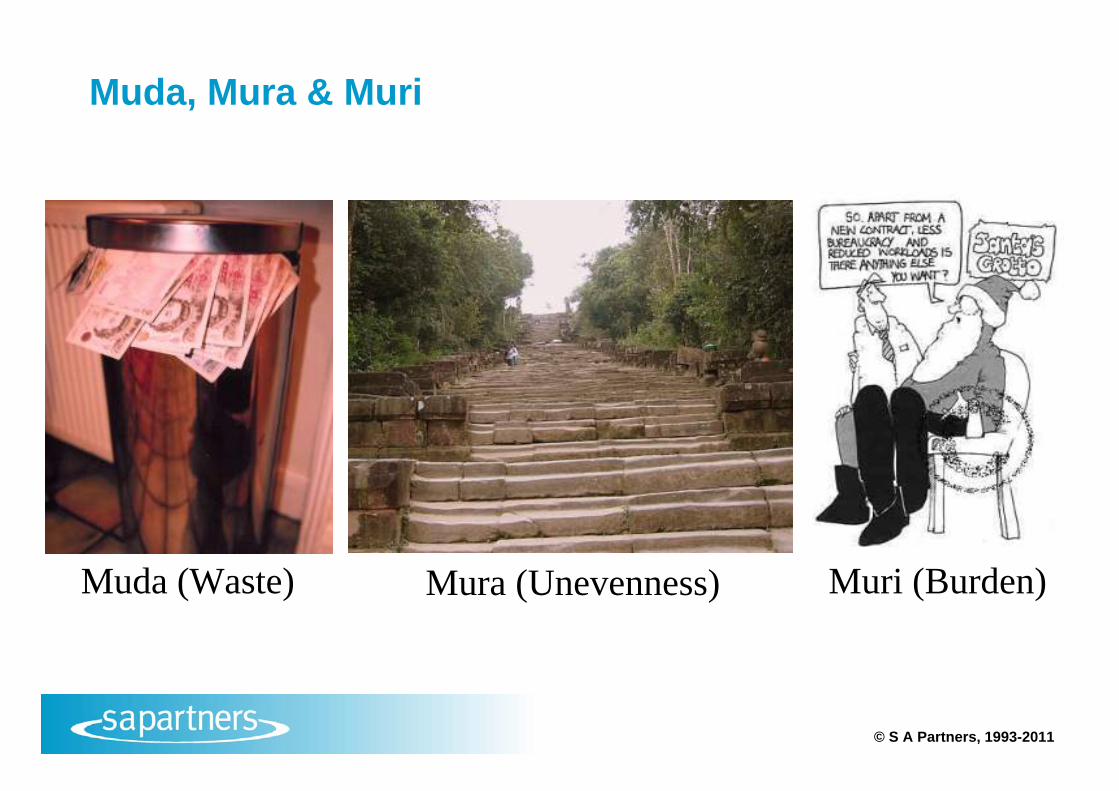
Muda, Mura & Muri
Muda (Waste) Mura (Unevenness) Muri (Burden)
© S A Partners 2009© S A Partners, 1993-2011
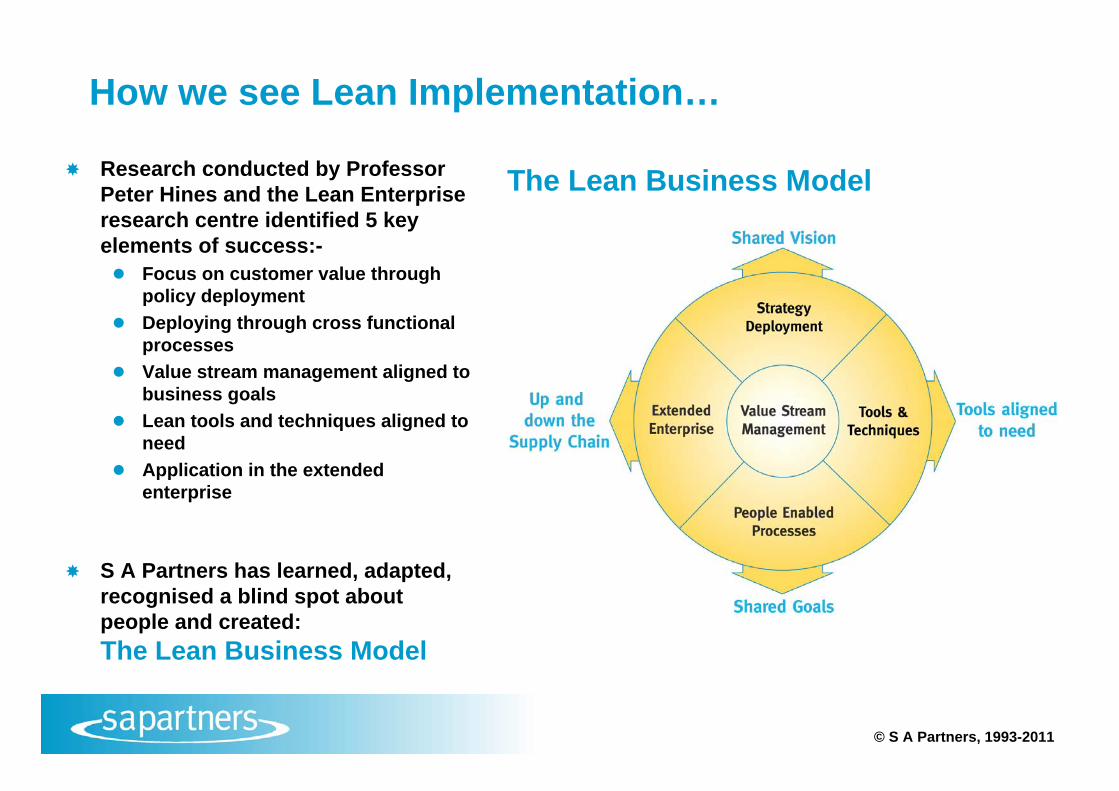
How we see Lean Implementation…
Research conducted by Professor Peter Hines and the Lean Enterprise research centre identified 5 key elements of success:- Focus on customer value through
policy deployment Deploying through cross functional
processes Value stream management aligned to
business goals Lean tools and techniques aligned to
need Application in the extended
enterprise
S A Partners has learned, adapted, recognised a blind spot about people and created:The Lean Business Model
The Lean Business Model
© S A Partners 2009© S A Partners, 1993-2011
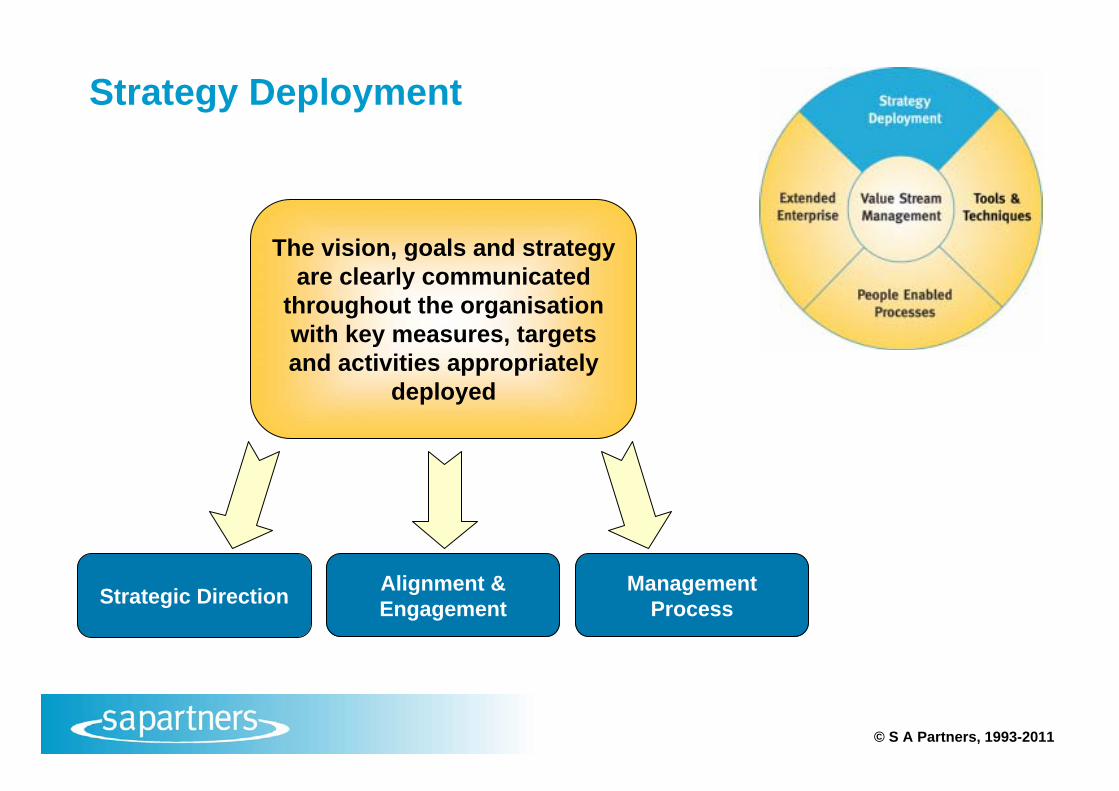
Strategy Deployment
The vision, goals and strategy are clearly communicated
throughout the organisation with key measures, targets and activities appropriately
deployed
Alignment & Engagement
Management ProcessStrategic Direction
© S A Partners 2009© S A Partners, 1993-2011
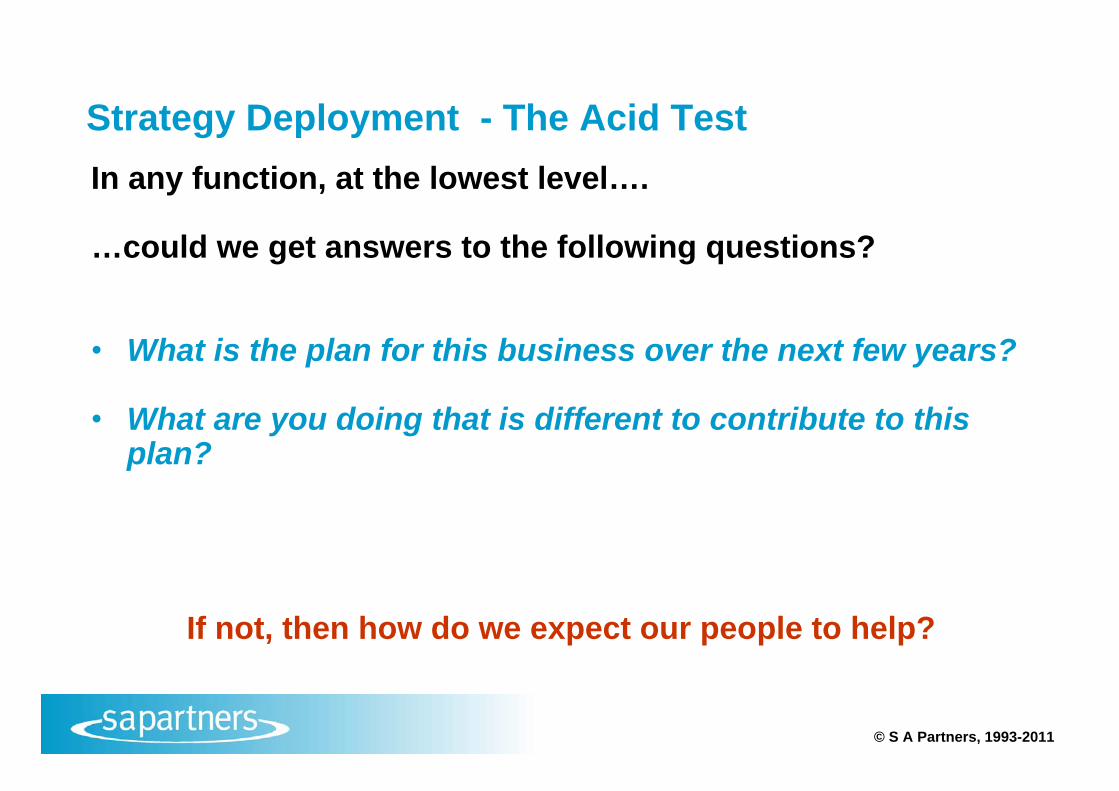
Strategy Deployment - The Acid TestIn any function, at the lowest level….
…could we get answers to the following questions?
• What is the plan for this business over the next few years?
• What are you doing that is different to contribute to this plan?
If not, then how do we expect our people to help?

© S A Partners 2009© S A Partners, 1993-2011
Cascading the strategy into the businessIssues
Key Strategic Issues� Recruitment� Exchange rate� I.T. System� New Facility
Emerging Issues� Far East economic slowdown� New competitor� September 11th events
Strategic Programmes
Measures & Targets
Cust Perc.
CostO.E.E.
Sales
Emp Sat
DIVISIONAL/REGIONAL/MARKET SECTOR FINANCIAL SUMMARY THE BASE CASE
Historic Results In constant 1999 values1997 1998 1999 2000 2001 2002
Annualised Actual Forecast Plan Plan Plan
RATIOS#DIV/0! Sales Growth (%) #DIV/0! #DIV/0! #DIV/0! #DIV/0!#DIV/0! Operating Profit Growth (%) #DIV/0! #DIV/0! #DIV/0! #DIV/0!
#DIV/0! #DIV/0! Gross Profit/Sales (%) #DIV/0! #DIV/0! #DIV/0! #DIV/0!#DIV/0! #DIV/0! Operating Profit/Sales (%) #DIV/0! #DIV/0! #DIV/0! #DIV/0!#DIV/0! #DIV/0! Operating Profit/Employee #DIV/0! #DIV/0! #DIV/0! #DIV/0!#DIV/0! #DIV/0! Sales/Employee #DIV/0! #DIV/0! #DIV/0! #DIV/0!#DIV/0! #DIV/0! Capex/Depreciation #DIV/0! #DIV/0! #DIV/0! #DIV/0!
PROFIT AND LOSSSalesGross ProfitGeneral Overhead
0 0 Trading Profit 0 0 0 0Other IncomeExceptional Items
0 0 Operating Profit 0 0 0 0
CASH FLOWOperating ProfitDepreciationCapital ExpenditureWorking CapitalOther
0 0 Net Operating Cash Flow 0 0 0 0
Financials
ID1
4
12
19
28
38
233007142128041118250108152201081522290512192603101724310714212805121926020916233006DecemberJanuary February March April May June July August Se
Progress v Milestones and Forecasts to Completion
Lead Time
Business Level Cockpit
Issues
Key Strategic Issues� Recruitment� Exchange rate� I.T. System� New Facility
Emerging Issues� Far East economic slowdown� New competitor� September 11th events
Strategic Programmes
Measures & Targets
Cust Perc.
CostO.E.E.
Sales
Emp Sat
DIVISIONAL/REGIONAL/MARKET SECTOR FINANCIAL SUMMARY THE BASE CASE
Historic Results In constant 1999 values1997 1998 1999 2000 2001 2002
Annualised Actual Forecast Plan Plan Plan
RATIOS#DIV/0! Sales Growth (%) #DIV/0! #DIV/0! #DIV/0! #DIV/0!#DIV/0! Operating Profit Growth (%) #DIV/0! #DIV/0! #DIV/0! #DIV/0!
#DIV/0! #DIV/0! Gross Profit/Sales (%) #DIV/0! #DIV/0! #DIV/0! #DIV/0!#DIV/0! #DIV/0! Operating Profit/Sales (%) #DIV/0! #DIV/0! #DIV/0! #DIV/0!#DIV/0! #DIV/0! Operating Profit/Employee #DIV/0! #DIV/0! #DIV/0! #DIV/0!#DIV/0! #DIV/0! Sales/Employee #DIV/0! #DIV/0! #DIV/0! #DIV/0!#DIV/0! #DIV/0! Capex/Depreciation #DIV/0! #DIV/0! #DIV/0! #DIV/0!
PROFIT AND LOSSSalesGross ProfitGeneral Overhead
0 0 Trading Profit 0 0 0 0Other IncomeExceptional Items
0 0 Operating Profit 0 0 0 0
CASH FLOWOperating ProfitDepreciationCapital ExpenditureWorking CapitalOther
0 0 Net Operating Cash Flow 0 0 0 0
Financials
ID1
4
12
19
28
38
233007142128041118250108152201081522290512192603101724310714212805121926020916233006DecemberJanuary February March April May June July August Se
Progress v Milestones and Forecasts to Completion
Lead Time
Sales Cockpit Product DevelopmentCockpit
HRM CockpitOperations Cockpit
Issues
Key Strategic Issues� Recruitment� Exchange rate� I.T. System� New Facility
Emerging Issues� Far East economic slowdown� New competitor� September 11th events
Strategic Programmes
Measures & Targets
Cust Perc.
CostO.E.E.
Sales
Emp Sat
DIVISIONAL/REGIONAL/MARKET SECTOR FINANCIAL SUMMARY THE BASE CASE
Historic Results In constant 1999 values1997 1998 1999 2000 2001 2002
Annualised Actual Forecast Plan Plan Plan
RATIOS#DIV/0! Sales Growth (%) #DIV/0! #DIV/0! #DIV/0! #DIV/0!#DIV/0! Operating Profit Growth (%) #DIV/0! #DIV/0! #DIV/0! #DIV/0!
#DIV/0! #DIV/0! Gross Profit/Sales (%) #DIV/0! #DIV/0! #DIV/0! #DIV/0!#DIV/0! #DIV/0! Operating Profit/Sales (%) #DIV/0! #DIV/0! #DIV/0! #DIV/0!#DIV/0! #DIV/0! Operating Profit/Employee #DIV/0! #DIV/0! #DIV/0! #DIV/0!#DIV/0! #DIV/0! Sales/Employee #DIV/0! #DIV/0! #DIV/0! #DIV/0!#DIV/0! #DIV/0! Capex/Depreciation #DIV/0! #DIV/0! #DIV/0! #DIV/0!
PROFIT AND LOSSSalesGross ProfitGeneral Overhead
0 0 Trading Profit 0 0 0 0Other IncomeExceptional Items
0 0 Operating Profit 0 0 0 0
CASH FLOWOperating ProfitDepreciationCapital ExpenditureWorking CapitalOther
0 0 Net Operating Cash Flow 0 0 0 0
Financials
ID1
4
12
19
28
38
233007142128041118250108152201081522290512192603101724310714212805121926020916233006DecemberJanuary February March April May June July August Se
Progress v Milestones and Forecasts to Completion
Lead Time
MarketingSales (Key Accounts)Customer Service
Issues
Key Strategic Issues� Recruitment� Exchange rate� I.T. System� New Facility
Emerging Issues� Far East economic slowdown� New competitor� September 11th events
Strategic Programmes
Measures & Targets
Cust Perc.
CostO.E.E.
Sales
Emp Sat
DIVISIONAL/REGIONAL/MARKET SECTOR FINANCIAL SUMMARY THE BASE CASE
Historic Results In constant 1999 values1997 1998 1999 2000 2001 2002
Annualised Actual Forecast Plan Plan Plan
RATIOS#DIV/0! Sales Growth (%) #DIV/0! #DIV/0! #DIV/0! #DIV/0!#DIV/0! Operating Profit Growth (%) #DIV/0! #DIV/0! #DIV/0! #DIV/0!
#DIV/0! #DIV/0! Gross Profit/Sales (%) #DIV/0! #DIV/0! #DIV/0! #DIV/0!#DIV/0! #DIV/0! Operating Profit/Sales (%) #DIV/0! #DIV/0! #DIV/0! #DIV/0!#DIV/0! #DIV/0! Operating Profit/Employee #DIV/0! #DIV/0! #DIV/0! #DIV/0!#DIV/0! #DIV/0! Sales/Employee #DIV/0! #DIV/0! #DIV/0! #DIV/0!#DIV/0! #DIV/0! Capex/Depreciation #DIV/0! #DIV/0! #DIV/0! #DIV/0!
PROFIT AND LOSSSalesGross ProfitGeneral Overhead
0 0 Trading Profit 0 0 0 0Other IncomeExceptional Items
0 0 Operating Profit 0 0 0 0
CASH FLOWOperating ProfitDepreciationCapital ExpenditureWorking CapitalOther
0 0 Net Operating Cash Flow 0 0 0 0
Financials
ID1
4
12
19
28
38
233007142128041118250108152201081522290512192603101724310714212805121926020916233006DecemberJanuary February March April May June July August Se
Progress v Milestones and Forecasts to Completion
Lead Time

© S A Partners 2009© S A Partners, 1993-2011
Sustaining the Improvement Drive
CI FOCUSWeekly AuditAudit Trend
KPI TargetsKPI Project Status
Housekeeping Standards
Re-layout Plan

© S A Partners 2011Inspiring success through pioneering, process-based solutions
People Enabled Processes

© S A Partners 2009© S A Partners, 1993-2011
People Enabled Processes
Accountabilities are clear at all levels and leaders motivate and
develop their team in an environment where they can
realise people potential
Leading in a Lean context
Realising People Potential
Clear Accountabilities
© S A Partners 2009© S A Partners, 1993-2011
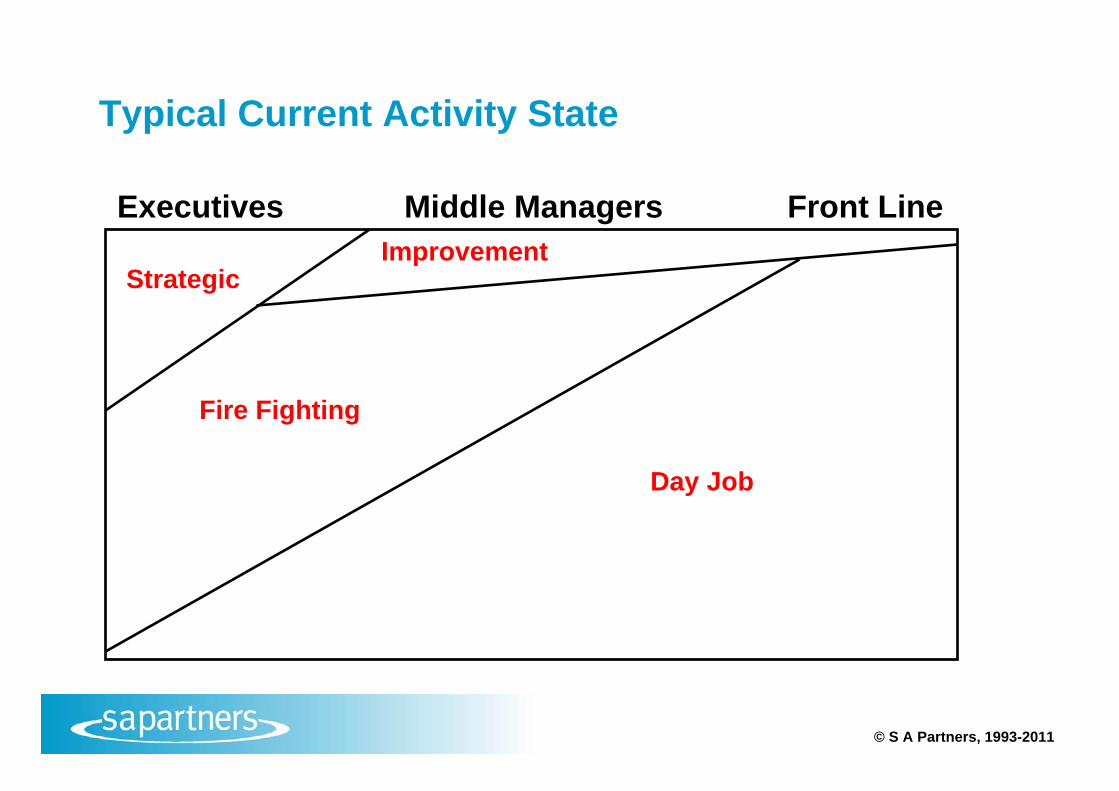
Typical Current Activity State
Executives Middle Managers Front Line
StrategicImprovement
Day Job
Fire Fighting

© S A Partners 2009© S A Partners, 1993-2011
Ideal State
Executives Middle Managers Front Line
Strategic
Improvement
Day Job

© S A Partners 2011Inspiring success through pioneering, process-based solutions
Value Stream Management

© S A Partners 2009© S A Partners, 1993-2011
Value Stream Management
Improvement is managed through processes and value streams to
deliver outstanding customer value with minimum bureaucracy
and waste
Mapping to identify Waste
Managing to the Future State Result
Understand Strategy and
Customer Value

© S A Partners 2009© S A Partners, 1993-2011
Value Stream ManagementAn Example – Process Manufacturing
Cross-functional TeamSelect Value StreamMap the Current StateUnderstand Customer ValueIdentify Waste & Unevenness
Big Picture Value Stream Map
Sep 04
Okt 04
Nov 04
Dez 04
Jan 0
5Feb
05Mrz
05Apr
05Mai
05Ju
n 05
Jul 0
5Aug
05Sep
05
0 t
500 t
1.000 t
1.500 t
2.000 t
2.500 t
3.000 t
Demand Amplification
To identify unevenness in supply-chain
demand
Process Steps
Major Wastes
Customer Value

© S A Partners 2009© S A Partners, 1993-2011
CurrentState
PerformanceLevel
Time
IdealState
1) Envision th
e most advanced position
FeasibleFuture State
2) Back off to what is currently possible
TargetedFuture State
3) Back off to chosen target
ImplementationProjects
AchieveTarget 4) Establish
new target
New TargetedFuture State
VSM - Managing to the Future State Result
From mapping to management

© S A Partners 2011Inspiring success through pioneering, process-based solutions
Tools & Techniques

© S A Partners 2009© S A Partners, 1993-2011
Tools & Techniques
The organisation has a “daily habit” of continuous
improvement that uses simple, visual tools and techniques that have been chosen and adapted
for effective use
Specific Tools & Techniques
Continuous Improvement
Process
Workplace Foundations

© S A Partners 2009© S A Partners, 1993-2011
18
The Lean Toolkit Model of Excellence
Clear strategic foundations
Manage by fact using appropriate toolsWorkplace organisation and visual management
Standardised and stable process
FlowPull
Takt timeQuick
changeoverWorkload balancing
……
Delivery
Authority to stop
Error proofingIn-station
quality controlRoot cause
solutions……
Quality
Sustainable continuous improvementPeople and teamwork
High Engagement Best quality, cost, lead time, safety
3Rs: Reduce, Reuse, Recycle
Stress Point ManagementCO2 budgetsTechnology
solutions……
Environmental

© S A Partners 2011Inspiring success through pioneering, process-based solutions
Extended Enterprise

© S A Partners 2009© S A Partners, 1993-2011
Extended Enterprise
The organisation develops integrated strategies & trusting
relationships with the best external partners to deliver
customer value and eliminate waste across the boundaries
between organisations
Supply Chain Deployment
Collaborative Development
End to End Supply Chain Strategy

© S A Partners 2009© S A Partners, 1993-2011
A Lean Supply Chain
Bottom tierSupplier Consumers
The Supply Chain is the upstream and downstream set of organisationsthat create and deliver the product / service to the end customer
Value Adding Activities
Non Value Adding ActivitiesThere are two types of activity in the Supply Chain
Information
Goods or Services
Waste is found at boundaries The bigger the boundaries the greater the Waste The biggest boundaries are between companies

© S A Partners 2009© S A Partners, 1993-2011
Tesco One Touch Replenishment
TescoStore
TescoStore
TescoBack ofStore
TescoBack ofStore
TescoRDC
TescoRDC
ColaRDC
ColaRDC
ColaProduction
ColaProduction
1 2 3 4 5 6
30% Lower Logistics Costs
TescoBack ofStore
TescoBack ofStore
TescoX DockTescoX Dock
ColaRDC
ColaRDC
ColaProduction
ColaProduction
1 2 3
TescoStore
TescoStore

© S A Partners 2009© S A Partners, 1993-2011
Tesco One Touch Replenishment

© S A Partners 2011Inspiring success through pioneering, process-based solutions
Creating a Roadmap

© S A Partners 2009© S A Partners, 1993-2011Lean Leadership 25
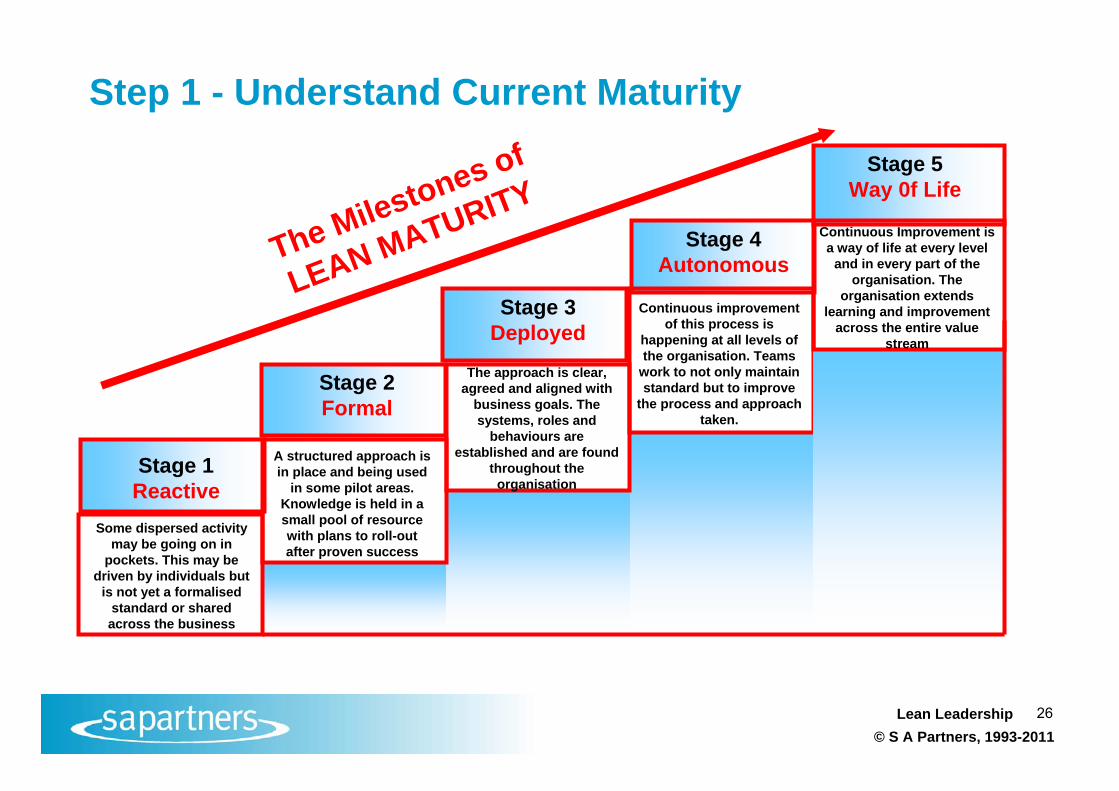
Creating your Roadmap – a 3 step process.
Understand Current levels of Maturity
Step 1
Envision a compellingFuture
Step 2
Develop the roadmap
Step 3
© S A Partners 2009© S A Partners, 1993-2011Lean Leadership 26
Stage 1Reactive
Stage 2Formal
Stage 4Autonomous
Stage 3Deployed
The Milestones of
LEAN MATURITYStage 5
Way 0f Life
Step 1 - Understand Current Maturity
Some dispersed activity may be going on in
pockets. This may be driven by individuals but
is not yet a formalised standard or shared across the business
A structured approach is in place and being used
in some pilot areas. Knowledge is held in a small pool of resource with plans to roll-out after proven success
The approach is clear, agreed and aligned with
business goals. The systems, roles and
behaviours are established and are found
throughout the organisation
Continuous improvement of this process is
happening at all levels of the organisation. Teams
work to not only maintain standard but to improve
the process and approach taken.
Continuous Improvement is a way of life at every level
and in every part of the organisation. The
organisation extends learning and improvement
across the entire value stream
© S A Partners 2009© S A Partners, 1993-2011[27]
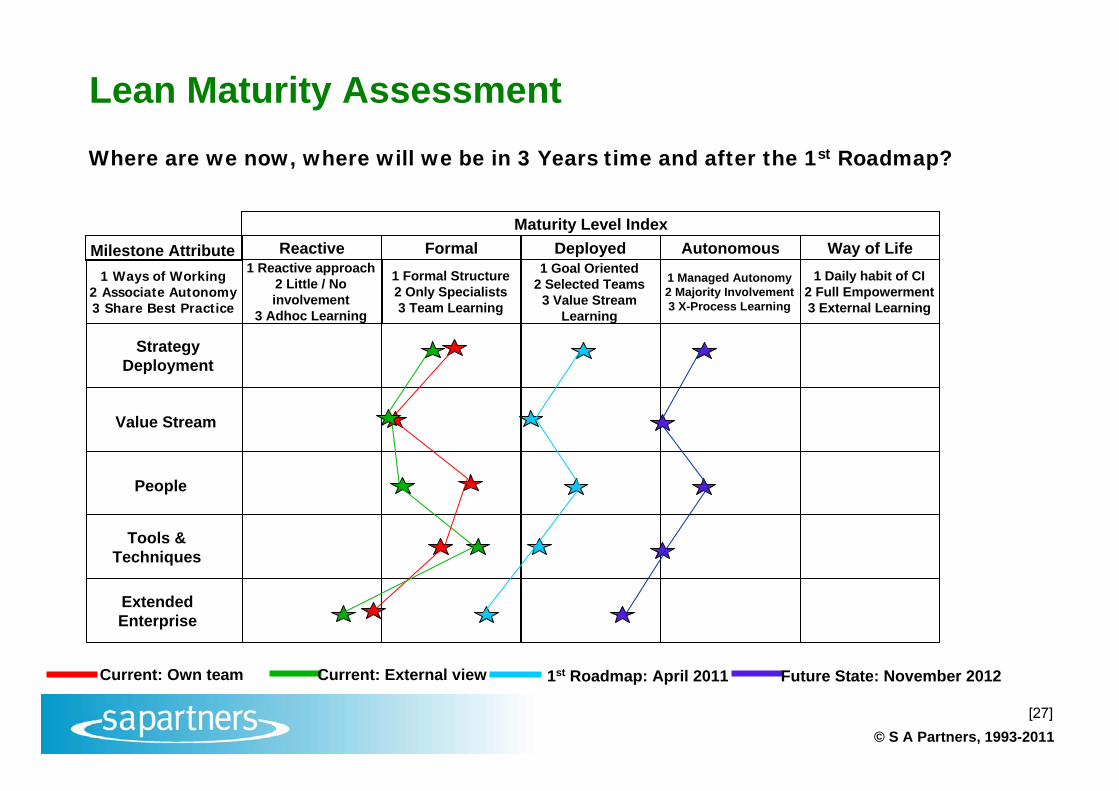
Lean Maturity AssessmentWhere are we now, where will we be in 3 Years time and after the 1st Roadmap?
Maturity Level Index
Current: Own team Future State: November 2012
AutonomousReactive Formal Deployed Way of Life1 Reactive approach
2 Little / No involvement
3 Adhoc Learning
1 Formal Structure2 Only Specialists3 Team Learning
1 Goal Oriented2 Selected Teams
3 Value Stream Learning
1 Managed Autonomy2 Majority Involvement3 X-Process Learning
1 Daily habit of CI2 Full Empowerment3 External Learning
1 Ways of Working2 Associate Autonomy3 Share Best Practice
StrategyDeployment
Value Stream
People
Tools &Techniques
ExtendedEnterprise
Milestone Attribute
Current: External view 1st Roadmap: April 2011

© S A Partners 2009© S A Partners, 1993-2011Lean Leadership 28
Multi Site Straw Man
Site levelUK level
M.S. Academy level Key1 Key for Detailed Input
ActPhase
Operations ManagerBriefing
SiteSenior MgrAwareness& RoadmapWorkshops
Middle Manager
Awareness
SiteLean
Comms & Strategy
Deployment
LeanChampions
IcebergTraining
IdentifyLean
Coaches
ReviewStrategyReview Needs
UndertakeLean Coach
Iceberg Training& Mentoring
UndertakeValue Stream
Mapping
WiderTrainingNeeds
IdentifiedKey Value Streams
& ProcessesFor
Improvement
TrainedLean
Coaches
CheckPotentialProjectsDeliver
Strategy
IdentifiedProjects
& Targets
IdentifiedFurther/Wider
TrainingNeeds
UndertakeLean
ChangeProjects
AgreedProjects
& Targets
SkilledCoaches &Other Team
Members
ReviewResults
Of Projects & Lean Change1
14
10 12119
6
87
13 15
MSAcademy
Pre-PlanPhase
PlanPhase
DoPhase
CheckPhase
2008 20092008-9
Awareness For Senior
Supply ChainManagement
Team
Corporate Lean
Activity
OtherUK
Management
2
4
LeanRoadmapPlanning
5 16
3
2008-9
IdentifyLean
Champions
© S A Partners 2009© S A Partners, 1993-2011
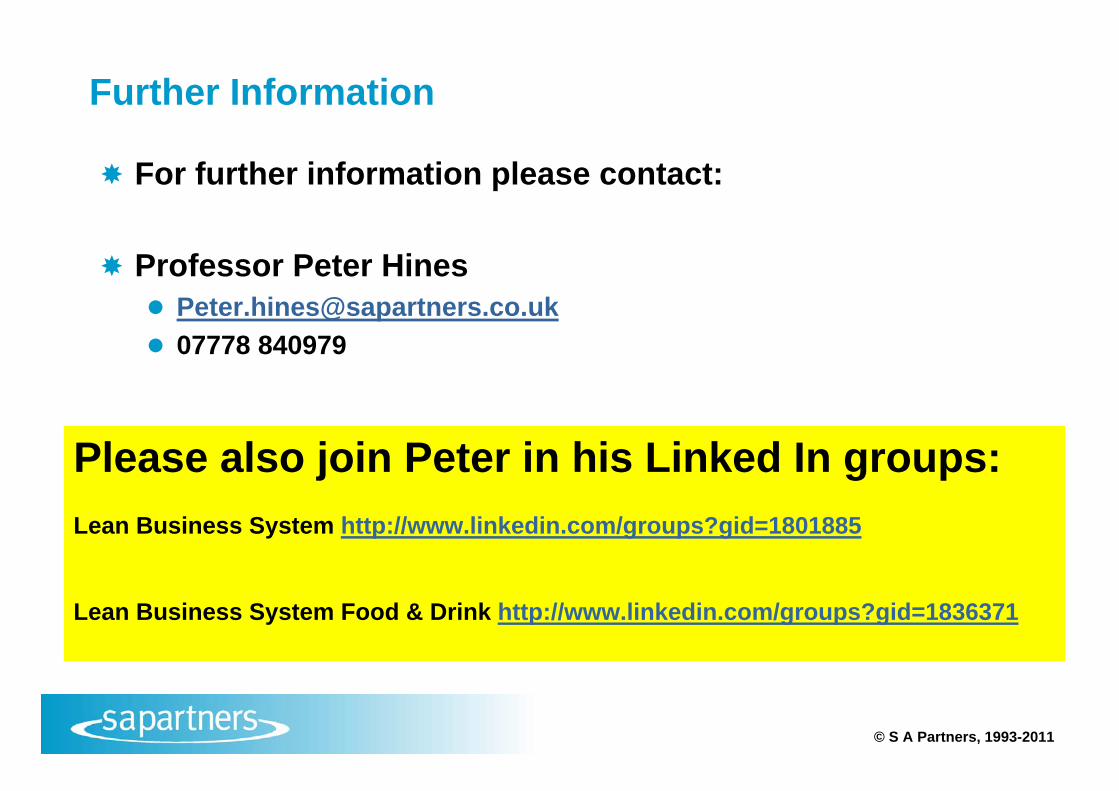
Further Information
For further information please contact:
Professor Peter Hines [email protected] 07778 840979
Please also join Peter in his Linked In groups:Lean Business System http://www.linkedin.com/groups?gid=1801885
Lean Business System Food & Drink http://www.linkedin.com/groups?gid=1836371