leanmes: human-machine interaction review - tut · pdf fileleanmes: human-machine interaction...
TRANSCRIPT
LeanMES:
Human-Machine Interaction Review
Theory and Technologies
Eeva Järvenpää & Changizi Alireza,
Tampere University of Technology
Date: 15.5.2015

MANU LeanMES Project Documentation
2
Document Information
Document number T3.3.
Document title Human-Machine Interaction – Theory and Technologies
Delivery date M22
Main Author(s) Eeva Järvenpää & Changizi Alireza, Tampere University of Technology
Participants Minna Lanz & Ville Toivonen, Tampere University of Technology
Main Task T3.3: Novel Human-Machine Interaction
Task Leader Harri Nieminen, Fastems
Publicity level PU = Public
Version V1.2
Revision History
Revision Date Author Organization Description
V1.1 1.4.2015 Eeva Järvenpää, Changizi Alireza
TUT Version for LeanMES consortium commenting
V.1.2 15.5.2015 Eeva Järvenpää TUT FINAL

MANU LeanMES Project Documentation
3
Executive Summary
The transformation towards digital manufacturing is going on. Manufacturing IT-
systems allow real time data to be collected from the factory floor and displayed to those
who need it, when they need it. However, the human factor plays an important role in
manufacturing as the involvement of human causes uncertainty to the process.
Therefore, specific attention should be placed on human-friendly user interfaces, to
improve productivity and reliability of data, and make the workplaces more attractive
for future generations.
The purpose of this report is twofold. First of all, it intends to give an introduction to
human aspects that affect to the design of technical systems and especially their user
interfaces (UI) (Section 2), and to give guidelines for user-centric, human-friendly
interface design (Section 3). This theoretical part of the report is not targeted to any
specific user interfaces, but are general, and can be applied to any type of user
interfaces, e.g. for designing UIs of Manufacturing Operations Management Systems
(MOMS). Secondly, the report will review different existing and emerging human-
machine interaction technologies and give examples of their applications in industrial
contexts in Section 4. The categories of discussed technologies include: 1) Direct and
indirect input devices, which are used to transfer the user commands to the machine; 2)
Mobile interfaces and remote sensors, such as tablets, smart phones, smart watches, and
sensors used to collect data form user activities; 3) Virtual and augmented reality, which
refers to mixing the virtual and real world together; 4) Gesture and speech control,
which are used to control the system by body motions and voice commands.
From human-perspective, whether a system can be described being usable or not
depends on four factors, namely anthropometrics, behavior, cognition and social factors.
Anthropometrics refers to the physical characteristics, such as body type and size, of the
intended users. Behavior refers to the perceptual and motivational characteristics of
users, looking at what people can perceive and why they do what they do. Behavioral
characteristics are mostly related to the sensation with the basic senses (sight, hearing,
touch, smell and taste) and interpretation of the sensed stimuli. Cognitive factors include
learning, attention and memory and other aspects of cognition that influence on how
users think and what they know and what knowledge they can acquire. Social factors
consider how groups of users behave, and how to support them through design. (Ritter
et al. 2014.)
The usability of an user interface always depends on three aspects: 1) The specific user and its characteristics; 2) The task that is being done with the designed HMI; and 3) The
context and environment of use of the designed interface. Therefore no rules for user-
centric design can be given. However, several authors have given guidelines and
heuristic principles for designing user interfaces with good usability. In the following
are listed the most relevant guidelines, collected from (Nielsen 1995; Ritter et al. 2014;
Hedge 2003):
● Usage of terms and language: The system should speak the user’s language and use
words they already know and which are relevant for their context. The interface
should exhibit consistency and standards so that the same terms always mean the
same thing. Consistent use of words strengthens the chances of later successfully
retrieving these words from the memory.

MANU LeanMES Project Documentation
4
● Use recognition rather than recall: Systems that allow users to recognize actions they
want to do will be easier initially to use than those that require users to recall a
command.
● Favour words over icons: Instead of displaying icons, words may be better. This is
because retrieving names from memory is faster than naming objects.
● Information reliability and quality: The user should not be provided with false,
misleading, or incomplete information at any time.
● Show only information which is needed: The system should be esthetic and follow a
minimalist design, i.e. do not clutter up the interface with irrelevant information.
● Provide feedback for the user: The current system status should always be readily
visible to the user.
● Make available actions visible: Make the actions the user can (and should) perform
easier to see and to do.
● Allow flexibility for different users: The system should have flexibility and efficiency
of use across a range of users, e.g. through keyboard short-cuts for advanced users.
● Ensure that critical system conditions are recoverable: The user should have the
control and freedom to undo and redo functions that they mistakenly perform.
While designing user interfaces, three selections need to be made. These include: 1)
Selection of the modality, which refers to the sensory channel that human uses to send
and receive a message (e.g. auditory, visual, touch); 2) Selection of the medium, which
refers to how the message is conveyed to the human (e.g. picture, diagram, video, alarm
sound); and 3) Selection of the technology to deliver the message (e.g. smart phone or
AR glasses). The multimodal interfaces, which use multiple different modalities (and
also media and technologies), are emerging. For example, the augmented reality
interfaces usually utilize multiple modalities, such as vision, speech and touch, and is
built by combining multiple technologies, such as different visual displays, speech
recognition and haptic devices.
Even though the most common UIs, at least in Finnish manufacturing environments, are
still pen and paper, it is believed that the transformation towards digitalization, for
example implementation of MES systems, will open doors for adoption of novel user
interfaces on the factory floor. Adopting new technologies into manufacturing industry
is usually quite slow, but there are signs from recent years that the emerging UI
technologies have tried to find their way into factory floors. This report intends to
introduce the existing and emerging UI technologies that could be used on the factory
floors in the future. By first discussing about the human characteristics important for
the design, and giving the general guidelines for interfaces with good usability, the aim is
to emphasize that while selecting and designing the media and technologies, the human
behavior and cognitive capabilities need to always be considered. The user, task and
context of use will affect to the optimal technology selection.

MANU LeanMES Project Documentation
5
Table of contents
Executive Summary ........................................................................................................... 3
Table of contents ................................................................................................................. 5
1. Introduction ................................................................................................................. 6
2. Human aspects in user-interface design ............................................................ 7
2.1. Introduction to user-centric design ......................................................................... 7
2.2. ABCS Framework for user-centric design .............................................................. 8
2.2.1. Anthropometrics ......................................................................................................................... 8
2.2.2. Behavior .......................................................................................................................................... 8
2.2.3. Cognition......................................................................................................................................... 9
2.2.4. Social cognition and teamwork ...........................................................................................12
2.3. Human actions ............................................................................................................... 12
2.4. Input and output modalities of user interfaces ................................................. 13
2.4.1. Multimodal interfaces .............................................................................................................15
2.4.2. Theoretical principles of user-computer multimodal interaction ........................16
2.5. Adaptive system interfaces ....................................................................................... 17
3. Guidelines for designing user-centric, human-friendly interfaces ........ 18
3.1. User characteristics relevant for system design ............................................... 18
3.2. Task analysis .................................................................................................................. 19
3.3. Heuristic principles for designing interfaces with good usability .............. 20
3.4. System characteristics and cognitive dimensions ............................................ 22
3.5. Design of multimodal interfaces ............................................................................. 23
3.6. Design for Errors ........................................................................................................... 25
3.7. Display Designs .............................................................................................................. 26
3.7.1. Thirteen principles of display design ...............................................................................26
3.7.2. Visual design principles for good design .........................................................................28
4. Human-machine interaction technologies ..................................................... 32
4.1. Direct and indirect input devices ............................................................................ 33
4.2. Mobile Interfaces and Remote Sensors ................................................................. 35
4.2.1. Mobile Device and Remote Sensor Technologies ........................................................36
4.2.2. Mobile Devices and Remote Sensors Applications......................................................40
4.3. Virtual and Augmented Reality ................................................................................ 43
4.3.1. Technologies for Augmented Reality ................................................................................43
4.3.2. AR application examples ........................................................................................................48
4.4. Gesture and Speech Control ...................................................................................... 52
4.4.1. Technologies for Gesture and Speech control ...............................................................52
4.4.2 Gesture and Speech Control Application Examples .....................................................57
5. Conclusions ................................................................................................................ 60
References .......................................................................................................................... 61

MANU LeanMES Project Documentation
6
1. Introduction
Human factors play a crucial role in the production environment. The desire towards
more agile and responsive manufacturing requires that the real time information of the
production status is always visible for those who might need it. This, in turn, requires
that the information is, on one hand collected from the production processes, and on the
other hand displayed to the workers in a human-friendly way. As noticed during the
interviews conducted in the 1st period of LeanMES-project (Järvenpää et al. 2015), the
contribution of human causes uncertainty to the process. This problem was especially
visible in the information inputting and searching. The current manual practices in
information inputting, e.g. re-typing information from paper documents to IT-systems,
don’t allow real time transparency to the operations, neither provide reliable data. As
the transformation towards digital manufacturing is finally starting in many companies,
the information previously provided by paper documents to the factory floor operator
(e.g. job lists and work instructions), could now be displayed by multitude of different UI
technologies in a digital, easily editable format. Same applies to the information
collection from the factory floor.
In order to mitigate the problems relating to human perceptual and cognitive
capabilities, as well as behavior, a special attention should be paid on the design and
selection of good and intuitive user interfaces and interaction technologies. The novel
ways of working on the factory floor should not only improve the efficiency and quality
of operations, but also be pleasurable for the workers. To attract future operators, the
manufacturing sector should target to social sustainability and adopt new UI
technologies in order to be more appealing and accessible for youngsters, who have
grown in a digital world.
The purpose of this report is two fold. First of all, it intends to give an introduction to
human aspects that affect to the design of technical systems and especially their user
interfaces (Section 2), and to give guidelines for user-centric, human-friendly interface
design (Section 3). Secondly, the report will review different existing and emerging
human-machine interaction technologies and give examples of their application in
industrial contexts (Section 4).

MANU LeanMES Project Documentation
7
2. Human aspects in user-interface design
2.1. Introduction to user-centric design
When one reads a book or research article about user-centric (or human-friendly)
design, it is usually highlighted that no generic rules for user-centric design can be
written, because the characteristics of good design depends on the task, context and
users of the designed technology (e.g. Ritter et al. 2014; Smith et al. 2012; Courage et al.
2012). For instance, Ritter et al. (2014) states: “User-centered design is about considering
particular people doing particular tasks in a particular context.” Watzman and Re (2012)
have similar viewpoint: “The most important principle to remember, when thinking about
design, is that there are no rules, only guidelines. Everything is context sensitive. Always
consider and respect the user.”
Based on Courage et al. (2012) the users should be analysed by answering to questions
such as: Who are they? What characteristics relevant to the design do they have? What
do they know about the technology? What do they know about the domain? How
motivated are they? What mental models do they have of the activities the designed product covers? For understanding the task the user is trying to accomplish, the
following questions can be considered: What is the goal of the user? What steps involve
in achieving the goal? How the task is currently done, in which sequence and by which
methods? The analysis on users’ environments or context should clarify the physical
situation in which the tasks occur, technology available to the users, as well as social,
cultural and language considerations. (Courage et al. 2012)
Two terms, often used when discussing about user-centric design are “usability” and
“user experience”. These terms are sometimes mixed, even though their meaning is
different. As stated by Ritter et al. (2014) usability focus on the task related aspects and
getting the job done. On the other hand, user experience focus on user’s feelings,
emotions, values and their immediate and delayed responses. Three factors that
influence usability and user experience are: the system itself; the user and their
characteristics; and the context of use of the technology or systems. From the user’s
perspective, whether a system can be described being usable or not depends on (Ritter
et al. 2014):
● Shape and size of the users (anthropometric factors)
● External body functioning and simple sensory-motor concerns, and motivation
(behavioral factors)
● Internal mental functioning (cognitive factors)
● External mental functioning (social and organizational factors)
As the usability of a system is an inherent requirement for good user experience, this
section will mainly focus on the aspects that affect directly to the usability of an UI.

MANU LeanMES Project Documentation
8
2.2. ABCS Framework for user-centric design
Ritter et al. (2014) presented an ABCS framework in which the design relevant human
characteristics are divided into four categories:
● Anthropometrics (A) - The shape of the body and how it influences what is
designed: consideration of the physical characteristics of intended users such as
what size they are, what muscle strength they have and so on.
● Behavior (B) – Perceptual and motivational characteristics, looking at what
people can perceive and why they do what they do.
● Cognition (C) – Learning, attention, memory, and other aspects of cognition and
how these processes influence design: users defined by how they think and what
they know and what knowledge they can acquire.
● Social factors (S) – How groups of users behave, and how to support them
through design: users defined by where they are – their context broadly defined
including their relationships to other people.
In the following sections, these four categories are discussed in more detail.
2.2.1. Anthropometrics
The physical attributes of the user will affect how they use a particular artifact. The
physical aspects of interaction relate to the posture and load bearing of the human body.
Relating to physical aspects the designer has to consider whether the human can reach
the controls, operate the lever, push the buttons and so on. Supporting correct posture
will affect to the well-being of the user. The load bearing is important to consider
especially when using portable or wearable devices (e.g. phones, tablets and head-
mounted displays). The human has to support the weight of the interface during the
interaction, but normally also during the whole day. (Ritter et al. 2014)
The perception of touch is divided into three types of tactual perception: Tactile,
kinesthetic and haptic perception. The tactile perception is solely mediated by the
change in cutaneous stimulation, i.e. when the skin is stimulated. The kinesthetic
perception is mediated by variations in kinesthetic stimulation, i.e. awareness of static
and dynamic body posture based on information coming from muscles and joints. Haptic
perception involves using information from the cutaneous sense and kinesthesis to
understand and interpret objects and events in the environment. Haptics is the most
common type of tactual perception. For instance most of the common input
technologies, e.g. physical keyboards, touch screens, pointing devices (mouse, trackpad,
tracker balls, etc) use some sort of haptic feedback to inform the user about the
performed actions. (Ritter et al. 2014)
2.2.2. Behavior
Behavioral characteristics are mostly related to the sensation and perception. People
have five basic senses: sight, hearing, touch, smell and taste. Sensation occurs when the
sense organs are stimulated and they generate some form of coding of the stimuli.
Perception occurs when this coded information is further interpreted using knowledge of the current context (physical, physiological, psychological, and so on) to add meaning.

MANU LeanMES Project Documentation
9
The process of perception is subjective. This implies that simply presenting designed
stimuli in such a way that they will be sensed accurately does not necessarily mean that
they will be perceived in the way that the designer intended. (Ritter et al. 2014)
Most user interfaces use vision as the major sense. One of the most useful applications of
vision to interface design is to take advantage of how the eye searches. Certain stimuli
”pop out” from other stimuli and can therefore be used to draw attention to important
things. Ritter et al. (2014) stated that e.g. highlighting, using different color or making
the object to move or blink, makes the objects to “pop out” from others. Colors should be
used to emphasize things that are important. However, as advised by Ritter et al. (2014),
in order to help people with red-green color vision deficiency, redundant information
should be used.
Often it is important to consider how the different sensory modalities can be used
together to provide further information for the user (e.g. difficult conditions, such as
lack of light or persons with impaired vision or hearing). Also, if some elements on a
display, which are visually similar (such as same shape, but slightly different color)
should be processed differently, they should be made distinct by separating one or more
dimensions of the appearance by several JNDs (Just noticeable differences) (e.g. several
shades of color). (Ritter et al. 2014) Further details about the design of visual displays
are discussed in Section 3.7.2.
As discussed above, vision has an important role in most user interfaces. Welsh et al.
(2012) stated that people are more accurate and less variable under conditions in which
they have vision of the environment than when they do not. Furthermore, they said that
ballistic actions, such as keypress don’t require continual source of visual target
information and feedback during the execution, because online corrections can not be
made. On the other hand, for aiming movements, such as pointing a certain icon on the
display, continual and stable source of visual information about the effector and the
target is needed for efficient feedback-based corrections and movement accuracy.
(Welsh et al. 2012) Fitt’s law (Fitts 1954), relating to perceptual-motor interaction, is
often used as a predictive model of time to engage a target. The law indicates that the
time to point to an object is related to the distance from the object and inversely related
to the size of the object. The law implies that larger objects lead to faster pointing times
than smaller objects and shorter distances lead to faster reaction times. (Ritter et al.
2014; Welsh et al. 2012)
In addition to perceptual capabilities, also motivation affects to the behavior or a human.
Szalma et al. (2012) listed three organismic elements that are essential for facilitating
intrinsic motivation for task activity. These needs are competence, autonomy (personal
agency, not independence per se), and relatedness. Ritter et al. (2014) named these
elements as mastery, autonomy and purpose. Based on Szalma et al. (2012) three factors
that support autonomy are as follows: 1) meaningful rationales for doing a task, 2) acknowledgement that the task might not be interesting; 3) an emphasis on choice
rather than control.
2.2.3. Cognition
Cognition refers to mental capabilities of users relating to memory, attention and
learning. As stated by Ritter et al. (2014), user’s cognition is limited, for example the

MANU LeanMES Project Documentation
10
working memory and attentional resources are limited, which affects to how much
information human can process at a time.
Memory
The way people use a system will be greatly influenced by how well they can retrieve
commands and locations of objects from memory. There are different types of memory,
that are used for different purposes (Ritter et al. 2014):
● Short-term memory: Is often used to store lists or sets of items to work with.
For unrelated objects, users can remember around seven meaningful items (+/-
2).
● Long-term memory: Information which is meaningful, and which meaning is
processed at encoding time, is easier to remember.
● Declarative memory: Facts and statements about the world
● Procedural memory: Includes acts, or sequences of steps that describe how to
do particular tasks.
● Implicit memory: Cannot be reported. Most procedural information is implicit
in that the precise details are not reportable. Information gets put into implicit
memory when the user works without a domain theory and learns through trial
and error.
● Explicit memory: Can be reported. Most declarative information is explicit in
that it can be reported. Users can perform tasks more robustly, and because they
can describe how to do the task, they can help others more readily. Users can be
encouraged to store information in explicit memory by helping them develop a
mental model of a task, and by providing them with time to reflect on their
learning.
Ritter et al. (2014) highlighted few mnemonics and aids to memory. For instance,
recognition is useful aid to recalling. Recognition memory is more robust than recall
memory. This implies that “it is easier to recognize something that you have previously
seen than to recall what it was you saw”. Many interfaces take advantage of recognition
memory by putting objects or actions in a place where they can be recognized instead of
requiring the user to recall them. In addition, anomalous or interesting things are better
retrieved from memory, than something which is not drawing the user’s attention in the
first place. (Ritter et al. 2014)
In case of lists, certain things affect how well the information on the lists can be
retrieved (Ritter et al. 2014):
● Primacy – Items appearing at the start of a list are more easily retrieved from the
memory.
● Distinctive items in a list are better retrieved.
● Items in a list that make sense (e.g. MES, ERP) are better retrieved than items
that do not have associations for everybody.
● Recency – Items appearing last in the list are better retrieved.
Attention
According to Ritter et al. (2014) attention refers to “the selective aspects of perception,
which function so that at any instant a user focuses on particular features of the

MANU LeanMES Project Documentation
11
environment to the relative (but not complete) exclusion of others”. Welsh et al. (2012)
listed three important characteristics of attention: 1) attention is selective and allows
only a specific subset of information to enter the limited processing system; 2) the focus
of attention can be shifted from one source of information to another; 3) attention can
be divided such that within certain limitation, one may selectively attend to more than
one source of information at a time.
As discussed by Welsh et al. (2012) shifts of attention that are driven by stimuli are
known as exogenous, or bottom-up, shifts of attention. They are considered to be
automatic in nature and thus, for the most part, are outside of cognitive influences.
Exogenous shifts of attention are typically caused by dynamic change in the
environment, such as the sudden, abrupt appearance (onset) or disappearances (offset)
of a stimulus, a change in the luminance or color of a stimulus, or the abrupt onset of
object motion. Performer-driven, or endogenous, shifts of attention are under complete
voluntary control. This type of shift of attention can be guided by wide variety of stimuli,
such as symbolic cues like arrows, numbers or words. In this way, users can be cued to
locations or objects in the scene with more subtle or permanent information than the
dynamic changes that are required for exogenous shifts. However, the act of interpreting
the cue requires a portion of the limited information-processing capacity. Furthermore,
as stated by Welsh et al. (2012) it seems that “automatic” attentional capture is
dependent on the expectations of the user. Therefore, the designer of the interface has to
consider the perceptual expectations of the user. (Welsh et al. 2012)
Proctor & Vu (2012) stated that many studies have shown that it is easier to perform
two tasks together when they use different stimulus or response modalities, than when
they use the same modalities. Performance is also better when one task is verbal and the
other visuospatial than when they are the same type. According to multiple resource
models, different attentional resources exist for different sensory-motor modalities and
coding domains. (Proctor & Vu 2012) Therefore, dual tasks that use different perceptual
buffers will interfere less with each other. For instance, people can learn to drive and
talk at the same time in normal weather conditions, because driving does not use a lot of
audio cues. (Ritter et al. 2014)
Mental models and learning
Mental models are used to understand systems and to interact with systems. When the
user’s mental models are inaccurate, systems are hard to use. The model the user brings
to the task will influence how they use the system, what strategies they will most likely
employ, and what errors they are likely to make. It is therefore important to design the
system in such a way that the user can develop an accurate mental model of it. (Ritter et
al. 2014)
Mental model can be considered as a representation of some part of the world that can
include the structures of the world (the ontology of the relevant objects), how they interact and how the user can interact with them (Ritter et al. 2014). Payne (2012)
simplified the meaning of mental models into “what users know and believe about the
systems they use”. If the user’s mental model accurately matches the system, the user can
better use the mental model to perform their task, to troubleshoot the system and to
teach others about the task or system (Ritter et al. 2014).

MANU LeanMES Project Documentation
12
The designer of the system must have an accurate mental model of how people will use
it. This requires understanding how people will use it, the tasks they will perform using
the system, and their normal working context. Making the system compliant with the
user’s mental model will almost certainly help reduce the time it takes to perform task,
reduce learning time and improve the acceptability of the system. Good interfaces will
help users to develop appropriate levels of confidence in their representations and
decisions. Often this means providing information to support learning, including
feedback on task performance and also providing information to build a mental model.
It is important to keep the human in the loop. This means keeping the users aware of
what the computer is doing, by providing them with feedback about the system’s state.
They can use this to detect errors, to update their own mental model of how the system
is working and to anticipate when they need to take an action. If users do not get
feedback, their calibration about how well they are doing will be poor to non-existent.
When it is not clear for the user what to do next, problem solving is used. Problem
solving uses mental models and forms a basis for learning. (Ritter et al. 2014)
One important concept, which aids in building the correct mental model of the system,
and therefore easing its usage, is the stimulus-response (S-R) compatibility. This means
that there should be clear and appropriate mappings between the task/action and the
response. It is typically seen as having physical aspects of an interface (e.g. buttons) and
displays match the world that they are representing. For example. buttons calling
elevator to go up, should be upper than the ones to call it to go down. (Welsh et al. 2012;
Ritter et al. 2014)
2.2.4. Social cognition and teamwork
Social processes – how people interact with each other – are important, because they
affect how systems and interfaces are used. Workplace systems are socio-technical
systems, meaning technical systems that are designed for and shaped by people
operating in social contexts. Two especially important social responsibility effects,
presented by Ritter et al. (2014), should be considered. These are diffusion of social
responsibility and pluralistic ignorance. The diffusion of social responsibility indicates
that a person is less likely to take responsibility for an action or inaction when they
think someone else will take the action. For instance this could happen when sending an
email to many and nobody takes the responsibility. Pluralistic ignorance refers to the
fact that people, especially inexperienced, often base their interpretation of a situation
on how other people interpret it. For example, if the other people don’t react to an alarm
sound, the rest will interpret it as “not important” as well. (Ritter et al. 2014)
2.3. Human actions
Based on Welsh et al. (2012) three basic processes can be distinguished in human
information processing: Stimulus identification, which is associated with processes
responsible for the perception of information; Response selection, which pertains to the
translation between stimuli and responses, and Response programming, which is
associated with the organization of the final output. (Welsh et al. 2012) When human
takes an action, it includes several stages. Norman (1988) defined seven stages of user
activities. The process of these stages should be seen as cyclic rather than linear
sequence of activities:

MANU LeanMES Project Documentation
13
● Establish the goal
● Form the intention to take some action
● Specify the action sequence
● Execute the action
● Perceive the system state
● Interpret the system state
● Evaluate the system state with respect to the goals and intentions
Ritter et al. (2014) discussed about the “gulfs of evaluation and execution”, originally
defined by Norman (1988). In evaluation and execution phases the user has to make
mappings between the psychological and physical concepts. In evaluation phase it
means the following: When the user perceives the state of the system, this will be in
terms of physical concepts (usually variables and values) that the user will have to
translate into a form that is compatible with their mental model of how the system
operates. Gap between the physical concepts and the psychological concepts is called
gulf of evaluation. In execution phase the goals and intentions of the user’s
(psychological concepts) need to be translated into physical concepts, which are usually
actions that can be executed in the system. The gap between the goals and intentions,
and the physical actions are called gulf of execution. Interfaces show examples where
details and feedback on the state of the system can be difficult to interpret, and where it
can be difficult to work out what actions are available and how to execute them. In these
cases the gulfs of evaluation and execution are large. (Ritter et al. 2014)
The above mentioned gulfs lead to following implications for design (Ritter et al. 2014):
● Good design involves making sure that information that is crucial to task
evaluation and performance are made clearly visible to the user. What counts as
appropriate information will vary across tasks, and sometimes across users, and
even across context of use.
● Appropriate consideration should be given to:
○ Feedback – helps to reduce the gulf of evaluation because it shows the
effect of performing a particular tasks.
○ Consistency – helps users to help themselves (e.g. by applying knowledge
on other systems (e.g. place of buttons)).
○ Mental models – design should facilitate the development of appropriate
mental models, and support the use of those models by making the
appropriate information visible to users at the right time in the right
place.
● Critical systems should not be ”too easy to use”. Users must pay attention to
what they are doing.
2.4. Input and output modalities of user interfaces
Sutcliffe (2012) described the difference between medium and modality. A message is
conveyed by a medium and received through a modality. A modality is the sensory
channel that human uses to send and receive messages to and from the world,
essentially the senses. Two principal modalities that are used in human-computer
communication are vision and hearing. (Sutcliffe 2012) As the vision modality has been
widely covered in other sections of this report, this section concentrates to mainly to

MANU LeanMES Project Documentation
14
hearing, namely speech and non-speech auditory modalities. Also touch will be shortly
included. Smell and taste are not discussed here, as their use in UIs is not yet common.
Non-speech auditory output refers to auditory stimulus, which is not spoken language,
but e.g. alarm or warning sounds. Hoggan & Brewster (2012) listed the advantages of
non-speech feedback (including also other than auditory feedback, such as touch):
● Vision and hearing are interdependent, they work well together (e.g. “our ears
tell our eyes where to look”).
● Hearing and touch have amodal properties, which relates to space and time and
involve points along continuum (e.g. location), intervals within continuum (e.g.
duration), patterns of intervals (e.g. rhythm), rates of patterns (e.g. tempo), or
changes of rate (e.g. texture gradients).
● Sound has superior temporal resolution.
● Sound and touch reduce the overload from large displays.
● Sound and touch reduce the amount of information needed on the screen.
● Sound reduces demands on visual attention.
● Sound is attention grabbing.
● Touch is subtle and private.
● Spatial resolution of tactile stimuli is high.
● Auditory or tactile form makes computers more usable by visually disabled
people.
On the other hand, Hoggan and Brewster (2012) (originally by (Kramer 1994)), brought
out some disadvantages of non-speech feedback:
● Sound has low resolution. Using sound volume or tactile amplitude, only a very
few different values can be unambiguously presented.
● Presenting absolute data is difficult.
● There is lack of orthogonality, changing one attribute of a sound or tactile cue
may affect the others.
● The auditory feedback (or input) may annoy to other persons nearby.
Hoggan & Brewster (2012) highlighted that nonspeech auditory or tactile feedback is
useful in mobile devices. As the devices are small, there is a very limited amount of
screen space for displaying information. Also, if the users are performing their tasks in
movement, e.g while walking or driving, they cannot devote all of their visual attention to the mobile device. (Hoggan & Brewster, 2012)
Speech is characterised by its transient nature, while graphics are persistent. While a
graphical interface typically stays on the screen until the user performs some action, the
message carried out by speech is immediately gone after it has been said. Listening to
speech taxes user’s short-term memory and if the message is long, something may be
forgotten. Therefore, in general, transience means that speech is not a good medium for
delivering large amounts of information. However, as people can look and listen at the
same time, speech may be good for grabbing attention or for providing an alternate
mechanism for feedback. (Karat et al. 2012)
Speech is also invisible. The lack of visibility makes it difficult to communicate the
functional boundaries of an application to the user. Because there is no visible menu or
other screen elements, it is much more challenging to indicate to the users what actions

MANU LeanMES Project Documentation
15
they may perform and what words and phrases they must say to perform those actions.
It is also problematic when the speaker is not in a private environment, or when there
are other voices in the background that might interfere with the speech recognition.
(Karat et al. 2012)
In the future, the multimodal interfaces are expected to become more common, and
these interfaces will use also other modalities, such as haptic (sense of touch),
kinesthetic (sense of body posture and balance), gustation (taste) and olfaction (smell)
(Oviatt, 2012). Multimodal interfaces will be discussed in the next section.
2.4.1. Multimodal interfaces
Multimodal interfaces are becoming more common in human-machine interaction.
According to Dumas et al. (2009), multimodal systems are computer systems endowed
with multimodal capabilities for human/machine interaction and able to interpret
information from various sensory and communication channels. Multimodal interfaces
process two or more combined user input modes, like speech, pen, touch, manual
gesture, gaze or body movements, in a coordinated manner with multimedia system
output. Compared to unimodal interfaces, multimodal interfaces aim to provide a more
“human” way to interact with computer by using richer and more natural ways of
communications, such as speech, gestures and other modalities, and more generally all
the five senses. However, it has to be noted that the terms “natural interaction” and
“natural UI” are often used, when talking about new UIs. Hinckley & Wigdor (2012) gave
an operational definition for a natural UI: “the experience of using a system matches
expectations such that it is always clear to the user how to proceed and only a few steps
(with minimum of physical and cognitive effort) are required to complete common tasks.”
Therefore, one cannot state that one interaction technology would be more natural than
another. It is always dependent on the task that is supposed to be performed with the
technology.
It has been proved by Oviatt (1997) that compared to unimodal interfaces, multimodal
interfaces can improve the error handling and reliability, provide greater expressive
power, and provide improved support for users’ preferred interaction style. The
multimodal interfaces can support broad range of users and context of use, since the
availability of multiple modalities supports flexibility. For example, the same user may
benefit of the speech input in quiet conditions when the hands are occupied, while in
noisy environment e.g. touch input may be more efficient. Flexible personalization of the
interaction mode, based on user and context, is especially useful for people with
impaired vision, hearing or moving abilities. (Dumas et al. 2009)
According to Dumas et al. (2009) the findings in cognitive psychology indicate that
humans are able to process modalities partially independently and, thus, presenting
information with multiple modalities increases human working memory. Therefore,
increasing effective working memory by presenting information in a dual-mode form,
rather than a purely visual one, could expand human processing capabilities.
MANU LeanMES Project Documentation
16
2.4.2. Theoretical principles of user-computer multimodal interaction
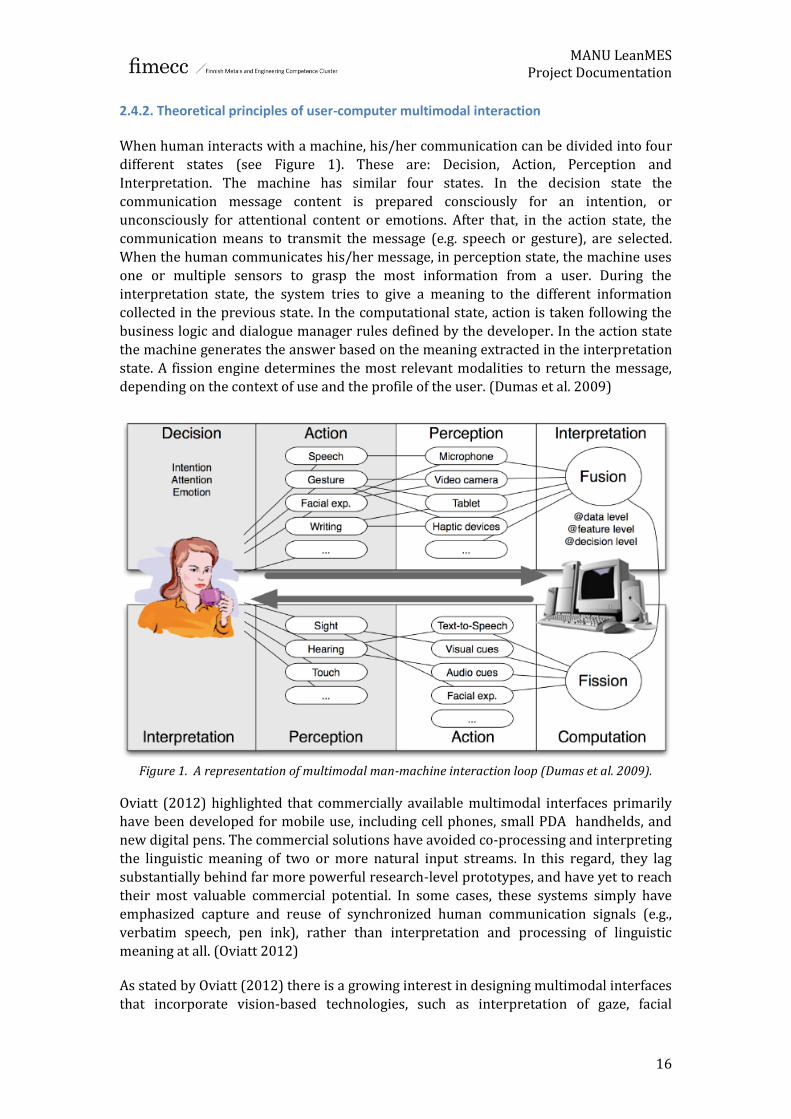
When human interacts with a machine, his/her communication can be divided into four
different states (see Figure 1). These are: Decision, Action, Perception and
Interpretation. The machine has similar four states. In the decision state the
communication message content is prepared consciously for an intention, or
unconsciously for attentional content or emotions. After that, in the action state, the
communication means to transmit the message (e.g. speech or gesture), are selected.
When the human communicates his/her message, in perception state, the machine uses
one or multiple sensors to grasp the most information from a user. During the
interpretation state, the system tries to give a meaning to the different information
collected in the previous state. In the computational state, action is taken following the
business logic and dialogue manager rules defined by the developer. In the action state
the machine generates the answer based on the meaning extracted in the interpretation
state. A fission engine determines the most relevant modalities to return the message,
depending on the context of use and the profile of the user. (Dumas et al. 2009)
Figure 1. A representation of multimodal man-machine interaction loop (Dumas et al. 2009).
Oviatt (2012) highlighted that commercially available multimodal interfaces primarily have been developed for mobile use, including cell phones, small PDA handhelds, and
new digital pens. The commercial solutions have avoided co-processing and interpreting
the linguistic meaning of two or more natural input streams. In this regard, they lag
substantially behind far more powerful research-level prototypes, and have yet to reach
their most valuable commercial potential. In some cases, these systems simply have
emphasized capture and reuse of synchronized human communication signals (e.g.,
verbatim speech, pen ink), rather than interpretation and processing of linguistic
meaning at all. (Oviatt 2012)
As stated by Oviatt (2012) there is a growing interest in designing multimodal interfaces
that incorporate vision-based technologies, such as interpretation of gaze, facial

MANU LeanMES Project Documentation
17
expression, head nodding, gesturing and large body movements. These technologies
unobtrusively or passively monitor user behavior and don’t require explicit user
command to a computer. This contrasts with active input modes, such as speech or pens,
which the user deploys intentionally as a command issued to the system. Although
passive modes may be “attentive” and less obtrusive, active modes generally are more
reliable indicators of user intent. As vision-based technologies mature, one important
future direction will be the development of blended multimodal interfaces that combine
both passive and active modes. (Oviatt 2012).
2.5. Adaptive system interfaces
Jameson & Gajos (2012) defined user-adaptive system as “an interactive system that
adapts its behavior to individual users on the basis of processes of user model
acquisition and application that involve some form of learning, inference, or decision
making”. User-adaptive systems are different than adaptable systems, that offer the user
an opportunity to configure or otherwise influence the system’s longer term behavior,
e.g. by choosing options that determine the appearance of the user interface. Jameson &
Gajos (2012) stated that often a carefully chosen combination of adaptation and
adaptability works the best.
Jameson & Gajos (2012) discussed about suitable functions for adaptive systems:
Supporting system use
● Offering help adaptively, e.g. by suggesting the user the commands he/she could
use next.
● Taking over parts of routine tasks, e.g. sorting or filtering e-mail and scheduling
appointments and meetings. Systems of this sort can actually take over two
types of work from the user: 1) choosing what particular action is to be
performed (e.g. which folder a file should be saved in); and 2) performing the
mechanical steps necessary to execute that action.
● Adapting the interface to individual task and usage, i.e. adapting the
presentation and organization of the interface so that it fits better with the user’s
task and usage patterns.
● Adapting the interface to individual abilities, this is useful not only for people
with impairments, but also different environmental factors, such as temperature
may temporarily impair a person’s dexterity, a low level of illumination will
impact reading speed and ambient noise will affect hearing ability. It would be
good especially with mobile devices to adapt to the momentary effective abilities
of users.
Supporting information acquisition
● Helping users to find information, including support for browsing and query-
based search and spontaneous provision of information. The system can e.g.
suggest news articles based on the user’s previous clicks on other articles.
● Recommending products
● Tailoring information presentation. The properties of users that may be taken
into account in the tailoring of documents include: the user’s degree of interest
in particular topics; the user’s preference or need for particular forms of
information presentation; and the display capabilities of the user’s computing
device.

MANU LeanMES Project Documentation
18
3. Guidelines for designing user-centric, human-friendly
interfaces
As stated in the beginning of the report, there are no universal rules for good user-
centric design. However, as the previous sections showed, in general, the human
behavior and cognitive capabilities are not totally unpredictable, and therefore some
guidelines for good user interface design can be given. The guidelines given in this
chapter are general, and can be applied to any user interface design, including the
planner and operator interfaces to the manufacturing operations management systems.
Watzman & Re (2012) listed audit questions for the usable interfaces (see Table 1). The
audit questions A are meant for figuring out the purpose and context of the usage of the
interface, while the audit questions B are more targeted towards finding the most
efficient way to perform the task that is supposed to be performed by using the designed interface.
Table 1. Audit questions for designing usable interfaces (Watzman & Re, 2012).
Audit questions A
● Who are the product users?
● How will this product be used?
● When will this product be used?
● Why will this product be used?
● Where will this product be used?
● How will the process evolve to support this product as it evolves?
Audit questions B
● What is the most efficient, effective way for a user to accomplish a set of tasks
and move on to the next set of tasks?
● How can the information required for product ease of use be presented most
efficiently and effectively?
● How can the design of this product be done to support ease of use and transition
from task to task as a seamless, transparent and even pleasurable experience?
● What are the technical and organizational limits and constraints?
3.1. User characteristics relevant for system design
The human characteristics relevant for design, were thoroughly covered in section 2 in
general level. Here few relevant characteristics, relating to a specific person who will be
using the system, by (Ritter et al. 2014) are summarized:
● Physical characteristics, limitations and disabilities
● Perceptual abilities, strength, and weaknesses
● Frequency of product use

MANU LeanMES Project Documentation
19
● Past experience with same/similar product
● Activity ”mental set” (the attitude towards and level of motivation you have for
the activity)
● Tolerance for error
● Patience and motivation for learning
● Culture/language/population expectations and norms.
3.2. Task analysis
Task analysis provides a way to describe the users’ task and subtasks, the structure and
hierarchy of these tasks, and the knowledge they already have or need to acquire to
perform the tasks. Prescriptive analyses show how the user should carry out the task
(associated with normative behavior). Descriptive analyses, in contrast, show how users
really carry out the task, and are hence associated with actual behavior. (Ritter et al.
2014) Courage et al. (2012) highlighted that task analysis requires watching, listening to
and talking with users. Other people, such as managers and supervisors, and other
information sources, such as print or online documentation are useful only secondarily for a task analysis. Relying on them may lead to false understanding.
In addition to analyzing the users, their characteristics, expectations and level of
experience, it is crucial to consider also the context and environment where the system
is being used. Sutcliffe (2012) states that it is important to gather information on the
location of the use (office, factory floor, public/private space, and hazardous locations),
pertinent environmental variables (ambient light, noise levels, and temperature), usage
conditions (single user, shared use, broadcast), and expected range of locations
(countries, languages and cultures).
Different task analysis methods include (Courage et al. 2012: Ritter et al. 2014):
● Hierarchical task analysis (HTA)
● Task Analysis Grammar (TAG)
● Cognitive task analysis
● GOMS (Goals, Operations, Methods, and Selection rules)
● The keystroke level model
As stated by Courage et al. (2012) the efficiency-oriented, detailed task analyses, such as
TAG and GOMS have a place in evaluating especially those products for which efficiency
on the order of seconds saved is important.
Courage et al. (2012) listed different types of granularity levels for the task analysis:
● Analysis of a person’s typical day or week
● Job analysis: All the goals and tasks that someone does in a specific role – daily,
monthly, or over longer periods
● Workflow analysis: Process analysis, cross-user analysis, how work moves from
person to person
● High-level task analysis: The work needed to accomplish a large goal broken
down into sub-goals and major tasks.
● Procedural analysis: The specific steps and decisions the user takes to
accomplish a task.

MANU LeanMES Project Documentation
20
For presenting the data of the task analysis, several method can be applied, such as
affinity diagrams, artifacts, flow diagrams, personas, scenarios, sequence diagram, user
need tables and user/task matrix. The user/task matrix becomes a major input to a
communication plan – to answer the question of what tasks to include in documentation
for people in different roles. (Courage et al. 2012)
As a result of task analysis, function allocation can be carried out. Function allocation is
done to identify the list of functions that the system (including both the human and the
machine) has to perform. These functions can then be allocated to either human or
machine, e.g. based on Fitt’s list, which is also referred to as the MABA-MABA (Men are
better at, Machines are better at) approach. However, as Ritter et al. brought out, the
designers often allocate all the tasks that they know how to automate, to the technology,
and leave the human to carry out all the others. (Ritter et al. 2014) This may not lead to
task allocation, which would optimize the capability utilization of both human and
machine. Also, if it is e.g. important for the user to learn about the task in order to be
able to take control of it in case of machine failure, it may not be wise to automate the
task completely, as it doesn’t facilitate learning.
3.3. Heuristic principles for designing interfaces with good usability
In this section, the heuristic principles for good UI design, presented by multiple
authors, will be discussed.
Nielsen (1995) listed 10 general usability principles, or heuristics, for user interface
design. They are summarized in the following list:
1. The current system status should always be readily visible to the user.
2. There should be a match between the system and the user’s world: the system
should speak the users language.
3. The user should have the control and freedom to undo and redo functions that
they mistakenly perform.
4. The interface should exhibit consistency and standards so that the same terms
always mean the same thing.
5. Errors should be prevented where possible.
6. Use recognition rather than recall in order to minimize mental workload of the
users.
7. The system should have flexibility and efficiency of use across a range of users,
e.g. through keyboard short-cuts for advanced users.
8. The system should be esthetic and follow a minimalist design, i.e. do not clutter
up the interface with irrelevant information.
9. Users should be helped to manage errors: not all errors can be prevented so
make it easier for the users to recognize, diagnose and recover.
10. Help and documentation should be readily available and structured for ease of
use.
Grice’s (1975) maxims of conversation are often used as a guideline for evaluating what
kind of information should be displayed to the user:
● Maxim of quantity - The message should be made as informative as required.
The message should not be more informative than is required
MANU LeanMES Project Documentation
21
● Maxim of quality - Information that is believed to be false or for which there is
no adequate evidence, should not be displayed.
● Maxim of relevance - Only relevant information should be displayed.
● Maxim of manner - Obscurity of expression and ambiguity should be avoided.
The message should be brief (avoid unnecessary prolixity) and orderly.
Implications of human memory to system design by (Ritter et al. 2014):
● Use words that the users know.
● Use the words consistently to strengthen the chances of later successfully
retrieving these words from the memory.
● Instead of displaying icons, words may be better. This is because retrieving
names from memory is faster than naming objects.
● Systems that allow users to recognize actions they want to do will be easier
initially to use than those that require users to recall command. There is a trade
off, however, when the users become experts.
● Once something has been learned and stored to the long-term memory, it takes
some time to un-learn it. Therefore, the user should not be allowed to learn
incorrect knowledge. It takes a long time to correct this error.
Principles for design to avoid exasperating users by (Hedge 2003):
● Clearly define the system goals and identify potential undesirable system stages
● Provide the user with appropriate procedural information at all times
● Do not provide the user with false, misleading, or incomplete information at any
time
● Know the user
● Build redundancy into the system
● Ensure that critical system conditions are recoverable
● Provide multiple possibilities for workarounds
● Ensure that critical systems personnel are fully trained
● Provide system users with all of the necessary tools
The Gulfs of Evaluation and Execution were discussed in section 2.3. In the following list,
the design principles for making these gulfs narrower are discussed (Norman 1988;
Ritter et al. 2014):
1. Use both the knowledge in the world and the knowledge in the head. Provide
information in the environment to help the user determine the system state and
to perform actions, such as explicit displays of system state, and affordances on
the system controls.
2. Simplify the structure of tasks. Require less of the user by automating sub-tasks,
or using displays to describe information without being asked, or provide
common actions more directly. However, do not reduce this below their natural
level of abstraction.
3. Make the relevant objects and feedback on actions visible. Bridge the Gulf of
Evaluation. Make the state of the system easier to interpret.
4. Make the available actions visible. Bridge the Gulf of Execution. Make the actions
the user can (and should) perform easier to see and to do.

MANU LeanMES Project Documentation
22
5. Get the mappings correct from objects to actions. Make the actions that the user
can apply natural.
6. Exploit the power of constraints, both natural and artificial, to support bridging
each Gulf. Make interpretations of the state and of possible actions easier by
removing actions that are not possible in the current state and reducing the
complexity of the display for objects that are not active or available.
7. Design for error. Users will make errors, so you should expect them and be
aware of their effects. Where errors can not be prevented, try to mitigate their
effects. Help the users see errors and provide support for correcting them.
8. When all else fails, standardize. If the user does not know what to do, allow them
to apply their knowledge of existing standards and interfaces.
3.4. System characteristics and cognitive dimensions
Systems are often evaluated based on seven characteristics (Ritter et al. 2014):
functionality, usability, learnability, efficiency, reliability, maintainability, and
utility/usefulness. The usability has been in the focus of this report. Other important
characteristic is efficiency. When designing user interfaces it is important to remember
that maximal efficiency is not always desired. As stated by Ritter et al. (2014) efficiency must be calculated in terms of technical efficiency that matches user efficiency
expectations of the task at hand. For instance, one-click payments in e-markets without
asking the user to review the order before payment, may be too efficient.
Ritter et al. (2014) presented 14 cognitive dimensions. Their goal was to provide a fairly
small, representative set of labeled dimensions that describe critical ways in which
interfaces, systems and environments can vary from the perspective of usability. The
cognitive dimensions help to discuss and compare alternative designs. These
dimensions focus on the cognitive aspects of interfaces and don’t address design trade-
offs related to the other aspects of users – anthropometric, behavioral and social
aspects. Below are listed the cognitive dimensions from Ritter et al. (2014):
1. Hidden dependencies: how visible the relationships between components are?
2. Viscosity: How easy it is to change objects in the interface?
3. Role-expressiveness: How clear the mappings of the objects are to their
functions?
4. Premature commitment: How soon the user has to decide about something?
5. Hard mental operations: How hard are the mental operations to use the
interface?
6. Secondary notation: The ability to add extra semantics
7. Abstraction: How abstract the operations and systems are?
8. Error-proneness susceptibility: How easy it is to err?
9. Consistency: How uniform the system is (in various ways, including action
mapping)?
10. Visibility: Whether required information is accessible without work by the user.
11. Progressive evaluation: Whether the user can stop in the middle of creating
some notation and check what you have done so far.
12. Provisionality: Whether the user can sketch out ideas without being too exact
13. Diffuseness: How verbose the language is?

MANU LeanMES Project Documentation
23
14. Closeness of mapping: How close the representation in the interface (also
called notation) is to the end results being described?
Hidden dependencies are common for instance in the spreadsheets, which show the
user formulae in one direction only, that is, which cells are used to compute the value in
a cell, but not which cells use a given cell’s value. Another example is that applications
other than created them may be dependent on some files, e.g. graphics in reports.
Usually these dependencies are not visible and deleting the dependent files may be
hazardous. Therefore, all dependencies that may be relevant to the user’s task should be represented. (Ritter et al. 2014)
A viscous system is resistant to change. Even small changes can require substantial
effort, for example changing the numbering of every picture (and text referencing)
manually in Word document. Sometimes viscosity can be beneficial, e.g. it encourages
reflective action and explicit learning. When it is easy to make changes, it can lead to
many small, unnecessary changes being made. Viscosity is important especially in safety
critical applications or applications where incorrect action is expensive in time or
money. Viscosity can be implemented e.g. by asking the user to confirm the action “Do
you really want to do this action?”. (Ritter et al. 2014)
Role-expressiveness describes the extent to which a system reveals the goals of the
designer to the user. The purpose of each component of the system is understandable to
the user, e.g. buttons of the interface should be clearly recognizable as buttons that can
be pressed. Classic problem occurs when two similar looking features achieve different
function or when two different looking functions achieve similar effects. (Ritter et al.
2014)
Some mental operations are harder than others. For instance those operations which
are contradicting with the normal mental models, e.g. having to mentally change the size
of an object (which is normally considered as relatively constant aspect of an object) is
more difficult than applying simple rules of behavior. Also mentally rotating objects is
slower with larger objects than with small ones. Hard mental operations are easy to
implement computationally, but troublesome for users. Hard mental operations can be
solved at several levels, including either by avoiding the problem by understanding the
relative difficulty of operations, or by providing tools to assist in these operations.
(Ritter et al. 2014)
3.5. Design of multimodal interfaces
Human cognitive capacity is limited. Sometimes the limited resources may lead to
multimedia usability problems, discussed by Sutcliffe (2012):
● Capacity overflow may happen when too much information is presented in a
short period, swamping the user’s limited working memory and cognitive
processor’s capability to comprehend, chunk, and then memorize or use the
information. The connotation is to give users control over the pace of
information delivery.
● Integration problems arise when the message on two media is different, making
integration in working memory difficult; this leads to the thematic congruence
principle.

MANU LeanMES Project Documentation
24
● Contention problems are caused by conflicting attention between dynamic
media, and when two inputs compete for the same cognitive resources. For
example speech and text require language understanding.
● Comprehension is related to congruence; we understand the world by making
sense of it with our existing long-term memory. Consequently, if multimedia
content is unfamiliar, we cannot make sense of it.
● Multitasking makes further demands on our cognitive processes, so we will
experience difficulty in attending to multimedia input while performing output
tasks.
In task-driven applications, the information requirements are derived from the task
model. In information-provision applications, such as websites with an informative role,
information analysis involves categorization and the architecture generally follows a
hierarchical model. In the third class of explanatory or thematic applications, analysis is
concerned with the story or argument that is, how the information should be explained
or delivered. (Sutcliffe, 2012)
Sutcliffe (2012) presented the classification for information components:
● Physical items relating to tangible observable aspects of the world
● Spatial items relating to geography and location in the world
● Conceptual-abstract information, facts, and concepts related to language
● Static information which does not change: objects, entities, relationships, states,
and attributes
● Dynamic, or time-varying information: events, actions, activities, procedures,
and movements
● Descriptive information, attributes of objects and entities
● Values and numbers
● Causal explanations
Sutcliffe (2012) suggested the following heuristics, collected from multiple sources, for
appropriate media selection:
● To convey detail, use static media, for example, text for language-based content,
diagrams for models, or still image for physical detail of objects.
● To engage the user and draw attention, use dynamic media, e.g. video, animation,
or speech.
● For spatial information, use diagrams, maps, with photographic images to
illustrate detail, and animations to indicate pathways.
● For values and quantitative information, use charts and graphs for overviews
and trends, supplemented by tables for detail.
● Abstract concepts, relationships, and models should be illustrated with diagrams
explained by text captions and speech to give supplementary information.
● Complex actions and procedures should be illustrated as a slideshow of images
for each step, followed by a video of the whole sequence to integrate the steps.
Text captions on the still images and speech commentary provide
supplementary information. Text and bullet points summarize steps at the end,
so choice trade-offs may be constrained by cost and quality considerations.

MANU LeanMES Project Documentation
25
● To explain causality, still and moving image media need to be combined with
text.
Payne (2012) referred to other research on multimedia instructions (Mayer & Moreno
2002). Following principles were summarized:
● The multiple presentation principle states that explanations in words and
pictures will be more effective than explanations that use only words. When
words only are presented, learners may find it difficult to construct an
appropriate mental image, and this difficulty may block effective learning.
Studies have offered support for the general idea that learners will acquire
richer knowledge from narration and animation than from narration alone.
● The contiguity principle is the claim that simultaneous, as opposed to successive,
presentation of visual and verbal materials is preferred.
● The chunking principle refers to a situation in which visual and verbal
information must be presented successively, or alternately (against the
contiguity principle). It states that learners will demonstrate better learning
when such alternation takes place in short rather than long segments. The
reasoning is straightforward, given the assumptions of the framework: working
memory may become overloaded by having to hold large chunks before
connections can be formed.
3.6. Design for Errors
Errors often arise as a combination of factors at the anthropomorphic, behavioral,
cognitive and social levels in the ABCS framework. Each of the components – people,
technology, context – can give rise to errors. There are different type of errors such as
“slips”, which refer to errors that occur when someone knows the right thing to do, but
accidentally do something different, e.g pressing wrong buttons while typing; or
“mistakes”, which refer to errors that occur when the action is taken on the basis of an
incorrect plan. One specific type of errors is post-completion errors. These arise when
the goal for the task has been completed, but the goals for the subtasks have not. A good
example of such situation is getting the money from the ATM, but forgetting the card to
the machine. Good interface design can can help to reduce the errors that may happen
while interacting with the interface. The first step in “design for error” is to identify the
situations that can lead to erroneous performance. Secondly, appropriate mechanisms
must be put in place to either prevent the errors, or at least mitigate the adverse
consequences arising from those errors. For example, in order to avoid the post-
completion errors, the system should discourage the user from believing that they have
completed the task until all the important sub-parts are done, and to put the most
important goal last, where technology and the situation permits. Good design can help
provide more feedback on performance, and could also provide education along the way
about how to correct problems. (Ritter et al. 2014)

MANU LeanMES Project Documentation
26
3.7. Display Designs
Displays are human-made artefacts designed to support the perception of relevant
system variables and to facilitate further processing of that information. A user must be
able to process whatever information that a system generates and displays; therefore,
the information must be displayed according to principles in a manner that will support
perception, situation awareness, and understanding. The term “display” doesn’t refer
only to visual displays, but includes all medias that are used to provide information to
the users (e.g. audio and haptic devices). (Wickens et al. 2004)
3.7.1. Thirteen principles of display design
Wickens et al. (2004) defined 13 principles of display design. These principles of human
perception and information processing can be utilized to create an effective display
design. The potential benefits of applying these principles are expected to be, for
instance: a reduction in errors, a reduction in required training time, an increase in
efficiency, and an increase in user satisfaction. It has to be noted that not all the
principles are applicable to all displays or situations and may even seem to be
conflicting. The principles may be tailored to the specific situation.
Perceptual principles
1. Make displays legible (or audible). A display’s legibility is critical and necessary
for designing a usable display. If the characters or objects being displayed cannot
be discernible, then the operator cannot effectively make use of them.
2. Avoid absolute judgment limits. Do not ask the user to determine the level of a
variable on the basis of a single sensory variable (e.g. color, size, loudness).
These sensory variables can contain many possible levels.
3. Top-down processing. Signals are likely perceived and interpreted in accordance
with what is expected based on a user’s past experience. If a signal is presented
contrary to the user’s expectation, more physical evidence of that signal may
need to be presented to assure that it is understood correctly.
4. Redundancy gain. If a signal is presented more than once, it is more likely that it
will be understood correctly. This can be done by presenting the signal in
alternative physical forms (e.g. color and shape, voice and print, etc.), as
redundancy does not imply repetition. A traffic light is a good example of
redundancy, as color and position are redundant.
5. Similarity causes confusion: Use discriminable elements. Signals that appear to be
similar will likely be confused. The ratio of similar features to different features
causes signals to be similar. For example, A423B9 is more similar to A423B8
than 92 is to 93. Unnecessary similar features should be removed and dissimilar
features should be highlighted.
Mental model principles
6. Principle of pictorial realism. A display should look like the variable that it
represents (e.g. high temperature on a thermometer shown as a higher vertical
level). If there are multiple elements, they can be configured in a manner that
looks like it would in the represented environment.

MANU LeanMES Project Documentation
27
7. Principle of the moving part. Moving elements should move in a pattern and
direction compatible with the user’s mental model of how it actually moves in
the system. For example, the moving element on an altimeter should move
upward with increasing altitude.
Principles based on attention
8. Minimizing information access cost. When the user’s attention is diverted from
one location to another to access necessary information, there is an associated
cost in time or effort. A display design should minimize this cost by allowing for
frequently accessed sources to be located at the nearest possible position.
However, adequate legibility should not be sacrificed to reduce this cost.
9. Proximity compatibility principle. Divided attention between two information
sources may be necessary for the completion of one task. These sources must be
mentally integrated and are defined to have close mental proximity. Information
access costs should be low, which can be achieved in many ways (e.g. proximity,
linkage by common colors, patterns, shapes, etc.). However, close display
proximity can be harmful by causing too much clutter.
10. Principle of multiple resources. A user can more easily process information across
different resources. For example, visual and auditory information can be
presented simultaneously rather than presenting all visual or all auditory
information.
Memory principles
11. Replace memory with visual information: knowledge in the world. A user should
not need to retain important information solely in working memory or retrieve
it from long-term memory. A menu, checklist, or another display can aid the user
by easing the use of their memory. However, the use of memory may sometimes
benefit the user by eliminating the need to reference some type of knowledge in
the world (e.g. an expert computer operator would rather use direct commands
from memory than refer to a manual). The use of knowledge in a user’s head and
knowledge in the world must be balanced for an effective design.
12. Principle of predictive aiding. Proactive actions are usually more effective than
reactive actions. A display should attempt to eliminate resource-demanding
cognitive tasks and replace them with simpler perceptual tasks to reduce the use
of the user’s mental resources. This will allow the user to not only focus on
current conditions, but also think about possible future conditions. An example
of a predictive aid is a road sign displaying the distance to a certain destination.
13. Principle of consistency. Old habits from other displays will easily transfer to
support processing of new displays if they are designed in a consistent manner.
A user’s long-term memory will trigger actions that are expected to be
appropriate. A design must accept this fact and utilize consistency among
different displays.

MANU LeanMES Project Documentation
28
3.7.2. Visual design principles for good design
The universal principles of visual communication and organization are (Watzman & Re,
2012):
● Harmony - Refers to grouping of related parts, so that all the elements combine
logically to make a unified whole. In interface design this is achieved when all
design elements work in unity.
● Balance - Offers equilibrium or rest. Provides the equivalent of a center of
gravity that grounds the page. Without balance, the page collapses, all elements
are seen as dispersed and content is lost. Balance can be achieved by using
symmetry or asymmetry.
● Simplicity - Is the embodiment of clarity, elegance and economy. Involves
distillation – every element is indispensable, if an element is removed, the
composition falls apart. Two common guidelines to achieve simplicity are: ”less
is more” and ”When in doubt, leave it out”.
Several things have to be considered when designing visual communications, such as
web pages, different visual displays or dashboards. These include aspects such as
typography, color, field of vision, page layout design, graphs and charts and. amount of
information on display.
Typography
Typographic choice affects legibility and readability, meaning the ability to easily see
and understand what is on a page. Legibility, the speed at which letters and the words
built from them can be recognised, refers to perception. Readability, the facility and ease
with which text can be read, refers to comprehension. Regardless of the media, legibility
and readability depends on different variables, such as point size, letter pairing, word
spacing, line length and leading, resolution, color and organisational strategies, such as
text clustering. Type size is also dependent on the resolution offered by output and
viewing devices, color usage, context, and other design issues. In choosing a typeface, its
style, size, spacing and leading, the designer should think about the final output medium
and examine this technology’s effect on legibility. Low quality monitors and poor
lighting have a major impact: serifs sometimes disappear, letters in small bold type fill in
and colored type may disappear altogether. Line spacing effects in such way that when
there is greater space between the words than there is between lines, the reader’s eye
naturally falls to the closest word, which may be below instead of across the line. White
on black (or light on a dark background) is generally regarded as less legible and much
more difficult to read over large areas, compared to the colors being other way around.
(Watzman & Re, 2012)
Color
The appropriate use of color can make it easier for users to absorb large amounts of
information and differentiate information types and hierarchies. Color is often used to:
Show qualitative differences; Act as a guide through information; Attract
attention/highlight key data; Indicate qualitative changes; Depict physical objects
accurately. For color to be effective, it should be used as an integral part of the design
program, to reinforce meaning and not simply as decoration. One important thing to
remember is that at least 9% of the population, mostly male, is color-deficient to some
degree, so color shouldn’t be used as an only cue. This is especially important in critical

MANU LeanMES Project Documentation
29
situations, such as warnings. Therefore color should be used as a redundant cue when
possible. (Watzman & Re, 2012)
Field of vision
Field of vision refers to what a user can see on a page with little or no eye movement. A
good design places key elements in the primary field of vision, reflecting and reinforcing
the information hierarchy. Size, contrast, grouping, relationships, and movement are
tools that create and reinforce field of vision. The user first sees what is visually
strongest, not necessarily what is largest or highest. Animated cues, such as blinking
cursors and other implied structural elements like handles around selected areas
become powerful navigational tools if intuitively understood and predictably applied.
(Watzman & Re, 2012)
Page design
Two important functions of page design are motivation and accessibility. A well-
designed page is inviting, drawing the eye into the information. Motivation and
accessibility are accomplished by providing the reader with ways to quickly understand
the information hierarchy. At a glance, the page design should reveal easy navigation
and clear, intuitive paths to discovering additional details and information. This is called
visual mapping. A visually mapped product has:
● An underlying visual structure or grid, organizational landmarks, graphic cues
and other reader aids;
● Distinctly differentiated information types;
● Clearly structured examples, procedures, and reference tools;
● Well-captioned and annotated diagrams, matrices, charts, and graphics.
Grid enables a user to navigate a page quickly and easily. A grid specifies placement for
all visual elements. The user anticipates where a button will appear or how help is
accessed. A well-designed page should give a hint at all topics contained in the site,
provide high-level information about these topics, and suggest easy paths to access this
information. Consistent use of type, page structure, and graphic and navigational
elements creates a visual language that decreases the amount of effort it takes to read
and understand a communication piece. (Watzman & Re, 2012) The Gestalt principles,
illustrated in Figure 2, shows how different objects should be placed on the display, if
they should be regarded as a group by the user (Ritter et al. 2014).

MANU LeanMES Project Documentation
30
Figure 2. Gestalt principles of visual grouping (Ritter et al. 2014).
Charts, diagrams, graphics and icons
People don’t have time to read. Therefore, in general, the users prefer well-designed
charts, diagrams, and illustrations that quickly and clearly communicate complex ideas and information. It is very difficult to create an icon that, without explanation,
communicates a concept across cultures. If an icon must be labeled, it is really an
illustration and the icon’s value as visual shorthand is lost. It is better to use a word or
short phrase rather than word and image when screen space is at minimum. (Watzman
& Re, 2012) On the other hand, Ritter et al. (2014) suggested that the use of icons can be
eased by text that appear on top of the icon, when going close with the mouse.
Photograph can easily represent an existing object, but issues relating to resolution and
cross-media publishing can make it unintelligible. Illustrations allow to present abstract
concepts or objects that do not exist and it can help to focus the viewer’s attention to a
certain detail. Graphics are invaluable tools for promoting additional learning and
action, because they reinforce the message, increase information retention and shorten
comprehension time. Different people learn through different cognitive modes or styles.
Therefore it may be wise to use various modes, such as text, charts, photos or allow the
mode to be customized. (Watzman & Re, 2012)
Amount of information
Especially, the hand-held devices have very limited space for presenting the
information. When evaluating how much information should be presented in the screen,
the demands from cognitive and visual perspectives may be contradicting. Schlick et al
(2012) stated that presenting little information on a screen at time helps to avoid
visibility problems resulting from high-information density. On the other hand,

MANU LeanMES Project Documentation
31
presenting as much information on screen as possible allows users to have maximum
foresight (cognitive preview) of other functions on the menu, which should benefit
information access from a cognitive point of view and minimize disorientation. (Schlick
et al. 2012)

MANU LeanMES Project Documentation
32
4. Human-machine interaction technologies
As discussed by Danielis (2014), after the industry has already undergone three
revolutions in the form of mechanization, electrification, and informatization, as fourth
industrial revolution, the Internet of Things and Services is predicted to find its way into
the factory. For this development, e.g., in Germany the term “Industry 4.0” has been
created. The vision is the so-called Smart Factory with novel production logic: The
products are intelligent and can be identified clearly, constantly located, and are aware
of their current state. These embedded production systems shall be interconnected with
economic processes vertically and combined to a distributed real-time (RT) capable
network horizontally. (Danielis 2014) An important role will be played by the paradigm
shift in human-technology and human-environment interaction brought about by
Industrie 4.0, with novel forms of collaborative factory work that can be performed
outside of the factory in virtual, mobile workplaces. Employees will be supported in
their work by smart assistance systems with multimodal, user-friendly user interfaces.
(INDUSTRIE 4.0. 2013)
The ongoing transformation towards digital manufacturing paves the way for adoption
of novel user interfaces for factory floor operators. While many of the technologies for
instance for augmented reality have been there for quite some time, their use in
industrial context has been rare to date (Nee et al. 2012). Adoption of manufacturing IT-
systems, such as MES (Manufacturing Execution System), will support the real time data
collection from the manufacturing operations in a digital format. This data, earlier non-
existent, can then be used throughout the organization for better and more
synchronized management and control of the operations. Such digitalization will also
allow the relevant real time information to be displayed to the factory workers through
multitude of different user interface technologies
This chapter will introduce some of the available and emerging human-machine
interaction technologies and show some examples of the applications. It will start by
discussing about direct and indirect input devices in general, after which it introduces
specific technologies, such as mobile devices, augmented reality, speech and gesture
recognition, in more detail. Each technology will be evaluated based on their technology
readiness levels (TRL), which are commonly used in European Commission’s (EC)
Horizon 2020 program. The evaluation is done based on the material available on the
technologies. The focus in this report is mainly between commercial and prototype
technologies. The technology readiness levels are, as defined by EC, the following:
TRL 0: Idea. Unproven concept, no testing has been performed.
TRL 1: Basic research. Principles postulated and observed but no experimental proof
available.
TRL 2: Technology formulation. Concept and application have been formulated.
TRL 3: Applied research. First laboratory tests completed; proof of concept.
TRL 4: Small scale prototype built in a laboratory environment ("ugly" prototype).
TRL 5: Large scale prototype tested in intended environment.
TRL 6: Prototype system tested in intended environment close to expected
performance.
TRL 7: Demonstration system operating in operational environment at pre-
commercial scale.
TRL 8: First of a kind commercial system. Manufacturing issues solved.

MANU LeanMES Project Documentation
33
TRL 9: Full commercial application, technology available for consumers.
4.1. Direct and indirect input devices
In human-computer interaction, the human has to be able to give the commands and
input information to the computer in some way. The input devices can be either direct
or in-direct. This section will give examples of the devices belonging to these two
categories and introduce the characteristics of direct and in-direct input devices.
A direct-input device has a unified input and display surface. Indirect input device does
not provide input in the same physical space as the output. Examples of direct input
devices are touch screens and display tablets operated with a pen (or other stylus). In
contrast, e.g. mouse is an indirect input device, because the user must move the mouse
on a surface (the desk) to indicate a point on another surface (the screen). (Hinckley &
Wigdor, 2012) Welsh et al. (2012) stated, that even though mouse, keyboard and
joystick devices will continue to dominate for the near future, embodied, gestural and
tangible interfaces – where individuals use their body to directly manipulate
information objects – are rapidly changing the computing landscape. Example is the
touchscreen, which allows user to, instead of pointing and clicking with a mouse, to
directly pull, push, grab, pinch, squeeze, crush and throw virtual objects. The user
doesn’t need to use dissociated (mouse) and/or arbitrary (keyboard and joystick)
sensorimotor mappings to achieve his/her goals. These new modes of interaction allow
more direct mapping of the user’s movements on to the workspace. (Welsh et al. 2012)
Touch screen is the most common example of direct input devices. They are used for
instance in tablet devices, mobile phones, laptop screens and large wall-mounted
displays. There exist different kind of touch screen types (Hinckley & Wigdor 2012;
Schlink et al. 2012):
● Resistive touch screens - React to pressure generated by finger or stylus.
Require pressure and may be fatiguing to use, but can be used by operators
wearing gloves.
● Capacitive touch screens - A human touch on the screen’s surface results in an
alteration of the human body’s electrostatic field, which is measured as a change
in capacitance. Require contact from bare fingers in order the touch be sensed.
However, soft touch is enough.
● Surface acoustic wave touch screens - Use ultrasonic wave created by a
fingertip on the surface.
● Optical touch screen - Use several optical sensors around the corners of the
screen to identify the location of the movement or touch.
● Dispersive signal touch screens - Detect the mechanical load created by a
touch.
● Strain gauge touch screens - Are also known as force panel technology. Are
spring mounted in every corner. Identify the corresponding deflection when the
screen is touched and locates it.
Touch screens can also be divided into single touch and multiple touch screens. Single
touch interfaces are able to detect only one touch point at a time. They resemble mouse
and are good for pointing. Multi-touch interface is able to detect multiple fingers (i.e.

MANU LeanMES Project Documentation
34
touch points) simultaneously and can be thus used e.g. for “pinch to zoom”. Capacitive
screens, optical (infrared) screens, and most recently resistive screens, can be used for
multi-touch purpose. (Schlick et al. 2012)
Hinckley and Wigdor (2012) highlighted, that direct input on wall-mounted displays is
commonplace, but the constant physical movement required can become burdensome.
Interacting with portions of the display, that are out of the view or beyond arm’s length,
may also raise challenges. As stated by Hinckley & Wigdor (2012), indirect input scales
better to large interaction surfaces, because it requires less body movement and also
allows interaction at a distance from the display.
Input technologies, which use gestures and other body input, are also categorized as
direct input devices. Gestures are considered as a natural way of interacting with
machines. However, in gesture-based interaction, the main challenge is to correctly
identify when a gesture, as opposed to and identical hand movements, starts and stops.
It is not so clear when the user is actually trying to interact with the machine and when
not. Similar challenge exists with speech interfaces. Also, gesture and other body input
may cause fatigue, e.g. if one’s arms have to be extended for long periods of time.
Indirect input devices can be divided into absolute and relative input devices. An
absolute input device senses the position of an input and passes this message to the
operating system. Relative devices sense only changes in position. Absolute mode is
generally preferable for tasks such as drawing, handwriting an tracing, whereas relative
mode may be preferable for traditional desktop graphical user interaction task, such as
selecting icons or navigating through menus. (Hinckley & Wigdor, 2012)
Common indirect input devices, in addition to mice and keyboards, are touchpads,
trackballs and joysticks (Hinckley & Wigdor, 2012):
● Touchpads are small, touch-sensitive tablets, which are often used in laptop
computers. Usually they use relative mode for cursor control, because they are
too small to map to an entire screen. The small size of the touchpad necessitates
frequent clutching, and may require two hands to hold down the button.
● Trackball senses the relative motion of a partially exposed ball in two degrees of
freedom. They may require frequent clutching movements because users must
lift and reposition their hand after rolling the ball through a short distance.
● Joysticks: Isometric joystick is a force-sensing joystick that returns to the center
when released. Isotonic joysticks sense the angle of deflection.
Keyboards are either indirect or direct input devices. The graphical keyboards of touch
screens are direct input devices. Many factors influence typing performance with
keyboards, including key size, key shape, activation force, key travel distance and the
tactile and auditory feedback provided by striking the keys. Touch screens’ graphical
keyboards require significant visual attention, because the user must look at the screen
to press the correct key. The quality of tactile feedback is poor when compared with a
physical keyboard because the user can not feel the key boundaries. A graphical
keyboard (as well as the user’s hand) occludes a significant portion of a device’s screen,
resulting in less space for the document itself. Furthermore, because the user typically
cannot rest his/her fingers in contact with the display (as one can with mechanical keys)
and also because the user must carefully keep other fingers pulled back so as to not

MANU LeanMES Project Documentation
35
accidentally touch keys other than the intended ones, extended use of touch-screen
keyboards can be fatiguing. (Hinckley & Wigdor, 2012)
4.2. Mobile Interfaces and Remote Sensors
The basic consumers of mobile devices, such as smart phones and tablets, use such
devices for the purpose of media consumption, picture/video capture, social
collaboration, web browsing, communication, games, mapping and route planning.
Recently industry has found mobile devices useful; however the changes are happening
slowly. Future manufacturing operator tools are based on mobile communication,
decision support and IT, enhancing operator capability. The Operator of the Future1 -
project in Sweden has developed and tested concepts, relying on mobile technologies,
such as adaptive work instructions, dynamic checklists, logbook, reporting, localization,
remote support, decision support, statistics, remote monitoring and control.
The global market requires that decisions are taken as quickly as possible, even if people
who are responsible for it are out of physical limits of their companies. Therefore the
possibility to access critical information anywhere and anytime, with mobile devices, is
an indispensable key. For example, as stated by Moran (2013) with MES mobile
applications, data is made available on demand regardless of physical location,
providing real-time insight into operational and business performance. In
manufacturing, abnormal operating events that require action can occur at any time and
it is important that the right resources are aware of these events as near to real-time as
possible to minimize the impact on profitability. (Moran 2013)
Researchers have been interested in implementing mobile devices to set remote access
to HMIs recently. Using web services is one way for this integration Cavalcanti (2009)
described architecture of a system that provides access to factory floor information from
cell phones which can be called remote monitoring. The system uses many
communication technologies like OPC and Web Services enabling the critical
information like setpoints, alarms and thresholds to be viewed on the cell phone, from
anywhere. (Cavalcanti 2009).
Moreover, the use of wireless technologies has aimed to make the interfaces more flexible, simplify the installation, and target to cost effectiveness. The connections in
these technologies need highly reliable conditions even in severe environments. The
wireless systems have to deal with upper layer systems as well as other sensors in the
design. Therefore, communication protocols that are able to connect to the system are
necessary. Previous research has aimed for developing core technologies to implement
wireless technology in industrial use. Researched aspects are such as: 1) Creating
reliable low power mesh networks. The focus is on how mesh nodes in the system
decide to connect and how to minimize the number of routing tables required in an IP
network. Reliability also requires time synchronization of data transmission. 2)
Considering redundant routes between wireless system and upper layers and avoiding
density at the gateways. 3) Creating a seamless communication which has been possible
by IPv6 technologies application on nodes. 4) Final core has been to make modules ultra
low power.. In this way is that the interface will be fast, reliable and easy to access via
environment network. (Yamaji 2008)
1 Operator of the Future by Chalmers 2015. [Available in: http://www.chalmers.se/hosted/frop-en]

MANU LeanMES Project Documentation
36
4.2.1. Mobile Device and Remote Sensor Technologies
Tablet and smart phone devices
Tablets are familiar devices from the home use. They are slowly finding their ways to
the industrial use as well. Most of such devices have touch screen display, which is
operated by fingers or stylus. One example of a tablet device is a Motorola ET1
Enterprise2 (TRL9), released on 2011 (Figure 3). It is designed especially for use in
manufacturing companies. Double user log-in, integrated optical barcode scanner, and
swappable battery packs with a multi touch panel are some features of this tablet. The
operating system may be reached through several mobile Motorola devices which are
running android, windows, or windows CE. The device is equipped with WLAN, GPS, and
android 4.1.1 as operating system.
Figure 3. Motorola ET1 Enterprise Tablet. (Figure from Motorola America ET1 Enterprise page
2015).
Smart Watches
A smart watch is a watch that has more capabilities than only timekeeping. Modern
smart watches have similar operating system or sometimes even the same as in a mobile
phone. Such devices can have features like camera, accelerometer, thermometer,
altimeter, barometer, compass, cell phone, touch screen, GPS navigation, speaker, map
display, watch, a mass storage distinguishable by a computer, and a rechargeable
2 Motorola ET1 Enterprise Tablet 2015. [Available in: http://www.motorolasolutions.com/US-
EN/Business+Product+and+Services/Tablets/ET1+Enterprise+Tablet]
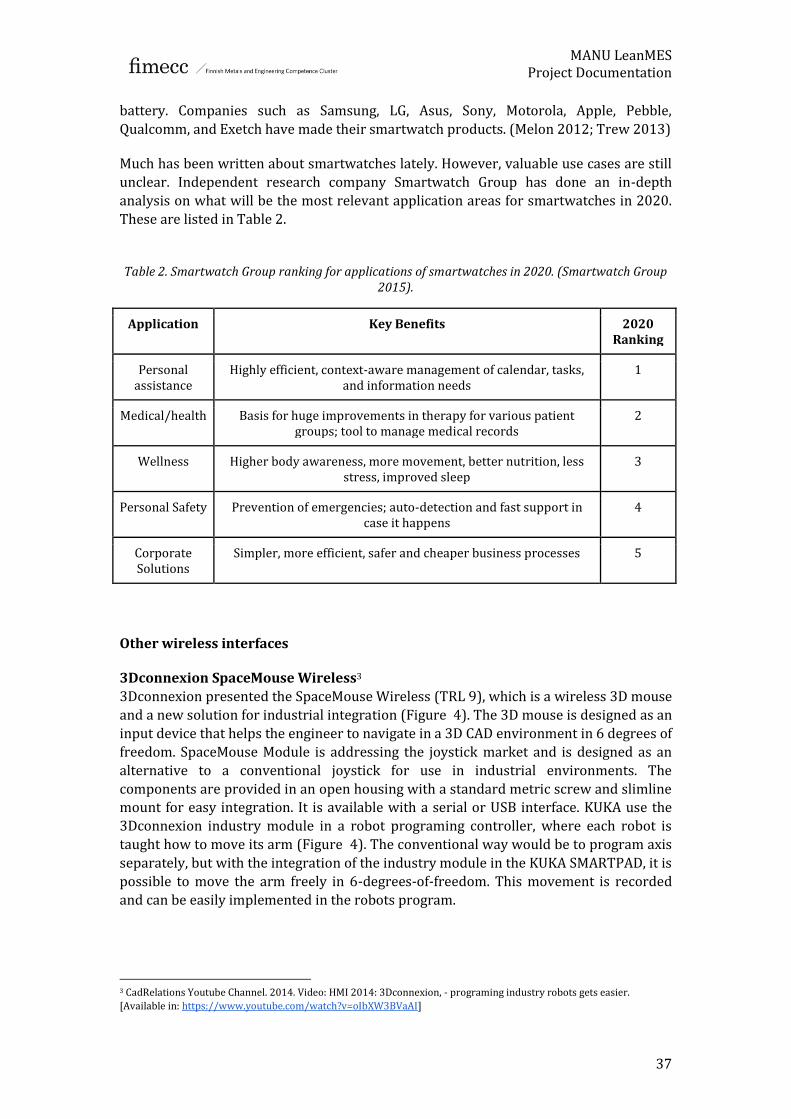
MANU LeanMES Project Documentation
37
battery. Companies such as Samsung, LG, Asus, Sony, Motorola, Apple, Pebble,
Qualcomm, and Exetch have made their smartwatch products. (Melon 2012; Trew 2013)
Much has been written about smartwatches lately. However, valuable use cases are still
unclear. Independent research company Smartwatch Group has done an in-depth
analysis on what will be the most relevant application areas for smartwatches in 2020.
These are listed in Table 2.
Table 2. Smartwatch Group ranking for applications of smartwatches in 2020. (Smartwatch Group
2015).
Application Key Benefits 2020 Ranking
Personal assistance
Highly efficient, context-aware management of calendar, tasks, and information needs
1
Medical/health Basis for huge improvements in therapy for various patient groups; tool to manage medical records
2
Wellness Higher body awareness, more movement, better nutrition, less stress, improved sleep
3
Personal Safety Prevention of emergencies; auto-detection and fast support in case it happens
4
Corporate Solutions
Simpler, more efficient, safer and cheaper business processes 5
Other wireless interfaces
3Dconnexion SpaceMouse Wireless3
3Dconnexion presented the SpaceMouse Wireless (TRL 9), which is a wireless 3D mouse
and a new solution for industrial integration (Figure 4). The 3D mouse is designed as an
input device that helps the engineer to navigate in a 3D CAD environment in 6 degrees of
freedom. SpaceMouse Module is addressing the joystick market and is designed as an
alternative to a conventional joystick for use in industrial environments. The
components are provided in an open housing with a standard metric screw and slimline mount for easy integration. It is available with a serial or USB interface. KUKA use the
3Dconnexion industry module in a robot programing controller, where each robot is
taught how to move its arm (Figure 4). The conventional way would be to program axis
separately, but with the integration of the industry module in the KUKA SMARTPAD, it is
possible to move the arm freely in 6-degrees-of-freedom. This movement is recorded
and can be easily implemented in the robots program.
3 CadRelations Youtube Channel. 2014. Video: HMI 2014: 3Dconnexion, - programing industry robots gets easier.
[Available in: https://www.youtube.com/watch?v=oIbXW3BVaAI]

MANU LeanMES Project Documentation
38
Figure 4. 3Dconnexion SpaceMouse Wireless used in KUKA robot controller panel. (Screenshot from
HMI 2014: 3Dconnexion 2014).
Electronic Paper
Electronic paper is a technology that tries to show screens like ordinary paper. The
difference with backlight papers is the trial to reflect light and empty pixels like normal
papers. Use cases for electronic paper are wrist watches, eBooks, newspapers, displays
embedded in smart cards, status displays, mobile phones, and electronic shelf labels.
Moreover, electronic papers can also be used in in production environment as easily
updateable Kanban cards. (Dilip 2010)
An electronic shelf label (ESL) is an interesting case to be used in warehouses and shop
floor which is for labeling the price or quantity of a product (Figure 5). A communication
network allows the display to be automatically updated whenever a product price or
amount in warehouse is changed. This communication network is the true differentiation and what really makes ESL a viable solution. The wireless
communication must support reasonable range, speed, battery life, and reliability. The
means of wireless communication can be based on radio, infrared or even visible light
communication. Currently, the ESL market leans heavily towards radio frequency based
ESL solutions. Automated ESL systems reduce labor costs of pricing management,
improve pricing accuracy and allow dynamic pricing. Dynamic pricing is the concept in
which retailers can fluctuate pricing to match demand, online competition, inventory
levels, shelf-life of items, and to create promotions. (Dilip 2010)

MANU LeanMES Project Documentation
39
Figure 5. An electronic shelf label (ESL). (Screenshot smarttag from vmsd online page September
2013).
Remote sensors – Example: Irisys people counting System4
InfraRed Integrated Systems Ltd. has made an infrared system so called Irisys People
Counting (TRL 9), which sensors are designed to detect the heat emitted by people
passing underneath it as infrared radiation (Figure 6). The units contain imaging optics,
sensors, signal processing and interfacing electronics all within a discretely designed
moulded housing. Up to eight virtual counting lines are defined by an operator using a
portable PC setup tool, and people are counted as they pass each line in a defined
direction. Mounting heights of between 2.2m and 4.8m can be accommodated with the
standard lens. Other lens options are available to cover higher mounting heights.
4 Irisys People Counting 2015. [Available in: http://www.irisys.net/people-counting]
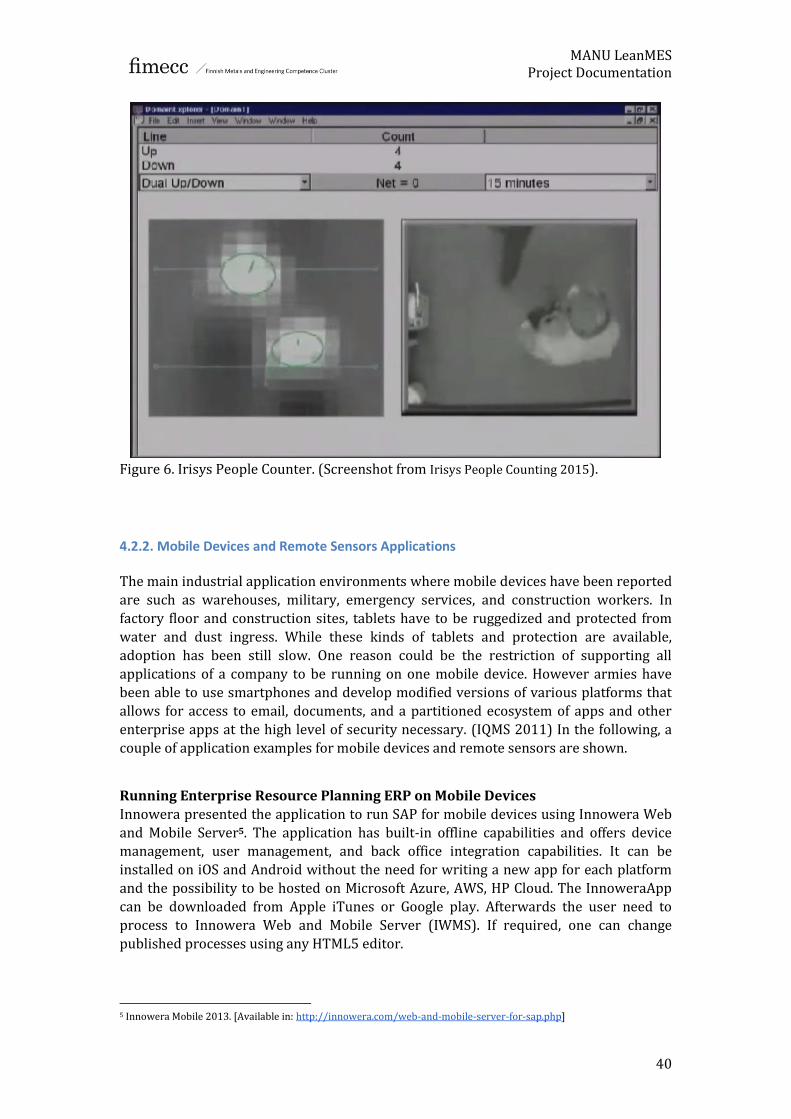
MANU LeanMES Project Documentation
40
Figure 6. Irisys People Counter. (Screenshot from Irisys People Counting 2015).
4.2.2. Mobile Devices and Remote Sensors Applications
The main industrial application environments where mobile devices have been reported
are such as warehouses, military, emergency services, and construction workers. In
factory floor and construction sites, tablets have to be ruggedized and protected from
water and dust ingress. While these kinds of tablets and protection are available,
adoption has been still slow. One reason could be the restriction of supporting all
applications of a company to be running on one mobile device. However armies have
been able to use smartphones and develop modified versions of various platforms that
allows for access to email, documents, and a partitioned ecosystem of apps and other
enterprise apps at the high level of security necessary. (IQMS 2011) In the following, a
couple of application examples for mobile devices and remote sensors are shown.
Running Enterprise Resource Planning ERP on Mobile Devices
Innowera presented the application to run SAP for mobile devices using Innowera Web
and Mobile Server5. The application has built-in offline capabilities and offers device
management, user management, and back office integration capabilities. It can be
installed on iOS and Android without the need for writing a new app for each platform
and the possibility to be hosted on Microsoft Azure, AWS, HP Cloud. The InnoweraApp
can be downloaded from Apple iTunes or Google play. Afterwards the user need to
process to Innowera Web and Mobile Server (IWMS). If required, one can change
published processes using any HTML5 editor.
5 Innowera Mobile 2013. [Available in: http://innowera.com/web-and-mobile-server-for-sap.php]

MANU LeanMES Project Documentation
41
IQMS EnterpriseIQ mobile technology6
(TRL 9) extends manufacturing of ERP
functionality with real-time manufacturing, MES and ERP information on the go via
smart phones, PDAs, and tablets. IQMS’ ERP software allows checking production
process in real-time, take record and tries to give a full integration in ERP system. Strong
data encryption, as well as user defined security roles, ensure data is secure as taking
advantage of options such as CRM, document control, lot number changes, production
and reject reporting, quick inspections, real-time work center monitoring.
Pro-face Remote HMI7
Pro-face is software for developing human-machine interfaces (HMIs). Pro-face Remote
(TRL 9) is an HMI prepared and designed for implementing on tablets and smartphones.
Systems integrators on factory floor may use it for checking I/Os, what happened on the
system or following the machine steps and movements (Figure 7). The system status
monitoring may be synchronous or asynchronous. The system alarms may be viewed on
mobile device and in drastic cases it is easy to reach the right person contact info for
taking proper actions. Snapouts and remote monitoring are other features to be used.
Figure 7. Checking the machine movement with tablet device by Proface Remote HMI. (Screenshot
from Pro-face Remote HMI intro video 2013).
Tablets on factory floor and warehouse
Companies such as Cheer Packs North America8 use Microsoft Surface Pro tablet (TRL 9)
for office people, warehouse and quality management. In Figure 8 a quality specialist is
auditing on factory floor, inputting information and taking pictures to the quality
management software by using a Surface Pro device. As a task, user can take evidence of
possible problems, send it to someone else or save it for a future process. Based on the
employee feedback, the device has improved time efficiency, as it saves time from
operators, supervisors and quality inspectors in walking between different screens for
monitoring and information input.
6 IQMS Mobile ERP Apps for Manufacturing Companies 2015. [Available in: http://www.iqms.com/products/mobile-erp-
software.html] 7 Pro-face Remote HMI 2015. [Available in: http://www.profaceamerica.com/en-US/content/remote-hmi] 8 Surface Pro Youtube Channel. 2014. Video: Cheer Pack North America gains efficiency with Surface on the factory floor.
[Available in: https://www.youtube.com/watch?v=EFdYqhIezig]

MANU LeanMES Project Documentation
42
Figure 8. Quality specialist taking picture with Surface Pro. (Screenshot from Surface Pro intro on
factory floor Cheer Packs North America 2014).
QueVision System for Traffic Control9
QueVision combines infrared sensors over store doors and cash registers, predictive
analytics, and real-time data feeds from point-of-sale systems for a faster checkout
initiative (Figure 9). Kroger’s QueVision technology is powered by Irisys intelligent
Queue Management solution. It uses infrared sensors and predictive analytics to arm
store front-end managers with real-time data to make sure registers are open with
customers need them. The solution, across the Kroger family of stores, has reduced the
time a customer waits in line to check out, on average, from four minutes before
QueVision to less than 30 seconds today.
Figure 9. Kroger Traffic Control System aims to provide customer for a faster checkout. (Figure
from Kroger mobile innovations 2014).
9 Kroger Co’s QueVision for Traffic Control 2015. [Available in: http://ir.kroger.com/Mobile/file.aspx?IID=4004136&FID=22999227]

MANU LeanMES Project Documentation
43
4.3. Virtual and Augmented Reality
Immersive Virtual Reality (VR) is a technology that enables users to enter into computer
generated 3D environments and interact with them. In VR technologies, the human body
movements are monitored by using different tracking devices. This enables intuitive
participation with and within the virtual world. Head mounted displays (HMDs) are a
commonly used display device for VR, using the closed view and non-see-through mode.
(Schlick et al. 2012)
Augmented reality is characterized by visual fusion of 3D virtual objects into a 3D real
environment in real time. Compared to VR, AR supplements reality, rather than
replacing it. With AR, developers create various virtual models in a way that users can
interact with those and distinguish between virtual and real world. An AR system
includes processor, sensors, display and input devices. The display system can be a
monitor or screen mounted in workplace, a head-mounted display, or eyeglasses.
(Graham 2012)
Even though AR technologies have existed already some years, their implementation in
real industrial environments has been rare (Nee et al. 2012). It is seen that the
emergence of manufacturing IT-solutions, which can collect and manage the
manufacturing information, will pave the way for more AR implementations.
Furthermore, as stated by Schlick et al. (2012) the recent advances in wearable
computer displays, which incorporate miniature TFT LCDs directly into conventional
eyeglasses or helmets, should simplify ergonomic design and further reduce weight of
the VR and AR technologies (Schlick et al. 2012).
The most common usage contexts for AR has been reported as conceptual product
design, education and training, visual tracking and navigation, work instructions and
remote help centers. (Nee et al. 2012; Graham 2012) In the following sections the
technologies and application examples of augmented reality will be discussed. The focus
will be on head-mounted displays, as the other technologies, such as mobile devices,
gesture control and speech recognition, are discussed on other sections of this report.
4.3.1. Technologies for Augmented Reality
Head-mounted displays (HMDs) are common technology in Augmented Reality
applications used to overlay the real world with virtual information is to use an HDM.
The overlaying can be done in two ways, either by using an HMD in see-through mode,
or by using an HMD in non-see-through mode, called video-see-through. The latter
approach optically isolates the user completely from the surrounding environment, and
the system must use video cameras to obtain a view of the real world. In optical see-
through HMD the user sees the real scene through optical combiners and no video
channel is needed. (Schlick et al. 2012)
The HMDs can generally be divided into following categories (Schlick et al. 2012):
● Monocular - Single display source, which provides the image to one eye only.
● Binocular (2D) - Two displays with separate screens and optical paths, enabling
both eyes to see the same image simultaneously.

MANU LeanMES Project Documentation
44
● Binocular (3D) - Allow stereoscopic viewing with 3D depth perception. This is
produced by presenting two spatially slightly incongruent images to the left and
right eyes.
As discussed by Welsh et al. (2012) an HMI can assist with target detection, because it
overlays critical cue information over the actual environment, reducing the scanning
time required to sample and attend both the display and the environment. In the
following, few existing HMD products are introduced.
Google Glass10
Google glass is the smart wearable glass developed by Google (TRL 7). The sales section
of google glass beta version is stopped however the development is still proceeding and
the goal is to release a fine version of glasses. Google Glass projects the rendered image
through a lens and into the retina. Figure 10 shows a projector and a prism working
together.
Figure 10. A projector and a prism working together in a google glass (Figure from techlife 2013).
The result is that the user perceives a small translucent screen hovering at about arm’s length distance, as extended up and outward from the right eye. Since the colors are
cycling very quickly, the user perceives a full color video stream. The touch pad installed
beside the glass gives the capability to switch among the menu and search among past
and current events or taping on it opens one application. The camera also has the
possibility to take photos and record 720p videos. (Glass Help 2015) Figure 11 show
different parts of the glasses and Figure 12 a user wearing a google glass.
10 Glass Help 2015. [Available in: https://www.google.com/glass/help]

MANU LeanMES Project Documentation
45
Figure 11. Google glass structure including list of sensors and location of the processor. (Figure
from elsevier-promo online page 2015).
Figure 12. Google glass image preview. (Figure from Cult of Android online page October 2013).
EyeTap: The eye itself as display and camera11
EyeTap (TRL 7) is a device which allows, in a sense, the eye itself to function as both a
display and a camera. EyeTap is at once the eye piece that displays computer
information to the user and a device which allows the computer to process and possibly
alter what the user sees. That which the user looks at is processed by the EyeTap. This
allows the EyeTap to, under computer control, augment, diminish, or otherwise alter a
user's visual perception of their environment, which creates a Computer Mediated
Reality. Furthermore, ideally, EyeTap displays computer-generated information at the
appropriate focal distance, and tonal range. Figure 13 depicts and describes the basic
functional principle of EyeTap. Note from the diagram that the rays of light from the
environment are collinear with the rays of light entering the eye (denoted by the dotted
lines) which are generated by a device known as the aremac. "Aremac" is the word
11 Eyetap research project. [Available in: http://www.eyetap.org/]

MANU LeanMES Project Documentation
46
camera spelled backwards and is the device which generates a synthetic ray of light
which is collinear with an incoming ray of light. Ideally, the aremac will generate rays of
light to form an image which appears to be spatially aligned, and appears at with the
same focus as the real world scene. (EyeTap Research Project Page 2015)
Figure 13. Basic functional principle of EyeTap. (Figure from eyetap online page 2015).
Canon Mixed Reality headset12
Canon's Mixed Reality (MREAL) headset (TRL 9) delivers augmented reality. Canon’s
Mixed Reality is pitched as a high-end tool for product designers in the automotive,
construction, manufacturing, or research fields. The system works differently than
Google Glass. MREAL's bulky-looking headset positions two cameras in front of eyes,
which display a combination of video from surroundings and computer-generated
graphics (Figure 14). Canon created MREAL to allow designers to interact with simple
designs of their products, which will look like highly detailed objects through the glasses
by the headset's computer-powered augmented reality. Basically, it allows designers to
interact with intricate, computer-generated versions of their ideas in a 3D environment.
The head-mounted display is linked to a controller, which is connected to a computer
generating the video of user surroundings.
12 Canon Mixed Reality (MREAL) headset [Available in: http://usa.canon.com/cusa/office/standard_display/Mixed_Reality_Overview]

MANU LeanMES Project Documentation
47
Figure 14. Canon Mixed Reality (MREAL) headset system architecture using augmented reality
(Figure from Canon Mixed Reality headset online page 2015).
Microsoft HoloLens13
The HoloLens of Microsoft (TRL 5) wraps around user’s head and does not isolate user
from the world. It has the Intel SoC and custom Holographic Processing Unit as built in.
That does not just allow the user to see the digital world projected around but on top of
the real world. User can see the person standing next to and talk to them, avoid walking
into walls and chairs as well as looking at a computer screen, because HoloLens detects
the edge and does not project over it so there is no need to keep taking it on and off
during the work. One can take notes or answer email on a computer with a keyboard or
a pen instead of trying to force gestures and gaze. The HoloLens projected screen moves as the user moves the head. User can control the apps either with voice commands or by
using the equivalent of a mouse click as the air tap. Making a Skype call from HoloLens
is a good way to try out voice and gesture commands; it is possible to search the person
to call in the address book then air tap to connect. The other party does not require a
HoloLens and is able to see in Skype what the Holones user is looking at and for example
draw diagrams on the video that appear in user’s view (Figure 15).
13 Microsoft 2015. Microsoft HoloLens. [Available in:http://www.microsoft.com/microsoft-hololens/en-us]

MANU LeanMES Project Documentation
48
Figure 15. Hololens example application for customer service purposes (Figure from Microsoft
Hololens online page teach and learn 2015).
4.3.2. AR application examples
Many companies and research groups recently started to create and develop methods to
use AR and this section aims to introduce some industrial and non-industrial application
examples.
Google Glass Applications14
Google have designed basic applications for glassware such as taking photos, record a
video, finding directions, or search google. However it takes time to get used to wearing
the glasses. There are also applications available in Glass appstore and from third
parties. For instance Tesco grocery Glassware lets the user to browse, view nutritional
information, and add items to the shopping basket hands-free. Other example is Magnify
that lets users zoom-in on objects located in front of them. Users with limited vision are
able to zoom in and out in order to see objects at a closer range with a voice command.
Magnify runs for 30 seconds and users have the option to extend the time. Currently,
also IFTTT15 (IF This Then That) is also available for Google Glass. This service exists to
automate the tasks user regularly perform across a wide range of popular apps and
services.
Augmented reality applications from SAP16
SAP is working with smart eyewear company Vuzix to bring augmented reality and
smart glasses into industrial environments. The applications are targeted especially to
field technicians and warehouse workers, where hands-free computing can aid in data
collection and operations. The two applications launched are the SAP AR Warehouse
Picker and the SAP AR Service Technician (TRL 9). Both applications utilize visualization
and voice recognition to receive instructions via the M100 Smart Glasses to complete
14 Glassware Apps Online Page [Available in: https://glass.google.com/u/0/glassware] 15 About IFTTT. [Available in: https://ifttt.com] 16 SAP. Augmented Reality Apps. [Available in: http://www.sap.com/pc/tech/mobile/software/lob-apps/augmented-reality-apps/index.html]

MANU LeanMES Project Documentation
49
daily tasks without hand-held devices or instructions. The aim is to make the operations
faster, more efficient and better quality (reduce mistakes).
SAP AR Warehouse Picker17
SAP AR Warehouse Picker (Figure 16) aims to instruct the warehouse worker in the
picking operations, and to collect the information of the picked items. With the
application the users are able to scan barcodes and QR codes for handling units,
locations, products, stations and any other required scans. It is also possible to give
voice input for quantity confirmation. The usage of smart glasses and AR technology
eliminates the need for hand-held scanners, which have been making the picking
operations difficult by occupying one hand. The hands-free functionality reduces the
time the workers must spend interacting with handheld scanners and devices. To get
started, workers connect the smart glasses with the organization’s back-end or gateway
system and load warehouse picking tasks. Pickers are then guided through tasks
according to the steps required for each item to be picked. Voice-recognition and
visualization functionality drive task completion and accuracy with prompts and step-
by-step directions. Operators can navigate through software options and enter data (e.g.
completion of tasks) with voice command. The smart glasses include speakers for the
audio prompts, as well as built-in scanning functionality. For example, the application
can give workers audio prompts to scan a particular item with the smart glasses, pick an
item up off the shelf, or enter an item quantity. The authentication of users is verified by
scanning a unique QR code through the smart glasses.
Figure 16. SAP AR Warehouse Picker application guiding the worker in the picking operations
(screenshot from SAP Enterprise Mobile 2013).
17 SAP Enterprise Mobile. 2013. Video: SAP & Vuzix Bring you Augmented Reality Solutions for the Enterprise. [Available
in: https://www.youtube.com/watch?v=9Wv9k_ssLcI]

MANU LeanMES Project Documentation
50
SAP AR Service Technician18
SAP AR Service Technician (Figure 17) aims to instruct the technician in service
operations. With the application, users have access to 3D visual enterprise models of
their workplace and the use of an expert calling feature, which allows a remote expert to
give directions to a colleague while streaming a visual from the head set. The application
supports voice-activated commands and audio-note functionality. The hands-free
functionality allows the operator to concentrate on the skilled and precise hand tasks.
To get started, technicians need to sync the smart glasses with a tablet or laptop to
retrieve all necessary data and any new voice notes from SAP Work Manager, left by
other workers and stakeholders. They can scan the QR code and select from a list of
procedures. Once the information for the current job is loaded into the smart glasses,
workers can navigate the software with voice-activated commands. They can browse 3D
visualizations and information including instructions, operational steps, and parts lists.
They can drill into details for more information on a specific part, listen to equipment
voice notes, and record new voice notes. Browsing through procedure steps happens by
commands such as “Next,” “Previous,” and “Step.” For each step, the 3D model of the part
or item will animate, and audio and textual instructions can be provided if available in
the visual enterprise model. In order to get “over-the-shoulder” expert assistance, the
field technician can use voice commands to select from a list of available experts and
make the call. The expert can see in real-time what the technician sees through the
camera in the smart glasses, and the technician can see the expert in the smart glasses.
Figure 17. SAP AR Service Technician application guiding the service operator (screen shot from
SAP 2014).
AstroVAR19
AstroVAR is a projected augmented reality system and a product from Delta Sygni Labs
(TRL 9). It enables visual communication between the remote expert and the on-site
personnel. Experts can see the situation and help from the office by using a laser pointer
showing visual instructions on workpieces and devices. With the expert knowledge, 18 SAP. 2014. Video: SAP and Vuzix bring you the future of Field Service. [Available in:
https://www.youtube.com/watch?v=UlpGDrSmg38]
19 Delta Sygni Labs AstroVAR product [Available in: http://deltacygnilabs.com]

MANU LeanMES Project Documentation
51
straight to the point, the on-site personnel can fix the problem. Equipment is back in
service and the on-site site visit is avoided. Some features are such as wireless, no
glasses and feasibility to use (Figure 18).
Figure 18. Delta Sygni Labs AstroVAR product for technical support (Delta Sygni Labs online page
2014).
Simulo Engineering AR help platform20
Assembly tasks, disassembly, diagnosis routine, pre-assembly operations are samples of
AR use-cases improved in Simulo Engineering (TRL 9). AR implementation for work
instruction of arm loader is a fine example of teaching inexperienced workers to do new
tasks (Figure 19).
Figure 19. The assembly process for a manipulator using AR guides on screen installed in the environment. (Screenshot from Simulo Engineering using industrial Application of AR in 2012)
20 Simulo Engineering. AR industrial Applications. [Available in: http://www.simulo.it/]

MANU LeanMES Project Documentation
52
4.4. Gesture and Speech Control
Gesture and Speech control are often used in augmented reality applications. They are
becoming more common with the emergence of multimodal interfaces. As highlighted
by Karat et al. (2012) speech technology, like the other recognition technologies, lack
100% accuracy. This is due to the fact that the individuals speak differently from each
other, and because the accuracy of the recognition is dependent on an audio signal that
can be distorted by many factors. The accuracy depend on the choice of the underlying
speech technology, and making the best match between the technology, the task, the
users, and the context of use. Automatic speech recognition can have explicitly defined
rule-based grammars or it can use statistical grammars such as a language model.
Usually a transactional system uses explicitly defined grammars, while dictation systems
or natural language understanding (NLU) systems use statistical models. (Karat et al.
2012)
In general, it is effective to use speech applications for situations when speech can
enable a task to be done more efficiently, for instance, when a user’s hands and eyes are
busy doing another task (Karat et al 2012).
The dialog styles in speech recognition systems include: Directed dialog (system-
initiated) in which the user is instructed or “directed” what to say at each prompt; User-
initiated in which the system is passive and the user is not prompted for specific
information; Mixed initiative in which the system and the user take turns initiating the
communication depending on the flow of the conversation and the status of the task.
(Karat et al. 2012)
Hickley & Wigdor (2012) brought out some limitations relating to speech recognition.
First of all, it can only succeed for a limited vocabulary. The error rates increase as
vocabulary grows and the complexity of grammar increases, if the quality of the audio
signal from the microphone is not good enough, or if users employ out-of-vocabulary
words. Speech is inherently non-private in public situations, and can also be distracting
for persons nearby. Spatial locations are not easily referred by speech, which means
that speech cannot eliminate the need for pointing. (Hinckley & Wigdor 2012) In recent years, the robustness of speech recognition in noisy environments has been improved
by speech/lip movement integration. This kind of work has included classification of
human lip movement (visemes) and the viseme-phoneme mappings that occur during
articulated speech. (Dumas et al. 2009)
As stated by Hinckley & Wigdor (2012) for computer to embed themselves naturally
within the flow of human activities, they must be able to sense and reason about people
and their intentions e.g. to know when the user is trying to interact with the system, and
when he/she is talking or interacting (e.g. waving) with other people. This issue applies
to both gesture and speech control.
4.4.1. Technologies for Gesture and Speech control
Kinect
Kinect (codenamed in development as Project Natal and currently with TRL 9) is a line
of motion sensing input devices by Microsoft for video game consoles and Windows PCs.
Based around a webcam-style add-on peripheral, it enables users to control and interact

MANU LeanMES Project Documentation
53
with their console/computer without the need for a game controller, through a natural
user interface using gestures and spoken commands (Project Natal 2009). The body
position is estimated in 2 steps. First the device draws a depth map by using structured
light, and then finds body position by machine learning. Inside the sensor case21, a
Kinect for Windows sensor (Figure 20) contains firstly an RGB camera that stores three
channel data in a 1280x960 resolution. This makes capturing a color image possible. It
also contains an infrared (IR) emitter and an IR depth sensor. The emitter emits infrared
light beams and the depth sensor reads the IR beams reflected back to the sensor. The
reflected beams are converted into depth information measuring the distance between
an object and the sensor. This makes capturing a depth image possible. Third is a multi-
array microphone, which contains four microphones for capturing sound. Because there
are four microphones, it is possible to record audio as well as find the location of the
sound source and the direction of the audio wave. Finally it includes a 3-axis
accelerometer configured for a 2G range, where G is the acceleration due to gravity. It is
possible to use the accelerometer to determine the current orientation of the Kinect.
Figure 20. Kinect sensor components. (Figure from Kinect for Windows Sensor Components and
Specifications 2015.).
The first-generation Kinect was first introduced in November 2010 in an attempt to
broaden Xbox 360's audience beyond its typical gamer base. Microsoft released the
Kinect software development kit for Windows 7 on June 16, 2011 (Knies 2011). This
SDK was meant to allow developers to write Kinecting apps in C++/CLI, C#, or Visual
Basic .NET (Stevens 2015).
SHADOW Motion Capture22
SHADOW motion capture system (TRL 9) uses inertial measurement units sealed in
neoprene fabric (Figure 21). The flexible sensors are small, lightweight, and
comfortable to wear. Inertial sensors measure rotation, not position. Shadow includes
software to estimate position based on the skeletal pose, pressure sensor data, and a
kinematic simulation. The position estimate updates in real time and streams to the 21 Kinect for Windows Sensor Components and Specifications 2015. [Available in: https://msdn.microsoft.com/en-
us/library/jj131033.aspx] 22 SHADOW motion capture system online page. [Available in: http://www.motionshadow.com/]

MANU LeanMES Project Documentation
54
viewing and recording systems with the current pose. Shadow skeleton data is viewable
in real time and compatible with most 3D digital content creation applications. The
software provides export to the industry standard FBX, BVH, and C3D animation and
mocap file formats. The Software Development Kit (SDK) supports network based
streaming of all synchronized pose data. The SDK is open source and available in many
popular programming languages. In 2013 a release of the Shadow full body inertial
motion capture system was presented, which builds on and extends existing hardware
and software platform.
Motion Shadow software requires a computer with Wi-Fi. The Motion Viewer and
Monitor applications are only available on the Windows platform. Motion Monitor on a
Wi-Fi enabled mobile device. Shadow also operates in standalone mode. Use your Wi-Fi
enabled mobile device as a remote control. The Motion User Interface supports the
following systems, no software or app required. It works on Apple iOS (iPhone, iPad,
iPod Touch), Android, and Windows Phone.
Figure 21. Shadow - a full body wearable sensor network for motion capture. (Figure from Motion
Node Channel 2013).
Thalmic Labs MYO armband23
MYO armband (TRL 7) senses muscle movements for Minority Report-style motion
control. MYO is an armband that translates the muscles' electrical activity into motion
controls (Figure 22). The sensor inside the armband has enough sensitivity to pick up
individual finger movements. Developers will be able to program for the controller as
well. To prevent accidental input, users must activate the motion control with a unique
gesture that is unlikely to occur normally. The armband will supposedly be one size fits
23 Thalmic Labs MYO gesture control armband 2014. [Available in: https://www.thalmic.com/en/myo/]

MANU LeanMES Project Documentation
55
all, and uses Bluetooth 4.0. While MYO is built for Windows and Mac, developers can
also integrate the device with their Android and iOS apps.
Figure 22. MYO armband has sensors to output the hand gesture. Developers are able to extract
styles based on a preferable common hand gesture. (Figure from Thalmic Labs MYO gesture control armband 2014).
Haptic Interfaces
Haptic devices (or haptic interfaces) are mechanical devices that mediate
communication between the user and the computer. Haptic devices allow users to touch,
feel and manipulate three-dimensional objects in virtual environments and tele-
operated systems. Most common computer interface devices, such as basic mice and
joysticks, are input only devices, meaning that they track a user's physical manipulations
but provide no manual feedback. As a result, information flows in only one direction,
from the peripheral to the computer. Haptic devices are input-output devices, meaning
that they track a user's physical manipulations (input) and provide realistic touch
sensations coordinated with on-screen events (output). Examples of haptic devices
include consumer peripheral devices equipped with special motors and sensors (e.g.,
force feedback joysticks and steering wheels) and more sophisticated devices designed
for industrial, medical or scientific applications (e.g., PHANTOM device). (Mimic
Technologies Inc. 2003)
Haptic interfaces are relatively sophisticated devices. As a user manipulates the end
effector, grip or handle on a haptic device, encoder output is transmitted to an interface
controller at very high rates. Here the information is processed to determine the
position of the end effector. The position is then sent to the host computer running a
supporting software application. If the supporting software determines that a reaction
force is required, the host computer sends feedback forces to the device. Actuators
(motors within the device) apply these forces based on mathematical models that
simulate the desired sensations. For example, when simulating the feel of a rigid wall
with a force feedback joystick, motors within the joystick apply forces that simulate the

MANU LeanMES Project Documentation
56
feel of encountering the wall. As the user moves the joystick to penetrate the wall, the
motors apply a force that resists the penetration. The farther the user penetrates the
wall, the harder the motors push back to force the joystick back to the wall surface. The
end result is a sensation that feels like a physical encounter with an obstacle. (Mimic
Technologies Inc. 2003) Figure 23 shows an example for a haptic glove.
Figure 23. A Haptic Glove gives user the ability to touch virtual objects. (Figure from Digital Trends
October 2014).
Speaker separation HARK24 HARK developed by Kyoto university is a case which was introduced in 2010 for sound
separation to be implemented on the robots. The test demo available online shows the
capability of distinguishing voice of 4 different talkers (Figure 24).
Figure 24. HARK by university of Kyoto. (Screenshot from Willow garage ROS video 2010).
24Audition for Robots with Kyoto University (HARK). [Available in: http://www.hark.jp/]

MANU LeanMES Project Documentation
57
4.4.2 Gesture and Speech Control Application Examples
Robotic control by gesture recognition
Research example using Kinect cameras was done on gesture control for industrial
robots at the department of Information Technology & System Management in FH
Salzburg25. The task was prepared for positioning and picking different parts by
following the user hand and applying gesture control (Figure 25).
Figure 25. Control an industrial robot by hand using gesture control. (Screenshot from gesture
control for industrial manipulator intro in department of Information Technology & System Management in FH Salzburg 2014).
Material handling by gesture recognition
Many flows of materials and goods at factories and workshops take place manually. A
mobile machine can be useful, which is controlled by natural gestures, relieves the
workers of heavy loads, and transports them independently. Assistance system FiFi of
Karlsruhe Institute of Technology (KIT) aims for this purpose (Phys-engineering 2014).
FiFi is an assistance system developed to support man in direct environment in a
contactfree manner controlling (Figure 26). The mobile platform equipped with a
camera system is particularly suited for dynamic material flows at factories and
workshops. These flows require high flexibility and are usually executed by man. Typical
examples are high bay warehouses for car spare parts, consumer products of big online
traders or deliveries of goods between departments of big companies. Via a camera
system, the machine three-dimensionally acquires the gestures of the user and executes
his commands. For moving or switching into the different modes of operation, no
contact is required. It follows the user and may approach him up to an arm's length for
loading. When the user points to a line on the floor, it independently moves along the
line to the next station, where it is deloaded by the next user. A safety laser scanner
prevents it from colliding with objects or people and allows for safe operation. By a
gesture, a lifting system can be adjusted to various working heights.
25 fhsits Youtube Channel. 2014. Video: Control an Industrial Robot by Hand! - Gesture Control. [Available in:
https://www.youtube.com/watch?v=evSqu-d16Oo]

MANU LeanMES Project Documentation
58
Figure 26. Mobile machine using gesture control for load carrying. (Figure from Phys engineering August 2014).
Jennifer by Lucas Systems26
Jennifer (available since 2012) is a voice picking system for mobile work in warehouses
(TRL 9). Workers can use the handy scanner to check on barcodes and receive voice
information as well as give commands about specific product (Figure 27). Afterwards,
the worker knows if that is the right location and also how many to pick from the
product to the basket. Workers may give voice commands to know whether chosen
place for moved product is right. System can inform user about other product details
such as expiration date.
Figure 27. Jennifer (available since 2012) is a voice picking system for mobile work in warehouses.
(Screenshot from Introduction to Voice Picking with Jennifer 2012).
26 Jennifer voice picking by Lucas Systems. [Available in: http://www.lucasware.com/jennifer-mobile/]

MANU LeanMES Project Documentation
59
Hotel staffed by robots
A hotel staffed by robots will start working on July 2015 in Huis Ten Bosch, which is a
Japanese theme park. The two-story, 72-room Henn-na Hotel, which is slated to open
July 17, will be staffed by ten robots that will greet guests, carry their luggage and clean
their rooms. According to The Telegraph (Bridge 2015), the robots, created by robotics
company Kokoro, will be an especially humanoid model known as an "actroid". Actroid
robots (Figure 28) are generally based on young Japanese women, and they can speak
fluent Japanese, Chinese, Korean and English, as well as mimic body language and
human behaviors such as blinking and hand gestures. Three actroids will staff the front
desk, dealing with customers as they check in to the hotel. Four will act as porters,
carrying guests' luggage, while another group will focus on cleaning the hotel. The hotel
itself will also feature some high-tech amenities (Kaplan 2015), such as facial
recognition software that will allow guests to enter locked rooms without a key, and
room temperatures monitored by a panel that detects a guest's body heat.
Figure 28. Robots to serve guests in Japanese hotel. (Screenshot from washiungtonpost 2015).

MANU LeanMES Project Documentation
60
5. Conclusions
Human-friendly interface design is crucial when aiming for efficient operations. Whether a system can be described being usable or not depends on four factors, namely anthropometrics, behavior, cognition and social factors. This report discussed about the user-centric design and the characteristics of human behavior and cognition that need to be taken into account when designing HMIs (human-machine interaction). As it was stated in this report, no generic design rules for usable HMI design can be given, because the usability always depends on three aspects: 1) The specific user and its characteristics; 2) The task that is being done with the designed HMI; and 3) The context and environment of use of the designed interface. However, several guidelines for human-friendly user interface design were reported.
While designing user interfaces, three selections need to be made. These include: 1)
Selection of the modality, which refers to the sensory channel that human uses to send
and receive a message (e.g. auditory, visual, touch); 2) Selection of the medium, which
refers to how the message is conveyed to the human (e.g. picture, diagram, video, alarm
sound); and 3) Selection of the technology to deliver the message (e.g. smart phone or
AR glasses). The multimodal interfaces, which use multiple different modalities (and
also media and technologies), are emerging. For example the augmented reality
interfaces, utilize often multiple modalities, such as vision, speech and touch, and is built
by combining multiple technologies, such as different visual displays, speech recognition
and haptic devices.
Several existing and emerging HMI technologies, including mobile devices, augmented
reality, as well as gesture and speech recognition technologies were introduced and
examples of their applications were given in this report. Even though the most common
user interface, at least in Finnish manufacturing environments, are still pen and paper, it
is believed that the transformation towards digitalization, for example implementation
of MES systems, will open doors for adoption of novel user interfaces on the factory
floor. However, when implementing these novel interface technologies, one has to
always consider the technology’s suitability for the specific task and context of use. Is
the fancy technology actually helping human to perform his/her task more efficiently, or
is it just fancy technology? Or is the complex colorful visualization eye-catching, but
doesn’t necessarily optimize the understanding of the specific task at hand? As stated by
Watzman and Re (2012):
”Good design does not needlessly draw attention to itself. It just works.”

MANU LeanMES Project Documentation
61
References
Banerjee, A., Bommu, N., 2013. Design of Manufacturing Execution System for FMCG Industries.
International Journal of Engineering and Technology (IJET). Vol 5 No 3, ISSN : 0975-4024 pp.
2366
Cavalvanti, A.L.O., de Souza, A.J., Silva, D., Rocha, G., Filho, LF.S.L., 2009. Integrating Mobile
Devices and Industrial Automation through Web Services. 7th IEEE International Conference on
Industrial Informatics, pp. 173-176.
Courage, C., Jain, J. Redish, J. & Wixon, D. 2012. Task Analysis. In: Jacko, J.A. (Ed.). The Human-
Computer Interaction Handbook - Fundamentals, Evolving Technologies and Emerging
Applications. 3rd Edition. CRC Press. ISBN 978-1-4398-2944-8, pp. 956-982.
Danielis, P., Skodzik, J., Altmann, V., Schweissguth, E.B., Golatowski, F., Timmermann, D., Schacht,
J., 2014. Survey on real-time communication via ethernet in industrial automation environments.
IEEE Emerging Technology and Factory Automation (ETFA), PP. 1-8
Dilip, Soman; N-Marandi, Sara (2010). Managing Customer Value: One Stage at a Time. Singapore:
World Scientific. ISBN 9789812838285, p. 275.
Dumas, B., Lalanne, D. & Oviatt, S. 2009. Multimodal Interfaces: A Survey of Principles, Models
and Frameworks. In: Lalanne, D. & Kohlas, J. (Eds.): Human Machine Interaction, LNCS 5440, pp.
3-26, 2009. Springer-Verlag Berlin Heidelberg
Fitts, P.M. 1954. The information capacity of the human motor system in controlling the
amplitude of movement. J. Ecp. Psychol. 47:381-391.
Graham, M., Zook, M., and Boulton, A. Augmented reality in urban places: contested content and
the duplicity of code. Transactions of the Institute of British Geographers, DOI: 10.1111/j.1475-
5661.2012.00539.x 2012.
Grice, H. P. 1975. Logic and conversation. In P. Cole & J. L. Morgan (Eds.), Syntax and semantics
III: Speech acts. New York, NY: Academic Press.
Hedge, A. 2003. 10 principles to avoid XP-asperation. Ergonomics in Design, 11(3), pp. 4-9.
Hinckley, K. & Wigdor, D. 2012. Input Technologies and Techniques. In: Jacko, J.A. (Ed.). The
Human-Computer Interaction Handbook - Fundamentals, Evolving Technologies and Emerging
Applications. 3rd Edition. CRC Press. ISBN 978-1-4398-2944-8, pp. 95-132.
Hoggan, E. & Brewster, S. 2012. Nonspeech Auditory and Crossmodal Output. . In: Jacko, J.A. (Ed.).
The Human-Computer Interaction Handbook - Fundamentals, Evolving Technologies and
Emerging Applications. 3rd Edition. CRC Press. ISBN 978-1-4398-2944-8, pp. 211-235.
Jameson, A. & Gajos, K.Z. 2012. Systems That Adapt to Their Users. In: Jacko, J.A. (Ed.). The
Human-Computer Interaction Handbook - Fundamentals, Evolving Technologies and Emerging
Applications. 3rd Edition. CRC Press. ISBN 978-1-4398-2944-8, pp. 431-456.
Järvenpää, E., Lanz, M., Tokola, H., Salonen, T. Koho, M. 2015. Production planning and control in
Finnish manufacturing companies – Current state and challenges. Proceedings of the 25th

MANU LeanMES Project Documentation
62
International Conference on Flexible Automation and Intelligent Manufacturing, FAIM2015, 23rd
– 26th June, 2015, Wolverhampton, UK. 8 p.
Karat, C.-M., Lai, J., Stewart, O. & Yankelovich, N. 2012. Speech and Language Interfaces,
Applications, and Technologies. In: Jacko, J.A. (Ed.). The Human-Computer Interaction Handbook
- Fundamentals, Evolving Technologies and Emerging Applications. 3rd Edition. CRC Press. ISBN
978-1-4398-2944-8, pp.367-386.
Knies, R. (February 21, 2011). Academics, Enthusiasts to Get Kinect SDK. [Accessed: 23.3.2015].
Kramer, G. 1994. An introduction to auditory display. In Auditory Display, ed. G. Kramer, 1–77.
Reading, MA: Addison-Wesley.
Nee, A.Y.C., Ong, S.K., Chryssolouris, G. & Mourtzis, D. 2012. Augmented reality applications in
design and manufacturing. CIRP Annals – Manufacturing Technology, Vol. 61, pp. 657-679.
Elsevier.
Norman, D.A. 1988. The psychology of everyday things. NY:Basic Books.
Orland, Kyle (February 21, 2011). News - Microsoft Announces Windows Kinect SDK For Spring
Release. Gamasutra. [Accessed: 23.3.2015].
Oviatt, S.L. 1997. Multimodal interactive maps: Designing for human performance. Human-
Computer Interaction 12, 93-129.
Payne, S.J. 2012. Mental Models in Human-Computer Interaction. In: Jacko, J.A. (Ed.). The Human-
Computer Interaction Handbook - Fundamentals, Evolving Technologies and Emerging
Applications. 3rd Edition. CRC Press. ISBN 978-1-4398-2944-8, pp. 41-55.
Proctor, R.W. & Vu, K-P.I. 2012. Human Information Processing – An Overview for Human-
Computer Interaction. In: Jacko, J.A. (Ed.). The Human-Computer Interaction Handbook -
Fundamentals, Evolving Technologies and Emerging Applications. 3rd Edition. CRC Press. ISBN
978-1-4398-2944-8, pp. 21-40.
Ritter, F.E., Baxter, G.D. & Churchill, E.F. 2014. Foundations for designing user-centered systems -
What System Designers need to know about people. Springer. 442 p. ISBN 978-1-4471-5133-3.
Stevens, T., Kinect for Windows SDK beta launches, wants PC users to get a move on. Web article.
[Available in: http://www.engadget.com/2011/06/16/microsoft-launches-kinect-for-windows-
sdk-beta-wants-pc-users-t/] [Accessed: 23.3.2015]
Szalma, J.L., Hancock, G.M. & Hancock, P.A. 2012. Task Loading and Stress in Human-Computer
Interaction – Theoretical Frameworks and Mitigation Strategies. In: Jacko, J.A. (Ed.). The Human-
Computer Interaction Handbook - Fundamentals, Evolving Technologies and Emerging
Applications. 3rd Edition. CRC Press. ISBN 978-1-4398-2944-8, pp. 55-75.
Smith, P.J., Beatty, R., Hayes, C.C., Larson, A., Geddes, N.D. & Dorneich, M.C. 2012. Human-Centered
Design of Decision-Support Systems. In: Jacko, J.A. (Ed.). The Human-Computer Interaction
Handbook - Fundamentals, Evolving Technologies and Emerging Applications. 3rd Edition. CRC
Press. ISBN 978-1-4398-2944-8, pp. 589-621.
Schlick, C.M., Winkelholz, C., Ziefle, M. & Mertens, A. 2012. Visual Displays. In: Jacko, J.A. (Ed.). The
Human-Computer Interaction Handbook - Fundamentals, Evolving Technologies and Emerging
Applications. 3rd Edition. CRC Press. ISBN 978-1-4398-2944-8, pp. 157.-191.

MANU LeanMES Project Documentation
63
Sutcliffe, A. 2012. Multimedia User Interface Design. In: Jacko, J.A. (Ed.). The Human-Computer
Interaction Handbook - Fundamentals, Evolving Technologies and Emerging Applications. 3rd
Edition. CRC Press. ISBN 978-1-4398-2944-8, pp. 387-404.
Watzman, S. & Re, M. 2012. Visual Design Principles for Usable Interfaces - Everything is
Designed: Why We Should Think before Doing. In: Jacko, J.A. (Ed.). The Human-Computer
Interaction Handbook - Fundamentals, Evolving Technologies and Emerging Applications. 3rd
Edition. CRC Press. ISBN 978-1-4398-2944-8, pp. 315-340.
Welsh, T.N., Chandrasekharan, S., Ray, M., Neyedli, H., Chua, R. & Weeks, D.J. 2012. Perceptual-
Motor Interaction – Some Implications for Human-Computer Interaction. In: Jacko, J.A. (Ed.). The
Human-Computer Interaction Handbook - Fundamentals, Evolving Technologies and Emerging
Applications. 3rd Edition. CRC Press. ISBN 978-1-4398-2944-8, pp. 3-20.
Wickens, C.D., Lee, J.D., Liu, Y. & Gordon Becker, S.E. 2004. An Introduction to Human Factors
Engineering. Second ed. Upper Saddle River, NJ: Pearson Prentice Hall.
Yamaji, M., Ishii, Y., Shimamura, T., & Yamamoto, S., 2008. International Conference on Wireless
Sensor Network for Industrial Automation, Networked Sensing Systems, IEEE, pp. 253.
Web sources
Audition for Robots with Kyoto University (HARK). [Available in:
http://www.hark.jp/][Accessed: 23.3.2015].
Bridge, A., Robots to serve guests in Japanese hotel. February 2015 [Available in:
http://www.washingtonpost.com/news/morning-mix/wp/2015/02/06/futuristic-japanese-
hotel-will-be-run-almost-entirely-by-robots/] [Accessed: 26.3.2015].
CadRelations Youtube Channel. 2014. Video: HMI 2014: 3Dconnexion, - programing industry
robots gets easier. [Available in: https://www.youtube.com/watch?v=oIbXW3BVaAI] [Accessed:
23.3.2015].
Canon Mixed Reality (MREAL) headset [Available in:
http://usa.canon.com/cusa/office/standard_display/Mixed_Reality_Overview] [Accessed:
23.3.2015].
Chalmers. Operator of the Future. [Available in: http://www.chalmers.se/hosted/frop-en]
[Accessed: 26.3.2015].
Cult of android. Google Glass User Gets A Ticket For ‘Driving With Monitor Visible To Driver’.
2013. [Available in: http://www.cultofandroid.com/43993/google-glass-user-gets-a-ticket-for-
driving-with-monitor-visible-to-driver/] [Accessed: 29.3.2015].
Delta Sygni Labs AstroVAR product [Available in: http://deltacygnilabs.com] [Accessed:
23.3.2015].
Digital Trends October 2014. [Available in: http://www.digitaltrends.com/cool-tech/dexmo-
exoskeleton-glove-lets-feel-virtual-objects-hand/] [Accessed: 26.3.2015].
EC Horizon 2020 technology readiness level (TRL). [Available in:
http://ec.europa.eu/research/participants/data/ref/h2020/wp/2014_2015/annexes/h2020-
wp1415-annex-g-trl_en.pdf] [Accessed: 10.2.2015].

MANU LeanMES Project Documentation
64
Elsevier-promo 2015. Google Glass Animation. [Available in: http://www.elsevier-
promo.com/glasses/animation.html] [Accessed: 29.3.2015].
Eyetap research project. [Available in: http://www.eyetap.org/][Accessed: 23.3.2015].
Glass Help 2015. [Available in: https://www.google.com/glass/help] [Accessed: 29.3.2015].
fhsits Youtube Channel. 2014. Video: Control an Industrial Robot by Hand! - Gesture Control.
[Available in: https://www.youtube.com/watch?v=evSqu-d16Oo] [Accessed: 23.3.2015].
Glassware Apps Online Page [Available in: https://glass.google.com/u/0/glassware] [Accessed:
23.3.2015].
IFTTT. [Available in: https://ifttt.com] [Accessed: 23.3.2015].
Innowera Mobile 2013. [Available in: http://innowera.com/web-and-mobile-server-for-sap.php]
[Accessed: 23.3.2015].
IQMS Mobile ERP Apps for Manufacturing Companies 2015. [Available in:
http://www.iqms.com/products/mobile-erp-software.html] [Accessed: 23.3.2015].
IQMS Mobility in the Manufacturing Workplace 2011. [Available in:
http://www.iqms.com/products/brochures/Mobility_in_the_Manufacturing_Workplace.pdf]
[Accessed 22.2.2015].
Irisys People Counting 2015. [Available in: http://www.irisys.net/people-counting] [Accessed:
23.3.2015].
Jennifer voice picking by Lucas Systems. [Available in: http://www.lucasware.com/jennifer-
mobile/][Accessed: 23.3.2015].
Kroger Co’s QueVision for Traffic Control 2015. [Available in:
http://ir.kroger.com/Mobile/file.aspx?IID=4004136&FID=22999227] [Accessed: 23.3.2015].
Kaplan, S., Futuristic Japanese hotel will be run almost entirely by robots. February 2015
[Available in: http://www.telegraph.co.uk/travel/destinations/asia/japan/11387330/Robots-
to-serve-guests-in-Japanese-hotel.html] [Accessed: 26.3.2015].
Kinect for Windows Sensor Components and Specifications 2015. [Available in:
https://msdn.microsoft.com/en-us/library/jj131033.aspx] [Accessed: 23.3.2015].
Kinect Windows Team. Web article. [Available in:
http://blogs.msdn.com/b/kinectforwindows/archive/2012/01/09/kinect-for-windows-
commercial-program-announced.aspx] [Accessed: 23.3.2015].
MESA. MES Explained: A High Level Vision. [Available in: http://www.mesa.org/] [Accessed
05.03.2015].
Microsoft 2015. Microsoft HoloLens. [Available in:http://www.microsoft.com/microsoft-
hololens/en-us] [Accessed: 23.3.2015].
Mimic Technologies Inc. White Paper. 2003. [Available in: http://goo.gl/gkz3aS] [Accessed
25.03.2015].

MANU LeanMES Project Documentation
65
Molen, Brad (2012-01-14). Samsung Gear 2 smartwatches coming in April with Tizen OS.,
[Available in: http://www.engadget.com/2014/02/22/samsung-gear-2/] [Accessed: 23.3.2015].
Motion Node Channel 2013. [Available in: www.youtube.com/watch?v=5fOxM0uxTDo]
[Accessed: 29.3.2015].
Moran, M., Improving Manufacturing Performance with MES Mobile Applications. SpenTech. June
2013 [Available in: http://www.aspentech.com/] [Accessed 05.03.2015].
Motorola ET1 Enterprise Tablet 2015. [Available in: http://www.motorolasolutions.com/US-
EN/Business+Product+and+Services/Tablets/ET1+Enterprise+Tablet] [Accessed: 23.3.2015].
Nielsen J. 1995. 10 Usability Heuristics for User Interface Design. Web article. [Available in:
http://www.nngroup.com/articles/ten-usability-heuristics/] [Accessed: 2.3.2015].
Operator of the Future by Chalmers 2015. [Available in: http://www.chalmers.se/hosted/frop-
en] [Accessed: 23.3.2015].
Phys engineering. Gesture-controlled, autonomous vehicles may be valuable helpers in logistics
and trans-shipment centers. August 2014. [Available in: http://phys.org/news/2014-08-gesture-
controlled-autonomous-vehicles-valuable-helpers.html] [Accessed: 29.3.2015].
Pro-face Remote HMI 2015. [Available in: http://www.profaceamerica.com/en-
US/content/remote-hmi] [Accessed: 23.3.2015].
Recommendations for implementing the strategic initiative INDUSTRIE 4.0. 2013 p. 23.
[Available in: http://goo.gl/9vka6d] [Accessed: 24.2.2015].
SAP. Augmented Reality Apps. [Available in:
http://www.sap.com/pc/tech/mobile/software/lob-apps/augmented-reality-apps/index.html]
[Read 18.2.2015].
SAP Enterprise Mobile. 2013. Video: SAP & Vuzix Bring you Augmented Reality Solutions for the Enterprise. [Available in: https://www.youtube.com/watch?v=9Wv9k_ssLcI] [Accessed 18.2.2015].
SAP. 2014. Video: SAP and Vuzix bring you the future of Field Service. [Available in:
https://www.youtube.com/watch?v=UlpGDrSmg38] [Accessed 18.2.2015].
SHADOW motion capture system online page. [Available in:
http://www.motionshadow.com/][Accessed: 23.3.2015].
Simulo Engineering. AR industrial Applications. [Available in: http://www.simulo.it/] [Accessed:
23.3.2015].
SmartTag. ST Media Group International 2013 [Available in: http://vmsd.com/content/smarttag]
[Accessed: 29.3.2015].
Surface Pro Youtube Channel. 2014. Video: Cheer Pack North America gains efficiency with
Surface on the factory floor. [Available in: https://www.youtube.com/watch?v=EFdYqhIezig]
[Accessed: 23.3.2015].
Techlife 2013; How does Google Glass work?. [Available in:
http://www.techlife.net/2013/07/how-does-google-glass-work.html] [Accessed: 29.3.2015].

MANU LeanMES Project Documentation
66
Thalmic Labs MYO gesture control armband 2014. [Available in:
https://www.thalmic.com/en/myo/][Accessed: 23.3.2015].
Trew, James. (2013-10-26) "Sony SmartWatch 2 review". [Available
in:http://www.engadget.com/2013/10/26/sony-smartwatch-2-review] [Accessed: 23.3.2015].
Willow garage ROS video 2010. [Available in: http://wiki.ros.org/hark] [Accessed: 26.3.2015].