leapfrog hospital rewards program™: implementation options catherine eikel february 6, 2006
TRANSCRIPT
Leapfrog Hospital Rewards Program™:
Implementation OptionsCatherine Eikel
February 6, 2006

2
Session Objectives
• Discuss Leapfrog Hospital Rewards Program Implementation Options
• Review criteria for designing the Leapfrog Hospital Rewards Program incentive & reward structure
• Review analyses demonstrating LHRP savings potential & describe how savings generate rewards pool
• Introduce LHRP Rewards Principles: the basis of the customizable model
• Illustrate how the LHRP creates value for participating employers & hospitals
3
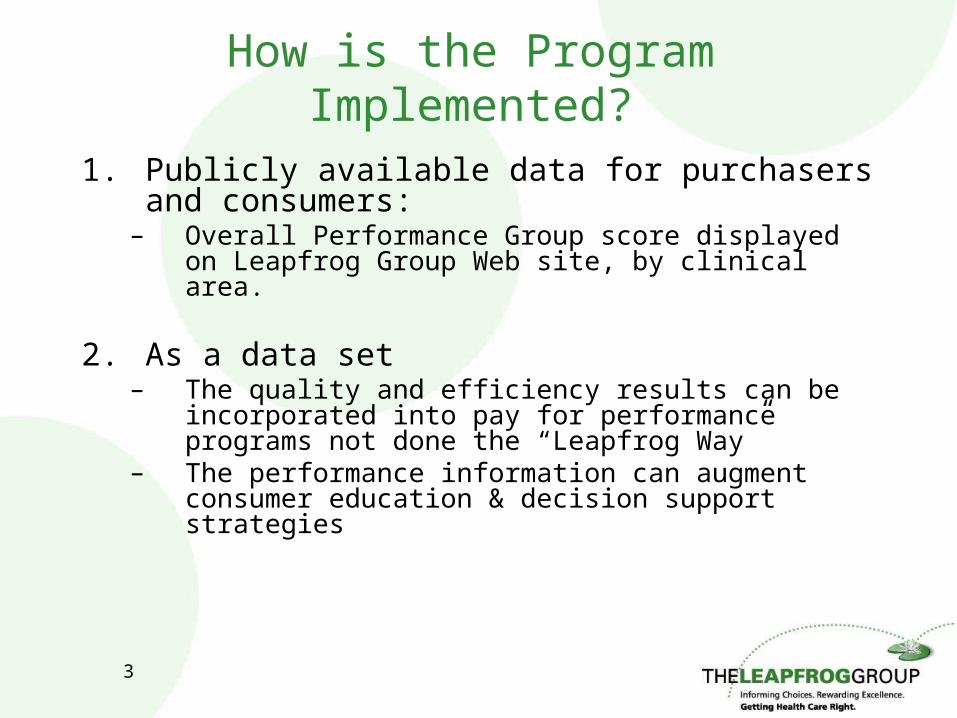
1. Publicly available data for purchasers and consumers:
– Overall Performance Group score displayed on Leapfrog Group Web site, by clinical area.
2. As a data set– The quality and efficiency results can be incorporated into
pay for performance programs not done the “Leapfrog Way”
– The performance information can augment consumer education & decision support strategies
How is the Program Implemented?

4
Uses of Summary Level Data
• Show hospitals’ LHRP performance in enrollee materials (e.g. provider directories)
• Incorporate quality and efficiency scores and/or performance group information into consumer decision support tools
• Incorporate quality and efficiency scores and/or performance group information into incentives & rewards programs
• Use performance data in network management or tiering programs
5
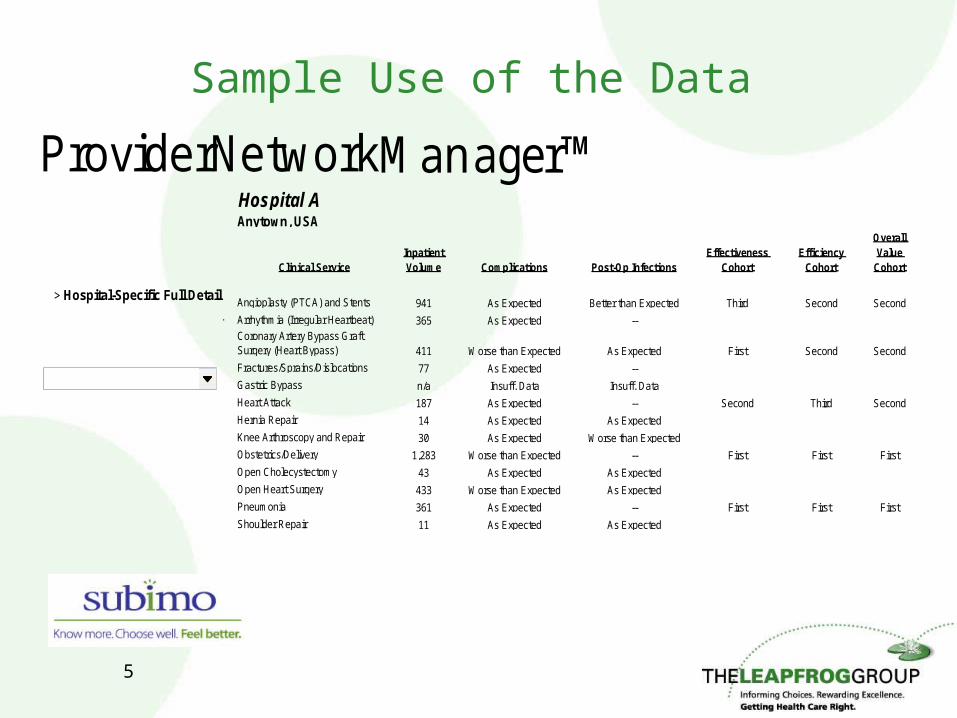
Sample Use of the Data
ProviderNetworkManager™Hospital AAnytown, USA
Clinical ServiceInpatient Volume Complications Post-Op Infections
Effectiveness Cohort
Efficiency Cohort
Overall Value
Cohort
Angioplasty (PTCA) and Stents 941 As Expected Better than Expected Third Second Second
Arrhythmia (Irregular Heartbeat) 365 As Expected --Coronary Artery Bypass Graft Surgery (Heart Bypass) 411 Worse than Expected As Expected First Second Second
Fractures/Sprains/Dislocations 77 As Expected --
Gastric Bypass n/a Insuff. Data Insuff. Data
Heart Attack 187 As Expected -- Second Third Second
Hernia Repair 14 As Expected As Expected
Knee Arthroscopy and Repair 30 As Expected Worse than Expected
Obstetrics/Delivery 1,283 Worse than Expected -- First First First
Open Cholecystectomy 43 As Expected As Expected
Open Heart Surgery 433 Worse than Expected As Expected
Pneumonia 361 As Expected -- First First First
Shoulder Repair 11 As Expected As Expected
Select a Level of Analysis:
Modify My Report:
> Show all Services> Sort by Volume> Sort by Post-Op Infections> Sort by Mortality> Sort by Effectiveness> Sort by Efficiency> Sort by Overall Value
> Overall Summary
> Summary by Outcome Type
> Download Clinical Data Detail
Select a Different Hospital:
> Hospital-Specific Full Detail
6
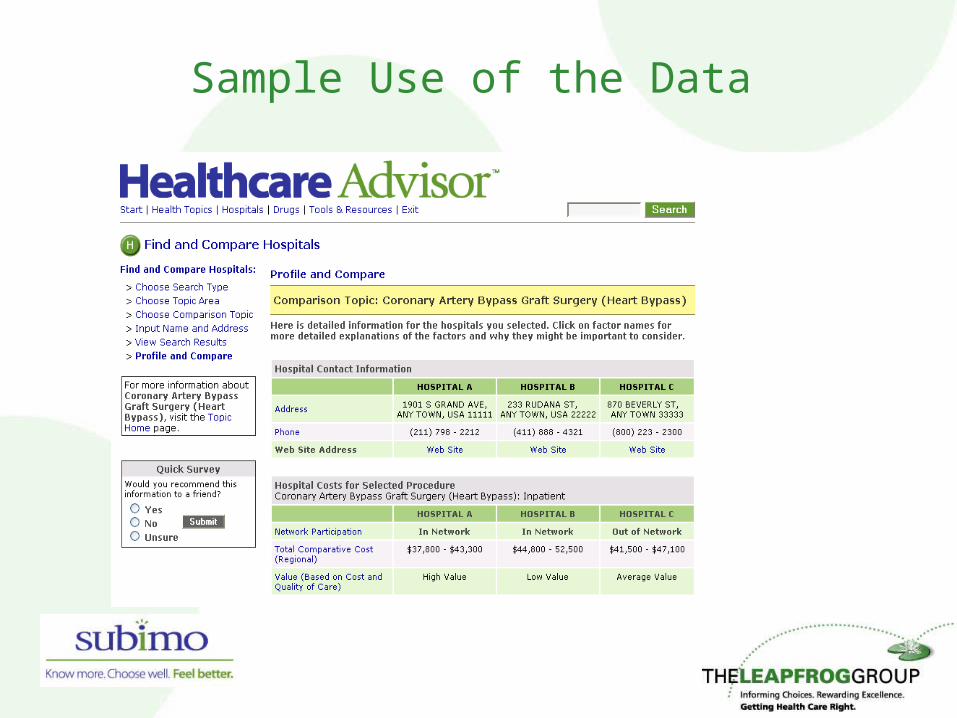
Sample Use of the Data
7
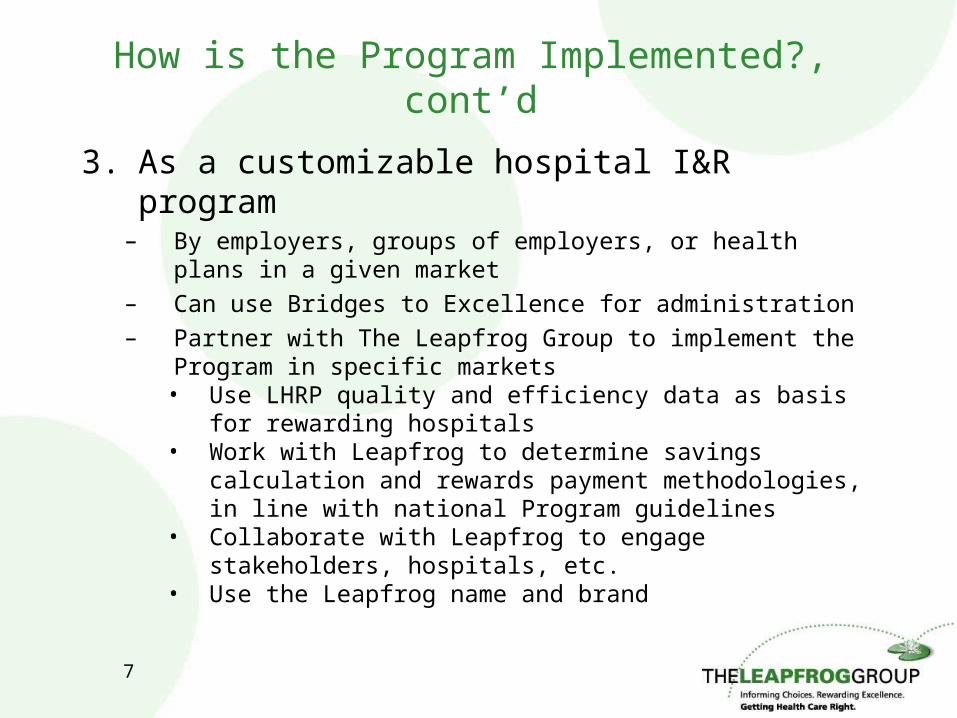
How is the Program Implemented?, cont’d
3. As a customizable hospital I&R program– By employers, groups of employers, or health plans in a
given market– Can use Bridges to Excellence for administration– Partner with The Leapfrog Group to implement the
Program in specific markets• Use LHRP quality and efficiency data as basis for
rewarding hospitals• Work with Leapfrog to determine savings calculation
and rewards payment methodologies, in line with national Program guidelines
• Collaborate with Leapfrog to engage stakeholders, hospitals, etc.
• Use the Leapfrog name and brand
Leapfrog Hospital Rewards Program™: Translating Performance into Hospital
Rewards and Payer Value
Savings Determination and Rewards Methodology

9
Developing national incentive & reward structure
• Actuarially based• Limited amount of new money on the table• Win-win for payers & providers: shared savings
model of determining rewards amounts• Opportunity for multiple types of rewards
– Financial (direct & indirect)– Non-financial
• Customizable to local markets

10
Determining Savings
11
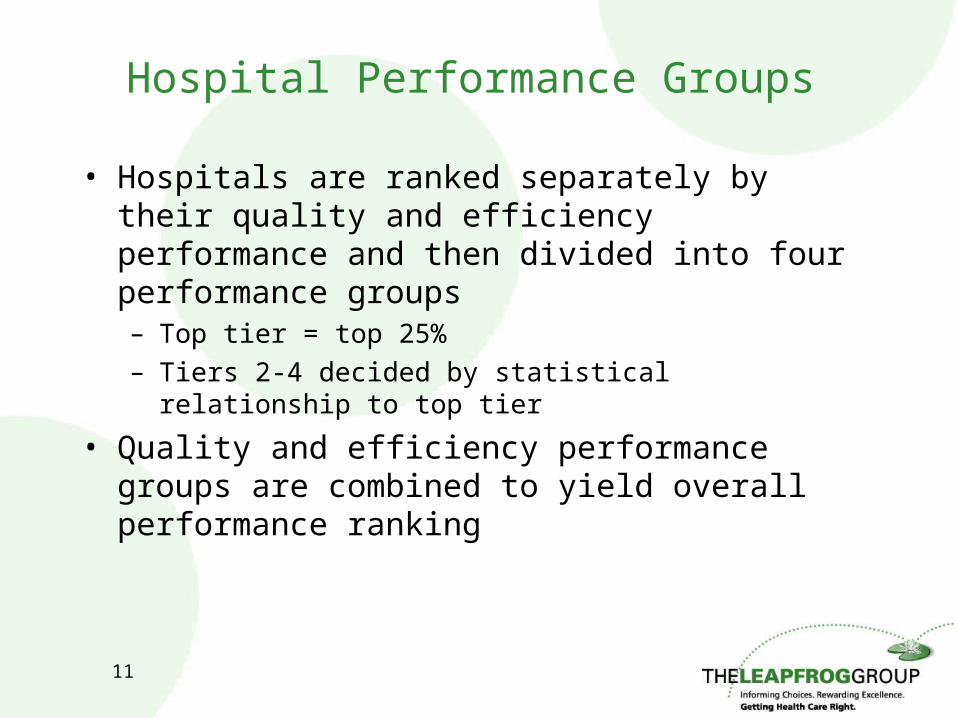
Hospital Performance Groups
• Hospitals are ranked separately by their quality and efficiency performance and then divided into four performance groups– Top tier = top 25%– Tiers 2-4 decided by statistical relationship to top tier
• Quality and efficiency performance groups are combined to yield overall performance ranking
12
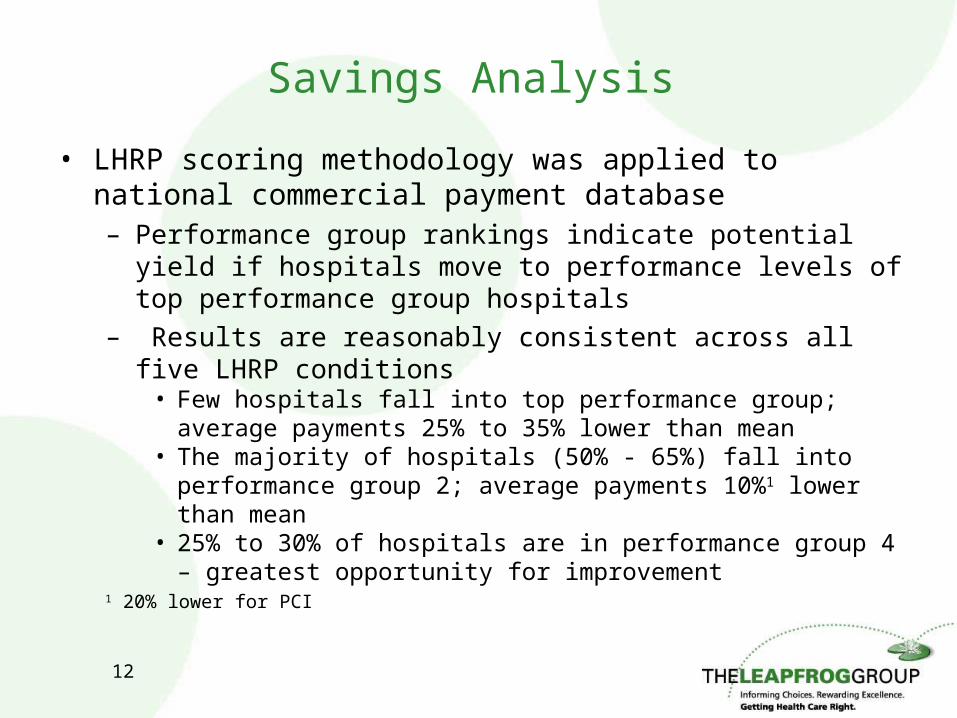
Savings Analysis
• LHRP scoring methodology was applied to national commercial payment database– Performance group rankings indicate potential yield if hospitals
move to performance levels of top performance group hospitals– Results are reasonably consistent across all five LHRP
conditions• Few hospitals fall into top performance group; average payments
25% to 35% lower than mean• The majority of hospitals (50% - 65%) fall into performance group 2;
average payments 10%1 lower than mean• 25% to 30% of hospitals are in performance group 4 – greatest
opportunity for improvement1 20% lower for PCI

13
Savings Analysis - Results
# hospitals
% of Total
HospitalsAvg
Payment
% of Grand Mean
# hospitals
% of Total
HospitalsAvg
Payment
% of Grand Mean
# hospitals
% of Total
HospitalsAvg
Payment
% of Grand Mean
Cohort 1 9 8.2% $13,631 65% 8 7.5% $24,685 71% 9 4.4% $4,851 76%
Cohort 2 56 50.9% $18,699 90% 55 51.9% $31,626 91% 115 56.1% $5,809 90%
Cohort 3 14 12.7% $23,372 112% 10 9.4% $39,145 113% 31 15.1% $6,723 105%
Cohort 4 31 28.2% $25,700 123% 33 31.1% $41,025 118% 50 24.4% $7,918 123%
110 100.0% $20,852 100% 106 100.0% $34,737 100% 205 100.0% $6,420 100%
# hospitals
% of Total
HospitalsAvg
Payment
% of Grand Mean
# hospitals
% of Total
HospitalsAvg
Payment
% of Grand Mean
Cohort 1 3 2.7% $11,050 73% 17 6.9% $3,071 75%
Cohort 2 72 64.9% $12,438 82% 137 55.7% $3,708 90%
Cohort 3 9 8.1% $17,641 116% 28 11.4% $4,082 99%
Cohort 4 27 24.3% $20,190 133% 64 26.0% $5,048 123%
111 100.0% $15,170 100% 246 100.0% $4,113 100%
1 Cohort 1 "Top Performance" Hospitals are Top Quadrant in Efficiency and Effectiveness
Grand Mean
Grand Mean
PCI Deliveries / Newborn
CAPAMI CABG

14
Savings Analysis, cont’d
• Analysis of hospital data tells us how much is saved when hospital efficiency improves
• Example: Each 1 unit reduction in Adj ALOS for AMI saves about $3,300 per admission
2004 A to 2004 B
-$20,000
-$15,000
-$10,000
-$5,000
$0
$5,000
$10,000
$15,000
-3 -2 -1 0 1 2 3
D Adj ALOS
D

15
National Program Rewards Principles
Principle 1: Bonuses to hospitals are 50/50 share of payer savings
Principle 2: All top performance group hospitals and hospitals that show sustained improvement should receive rewards. (First year bonuses should be considered an investment in the program.)
Principle 3: Patients should be encouraged to go to hospitals in top two performance groups (co-pay or co-insurance differential).
Principle 4: Rewards are calculated every six months based on market and performance group activity in previous six months.
Specific rewards methodologies can be tailored to local market needs.

16
Market-specific Implementation
• Tailor LHRP Rewards Principles based on the market:– Goals of program implementation– Current reimbursement mechanism in the market– Analysis of historic reimbursement information– Other recognition & rewards as part of “total rewards
package”
17
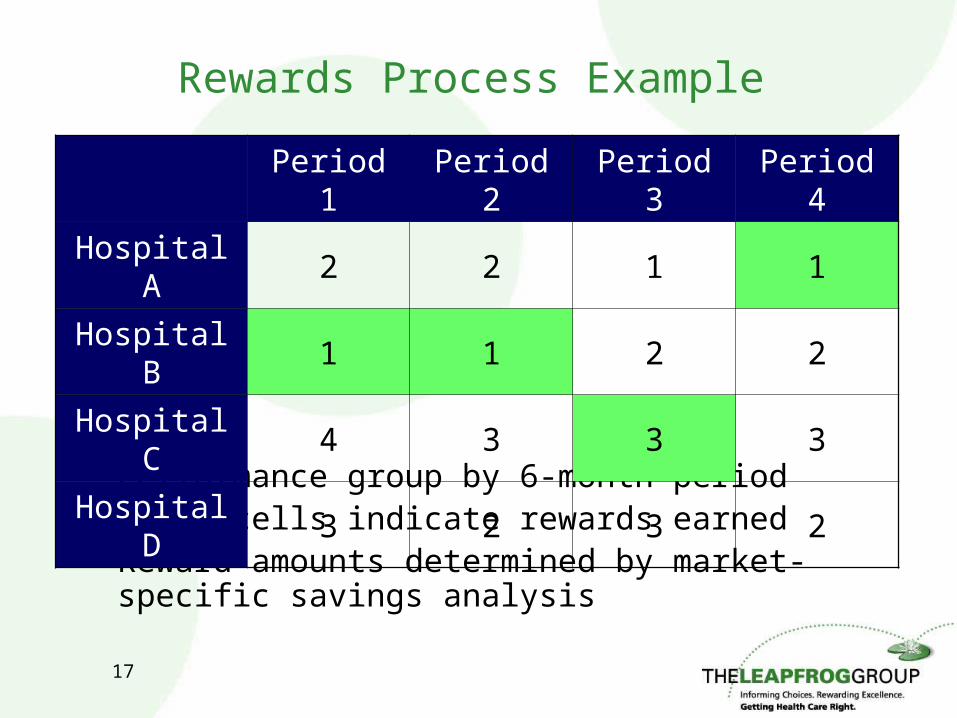
Rewards Process Example
• Performance group by 6-month period• Green cells indicate rewards earned• Reward amounts determined by market-specific savings
analysis
Period 1 Period 2 Period 3 Period 4
Hospital A 2 2 1 1
Hospital B 1 1 2 2
Hospital C 4 3 3 3
Hospital D 3 2 3 2
18
Payer Value
• No rewards are paid if no savings are generated• If savings are generated, payer shares 50% with
hospital• Positive ROI is designed into program• Hospital quality improvements motivated by Program
implementation

19
Hospital Value
• The Rewards Package:– Direct rewards– Patient shift– Public recognition
• Costs are kept low by use of existing data reporting systems and processes
• Data feedback & benchmarking reports catalyze performance improvements
20
Getting Started:Estimating Implementer ROI
• Inputs– Number and demographics of covered lives:
• Number of admissions for each of the five LHRP conditions
– Local hospital costs– Administrative costs– Assumptions about program adoption rates and
influence

21
Estimating ROI, cont’d
Year 1 Year 2 Year 3 Year 4 Year 5
Savings for AMI $0 $8,546 $17,782 $27,765 $38,554
Savings for CABG $0 $5,576 $11,614 $18,153 $25,231
Savings for CAP $0 $1,433 $2,976 $4,637 $6,428
Savings for PCI $0 $5,980 $12,476 $19,524 $27,163
Savings for OB $0 $8,137 $16,873 $26,254 $36,334
Total Savings $0 $29,672 $61,720 $96,333 $133,710
Reward Payments $0 $14,836 $30,860 $48,167 $66,855
Administrative Costs $15,000 $15,000 $15,000 $15,000 $15,000
Total Costs $15,000 $29,836 $45,860 $63,167 $81,855
Net Benefit($15,000
) ($164) $15,860 $33,167 $51,855
Cumulative Net Benefit
($15,000)
($15,164) $696 $33,863 $85,718
w These outputs are an only an estimate of future results.
Cumulative Net Benefit
($40,000)
($20,000)
$0
$20,000
$40,000
$60,000
$80,000
$100,000
1 2 3 4 5
Year
22
Getting Started: Program Implementation
• Assess the market– Leadership: are purchasers & payers familiar with The Leapfrog
Group and committed to incentive & reward programs?
– Is a plan or plans willing to administer the program on behalf of the employers in the area?
– How prevalent are the LHRP clinical areas in the population?
– How much does the market spend annually on the LHRP clinical areas?
– How many hospitals have already participated in the Leapfrog Hospital Quality and Safety Survey? What is the level of awareness of The Leapfrog Group and its efforts among the hospitals in the area?
– How are patients spread throughout the market? Is there opportunity for meaningful patient shift?
23
Program Implementation, cont’d
• Identify partners & market leaders: employers, plans, hospitals
• Seek help from The Leapfrog Group– Guidance in assessing the market– Use Leapfrog Hospital Rewards Program ROI Estimator to
determine program impact– Help identifying partners in specific markets