lear electrical power management systems supplier ... electrical power management systems supplier...
TRANSCRIPT

1
February 23, 2010Southfield, Michigan
Lear Electrical Power Management Systems
Supplier Communications Meeting

2
Supplier Communications Meeting – February 23, 2010
Company Overview, Financial Update and Business Outlook Matt Simoncini, SVP and CFO
Technology & ProcessMike Fawaz, Vice President Global Engineering
Hybrid / EV Technology – StrategyJeneanne Hanley, Vice President Business Development & Strategy
Supply Base Expectations / StatusBob Thomas, Vice President, Global Purchasing
Q and A Session

3
Lear CorporationCompany Overview, Financial Update
and Business OutlookMatt Simoncini
NOTE: The following financial slides were taken from the 2009 Q4 Earnings Call held on February 5, 2010.
The complete presentation is available at www.Lear.com.

4
2009 Company Overview
Operational Restructuring has reduced structural costs and improved global production footprintFinancial Restructuring has reduced total debt obligations and increased financial flexibilityContinued progress on sales diversification – 70% of 2009 net sales outside of North AmericaMaintained a leadership position in Seating – business performing near margin target, with significant growth opportunity in AsiaStrengthened global capabilities in Electrical Power Management – sales growth and margin improvement plans in place; significant opportunity in high-power and hybrids

5
Restructuring has Reduced Structural Costs and Improved Capital Structure
Operational RestructuringContinued comprehensive effort to restructure the Company’s global operations for improved long-term competitiveness. Since mid-2005, Lear has invested $740 million in restructuring actions, resulting in a significant reduction in structural costs and a major repositioning of our production footprint. Noteworthy actions include:
Divested money-losing Interior segmentClosed 35 manufacturing and 10 administrative facilitiesLocated 50% of total facilities and 75% of employment in 21 low-cost countriesAnnual ongoing savings totals approximately $400 million
Financial RestructuringVoluntarily filed for Chapter 11 bankruptcy protection on July 7th to complete a major capital restructuring. Emerged on November 9th with substantially lower total debt and improved financial flexibility. Ended 2009 with a cash balance of $1.6 billion and total debt of less than $1 billion.

6
Continued Progress on Sales Diversification
By Region By Customer
GM
North America30%
Europe47%
Rest of World 23%
Ford
2009 Net Sales
70% Of 2009 Net Sales Outside Of North America70% Of 2009 Net Sales Outside Of North America
All Other
BMW
VW/Audi
Fiat
PSA Group
Saab/Volvo
Mercedes Benz
Renault/Nissan
Chrysler
Jaguar/Land Rover
Asian OEMs

7
2005 2006 2007 2008 2009
Asia
Significant Growth Opportunity in Asia
$1,618
$1,168
$899
$1,673
$1,941
2005 2006 2007 2008 2009
China
$735
$540
$332
$828
$1,307
Consolidated Sales Non-Consolidated Sales
Lear’s Net Sales (in millions)
$1,309
$903

8
Business Segment Improvement Plans in Place
Global Capabilities and Low-Cost Footprint2010 to 2012 Sales Backlog of $800 millionSales Target -- $4 to $5 billionMargin Target -- 6½% to 7½%
Growth Opportunity in High-Power and Hybrid Electrical SystemsLear has won High-Power and Hybrid business with BMW, Chevrolet, Coda, Daimler, Land Rover, Nissanand Renault
Sales Growth and Margin Opportunity in Electrical Power Management
Chevy Volt Lear Content on Chevy Volt• High and low-voltage wire harnesses• Custom terminals and connectors, including the
industry’s first terminal with 250-amp capability• External charging cable with Lear’s Smart
Connector™ system• Battery charger and other proprietary electronic
components

9
Fourth-Quarter and Full-Year 2009 Results

10
Fourth-Quarter 2009Industry production improved year-over-year in mature markets; strong growth in Asia continuedNet sales of $2.7 billion, up 5% Core operating earnings of $116 millionFree cash flow of positive $11 million
Full-Year 2009Net sales of $9.7 billion, down 28% Core operating earnings of $107 millionFree cash flow of negative $156 million
2009 Financial Summary

11
Units % Change Units % Change(in millions) vs. Yr. Ago (in millions) vs. Yr. Ago
Europe 4.3 up 20% 15.7 down 17%North America 2.7 up 3% 8.5 down 32%
China 3.2 up 88% 10.8 up 48%India 0.7 up 56% 2.4 up 17%Brazil 0.8 up 52% 2.9 up 2%
Global 16.8 up 20% 56.9 down 13%
Fourth-Quarter 2009 Full-Year 2009
Fourth-Quarter and Full-Year 2009 Global Industry Production Environment
Source: Ward’s Automotive and CSM Worldwide

12
Fourth-Quarter and Full-Year 2009 Impact of Restructuring and Other Special Items
(in millions)
Reported Results
Fourth-Quarter
2009 Full-Year
2009
Pretax Income (Loss) Before Interest and Other Expense $ 1,237.0 $ 1,059.5
Reorganization items and fresh start accountingadjustments, net (1,513.4) (1,474.8)
Goodwill impairment charges 319.0 319.0
Costs related to operational restructuring actions** 57.8 164.1
Other special items 15.1 39.0
2009 Core Operating Earnings 115.5$ 106.8$
2008 Core Operating Earnings 22.0$ 418.4$

13
Fourth-Quarter and Full-Year 2009Seating Performance
Full-Year Explanation ofYear-to-Year Change
(in millions)SalesEarnings**
Adj. Earnings**
Adjusted Seating Segment Margins
Sales Factors
– Lower industry production in North America and Europe
– Unfavorable foreign exchange
Margin Performance
– Lower industry production in North America and Europe
– Net selling price reductions + Favorable cost performance + Restructuring savings
3.6%
6.1%
4.8%4.1%
Q408 Q409 2008 2009
$ 2,071.5 $ 2,173.7 $ 10,726.9 $ 7,812.9$ 32.5 $ 104.7 $ 386.7 $ 237.3$ 73.7 $ 133.2 $ 519.4 $ 322.2
14
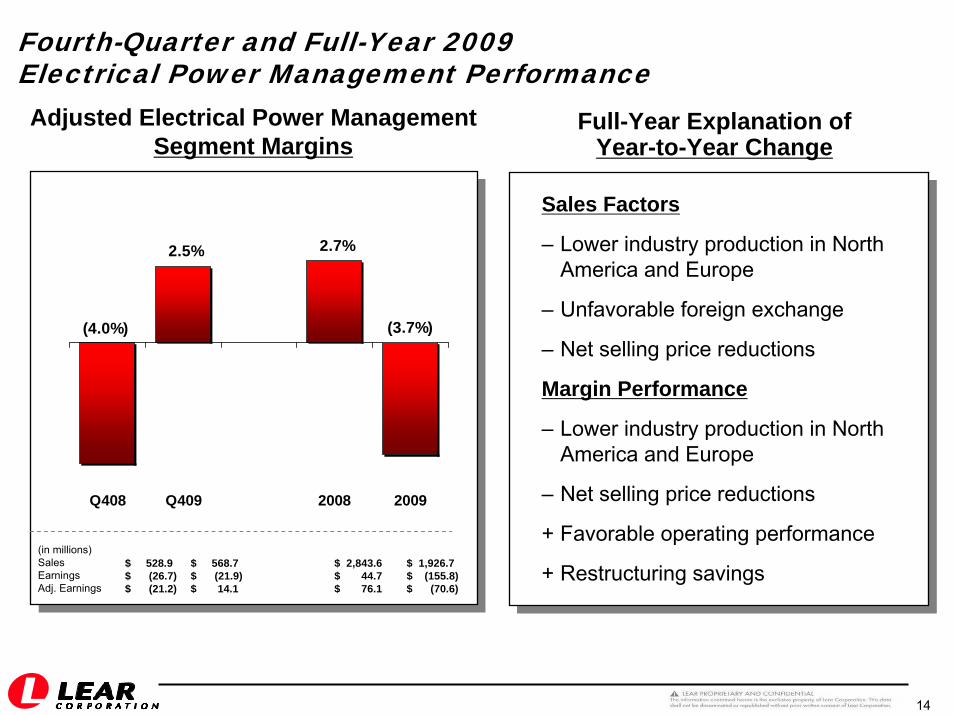
Fourth-Quarter and Full-Year 2009Electrical Power Management Performance
Full-Year Explanation ofYear-to-Year Change
(in millions)SalesEarningsAdj. Earnings
(3.7%)
2.7%2.5%
(4.0%)
Q408 Q409 2008 2009
$ 528.9 $ 568.7 $ 2,843.6 $ 1,926.7$ (26.7) $ (21.9) $ 44.7 $ (155.8)$ (21.2) $ 14.1 $ 76.1 $ (70.6)
Adjusted Electrical Power ManagementSegment Margins
Sales Factors
– Lower industry production in North America and Europe
– Unfavorable foreign exchange
– Net selling price reductions
Margin Performance
– Lower industry production in North America and Europe
– Net selling price reductions
+ Favorable operating performance
+ Restructuring savings

15
Total Debt and Cash(at 12/31/09)
$972
$1,554
Total Debt Cash
Key Balance Sheet Metrics
Debt obligations reduced by approximately $2.7 billion to $972 million
Adequate liquidity to support global operating needs and growth plans
No significant debt maturities until 2012
Covenants provide sufficient flexibility to navigate current environment and execute operating plan
$550
$375**
2010 2011 2012 2013 2014
Long-Term Debt Maturity Profile***
1st Lien Term 2nd Lien Term
(in millions)

16
Full-Year 2010 Financial Outlook
Full-Year 2010 Financial Outlook
Net Sales $10.2 to $10.7 billion
Core Operating Earnings $250 to $350 millionPretax income before interest, other expense, restructuring costs and other special items
Depreciation ≈ $240 million
Amortization ≈ $25 million
Interest Expense ≈ $85 million
Pretax Income $145 to $245 millionbefore restructuring costs and other special items
Estimated Tax Expense $70 to $90 million
Pretax Operational Restructuring Costs ≈ $110 millionCapital Spending ≈ $170 million
Free Cash Flow $50 to $100 million
North America Production 10.5 million unitsEurope Production 15.4 million units
Foreign Exchange $ 1.40 / €
Fully Diluted Shares Outstanding (Full Year Average) 54.0 million

17
Summary and Outlook

18
Lear’s strong customer focus and operating fundamentals remain unchangedCompleted financial restructuring in four months; emerged from Chapter 11 with a strong and flexible balance sheetYear-end 2009 cash balance of $1.6 billion and total debt of less than $1 billion2010 financial outlook:
Core Operating Earnings of $250 million to $350 millionDepreciation and Amortization of about $265 millionFree Cash Flow of $50 million to $100 million
2010 to 2012 consolidated sales backlog of net new business totals $1.4 billion
Well Positioned to Benefit from Industry Recovery with Well Positioned to Benefit from Industry Recovery with Competitive Cost Structure, Focus on Quality and Competitive Cost Structure, Focus on Quality and
Commitment to Customer Satisfaction Commitment to Customer Satisfaction
Summary and Outlook

19
Technology & ProcessMike Fawaz

20
Product Segmentation

21
Global Engineering Centers of Excellence
GLOBAL ENGINEERING PRESENCECENTERS OF EXCELLENCE
SOUTHFIELD, USA – Wire, Wireless, HybridREMSCHEID, GERMANY – T/CKRONACH, GERMANY – Audio, Gateway, LightingVALLS, SPAIN – JB, Body Control Modules
LOW COST CENTERSSHANGHAI, CHINA JUAREZ, MEXICOCEBU, PHILIPPINESMUMBAI, INDIA
GLOBAL ENGINEERING PRESENCECENTERS OF EXCELLENCE
SOUTHFIELD, USA – Wire, Wireless, HybridREMSCHEID, GERMANY – T/CKRONACH, GERMANY – Audio, Gateway, LightingVALLS, SPAIN – JB, Body Control Modules
LOW COST CENTERSSHANGHAI, CHINA JUAREZ, MEXICOCEBU, PHILIPPINESMUMBAI, INDIA

22
Objectives ─ Recognized global advanced research centers─ Eliminate redundancy─ Global collaboration─ Optimize use of LCC engineering & design
Expertise ─ Southfield, Remscheid, Valls, Kronach – primary centers─ Advanced technology development
Low Cost Engineering Centers2010 2011 2012
ESD LCC Engineering 55% 60% 65%
Advanced Development / Technology Needs to Deliver Value!─ Reduce Cost─ Reduce Size─ Reduce Weight─ Improve Quality
Global Engineering Centers of Excellence

23
Advantages• Reduces exposure to copper
price volatility by replacing some copper with steel in wire cross section
• Supported by global, low cost manufacturing and engineering centers
Product Features• Mass reduction achieved by
replacing most copper with aluminum wire
• Aluminum core, single strand with copper coating
• Utilized on battery cables and high voltage wire harnesses
Reduces exposure due to volatility of copper prices
Alternative Wire Technology
New TechnologyHybrid Stranding
Copper Clad Aluminum2ga – 0ga
Conventional Stranded Copper
4ga – 2ga
Copper Clad Aluminum Wire TechnologyReduced high power and battery cable copper usage Lear’s copper clad aluminum wire solution reduces mass and copper dependence by replacing copper alloy with copper clad aluminum (CCA). High power and battery applications offer the largest opportunities for CCA implementation.

24
Front Electronic ModuleIndustry leading integrated Body Control module with gateway functionalityThe front electronic modules integrates advanced gateway and lighting functions along with standard body control functionsFeatures include : Body functions( (wiper, windows, mirrors), Car Access (steering column lock, Passive Entry and Passive Start, Remote control services, central locking), Lights (interior, exterior and intelligent lights) , Gateway (Flexray, CAN, LIN, Ethernet) and smart junction box features.
Product Features• Multi Platform scaleable design.
• Multiple electronic features into one module: Body, Car Access, Lights, Gateway.
• Integrates Central gateway communication (Flexray,CAN, LIN, MOST)
• Fast Software Downloading at OEM plant ( Ethernet).
• Security functions to prevent unauthorized tampering or use
Advantages• High level of Hardware
integration resulting in cost and weight savings.
• Integration of Software models in an Autosar compliant architecture
• Scaleable across multiple platforms

25
Advantages• Flexible package and layout design allow maximum lamp design freedom.
• Easy Serviceability
• Country specific requirements are configurable in software
•LED control electronics can be integrated into active front light modules close to or directly inside headlamps
•In house thermal simulation and mechanical design capabilities support next generation lighting technologies
Product Features• Up to 100 LEDs offer unique appearance compared to conventional LED lighting
• LED based adaptive partial main beam enables the driver to leave the main beams constantly switched on.
• Precise beam areas in which unwanted areas can be dimmed
• Potential hazards are highlighted with special spotlight function.
• Superior illumination of the road ahead, compared to conventional LED lighting.
• LED lighting increases overall consumer satisfaction leading to enhanced quality rating
Adaptive Exterior LED Lighting ControlLighting modules are used to control LEDs in many lighting applications. LEDs are increasingly used in side markers, day time running lights, turn indicators, and low and high beam headlights Lear’s next generation LED driver solutions controls a headlamp consisting of up to 100 LEDs.

26
Hybrid / EV Technology & StrategyJeneanne Hanley

27
Lear Target Market ($5B in 2015)
By Hybrid Type
By Product
$-
$1,000
$2,000
$3,000
$4,000
$5,000
2009 2010 2011 2012 2013 2014 2015M
arke
t Siz
e ($
M)
Micro Mild Full Plug-in / EV
$-
$1,000
$2,000
$3,000
$4,000
$5,000
2009 2010 2011 2012 2013 2014 2015
Mar
ket S
ize
($M
)
Battery Chargers $790 MBattery Chargers $790 M
EVSE $230 MEVSE $230 M
HV Wire Harnesses $188 MHV Wire Harnesses $188 M
HV T&C $458 MHV T&C $458 M
Battery Connections $336 MBattery Connections $336 M
VQM $441MVQM $441M
HP Converters $640 MHP Converters $640 M
Traction Inverters $1.4 BTraction Inverters $1.4 B
LV Battery Monitoring $286 MLV Battery Monitoring $286 M
HV Battery Monitoring $81 MHV Battery Monitoring $81 M
Charging Systems High Power Distribution Energy Management Systems

28

29
Lear High Power Products by Hybrid and Electric Vehicle Type
Energy Management
Systems
Charging Systems
Power Distribution
Systems
Vehicle Attributes
Micro Hybrid Mild HybridFull Hybrid
(HEV)Plug-in Hybrid
(PHEV)
Extended Range Electric Vehicle
(EREV)Electric Vehicle
(EV)
Land Rover L405
Example Vehicle:Chevrolet Malibu Ford Fusion BYD F3DM Chevrolet Volt Coda
• Start-Stop • Start-Stop • Motor Assist
• Start-Stop • All-electric
mode capable
• Start-Stop • All-electric
mode capable• Battery
rechargeable from grid
• Start-Stop • Battery charged
from grid• Electric only drive• Gas generator
only
• Start-Stop • All-electric drive• Battery charged
from grid• No ICE
VQM
LV BMS LV BMS
DC/DCConverter
TractionInverter
DC/DCConverter
IntegratedPower
ModuleHV BMS
BatteryCharger
EVSE ChargeCoupler
RoundPin
Terminals
Same across vehicle types; Increasing Power Levels
HVWire
Harness
14.5mmBlade
Terminals
6.5mmBlade
Terminals
BatteryDisconnect
Unit
MasterService
Disconnect
HVConnector
Systems
Same across vehicle types; Increasing Power Levels
Same across vehicle types; Increasing Power Levels

30
Significant High Power / Hybrid Vehicle Awards
BBDUBBDU(Bulkhead Battery Disconnect)(Bulkhead Battery Disconnect)
EVSEEVSE(Electric Vehicle Supply Equipment)(Electric Vehicle Supply Equipment)
3.3 kW Battery Charger3.3 kW Battery Charger
HV/LV Electrical DistributionHV/LV Electrical Distribution MSDMSD(Manual Service Disconnect)(Manual Service Disconnect)
Energy Management Systems
High Power Distribution
Charging Systems
High Power Distribution
Charging Systems
Energy Management Systems
High Power Distribution
Charging Systems
Charging Systems
Chevy Volt

31
Summary
Targeted Market with Substantial Growth Opportunity
HEV/EV market growing at ~29% CAGR 2009-2014
2015 – $5B+ Target Market
Committed to a Flexible High Power Portfolio
Lear’s portfolio allows access into Micro’s through Full EVs
Global Center of Excellence in Southfield Michigan
100+ Patents / pending in High Power space
Continued Success Realized with OEMs
Major awards with key OEMs: Renault, Daimler, GM, BMW, JLR, Fisker
Projected to be approx. 7% of division’s revenue in 2012
Industry Leading Technology + Competitiveness + Reputation for Excellence = Growth

32
Supply Base Expectations / StatusBob Thomas

33
Global Purchasing Priorities
Current & Future Business
Global Systems Integration
Global Organization
Critical Supply Issue Management
Quality
Plant Disruptions
Supply Chain Execution
Flawless Launch Performance
Logistic Optimization
Warranty Improvement
Value Stream Optimization
Global Landed Cost
Material Cost Performance YOY
Supply Footprint Alignment
One Part – One Price
Data Transparency
Continual Cost & Quality
Improvement
Aligned Suppliers will Share in EED Growth Strategy

34
Global Supplier Quality Performance
71% of Global Suppliers PPM = ZERO
97
4361
13 21
0
20
40
60
80
100
2005 2006 2007 2008 2009
GLOBAL PPM
Lear Continues to Utilize Quality Data in Sourcing

35
Global Purchasing Priorities
2010 Goals 2009 Performance
Electronics: 42 Electrical: 13
48 Total Plant Disruptions 54% Improvement over 2008
1,115 Delivery / Logistics IssuesNon-conformances
Below Expectation
1. PPM ReductionElectronics (PPM): 10 Electrical (PPM): 10
2. Plant Disruptions 25% YOY Reduction
3. Delivery Improvement 100% On Time
4. Premium Inbound Freight $0
Current & Future Business
Supply Chain Execution
Continual Cost & Quality
Improvement

36
Plant Disruption Summary
25% Deterioration over 2008
Summary for the Week of 1/25/10:
Number of Suppliers = 43
Number of Different Raw Material Part Numbers = 72
Number of Customers = 20
Number of Lines Down = 72
Number of Operators Affected = 1,393
Lost Hours = 10,426.5
Material Quality
2009 Major Plant Disruptions
Stop Ship10%
Stockout6%
Customer Impact44%
Downtime40%
37
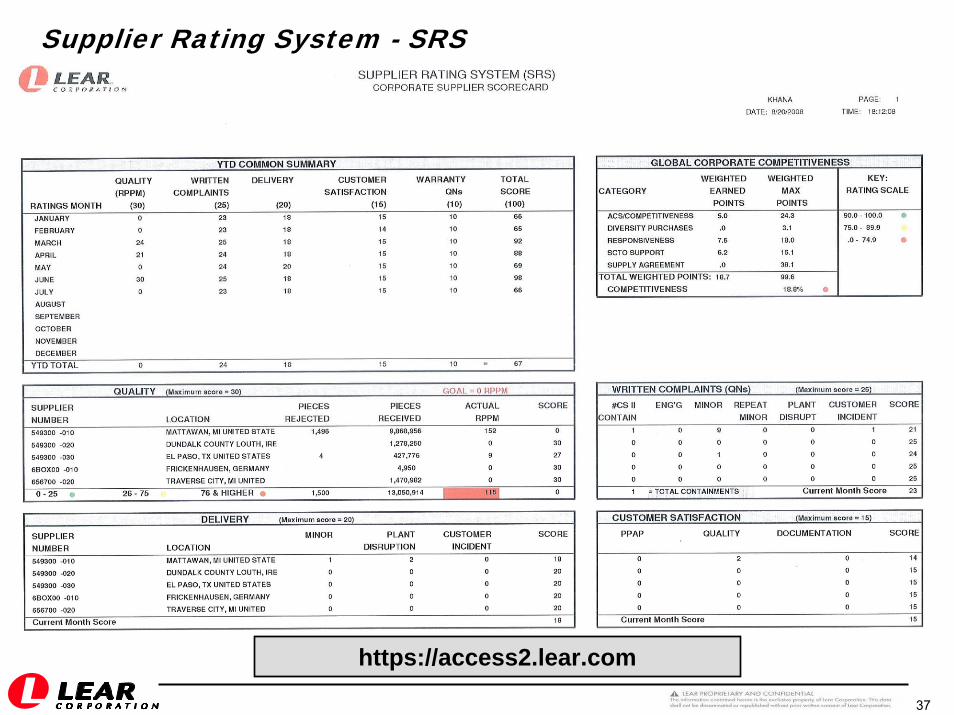
Supplier Rating System - SRS
https://access2.lear.com

38
Top 5 2010 Program Launches
BMW F25 – NA & EU Roll UpGateway, Top Hi Fi, Body Controller, Pre-FuseboxVolume: 190,000Customer: BMW Spartanburg, SCLear: ApodacaSOP: Sept. 2010
Chevy VoltBBDU, MSD, Chargers, Cordsets (EVSE), WiringCustomer: GMLear: Lear Monarca, Apodaca, TCSOP: Nov. 2010
Ford F250 Super Duty Truck (P473)Wiring and ElectronicsVolume: 250,000Customer: Ford Kentucky TruckLear: Apodaca and Juarez CitySOP: Feb. 2010
C1MCA – NA & EU Roll UpWiring, SJB, ElectronicsVolume: 650,000 (avg.)Customer: FordLear: 18 Lear Locations for full C1MCA businessSOP: Dec. 2010
Nissan X61GWiringVolume: 37,000Customer: Nissan Shatai Kyushu Plant
Calsonic Kansei OppamaLear: Cebu (Gabriela), PhilippinesSOP: Jan 2010
65 Total Global Launches# of Vehicle Platforms: 58
Total # of Customers: 23
Customer Manufacturing Countries: 11
Total Part Numbers: >6,000Keys to Success
Communication
Containment – Launch Protection Plan
Material Readiness
Stress the System

39
Global 2010 2011 2010Commodity Total Total Compression
Terminals & Connectors 82 72 10
Protections 60 55 5
Raw Material & Tooled 327 302 25
Electronics/PCB 157 147 10
Wire/Wire Assembly 38 33 5
664 609 55
Compression Plan will Bring Opportunities to Suppliers Aligned with Lear Strategy
Global Supply Base Compression

40
Central Transport CEVA Logistics
Flexible logistics infrastructure
40% reduction in truckload miles
64% reduction in LTL cost per pound
Supplier Success Stories

41
Global Purchasing 2010 Focus
Execute 2010 StrategyCost Reduction CommitmentsSupply Chain CompressionNew Product Technology & Cost Leadership
Launch FocusImprove Delivery & Quality PerformanceSupply Chain Readiness
Continue Lear Logistics Optimization Implementation
Maintain Customer Focus

42
Q & A