learn to relate observation to the internal state for ... · department of computer science and...
TRANSCRIPT

Department of Computer Science and Engineering University of Texas at Arlington
Arlington, TX 76019
Learn to Relate Observation to the Internal State for Robot Imitation
Heng Kou [email protected]
Technical Report CSE-2006-3
This report was also submitted as an M.S. thesis.

LEARN TO RELATE OBSERVATION TO THE INTERNAL STATE FOR
ROBOT IMITATION
by
HENG KOU
Presented to the Faculty of the Graduate School of
The University of Texas at Arlington in Partial Fulfillment
of the Requirements
for the Degree of
MASTER OF SCIENCE IN COMPUTER SCIENCE
THE UNIVERSITY OF TEXAS AT ARLINGTON
August 2006

Copyright c© by Heng Kou 2006
All Rights Reserved

To my mother, father and sister with all my heart.

ACKNOWLEDGEMENTS
I would like to express my deepest gratitude to my thesis supervisor Dr. Manfred
Huber for invaluable inspiration and guidance from very beginning of my graduate study.
Many thanks to him for introducing me to Artificial Intelligence and patiently explaining
every detail to me.
I also appreciate Dr. Diane Cook and Dr. Lynn Peterson for taking time to serve
on my committee and their valuable feedback.
I would like to thank my lab mates in the Robotics Lab for sharing their great
experience with me. Many thanks to Ashok, Eric and Srividhya for delicious food, nice
conversation and encouragements.
Finally I would like to give my special thanks to my parents and my lovely sister
for their endless love and encouragements. Although they are thousands of miles away,
they never leave me alone and always in my heart.
May 5, 2006
iv

ABSTRACT
LEARN TO RELATE OBSERVATION TO THE INTERNAL STATE FOR
ROBOT IMITATION
Publication No.
Heng Kou, MS
The University of Texas at Arlington, 2006
Supervising Professor: Manfred Huber
Imitation is a powerful form of learning widely used through our life. When you
learn a new sport, e.g. basketball, the fast way is to observe how an instructor or a player
is playing basketball. At the beginning you may just exactly follow the steps taken by
the instructor or player and practice with implicit or explicit feedback (reward and/or
penalty). From time to time you find a better way to play, which may be different from
the instructor or player.
In this thesis we present an approach that allows a robot to learn a new behavior
through demonstration. The demonstration is a sequence of observed states, representing
the state of the demonstrator and the environment. In order to imitate, the robot
develops an internal model, which contains all possible states that can be achieved by its
own capabilities and learns a mapping which allows it to interpret the demonstration by
relating observations to the internal states.
We introduce a distance function to represent the similarity between the observed
state and the internal state. The goal is that the robot learns the distance function,
v

i.e. the mapping between the observed states and internal states. Given a sequence of
observed states, the robot is then able to produce a policy by minimizing the distance
function as well as the actions’ cost. This approach works even if the demonstrator
and imitator have different bodies and/or capabilities, where the robot is only able to
approximately achieve the task.
In the learning approach presented here, the robot first learns the correspondence
between the observed state and the internal state. The robot then learns which aspect of
the demonstration is more important such that the robot is able to finish the task even
if the environment or its capabilities are different.
vi

TABLE OF CONTENTS
ACKNOWLEDGEMENTS . . . . . . . . . . . . . . . . . . . . . . . . . . . . . . iv
ABSTRACT . . . . . . . . . . . . . . . . . . . . . . . . . . . . . . . . . . . . . . v
LIST OF FIGURES . . . . . . . . . . . . . . . . . . . . . . . . . . . . . . . . . . ix
LIST OF TABLES . . . . . . . . . . . . . . . . . . . . . . . . . . . . . . . . . . . x
LIST OF ALGORITHMS . . . . . . . . . . . . . . . . . . . . . . . . . . . . . . . xi
Chapter
1. INTRODUCTION . . . . . . . . . . . . . . . . . . . . . . . . . . . . . . . . . 1
1.1 Motivation . . . . . . . . . . . . . . . . . . . . . . . . . . . . . . . . . . . 1
1.2 Outline . . . . . . . . . . . . . . . . . . . . . . . . . . . . . . . . . . . . . 4
2. RELATED WORK . . . . . . . . . . . . . . . . . . . . . . . . . . . . . . . . . 6
2.1 Imitation with Similar Bodies and/or Actions . . . . . . . . . . . . . . . 7
2.2 Imitation with Dissimilar Bodies and/or Actions . . . . . . . . . . . . . . 8
2.3 Our Approach . . . . . . . . . . . . . . . . . . . . . . . . . . . . . . . . . 13
3. IMITATION APPROACH . . . . . . . . . . . . . . . . . . . . . . . . . . . . . 15
3.1 Overview . . . . . . . . . . . . . . . . . . . . . . . . . . . . . . . . . . . . 15
3.2 A Framework for Imitation . . . . . . . . . . . . . . . . . . . . . . . . . . 16
4. LEARNING THE DISTANCE FUNCTION . . . . . . . . . . . . . . . . . . . 19
4.1 Derive a Policy Using the Distance Function . . . . . . . . . . . . . . . . 19
4.2 Learning the Policy as Well as the Distance Function . . . . . . . . . . . 22
4.3 Reinforcement Learning . . . . . . . . . . . . . . . . . . . . . . . . . . . 22
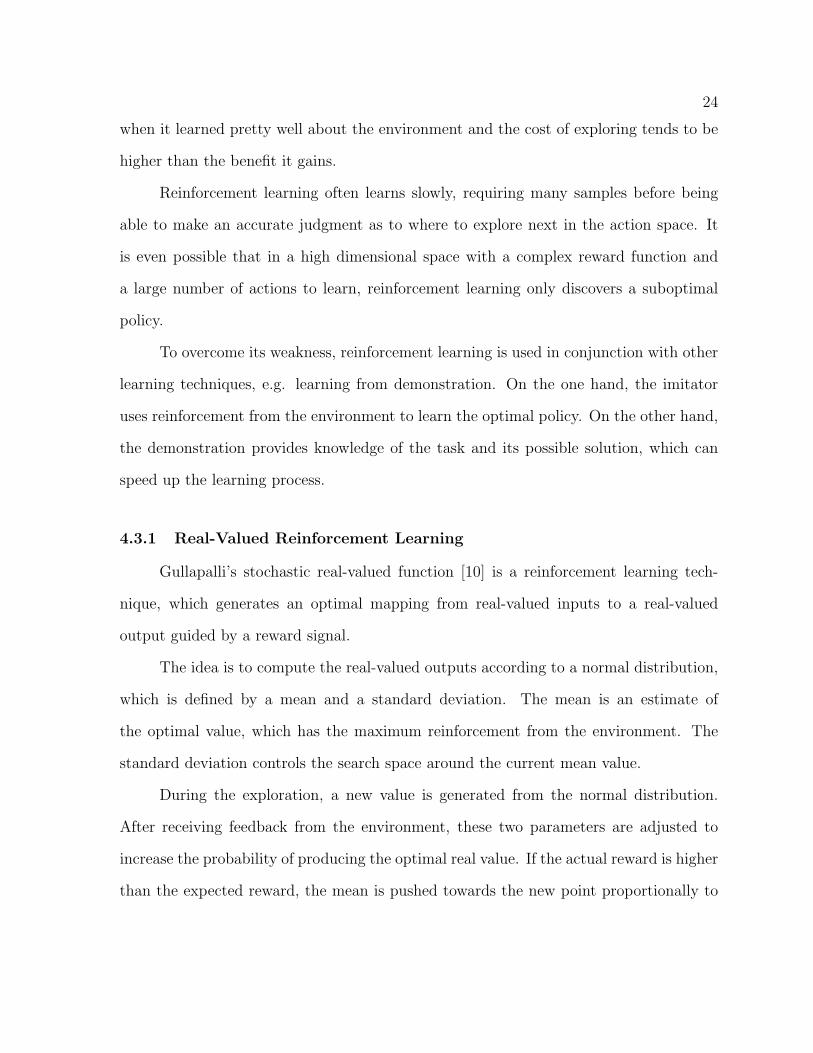
4.3.1 Real-Valued Reinforcement Learning . . . . . . . . . . . . . . . . 24
4.4 Exploration Over Policy Space . . . . . . . . . . . . . . . . . . . . . . . . 25
vii

4.5 Derive Distance Function From Policy . . . . . . . . . . . . . . . . . . . 27
4.6 Representation Issue . . . . . . . . . . . . . . . . . . . . . . . . . . . . . 28
4.6.1 Function Approximation . . . . . . . . . . . . . . . . . . . . . . . 29
4.6.2 Neural Network . . . . . . . . . . . . . . . . . . . . . . . . . . . . 30
4.6.3 Learning Algorithms . . . . . . . . . . . . . . . . . . . . . . . . . 35
4.6.4 Initialization Algorithm . . . . . . . . . . . . . . . . . . . . . . . 41
4.7 Discussion . . . . . . . . . . . . . . . . . . . . . . . . . . . . . . . . . . . 41
4.7.1 Our Approach vs. Purely Autonomous Learning . . . . . . . . . . 42
5. EXPERIMENTS . . . . . . . . . . . . . . . . . . . . . . . . . . . . . . . . . . 44
5.1 Introduction . . . . . . . . . . . . . . . . . . . . . . . . . . . . . . . . . . 44
5.1.1 State Representation . . . . . . . . . . . . . . . . . . . . . . . . . 45
5.1.2 Action Representation . . . . . . . . . . . . . . . . . . . . . . . . 45
5.2 Learning Procedure . . . . . . . . . . . . . . . . . . . . . . . . . . . . . . 46
5.2.1 Learning the Mapping Between Observed and Internal State . . . 46
5.2.2 Generalization in Dynamically Changing Environments . . . . . . 47
5.3 Example Tasks . . . . . . . . . . . . . . . . . . . . . . . . . . . . . . . . 47
5.3.1 Trash Cleaning . . . . . . . . . . . . . . . . . . . . . . . . . . . . 47
5.3.2 Toy Collection . . . . . . . . . . . . . . . . . . . . . . . . . . . . . 48
5.3.3 Futon Matching . . . . . . . . . . . . . . . . . . . . . . . . . . . . 49
5.4 Experiments Result . . . . . . . . . . . . . . . . . . . . . . . . . . . . . . 50
5.4.1 Evaluation Tasks . . . . . . . . . . . . . . . . . . . . . . . . . . . 51
5.4.2 Results . . . . . . . . . . . . . . . . . . . . . . . . . . . . . . . . . 52
6. CONCLUSION . . . . . . . . . . . . . . . . . . . . . . . . . . . . . . . . . . . 57
REFERENCES . . . . . . . . . . . . . . . . . . . . . . . . . . . . . . . . . . . . . 59
BIOGRAPHICAL STATEMENT . . . . . . . . . . . . . . . . . . . . . . . . . . . 61
viii

LIST OF FIGURES
Figure Page
1.1 Relate Observation to Internal States . . . . . . . . . . . . . . . . . . . 2
1.2 Fail to Relate Observation to Internal States . . . . . . . . . . . . . . . 3
1.3 Re-mapping with the Distance Function . . . . . . . . . . . . . . . . . . 4
3.1 Trash Cleaning . . . . . . . . . . . . . . . . . . . . . . . . . . . . . . . . 16
3.2 Imitation Model . . . . . . . . . . . . . . . . . . . . . . . . . . . . . . . 17
4.1 Derive a Policy . . . . . . . . . . . . . . . . . . . . . . . . . . . . . . . . 19
4.2 Learning the Distance Function . . . . . . . . . . . . . . . . . . . . . . . 23
4.3 Explore on Policy Space . . . . . . . . . . . . . . . . . . . . . . . . . . . 26
4.4 Multiplayer Perceptron . . . . . . . . . . . . . . . . . . . . . . . . . . . 31
5.1 Imitation Environment . . . . . . . . . . . . . . . . . . . . . . . . . . . 44
5.2 Trash Cleaning . . . . . . . . . . . . . . . . . . . . . . . . . . . . . . . . 48
5.3 Toy Collection . . . . . . . . . . . . . . . . . . . . . . . . . . . . . . . . 49
5.4 Futon Match . . . . . . . . . . . . . . . . . . . . . . . . . . . . . . . . . 50
5.5 Task Performance for Case 1 . . . . . . . . . . . . . . . . . . . . . . . . 53
5.6 Task Performance for Case 2 . . . . . . . . . . . . . . . . . . . . . . . . 54
5.7 Task Performance for Case 3 . . . . . . . . . . . . . . . . . . . . . . . . 55
5.8 Task Performance . . . . . . . . . . . . . . . . . . . . . . . . . . . . . . 56
ix

LIST OF TABLES
Table Page
4.1 Resource Requirement . . . . . . . . . . . . . . . . . . . . . . . . . . . . 42
5.1 Experiment Configuration for Trash Cleaning . . . . . . . . . . . . . . . 52
5.2 Experiment Configuration for Toy Collection . . . . . . . . . . . . . . . 52
x

LIST OF ALGORITHMS
2.1 Learning to Imitate . . . . . . . . . . . . . . . . . . . . . . . . . . . . . . 14
4.1 Gradient Descent . . . . . . . . . . . . . . . . . . . . . . . . . . . . . . . . 36
4.2 Scaled Conjugate Gradient . . . . . . . . . . . . . . . . . . . . . . . . . . 40
xi

CHAPTER 1
INTRODUCTION
1.1 Motivation
As robotic systems move into more complex and realistic environments, the need
for learning capabilities increases. With learning capability, the robot can deal with a
dynamic environment that is tedious or even impossible to completely captured by a
programmer. It also reduces the cost to preprogram a robot for each task. Traditional
learning approaches that use purely autonomous learning, provide a general solution for
a variety of tasks, but learning from scratch is not practical in the real world.
Imitation, also called learning from observation, overcomes some of the disadvan-
tages of both pre-programming and purely autonomous learning:
• Easy learning: The imitator could learn a new task by simply observing how a
demonstrator (human or artificial agent) executes the task.
• Fast learning: Imitation speeds up the learning process by transferring knowledge
from demonstrator to imitator – the demonstration is a possible solution of the
task.
• Easy training: The demonstrator could be an expert in any task domain without
an extensive technical background.
• Low training overhead: The demonstrator could continue its own work without
paying attention to the imitator.
Although imitation, as a powerful learning technique, is widely used in biological
systems, it introduces numerous challenges when we apply it to robotic systems:
1

2
• First the robot must be able to extract useful information from the demonstration.
Whenever there is a significant change in the environment, the robot could detect it
through its sensors, and segment the continuous sensor stream into a discrete rep-
resentation. Those aspects that cannot be directly observed or cannot be extracted
from the sensor stream won’t be represented in the observed model.
• Second, since the demonstration does not naturally look like the imitation, the
robot has to learn to interpret percepts from sensors. The robot’s interpretation
capability will affect the quality of the imitation.
• Third the robot must be able to address the problem that the demonstrator and
imitator have different bodies and/or capabilities, which is not unusual in the real
world.
The demonstration is a sequence of observed states, representing the state of the
demonstrator and the environment. Transitions happen whenever a significant change
has been detected. The internal states represent the state of the imitator and the envi-
ronment, which are achieved by using its own capabilities.
The imitation problem can be considered as relating the given demonstration to a
sequence of internal states which achieve the same effects (see Figure 1.1).
Internal States
Observation
Move Drop
Grab Move
Mapping
Figure 1.1. Relate Observation to Internal States.

3
When the demonstrator and imitator have similar bodies and capabilities, each
internal state exactly matches the observed state. But when the imitator is substantially
different from the demonstrator, the imitator may not be able to establish this mapping
and the imitation may fail. Figure 1.2 shows an example:
Demonstration
X
Internal States
Move Drop
Grab Move
Mapping
Figure 1.2. Fail to Relate Observation to Internal States.
In this example, the demonstrator executes a PUSH action but the imitator can
not. Although there is an alternative by executing a sequence of actions, i.e. grab, move
and drop, the imitator is not able to establish a mapping between the observed state and
internal state after it executes a GRAB action, thus the imitation failed.
In this thesis, we develop a framework that allows the robot to learn new behav-
iors from demonstrations. We introduce a distance function to represent the similarity
between the observed state and the internal state. The smaller the distance, the more
similar they are. The imitator tries to learn the distance function such that it is able
to find a sequence of internal states which approximates the demonstration even if the
imitator has a different body and capabilities from the demonstrator.
Figure 1.3 shows that with our approach the imitator is able to establish a mapping
between the observed states and the internal states even if no exact match exists.

4
Demonstration
Internal Model
Move Drop
Grab Move
Mapping
Figure 1.3. Re-mapping with the Distance Function.
To facilitate learning, the imitator first learns direct state correspondences by relat-
ing single step demonstrations to the internal policies. Then the more complex tasks are
used to learn the implications of the environmental differences and behavioral capabilities
on the imitator.
1.2 Outline
Chapter 2 first gives a review of previous work in this area; then several approaches
taken by other researchers will be discussed in detail; at the end our approach will be
presented.
Chapter 3 gives an overview of our imitation approach.
Chapter 4 first introduces the distance function, which represents the similarity
between the observed state and internal state, and explains how the imitator learns the
optimal policy and derives the distance function from that policy.
Second we describe reinforcement learning and real-valued reinforcement learning,
which the imitator uses to learn the distance function and the optimal policy.
Third we discuss neural networks, which are used as our distance function repre-
sentation. We present two popular neural network architectures, multilayer perceptrons
and radial basis function, and show the learning algorithms.

5
Chapter 5 gives a detailed description of our experiments and then shows the
results.
Chapter 6 presents a summary of the work described in this thesis.

CHAPTER 2
RELATED WORK
Imitation, as a powerful learning technique, has been heavily studied for years in
robotic systems. Researchers applied this mechanism to the control of robot arms [1], to
drive a robot through a maze [2], or to transport objects [3].
The work can be divided into two main areas: learning to imitate where the imi-
tator learns how to duplicate the demonstration, and learning from imitation where the
imitator learns the task model directly (e.g. in [2, 4], the robot learned to associate the
wall configuration with the appropriate action in a maze navigation). Learning from
imitation assumes that the correspondence between the demonstrator and imitator has
been established.
Learning to imitate can be further divided into action-level imitation and function-
level imitation [5]. In action-level imitation, the imitator tries to copy every single action
taken by the demonstrator. This has several drawbacks that make it impractical in many
real environments:
• Actions taken by the demonstrator may be irrelevant to the task.
• Actions taken by the demonstration can not be directly observed. What can be
observed is a state representation, a result of an action. Therefore an action recog-
nition approach must be provided.
• Imitation may fail when the imitator has a different body or different actions from
the demonstrator. For example, a robot without a gripper can not pick up an object
given a human demonstration that carries an object and drops it in the corner.
6

7
• Imitation may fail even if the mapping between the demonstrator and imitator has
been established, since two corresponding actions may have different effects. For
example, a child can not reach the top level of a shelf even if he/she raises the hand
as an adult does.
The action-level imitation only fits a limited number of imitation problems, like
learning to dance.
In function-level imitation, the imitator considers whether a certain sequence of
effects in the demonstration can be achieved through its own capabilities rather than
to focus on the actions taken by the demonstrator. The imitator tries to learn the
correspondence between the observed state and internal state such that it is able to
produce a policy even if its body and capabilities are different from the demonstrator.
Like in the action-level imitation, consider the example where the demonstrator is
a human while the imitator is a robot without a gripper. The demonstration is picking
up an object, moving to a target and dropping the object. In the function-level imitation,
the robot can perform the task by using its front pumper to push the object to the target.
In this chapter we first review the previous work done in this area where the
demonstrator and imitator have similar bodies and/or behavior, then discuss in detail
the approaches that have been taken for heterogeneous agents.
2.1 Imitation with Similar Bodies and/or Actions
Hayes and Demiris’s work [2] [4] focused on the imitation problem where the demon-
strator and imitator have similar behaviors. They tried to construct a robot controller
that allows a robot to learn to associate its percepts in the environment with the ap-
propriate actions. The experiment lets the robot learn to navigate through a maze by
following a demonstrator.

8
In [2], the demonstrator was a robot with different size. The imitator recognized the
action by detecting a change in the direction of the demonstrator’s movement, performed
a teacher-following behavior, and used its own observations to relate the changes in the
environment to its own forward, left and right turn actions. The association itself is a
set of if-then rules.
In [4], the demonstrator became a human. In order to detect the change in the
direction of a human’s movement, they used a neural network to classify the face image.
As the human’s head rotates the face image changes and so do the angular relationships
between the heads of the demonstrator and imitator. Although they proposed two alter-
natives in movement matching, (i) know each action’s effect and choose the one that has
the desired effect, and (ii) try all the available actions and choose the one that has the
minimum error function, they did not mention which one was used in the experiments.
Nicolescu and Mataric [3] proposed a hierarchical architecture where tasks are
represented in a graph. A graph node can be either an abstract behavior or a Network
Abstract Behavior, which can be further decomposed into lower level representations.
Abstract behaviors, which including execution conditions and the behavior effects, can
activate primitive behaviors to achieve the specified effect. This architecture allows to
address larger and more complex tasks, but it requires that demonstrator and imitator
have similar representations and capabilities, which might not be usual in real-world
system.
2.2 Imitation with Dissimilar Bodies and/or Actions
Atkeson and Schaal [1] implemented learning from demonstration on an anthropo-
morphic robot arm. The goal of the task is to have the robots learn a task model and
a reward function from the demonstration, rather than simply copying the human arm

9
movement. Based on the learned reward function and task model, an appropriate policy
is computed.
The pendulum swing up task is presented by a human, showing how to move the
hand so that the pendulum swings up and then is balanced in the inverted position.
During learning, feedback is given to balance the unstable inverted pendulum when it
is nearly upright with a small angular velocity. If the pendulum is within the capture
region of the feedback controller the task is considered to complete successfully.
The experiments first showed that following the human arm trajectory failed to
swing the pendulum up. The pendulum did not get even halfway up to the vertical
position and started to oscillate. This is due to the different hand structures between the
human and robot and the robot can therefore not exactly reproduce the human motion.
In order to find a swing up trajectory that works for the robot, they applied a planner
to learn a task model and a reward function. Both parametric model (with a priori
knowledge) and nonparametric model (a general relationship learned from the training
data) are constructed and learned. The planner used the human demonstration as initial
trajectories and penalized deviations from the demonstration trajectory with a reward
function. The demonstration provides an example solution and greatly reduces the need
for exploration.
Although the robot arm is different from the human’s, they did not focus on learning
the correspondence between the human hand trajectory and the robot arm’s. Instead
they tried to learn the task model directly, i.e. the relationship among pendulum angle,
pendulum angular velocity and the horizontal hand acceleration.
Nehaniv and Dautenhahn [5] said, “A fundamental problem for imitation is to
create an appropriate (partial) mapping between the body of the system being imitated
and the imitator.” They distinguished the effect-level imitation from action-level and
program-level imitation. Effect-level imitation concerns the effects on the environment

10
rather than particular actions, which is important when the demonstrator and imitator
have dissimilar bodies and/or actions.
To address the problem introduced by dissimilar bodies and/or actions, they tried
to find a set of actions which achieve the same effect on the state, then produce a set of
equivalent states. They also used a metric function to represent the similarity between
the observed states and internal states, which in turn is used to evaluate the badness of
imitation. By minimizing the sum of this metric function over all intermediate states,
the imitator can maximally achieve a successful imitation.
It is not clear how they determine whether two states are equivalent or not. Since
not every aspect of state information is relevant to the task, some aspects may be more
important than the other. Exactly matching won’t allow the robot to perform well when
the environment slightly changes. In addition, their metric function is simple, only 0
(equal) and 1 (non-equal), without intermediate values. The imitator may not be able to
produce a policy which approximately achieves the demonstration even if one sequence
of states is more similar to the observed states than the other.
Price and Boutiller [6] proposed an implicit imitation framework, which used im-
itation to accelerate reinforcement learning. Their work removed the assumption that
the demonstrator and imitator should have homogeneous actions. In order to overcome
this difficulty, two techniques were introduced in their model: action feasibility testing,
which allows the imitator to determine whether the observed state can be duplicated; and
k-step repair, where the imitator tries to find an alternative to approximate the observed
states.
Experiments are given in grid worlds, in which the imitator tries to approximately
match the path taken by the demonstrator. Different situations are considered, where
the imitator has different action capabilities, or where the state space for imitation is

11
slightly different from the one for demonstration. The agent employed with feasibility
testing and k-step repair outperforms others without these techniques.
Although they dealt with the case that the demonstrator and imitator may have
heterogeneous actions, they ignored the fact that the demonstration may be not optimal
for the imitator. The imitator always prefers the same action as the demonstrator 1.
Johnson and Demiris [7] introduced inverse-forward models to solve the correspon-
dence problem, i.e. to “link the recognition of actions that are being demonstrated to
the execution of the same actions by the imitator”. The inverse model takes the current
state and the goal state as input and produces the commands as output that can move
from the current state to the goal state. The forward Model produces the next state
given the current state and commands as input.
First a set of inverse models are executed at the same time with the same cur-
rent/goal states; second the commands produced are fed into a set of forward models;
third the predicted states produced by the forward models are compared with the actual
next state and a reward or penalty is given depending on whether they exactly match.
The reward or penalty is used to calculate the confidence of the inverse models. The
higher the confidence, the better its predicted state matches the observed state. Finally,
the demonstrator will choose the inverse model which has the highest confidence. To
overcome the dissimilar capabilities between the demonstrator and imitator, they allow
lower-level inverse models to signal their confidence to the upper level and let the upper-
level inverse models choose the closest component inverse model that performs well.
The confidence is the level of certainty that the imitator has about each inverse
model. It is either increased or decreased by a constant reward or penalty depending
whether the predicted state matches the actual state. When dealing with non-trivial
problems, the representation of the confidence becomes an issue.
1The k-step repair happens only if the action feasibility testing failed

12
To evaluate the inverse models, the imitation performs an exact match between the
predicted state and the actual state. Since the imitator has no way to know which aspects
of the demonstration are more important than others, it may sometimes fail to recognize
a match. Also, the exact match prevents the imitator from finding an approximate
imitation strategy.
Gudla and Huber [8] proposed a different approach to handle the case where the
demonstrator and imitator have different bodies and/or actions. They introduced a cost
function to represent the similarity between the observed and internal state, which is
a weighted-sum of the features in the environment, e.g. location, orientation, gold and
arrow. A stochastic reinforcement learning algorithm was used to learn the weight factor
for each feature such that the robot can determine which feature is more important in
this task domain. Combined with the action’s cost, the imitator tries to find a policy
that can as closely as possible achieve the observed states with less cost.
Two experiments were implemented in the Wumpus world. The Wumpus world
is a computer game that contains a number of locations, each of which may have gold,
obstacle, bottomless pit or a hidden mysterious monster, called Wumpus. An agent
moves through the environment to collect as much gold as possible while avoiding being
killed by falling into a bottomless pit or by the Wumpus.
In the first example task, the demonstrator shoots the Wumpus and brings the
gold back. The imitator, who does not have shooting capability, takes a path that
does not encounter the Wumpus and brings the gold back. In the second example, the
demonstrator brings the gold back and drops it at the start state. The imitator without
drop capability didn’t grab the gold and came back to the start state.
Similar to the metric function proposed by Nehaniv and Dautenhahn [5], the cost
function used here represents the similarity between the observed state and internal state.
Instead of just 0 and 1, this cost function is a weighted-sum of the difference for each

13
feature between the observed state and the internal state. Its drawback is that the cost
function considers each feature separately, which is not always true.
As we see, some approaches taken in previous work assume that either the demon-
strator and imitator have similar bodies and/or capabilities or the correspondence be-
tween the demonstrator and imitator has been established. Although other approaches
use a function to represent the similarity between the observed state and internal state,
the function either has a simple form or makes assumption about how the features are
related.
2.3 Our Approach
In this thesis, we develop a framework that allows the robot to learn the new task
by observing how a demonstrator - either a human or robot - executes the task. First
the robot tries to learn the correspondence between the observed states and the internal
states such that it is able to produce a policy to approximate the demonstration as closely
as possible even if it has different body and/or actions from the demonstrator. Second
the robot learns which aspects of the demonstration is more important to be able to
finish the task even if the environment slightly changes.
We use a distance function to represent the similarity between the observed state
and the internal state. The smaller the value, the more similar they are. The dis-
tance function is represented by a neural network, which makes no assumption about
the structure of the function, the correspondence of features, body characteristics or ac-
tion capabilities. Compared with the approaches taken in [8], [7], [5], it is general and
task-independent.
As the distance function is unknown, the robot learns the distance function through
reinforcement from the environment or the demonstrator. As a measure of the quality of

14
imitation is often difficult and subjective (observer-dependent), we use task performance
to approximate a measure of imitation quality.
Algorithm 2.1 shows how the robot learns the distance function as well as an optimal
policy.
Algorithm 2.1: Learning to Imitate
Given a demonstration, a sequence of observed state
repeat
Based on current distance function, produce a policy
Generate a new policy
if new policy has higher reward then
Derive a new distance function from the policy
Feed the new distance function into neural networkuntil no better policy has been found
Given a demonstration, the robot considers all possible internal states, calculates
the distance between the observed state and the internal state using the current distance
function, and derives the policy that it considers to be the closest2 to the demonstration.
Then it generates a new policy by exploring over the policy space, executes the
policy and receives reward from the environment. If the new policy outperforms the
current one, it means the distance function encoded in this new policy is more accurate
than the current one. The robot derives a new distance function from the new policy
and feeds it into the neural network.
This procedure is repeated until an optimal distance function is found. When an
optimal policy is found, we can assume that the robot has learned the correspondence
between the observed state and the internal state. When an optimal policy is found for
a number of different scenarios, we can expect that the distance function has correctly
identified important aspects of the demonstrations.
2The action’s cost is considered also.

CHAPTER 3
IMITATION APPROACH
3.1 Overview
Learning through observation is a learning technique widely adopted by humans
and animals. During the early phase of life, they try to establish the correspondence
between the demonstrator and themselves. As soon as this correspondence is established,
they can learn complex tasks easier. They also learn through practice under different
scenarios such that they can apply the new behavior even if the environment is slightly
different.
Learning through observation in biological systems presents a possible approach
for building learning capabilities in an artificial agent, e.g. a robot. The robot can learn
the new behavior from a demonstration given by an agent, either a human or another
artificial agent.
The demonstration is a sequence of observed states, representing the state of the
demonstrator and the environment. Transitions happen whenever a significant change
has been detected. The internal states represent the state of the imitator and the envi-
ronment, which are achieved by using its own capabilities.
Figure 3.1 shows a demonstration for a house cleaning task, where a house cleaner
walks around, picks up the trash, moves towards a trash bin and drops the trash.
You expect that the robot, even without legs, can not only produce a policy to
accomplish the cleaning task, but also distinguish trash from other objects from practice.
Although the demonstrator and imitator have different bodies and capabilities, it
is not necessary that the robot takes the same actions as the demonstrator does. As long
15

16
Demonstrator
Drop Trash
Trash
Trash: GREEN/PAPER
Obstacle: RED/WOOD
Trash Bin: BLACK/MARBLE
Move to Trash
Grab Trash
Move Trash Bin
Tra
sh
Figure 3.1. Trash Cleaning.
as the robot is able to achieve the same effects - i.e. find the trash and throw it into the
trash bin - it is a successful imitation. In order to achieve the same effects, the robot
must be able to learn the correspondence between the observed state and internal state,
e.g. an observed state where the demonstrator is next to a green object corresponds to
an internal state where the robot is next to a green object.
After this correspondence has been established, the imitator can learn which aspects
of the demonstration are more important, e.g. the characteristics of trash. This can be
done by letting the robot practice with different kinds of trash such that it is able to
ignore the irrelevant aspects and derive an optimal policy.
3.2 A Framework for Imitation
We develop a framework (see imitation part in Figure 3.2) which allows the robot
to learn new behavior through imitation.

17
Demonstration Imitation
Observation Modeling Mapping Execution & adaptation
Task Policy
Adjustment
Perceptual State Sequence
Observed States
Sensor Input
Action Output
Figure 3.2. Imitation Model.
Within the demonstration phase, the Observation and Modeling components allow
the imitator to observe the demonstrator and derive functional representations of the
demonstration.
Within the imitation phase, the Mapping component[8] tries to learn the corre-
spondence between the observed states and internal states, and to derive a policy that
as closely as possible achieves the task using its own actions. We introduce a distance
function to represent the similarity between the observed state and the internal state.
The smaller the distance, the more similar they are. By minimizing the total cost over
the entire sequence of internal states, including the distance and action cost, the robot
is able to find an optimal policy.
The imitator uses the A* algorithm[9] to derive a policy. Each node in the search
tree represents an observed/internal state pair. Each node has a cost, i.e. the actual
cost and the heuristic cost. The actual cost includes the action’s cost from the start
internal state to the current state, plus the distance between each internal state and its
corresponding observed state. The heuristic cost is the estimate of the cost from the
current state to the internal state corresponding to the last observed state.
The initial internal state is associated with the first observed state. Starting from
the initial internal state, the imitator develops the set of its successors using the available

18
actions1. Each action produces a new internal state, which either corresponds to the
same observed state as the current internal state or the next observed state. There is
one special successor in which the current internal state corresponds to the next observed
state without taking any action. After calculating the cost for each successor, they are
compared against other internal states. New states are added into the internal state set,
while the duplicate states with lower costs replace the existing ones. The internal state
with the smallest cost is chosen to be explored next. Each chosen state may affect the
final policy because of the fact that a new sequence of internal states with smaller costs
has been found. This procedure repeats until an internal state corresponding to the last
observed state is found, and a policy is finally determined.
The imitator learns the distance function as well as the optimal policy through
reinforcement learning. First the imitator uses the current distance function to derive
a policy. Second it generates a new policy by exploring over policy space. Then the
Execution and Adaptation component executes the new policy and receives feedback
from the environment. The feedback is given either by the demonstrator or a trainer in
the form of a scalar signal which indicates how good the imitator performs the task. If
the new policy gets higher reward, we assume its distance function is more accurate and
a new distance function is derived from that policy. Finally a neural network, which is
used to represent the distance function, is trained with this new distance function.
This procedure is repeated until no better policy has been found for a reasonable
period of time.
1By consider all possible actions, the robot is able to deal with the cases where the demonstrator andimitator have similar or dissimilar bodies and capabilities.

CHAPTER 4
LEARNING THE DISTANCE FUNCTION
4.1 Derive a Policy Using the Distance Function
In order to derive a policy, the imitator must consider both action cost and the
distance function. Figure 4.1 shows how the distance function affects the policy derived.
80
7 0 7
11| DI SS
22| DI SS
12| DI SS 21
| DI SS
5 0 5
23| DI SS
33| DI SS 32
| DI SS
4
34| DI SS
44| DI SS 43
| DI SS
20 0
65 2 78
5 3 10
4 0
Figure 4.1. Derive a Policy.
Each node here represents a state pair, an internal state and its corresponding
observed state, while a link represents a transition from an internal state to another one
by executing an action. The number in the node is the distance between the observed
19

20
state and the internal state. The number on each link is the action’s cost. The total cost
for each node is calculated as:
f = g + h (4.1)
g =n∑
i=1
(ASIi|SIi−1
+ DSIi|SDj
) (4.2)
where g is the actual cost from the start state to the current state; h is the estimated
cost from current state to the internal state which corresponds to the final observed state;
SIiis the internal state i, SDj
is the observed state j; SIi|SDj
is the state pair, the internal
state i and its corresponding observed state j; ASIi|SIi−1
is the action’s cost moving from
state SIi−1to state SIi
; DSIi|SDj
is the distance between the internal state i and its
corresponding observed state j.
Starting from the initial internal state, which corresponds to the first observed state,
the imitator always chooses the node with minimum cost (Equation 4.1) and generates its
successors using all available actions. Each action produces a new internal state, which
either corresponds to the same observed state as the current state, or corresponds to the
next observed state. In addition, a new successor is created from the current state which
corresponds to the next observed state without taking any action. New nodes are added
into the search tree while the duplicate nodes with lower costs replace the existing ones.
Then another node with the minimum cost is chosen to be explored next. This procedure
repeats until an internal state corresponding to the final observed state is found, and a
policy is derived.

21
Suppose the observed state sequence is SD1 −SD2 −SD3 −SD4 . In order to find an
optimal policy, both distance function and action cost are considered; e.g. the total cost
for taking policy π1: SI1|SD1 − SI2|SD2 − SI3|SD3 − SI3|SD4 is :
f1 = ASI1,SI2
+ DSI2|SD2
+ ASI2,SI3
+ DSI3|SD3
+ ASI3,SI3
+ DSI3|SD4
= 7 + 0 + 5 + 2 + 0 + 5
= 19
Similarly for policy π2 starting with: SI1|SD1 − SI2|SD2 − SI3|SD2 the cost is :
f2 = ASI1,SI2
+ DSI2|SD2
+ ASI2,SI3
+ DSI3|SD2
+ hSI3|SD2
(4.3)
= 7 + 0 + 5 + 78 + hSI3|SD2
(4.4)
= 90 + hSI3|SD2
(4.5)
since the distance between the internal state SI3 and its corresponding observed state SD2
is 78, its total cost is already larger than the cost of policy π1 even without considering
the heuristic cost.
In contrast, the distance between state SI4 and its corresponding observed state
SD4 is 3, which is smaller than the distance of state SI3|SD4 , but the action’s cost moving
from state SI3|SD3 to state SI4|SD4 is larger than the cost from state SI3|SD3 to state
SI3|SD4 .
In the end, the sequence of internal states SI1|SD1 − SI2|SD2 − SI3|SD3 − SI3|SD4
has the minimum cost and is chosen as the final policy taken by the imitator.

22
4.2 Learning the Policy as Well as the Distance Function
Because of the relationship between the distance function and the policy, the robot
can either learn the distance function and use it to produce the policy, or learn the policy
and derive the distance function accordingly.
Learning the distance function seems straightforward, but the problem is that there
are an infinite number of solutions for one policy. The robot may waste time learning
distance functions which produce the same policy.
On the other hand, there are fewer optimal policies for a given task 1. But there
are many distance functions that can produce the desired policy. Learning one possible
distance function is much easier than to learn a particular one. Thus the robot learns
the optimal policy and derives the distance from that policy. Figure 4.2 shows how the
imitator learns the distance function:
As both the distance function and the optimal policy are unknown, we need a
learning mechanism to guide the learning process. Reinforcement learning is a learning
technique, which allows the agent to learn the optimal policy through feedback (re-
ward/penalty) from the environment. As a measure of the quality of imitation is often
difficult (and subjective), the feedback is a measure of the task performance to approxi-
mate a measure of imitation quality.
Next we give a brief introduction of reinforcement learning and stochastic real-
valued unit.
4.3 Reinforcement Learning
There are three major learning paradigms, supervised learning, unsupervised learn-
ing and reinforcement learning, each corresponding to a particular learning task. Super-
1The internal state may correspond to a different observed state, but the outcome is the same.

23
Use distance function and A*Algorithm to generate currentpolicy
Genera te a new po l i cy byr a n dom l y p e r t u r b i n g t h edistance function in the A* tree
Execute new policy and receivereward
Reward is higher thanexpected reward of current
policy?
Calculate the minimum distancechange required at each nodefor the tree to produce the newpolicy
Train the neural network withupdated distance function
Yes
Converge or reachmaximum try?
NO
Yes
NO
Figure 4.2. Learning the Distance Function.
vised learning is usually used to learn a function from examples of its inputs and outputs
while unsupervised learning learns a pattern only through the examples of its input.
Unlike supervised learning, where the desired output is presented along with the
input, in reinforcement learning only the input is provided. The agent learns an optimal
policy through reinforcement, reward or penalty. This approach is suitable when the
optimal policy is unknown or cannot be identified directly.
In reinforcement learning, the agent is responsible to explore the environment while
learning a policy. Utilizing current knowledge to produce a policy is known as exploita-
tion, while randomly picking an action to produce a new policy that may yield a higher
reward, is known as exploration. It is reasonable that the agent explores during the early
stage of learning while it has no knowledge of the environment, and exploits at the end
24
when it learned pretty well about the environment and the cost of exploring tends to be
higher than the benefit it gains.
Reinforcement learning often learns slowly, requiring many samples before being
able to make an accurate judgment as to where to explore next in the action space. It
is even possible that in a high dimensional space with a complex reward function and
a large number of actions to learn, reinforcement learning only discovers a suboptimal
policy.
To overcome its weakness, reinforcement learning is used in conjunction with other
learning techniques, e.g. learning from demonstration. On the one hand, the imitator
uses reinforcement from the environment to learn the optimal policy. On the other hand,
the demonstration provides knowledge of the task and its possible solution, which can
speed up the learning process.
4.3.1 Real-Valued Reinforcement Learning
Gullapalli’s stochastic real-valued function [10] is a reinforcement learning tech-
nique, which generates an optimal mapping from real-valued inputs to a real-valued
output guided by a reward signal.
The idea is to compute the real-valued outputs according to a normal distribution,
which is defined by a mean and a standard deviation. The mean is an estimate of
the optimal value, which has the maximum reinforcement from the environment. The
standard deviation controls the search space around the current mean value.
During the exploration, a new value is generated from the normal distribution.
After receiving feedback from the environment, these two parameters are adjusted to
increase the probability of producing the optimal real value. If the actual reward is higher
than the expected reward, the mean is pushed towards the new point proportionally to

25
how much better it is, and the standard deviation decreases. Otherwise, the mean is
pushed away from the new point and the standard deviation increases.
Initially the mean is chosen randomly and the standard deviation is high which
allows the agent to explore the entire space of possible output values. As learning pro-
ceeds, the mean moves around the optimal value and the standard deviation decreases.
In the end, when the mean reaches the optimal solution, the variance becomes 0 and no
more exploration is performed.
4.4 Exploration Over Policy Space
In order to learn the distance function, the robot first generates the current policy
using exploitation, then it generates a new policy using exploration. Two policies are
compared to each other. If the new policy receives a reward higher than the expected
reward of the current policy, a new distance function is derived from the new policy.
To allow the robot to perform both exploration and exploitation reasonably, the
distance for each state pair is represented by a normal distribution, which is defined by
a mean and a standard deviation. The mean is the current distance, an estimate of the
optimal value which obtained the maximum reward from the environment. The standard
deviation controls the search space around the current mean.
Generating a new policy is similar to generating a regular policy. The only excep-
tion is that the imitator produces a new distance value based on its mean and standard
deviation rather than the current distance. Figure 4.3 shows how a new policy is gener-
ated through exploration over distance space.
On the left hand side, the numbers inside nodes B, C and D are the current distance
between the internal state and its corresponding observed state. The bold links represent
the current policy derived from the current distance function.

26
A
B C D
E F
G H
A
B C D
I J
K L
Current Policy New Policy
30 20 10 24 16 50
8 5
10
8 5
10
Figure 4.3. Explore on Policy Space.
On the right hand side, the numbers inside nodes B, C and D are the new distance,
the results of an exploration on distance space. Now node D has the smallest distance.
As the actual cost, action cost and heuristic cost2 do not change, the distance is the only
factor that may cause a change in the derived policy. The bold links show the new policy
derived from exploration.
As soon as the new policy is generated, the robot executes the policy and waits for
the reward from the environment. This reward is compared with the current one. If the
new one happens to be better, the robot would like to derive a distance function from the
new policy. This process repeats until no better policy has been found for a reasonable
period of time.
Initially the standard deviation is big such that the imitator is able to explore the
entire distance space. It gradually decreases (Equation 4.6), assuming the mean has
moved toward the optimal value.
σt+1 = σt ∗ γ (4.6)
2We assume that the nodes in each level correspond to the same observed state, thus the heuristiccost can be ignored at this moment.

27
where σt is the standard deviation at time t and γ is a discount factor with 0 < γ < 1.
4.5 Derive Distance Function From Policy
When the new policy receives higher reward, the imitator derives a new distance
function from that policy, rather than learning the distance function used to generate the
new policy. Since that distance function is generated by randomly exploring the distance
space, it might not represent previous tasks well. In addition, learning an arbitrary
distance function is easier than learning a particular one as there are an infinite number
of distance functions for a policy.
In order to derive a new distance function from a policy, the imitator increases the
distance for nodes that have been chosen in the current policy but not in the new one
and decreases the distance for nodes that have been chosen in the new policy but not
in the current one, such that this adjusted distance function is able to produce the new
policy:
• For those nodes in the current A* tree, which have the maximum cost in each
branch, increase the distance such that the cost is higher than the maximum cost
in the new policy.
• For the sibling nodes in the new A* tree, increase the distance such that the cost
is higher than the policy node in the same level and its successors.
• For each policy node in the new A* tree, decrease the distance such that its cost is
lower than the maximum cost of the current policy, and the cost of its siblings and
its predecessors’ siblings.

28
The change made to the distance function is proportional to how much better the
new policy is compared to the current one. The bigger the difference, the bigger the
change is:
∆i =
∑
k
sign(∆k,i)(|∆k,i|+ ε) ∗ (Rk − Rk)
max(∑
k
(Rk − Rk))(4.7)
where k is a task, ∆k,i is the change required for node i in task k which could be positive
or negative, ε is the margin, Rk is the reward of the new policy for task k and Rk is the
expected reward for the current policy generated by the network.
As we want to derive a new distance function with minimum change to the current
distance function, the imitator trains the neural network with the new distance function
for a fixed amount of time, then verifies whether the new policy can be produced. If the
answer is yes, a more accurate distance function has been learned; otherwise the imitator
tries to derive another new distance function based on the updated distance function.
4.6 Representation Issue
A distance function can be represented by a table, a simple function. But this will
only work when the task domain is small and simple. As the problem becomes more
complicate, a more suitable form of distance function is needed.
The nature of the distance function - given a pair of the observed and internal
states, return a value representing the similarity between them - allows the learning task
to be cast as a function approximation problem. We need a function approximator which
can generate appropriate distance values for the given states and make a good prediction
for those unseen.

29
Neural networks are one popular form for function approximation, having the capa-
bilities to approximate any continuous function to arbitrary accuracy when given enough
hidden units and an appropriate set of weights[11].
We use a multilayer perceptron network to represent the distance function. The
scaled conjugate gradient algorithm is used to train the network. Compared with back-
propagation and other learning algorithms, the scaled conjugate gradient algorithm is
easy to configure and shows good convergence.
4.6.1 Function Approximation
Representation is a big issue in artificial intelligent, which may affect performance
and generalization. For simple problems, explicit representations, e.g. a table or simple
function, can perform pretty well. But as the problem becomes more complicated, the
need for a suitable representation increases. The same happens here; we need a general
representation for our distance function. The nature of the distance function, calcu-
lating the distance for a given pair of observed state and internal state, is a function
approximation problem.
Function approximation deals with the problem of building an approximator (black
box model) to represent the relation 3 embodied in a given set of input/output pairs such
that the apporximator can generate appropriate output when presented with input and
also give a good prediction when given a new input.
Function approximation can be regarded as a problem of hypersuface construc-
tion. For the given training set, the inputs correspond to coordinates and the outputs
correspond to the height of the surface. Learning becomes the problem of hypersurface
reconstruction, including all the data points given in the examples and approximating
the surface between the data points (generalization).
3Suppose this relation exists between input and output.

30
Neural networks are a popular form for function approximation and have been
applied to many problems. Given a large enough layer of hidden units and an appropriate
set of weights, any continuous function can be approximated to arbitrary accuracy[11].
But it is still a challenge to actually find a suitable network configuration, i.e. a set of
parameters that provides the best possible approximation for the given set of examples.
4.6.2 Neural Network
Originally inspired by biological systems, neural networks are composed of units
which are connected through links. By choosing the number of hidden layers, the number
of units in each layer, and the activation function, you can construct different neural
networks for different problems. Too few units can lead to under-fit but too many units
can cause over-fitting, where all training points are well fitted but the network shows
poor generalization for new inputs.
There are two main structures for neural networks: feed-forward networks and
recurrent networks. A feed-forward network represents a function of its current input
whereas a recurrent network feeds its output back into its own inputs. The two popular
feed-forward networks are multi-layer perceptron and radial basis function, which are
discussing in the following.
4.6.2.1 Multilayer Perceptron Network
The multilayer perceptron network contains one input layer, one or multiple hidden
layers 4 and one output layer. Each layer contains a set of units. Every unit in each layer
is connect to a unit in the succeeding layer through a link, which is associated with a
4The more the hidden layers, the larger the space of hypotheses that the network can represent.

31
weight parameter. Figure 4.4 shows a three-layer feed-forward network, which contains
one input layer, one hidden layer and one output layer5.
Input …
…...
. x 1
x 2
x n
……
....
x 1
x 2
x n
g h
w ij
w j
Hidden layer
……
...
Output
y
Figure 4.4. Multiplayer Perceptron.
The units in the hidden layer and output layer have an activation function, e.g. a
sigmoid function:
g(x) =1
1 + e−x(4.8)
First each input unit is fed an element from an input vector ~x; then each hidden
unit calculates its net input Hx,j by applying a weighted-sum over all the input units,
Hx,j =∑
(wij ∗ xi) + Hb,j (4.9)
5Since there is no processing taking place in the input layer, this network is also called a two-layernetwork or a one-hidden-layer network.

32
where xi is input from input unit i, wij is the weight between input unit i and hidden
unit j, and Hb,j is the bias on hidden unit j. Then it applies the activation function g to
produce its output Hy,j:
Hy,j = g(Hx,j) (4.10)
Finally the outputs from the hidden layer arrive at the output layer which calculates
the weighted-sum, applies the activation function f 6 to produce the final output y of the
network.
y = f(∑
(wj ∗Hy,j) + Ob) (4.11)
where wj is the weight on the link between hidden unit j and the output unit and Ob is
the bias on the output unit.
4.6.2.2 Radial Basis Function Network
A Radial Basis Function Network can be regarded as a feed-forward neural network
with a single hidden layer and an activation function using a Gaussian function,
g(x) = e−|x−µ|2
2σ2 (4.12)
where µ and σ are the center and deviation of the Gaussian function, respectively.
When given an input vector, each hidden unit produces its output based on the
distance between the input vector and its center. The smaller the distance, the bigger
its output is. At the end, only those hidden units that are close enough to the input
vector contribute to the final output. In this sense RBF can be trained to represent a
distribution of the input data.
6The activation function in the output layer could be different from the one in the hidden layer

33
Usually the learning process in a RBF network is divided into two steps: unsuper-
vised learning and supervised learning. During unsupervised learning, the centers and
deviations of the hidden units are determined to represent the distribution of the sample
data. During supervised learning, the weights between the hidden units and output units
are adjusted to approximate the desired output.
In the unsupervised learning phase, the centers of all hidden units are selected to
reflect the natural clustering of the input data. The two most common methods are:
• randomly choosing from sample data points.
• choosing an optimal set of points as centers, such that each hidden unit is placed
at the centroid of clusters of the sample data, while each sample data point belongs
to the hidden unit that is nearest to it. This is called the K-means algorithm.
The deviation for each hidden unit is chosen such that Gaussians overlap with a
few nearby hidden units. You can choose one of the following methods:
• explicitly assign a value for all the hidden units, e.g. dmax√2m
, where dmax is the
maximum distance between the chosen centers and m is the number of hidden
units.
• K-Nearest neighbor. Each unit’s deviation is individually set to the mean distance
to its K nearest neighbors
Having determined the center and deviation for each hidden unit, the next step is
to learn the weights between the hidden units and output units. Any learning algorithm
applied to multilayer perceptrons can be used for RBF networks. An alternative is to
adjust not only the weights between the hidden units and output units during supervised
learning, but also the centers and deviation of the hidden units.
Although the unsupervised learning allows the RBF network to converge fast, pre-
determining the centers and deviation without reference to the prediction task is also a
weakness.

34
Another weakness is the high dimensionality of each hidden unit. Since the number
of dimensions of each hidden unit is determined by the number of input parameters, the
dimension of the hidden units increases as the input parameters increase. One solution
could be feature deduction by taking a good guess of the dimension of the hidden units
assuming that some input parameters are not as important as others.
4.6.2.3 Multilayer Perceptrons vs. Radial Basis Function Network
MLP and RBF networks are two popular nonlinear layered feed-forward network
types. They present all the characteristics of the feed-forward network, but differ from
each other in the following aspects:
• A MLP has one or more hidden layers while a RBF network only has a single hidden
layer.
• A MLP computes the inner product of the input vector and weights between the
input units and hidden units and then applies the activation function; a RBF
network uses the input vector directly by computing the Euclidean distance between
the input vector and the center of the hidden units.
• In a MLP, the hidden unit is one dimensional, while in a RBF network, the dimen-
sion of the hidden units is the same as the size of the input vector. As RBF networks
are more sensitive to the curse of dimensionality, it may have great difficulties if
the number of parameters in the input vector is large.
• RBF networks use Gaussians as their activation function while MLP use a sigmoid
function. Sigmoid units can have outputs over a large region of the input space
while Gaussian units only respond to relatively small regions of the input space.
• A MLP builds a global approximation for the given sample data set, while the
RBF network constructs a local approximation to represent the distribution of the
sample data.

35
• The output layer in a RBF network is linear, while in MLP it could be linear
(function approximation) or non-linear (classification).
• MLPs are trained by supervised learning, where the set of weights are adjusted
to minimize a non-linear error function. The training of RBF networks can be
split into an unsupervised learning phase, where the centers and deviations of the
hidden units are set based on sample data, and a supervised learning phase, which
determines the output-layer weights.
RBF networks’ local approximation make the learning process faster. But on the
other hand, it also implies that RBFs are not inclined to extrapolate beyond known data:
the response drops off rapidly towards zero if data points are far from the training data.
RBF networks, even when designed efficiently, tend to have many more hidden
units than a comparable MLP does. The larger the input space, the more hidden units
RBF networks require.
RBF networks’ local approximation and fast convergence are very attractive to
our imitation problem. The problem is that the sample data used for unsupervised
initialization does not reflect the distribution of the input space, which grows as the
imitation proceeds. Also as the input vector is pretty large, it dramatically drives up the
dimensionality of hidden units, which could be a potential problem.
4.6.3 Learning Algorithms
In order to find a suitable set of weights and biases, a learning algorithm is needed
to train the network. Most learning algorithms employ some form of gradient descent,
which takes the derivative of the error function with respect to the weight factors and
adjusts them in a gradient-related direction.
We start with back-propagation, then give a detail introduction of scaled conjugate
gradient[12].

36
4.6.3.1 Back-propagation
Backpropagation is a supervised learning technique used for training artificial neu-
ral networks. It requires that the activation function used by each unit be differentiable.
Standard backpropagation is a gradient descent algorithm in which the network
weights are moved along the negative of the gradient of the performance function.
Algorithm 4.1: Gradient Descent
Initialize each wi to some small random value;repeat
Initialize each ∆wi to 0;foreach < ~xj, yj > in the sample data set do
Input the instance ~x to the unit and compute the output oj;foreach wi linear unit weight do
∆wi = ∆wi − η∂Ej
∂wi;
foreach wi linear unit weight dowi = wi + ∆wi;
until the termination condition is met ;
It starts with an initial parameter vector, and iteratively adjusts weights to decrease
the mean square error.
∆wt = −η∂E
∂w(4.13)
wt = wt−1 + ∆wt (4.14)
where E is the performance function, usually the mean square error; ∂E∂w
is the
gradient; η is the learning rate, controlling the step size of the update; wt−1 and wt are
the weight factor at time t − 1 and t, respectively. ∆wt is the change being made to
weight w at time t.
As the direction is fixed, picking the learning rate for a nonlinear network becomes
a challenge. A learning rate that is too large leads to unstable learning. A learning rate

37
that is too small results in an incredibly long training time. When gradient descent is
performed on the error surface it is possible for the network solution to become trapped
in a local minimum. To overcome this problem, several variations are provided.
In Delta-bar-delta [13], the learning rate η is adaptable,
ηt =
ηt−1 + κ δt−1δt > 0
(1− γ)ηt−1 δt−1δt < 0
ηt−1 otherwise
where
δt =∂Et
∂wt(4.15)
δt = (1− α)δt + αδt−1 (4.16)
α is a momentum parameter, κ is the linear increment factor and γ is the exponential
decay factor. At each time step, the current derivative δt is compared with the previous
derivative δt−1 (averaged). If they possess same sign, the learning rate η is increased
linearly; if they possess opposite signs, the learning rate is decreased exponentially. The
idea of using momentum is motivated by the the need to escape from local minima, and
may be effective in certain problems.
Backpropagation is generally very slow because it requires small learning rates for
stable learning. The momentum variation is usually faster since it allows higher learning
rates while maintaining stability.

38
4.6.3.2 Conjugate Gradient Algorithm
Although the network being trained may be theoretically capable of performing
correctly, backpropagation and its variations may not always find a solution. This is par-
tially because of a constant step size and partially because it uses a linear approximation:
E(w + y) ≈ E(w) + E ′(w)T y (4.17)
where w and y are two weight vectors; E(w) is an error function (e.g. least square
function), E ′(w) is the partial derivative of the error function E with respect to each
coordinate component in vector w.
The conjugate gradient algorithm, as opposed to backpropagation, is based on the
second order approximation:
E(w + y) ≈ E(w) + E ′(w)T y +1
2yT E”(w)y (4.18)
where E”(w) is the Hessian matrix of the error function E.
Let p1, ..., pN be a conjugate system 7. The step from a starting point y1 to a critical
point y∗ can be expressed as a linear combination of p1, ..., pN
y∗ − y1 =∑
αipi, αiε< (4.19)
7A set of nonzero weight vectors p1, ..., pN in <N is said to be a conjugate system with respect to anonsingular symmetric N ∗N matrix A if pT
i Apj = 0(i 6= j, i = 1, , k)

39
where pi is the search direction which is determined recursively as a linear combination
of the current steepest descent vector, −E ′(yi), and the previous direction pi−1. α is a
step size, which can be represented as,
α = − pTj E ′(y1)
pTj E”(w)pj
(4.20)
As can be seen, in each iteration the conjugate gradient has to calculate the Hessian
matrix E”(wi), which requires O(N2) memory and O(N3) in calculation complexity[12].
One possible approach is to approximate the step size with a line search.
4.6.3.3 Scaled Conjugate Gradient
In the conjugate gradient algorithm, a line search is used to approximate the step
size to avoid the Hessian matrix calculation. The scaled conjugate gradient (Algorithm
4.2) tries to approximate the term sk = E”(wk)pk in the form
sk = E”(wk)pk (4.21)
≈ E ′(wk + σkpk)− E ′(wk)
σk
(4.22)
Scaled conjugate gradient stops when any of the following conditions occurs:
• The maximum number of epochs (repetitions) is reached
• The maximum amount of time has been exceeded
• Performance has been minimized to the goal
• The performance gradient falls below mingrad (e.g. 10−6)

40
Algorithm 4.2: Scaled Conjugate Gradient
1. Choose weight vector w1 and scalars 0 < σ < 10−4, 0 < λ1 < 10−6, λ1 = 0Set p1 = r1 = −E ′(w1), k = 1 and success = true
2. if success =true, then calculate second order information:σk = σ
pk
sk = E′(wk+σkpk)−E′(wk)σk
δk = pTk sk
3. Scale δk : δk = δk + (λk−λk)|pk|2
4. If δk ≤ 0 then make the Hessian matrix positive definite:λk = 2(λk − δk
|pk|2 )δk = δk + λk|pk|2λk = λk
5. Calculate step size:µk = pT
k rk
αk = µk
δk
6. Calculate the comparison parameter:∆k = 2δk[E(wk)−E(wk+αkpk)]
µ2k
7. If ∆k ≥ 0, then a successful reduction in error can be made.wk+1 = wk + αkpk,rk+1 = E ′(wk+1)λk = 0, success = true.If k mod N = 0 then restart algorithm:pk+1 = rk+1
elseβk =
|rk+1|2−rTk+1rk
µk
pk+1 = rk+1 + βkpk
If ∆k ≥ 0.75, then reduce the scale parameter:λk = 1
4λk
elseλk = λk
success = false8. If ∆k < 0.25, then increase the scale parameter:
λk = λk + δk(1−∆k)|pk|2
9. if the steepest descent direction kk 6= 0, then set k= k+1 and go to 2 elseterminate and return wk+1 as the desired minimum.

41
4.6.4 Initialization Algorithm
In the RBF networks, unsupervised learning is used to set center and deviation to
represent the distribution of the sample data, which speeds up the learning process and
its convergence.
Nguyen and Widrow [14] also proposed an initialization algorithm for a two-layer
neural network to improve the learning speed. Their approach generates initial weight
and bias values between input layer and hidden layer such that the active regions of the
layer’s neurons are distributed approximately evenly over the input space. Other weights,
those associated with hidden layer and output layer are chosen randomly from uniform
distribution in the range [-1, 1]. This algorithm is usually used as a default initialization
algorithm in the scaled conjugate gradient implementation.
In our experiments, randomly chosen weights behaved as well as this initialization
algorithm. This is because the inputs given during initialization do not represent the
distribution of the input space, it grows as the imitation proceeds.
4.7 Discussion
In our approach, the imitator learns the distance function as well as the optimal
policy. First the imitator learns the optimal policy through practical experience, second,
it derives a new distance function from the policy, and then trains the neural network
with this new distance function. In order to learn the distance function, the maximum
learning cost could be:
fmax = p ∗ d ∗ u (4.23)
where p is the number of practical experiences executed, d is the number of derivations
(of the new distance function) for each practical experience if it receives a higher reward,
u is the number of network updates for each new distance function derived.

42
Table 4.1 gives an estimate of cost for learning a distance function in our approach:
Table 4.1. Resource Requirement
number of practical experience, p 450 (average)number of derivation, d max. 100number of network updates, u max. 500
There is a tradeoff between imitation capabilities and the amount of time spent
on learning a distance function. But as the learning process proceeds, the learning cost
could dramatically decrease because the distance function becomes more general and the
number of derivations and network updates decrease.
In general, and in particular in robot applications this should be a good approach
because: (i) The derivation and network update can be done using off-line learning; (ii)
In robot systems, the amount of practical experience is usually considered by far the
most important measure and off-line learning is not quite as important as long as it is
reasonable.
4.7.1 Our Approach vs. Purely Autonomous Learning
Compared with the traditional learning approaches that use purely autonomous
learning, the imitation approach presented in this thesis has a number of advantages:
• The imitator learns the distance function as well as the policy. Like standard rein-
forcement learning, the imitator learns the optimal policy by exploring over policy
space and uses the reward from the environment to guide the learning process.
The imitator then derives the distance function from the policy using off-line learn-

43
ing. Thus there is no additional practical experience required to learn the distance
function beyond what is required to learn the policy.
• The distance function represents the similarity between the observed state and
internal state, which can be used to establish the correspondence between the ob-
served state and internal state. With this correspondence, the imitator is able to
learn the new task easier and faster. As the number of tasks increases, the overall
number of practical experiences should be lower than for the traditional learning
approaches because the distance function allows for a better initial policy for a
new learning task. At the same time, the overhead caused by learning the distance
function is expected to decrease also as the distance function becomes more general
and fewer changes should be required.
• Due to time limitation or other factors, a pure autonomous learning approach
may sometimes not be able to learn the task and thus might perform badly. Our
imitation approach still allows for reasonable task performance even if the system
has only one attempt at the new task, because of the established correspondence
and the similarity among the tasks.
Thus our imitation approach should most of the time be competitive and, as the number
of tasks to learn increases, should outperform systems that learn from scratch even in
terms of off-line learning costs.

CHAPTER 5
EXPERIMENTS
5.1 Introduction
Our experiments are implemented in a simulation domain. Figure 5.1 shows the
environment.
Trash
Toy: BLUE/PLASTIC
Toy Corner: BROWN/WOOD
Futon1: WHITE/COTTON
Futon2: BLACK/LEATHER
Sofa1: WHITE/COTTON
Trash: GREEN/PAPER
Obstacle: RED/WOOD
Trash Bin: BLACK/MARBLE
Tra
sh
Figure 5.1. Imitation Environment.
There are a number of objects, e.g. trash, obstacle and trash bin, where the
demonstrator and imitator can perform a set of tasks.
44

45
5.1.1 State Representation
The state, both observed state and internal state used in these experiments, is
expressed by a set of relationships between the demonstrator/imitator and objects1 in
the environment. Each object is either ”NEXT” to or ”AWAY” from the demonstrator
or imitator. The only exception is that whenever an object is dropped into a trash bin
it disappears and its representation in the state is removed.
There is one more relation to represent the status of the gripper, either empty or
having an object. When it is not empty, e.g. ”ON Gripper Toy”, it can not pick up
another object.
Except for the demonstrator, the imitator and the gripper, each object is repre-
sented by a set of features: color and texture. In each task, we intentionally make some
features more important than others, and let the robot learn from practice.
The robot has to learn the mapping between the observed state and internal state,
including not only the correspondence between the demonstrator and imitator, but also
the correspondence of features in the environment.
5.1.2 Action Representation
The robot used for the experiments here has some simple capabilities, e.g. moving
around, identify the color and texture of objects, carrying an object. Specifically it can
perform the following actions:
• Move target : Move from the current location to the target.
• Grab object : Pick up an object using its gripper.
• Drop: Drop the object from its gripper. One special case of this action is that when
the robot drops an object into a trash bin, the object disappears.
1The maximum number of objects in the environment is three.

46
There is one action that the demonstrator can execute but the imitator can’t, the
PUSH action2.
5.2 Learning Procedure
The learning procedure is divided into two phases. First the imitator learns the
correspondence between the observed state and internal state through a set of simple
tasks, e.g. moving to a particular object, or grabbing an object. Then a set of real world
tasks are given, e.g. trash cleaning, toy collection and futon match. During this step, the
robot learns the important aspects of the tasks by practicing under different scenarios.
The correspondence built in the first step can be used directly in the second step, which
speeds up the learning process.
5.2.1 Learning the Mapping Between Observed and Internal State
In this step, the robot tries to learn the correspondence between the observed state
and the internal state through a set of simple tasks. There are 27 instances, including
moving from one location to another, grabbing a particular object, pushing an object
towards somewhere or dropping.
As the demonstrator and the robot have different capabilities, the robot may not
perform a particular task in the same way as the demonstrator does. One example is
that the robot cannot execute a PUSH action, instead it executes a sequence of actions,
GRAB, MOVE and DROP to accomplish the task.
As the goal is to learn the correspondence between the observed state and internal
state, the environment for the imitation is the same as for the demonstration.
2The action executed by the demonstrator cannot be observed by the imitator. The action has to beinferred from the change in the environment

47
5.2.2 Generalization in Dynamically Changing Environments
After establishing the mapping between the observed state and the internal state,
the robot is sometimes able to produce an optimal policy when given a more complex
task. The problem is that the demonstration is given under one scenario, which does not
represent the real task domain. Even if the robot successfully imitates one task, we can
not expect it to perform well when the environment slightly changes.
Meanwhile, not every feature presented in the task is equally important, some of
them may be totally irrelevant. A practical approach is to let the robot practice under
different scenarios and learn important aspects of the task. By ignoring the irrelevant
aspects, the robot is able to derive an optimal policy even if the environment slightly
changes.
There are three tasks, trash cleaning, toy collection and futon match, with a to-
tal of 14 instances. Different scenarios are chosen randomly during each training step.
Whenever the robot executes a policy, it receives feedback from the environment or the
demonstrator. The feedback could be a full reward when it successfully finishes the task,
or a partial reward depending on how many subgoals it achieves.
5.3 Example Tasks
During the second learning phase, a set of complex tasks is given. It contains three
tasks, Trash Cleaning, Toy Collection and Futon Match. In the following section, we will
introduce them separately.
5.3.1 Trash Cleaning
In the cleaning task (Figure 5.2), there are three objects, trash, obstacle and trash
bin. The trash is distinguished from other objects by a GREEN color, which is not known
by the imitator.

48
Demonstrator
Drop Trash
Trash
Trash: GREEN/PAPER
Obstacle: RED/WOOD
Trash Bin: BLACK/MARBLE
Move to Trash
Grab Trash
Move Trash Bin
Tra
sh
Figure 5.2. Trash Cleaning.
Initially the demonstrator is far away from all the objects. It moves towards the
trash, grabs it, then carries it towards the trash can, and finally drops it into the trash
bin.
The robot has to learn not only the cleaning task, but also the identification of the
trash. During imitation, different types of trash are presented in the environment, i.e.
GREEN color objects with different texture. Whenever the robot drops trash into the
trash bin, it gets a reward. It even gets a partial reward when it achieves part of the
task, e.g. grab the trash.
5.3.2 Toy Collection
Figure 5.3 shows how a demonstrator performs a Toy Collection task - he moves
to a toy and pushes it towards a particular location, called Toy Corner.

49
Demonstrator
Trash
Toy: BLUE/PLASTIC
Trash: GREEN/PAPER
Toy Corner: BROWN/WOOD
Move to Toy
Push Toy toward Toy Corner
Tra
sh
Figure 5.3. Toy Collection.
Initially the imitator is next to the trash, it has to learn to deliver the toy to the
toy corner, not the trash.
The toy is distinguished from other objects by a PLASTIC texture, which is also
not known to the robot. Different kinds of toys are provided through various colors with
PLASTIC texture.
Another challenge of this task is that the robot does not have the PUSH capability.
Although the robot learns an alternative in the first training step, it must learn to apply
the same strategy under different scenarios.
5.3.3 Futon Matching
Futon Matching is a sorting problem, where the robot learns to put the futon on
the sofa whose color and texture are matched with the futon’s. The demonstration is
shown in Figure 5.4.

50
Futon1: WHITE/COTTON
Futon2: BLACK/LEATHER
Sofa1: WHITE/COTTON
Demonstrator
Grab Futon2
$
$
$
$
$
$
Drop Futon2
Move to Futon1
$ $
$
Grab Futon1
$ $
$
Drop Futon1
Move to Sofa1
Figure 5.4. Futon Match.
There are one sofa and two futons. The sofa is white and cotton, one futon is white
and cotton, the other is black and leather. Initially the black futon is on the sofa and the
demonstrator is next to them. The demonstrator grabs the black futon, moves towards
the white futon, drops the black one and grabs the white one. Finally the demonstrator
brings the white futon back and puts it on the sofa.
In order to learn the relationship between futon and sofa - the color and texture
match - the robot is given various types of sofas and futons, e.g. LEATHER, DENIM,
and TROPIC.
5.4 Experiments Result
In order to evaluate the distance function represented by the neural network, we
develop two distance functions, one is a random version, the other is a deliberate hand-
coded version.
51
These two distance functions reflect two extreme cases. On the one hand, the
random version knows nothing about the task and randomly generates a distance value
for each state pair. On the other hand, the hand-coded version knows every detail of the
training tasks and performs a complex calculation to produce the distance. Depending
on the environment which implicitly indicates the task, either an exact match or a partial
match is performed between the observed state and internal state:
• Whenever there is a trash bin around, the GREEN object’s texture is ignored.
• Whenever there is a toy corner nearby, the PLASTIC object’s color is ignored.
As the toy collection task is executed by the PUSH action in the demonstration,
to allow the robot to generate an alternative, we carefully assign a small distance
between the final observed state and the internal state sequence where the robot
tries to grab a toy, move to the toy corner and drop the toy.
• As long as the objects in the internal state have the same color and texture, ignore
the difference between the observed objects and internal objects.
• Otherwise perform an exact match.
5.4.1 Evaluation Tasks
We define a set of tasks for evaluation purpose. It contains three different types:
simple tasks, complex tasks and new evaluation tasks.
First we define three new instances for the simple task to verify whether the robot
learns the correspondence between the observed states and internal states. There are
three objects in the environment, including a yellow stone, a sofa and an obstacle. The
demonstrator performs a certain action in each demonstration, e.g. move, grab or drop.
Second we want to verify whether the training tasks have been learned or not.
Trash Cleaning and Toy Collection are selected for this purpose. Each task is trained
and tested under three different cases, which is shown in Table 5.1 and 5.2.

52
Table 5.1. Experiment Configuration for Trash Cleaning
Training TestingCase 1 green/metal, glass, stone, paper, wood green/cottonCase 2 green/metal, glass, stone, paper green/woodCase 3 green/metal, wood, stone, paper green/glass
Table 5.2. Experiment Configuration for Toy Collection
Training TestingCase 1 red, blue, yellow, white/plastic brown/plasticCase 2 brown, blue, yellow, white/plastic red/plasticCase 3 red, blue, brown, white/plastic yellow/plastic
Third we create two new tasks. One is a variation of the futon match task. Instead
of having two futons and one sofa, this task have two sofas with different color and
texture, and one futon matching one of them. We want to see whether the robot can
successfully finish the task after futon match training. The other one is a variation of the
trash cleaning task, where the demonstrator cleans two pieces of trash in the environment.
Different pieces of trash are given during the imitation.
5.4.2 Results
We have run 60 experiments over three different training and evaluation sets.
Figure 5.5 shows the task performance for case 1. (a) shows the average reward and
its standard deviation over 20 experiments, while (b) shows the result over 9 experiments
that learned a stable distance function within the given amount of training time. The
stable experiments are selected based on the task performance in the second training
step, by selecting those that did not find better policies for at least 6000 iterations.

53
-0.2
0
0.2
0.4
0.6
0.8
1
1.2
Random 1st 2nd Hand-coded
Rew
ard
Simple Tasks Complex Tasks New Tasks
(a)
-0.2
0
0.2
0.4
0.6
0.8
1
1.2
Random 1st 2nd Hand-coded
Rew
ard
(b)
Figure 5.5. Average reward for case 1 over 20 experiments(a) and 9 experiments(b).
In each figure, from left to right, are the task performance for four different distance
functions: random version(Random), distance function after first(1st) and second(2nd)
training step and the hand-coded version(Hand-coded), respectively.
Each distance function is evaluated on three different tasks: simple tasks, complex
tasks and new tasks. The number of instances for each type of tasks is different, 27 for
simple tasks, 14 for complex tasks and 7 for new tasks.
Figure 5.6 shows the results for case 2, where eleven experiments are selected as
stable using the same criteria as for Figure 5.5 (b).

54
-0.2
0
0.2
0.4
0.6
0.8
1
1.2
Random 1st 2nd Hand-coded
Rew
ard
(a)
-0.2
0
0.2
0.4
0.6
0.8
1
1.2
Random 1st 2nd Hand-coded
Rew
ard
(b)
Figure 5.6. Average reward for case 2 over 20 experiments(a) and 11 experiments(b).
Figure 5.7 shows the results for case 3. We can see that although the training and
evaluation sets are different between case 1, 2 and 3, the results are similar. After the
second training step, although the performance for the simple task degrades slightly, the
overall performance increases.
Figure 5.8 shows the overall performance over 60 experiments. After correspon-
dence training, the distance function performs well on the simple tasks, but not on the
more complex tasks and evaluation tasks. After the second training step, although the
performance on simple tasks degrades, the average reward over complex tasks and eval-

55
-0.2
0
0.2
0.4
0.6
0.8
1
1.2
Random 1st 2nd Hand-coded
Rew
ard
(a)
-0.2
0
0.2
0.4
0.6
0.8
1
1.2
Random 1st 2nd Hand-coded
Rew
ard
(b)
Figure 5.7. Average reward for case 3 over 20 experiments(a) and 9 experiments(b).
uation tasks increases. This is even clearly for the selected experiments, where not only
the average rewards increase, but also the standard deviations decrease.
The results show that the learned distance function significantly outperforms a
random function. For the cases where the learning approach found a stable solution, the
performance on the simple and the complex tasks is within one standard deviation of the
optimal hand-coded strategy. In addition, the performance on the new tasks shows the
approach is able to generalize beyond the training tasks to related new tasks.

56
-0.2
0
0.2
0.4
0.6
0.8
1
1.2
Random 1st 2nd Hand-coded
Rew
ard
(a)
-0.2
0
0.2
0.4
0.6
0.8
1
1.2
Random 1st 2nd Hand-coded
Rew
ard
(b)
Figure 5.8. Average reward over 60 experiments(a) and 29 experiments(b).

CHAPTER 6
CONCLUSION
As robotic systems move into more complex and realistic environments, the need
for learning capability increases. But traditional learning approaches that use purely
autonomous learning, often learn slowly. To overcome this weakness, they are used in
conjunction with other learning techniques. Imitation, also called learning from demon-
stration, is one choice as the demonstration provides a possible solution of the task.
The imitation problem can be considered as relating the given demonstration to
a sequence of internal states, which achieve the same effects. When the demonstrator
and imitator have similar bodies and capabilities, each internal state exactly matches the
observed state. But when the imitator is substantially different from the demonstrator,
the imitator may not be able to establish the correspondence between the observed state
and the internal state, and the imitation may fail.
In the previous work, some approaches assume that either the demonstrator and im-
itator have similar bodies and/or capabilities or the correspondence between the demon-
strator and imitator has been established. Although other approaches use a function to
represent the similarity between the observed state and the internal state, the function
either has a simple form or makes assumptions about how the features are related.
In this thesis, we introduce a distance function to represent the similarity between
the observed state and internal state. This distance function makes no assumption about
the structure of the function or the correspondence of features. By minimizing the
distance as well as action cost over the entire sequence of internal states, the imitator is
able to approximate the demonstration even if it has different body and capabilities.
57

58
The imitator learns the distance function as well as the optimal policy. Instead of
learning the distance function directly, it learns an optimal policy through reinforcement
from the environment and derives the distance function through that policy. As a measure
of the quality of imitation is often difficult and subjective (observer-dependent), task
performance is used to approximate a measure of imitation quality.
To facilitate learning, the imitator first learns the correspondences between the
observed state and internal state through some simple tasks. Then the more complex
tasks are used to learn the implications of the environmental difference and behavioral
capabilities on the imitator.
The experiments show that the imitator can easily learn the correspondence be-
tween the observed state and internal state even if it has different capabilities from the
demonstrator. As the tasks become more complex, the chance to find the optimal policy
varies.
After the second training step, the overall performance increases. If the imitator
performs well on the training task, its performance does not degrade dramatically on the
new tasks.

REFERENCES
[1] C. Atkeson and S. Schaal, “Robot learning from demonstration,” 1997.
[2] G. Hayes and J. Demiris, “A robot controller using learning by imitation,” 1994.
[3] M. N. Nicolescu, “A framework for learning from demonstration, generalization and
practice in human-robot domains,” Ph.D. dissertation, University of Southern Cal-
ifornia, May 2003.
[4] J. Demiris and G. Hayes, “Imitative learning mechanisms in robots and humans,”
Proceedings of the 5th European workshop on learning robots, pp. 88–93, 1996.
[5] C. Nehaniv and K. Dautenhahn, “Mapping between dissimilar bodies: Affordances
and the algebraic foundations of imitation.” Edinburgh, Scotland: In Proc. Euro-
pean Workshop on Learning Robots, July 1998, pp. 64–72.
[6] B. Price and C. Boutillier, “Imitation and reinforcement learning with heterogeneous
action,” 2001.
[7] M. Johnson and Y. Demiris, “Abstraction in recognition to solve the correspondence
problem for robot imitation,” 2004.
[8] S. V. Gudla and M. Huber, “Cost-based policy mapping for imitation,” in In pro-
ceedings of the 16th International FLAIRS Conference, St. Augustine, FL, 2003, pp.
17–21.
[9] P. Hart, N. Nilsson, and B. Raphael, “A formal basis for the heuristic determination
of minimum cost paths,” IEEE Transactions on Systems Science and Cybernetics,
vol. 4, no. 2, p. 100C107, 1968.
[10] V. Gullapalli, “A stochastic reinforcement learning algorithm for learning real-value
functions,” Neural Networks, vol. 3, pp. 671–692, 1991.
59

60
[11] K. Hornik, “Approximation capabilities of multilayer feedforward networks,” Neural
Networks, vol. 4, pp. 251–257, 1991.
[12] M. F. Møller, “A scaled conjugate gradient algorithm for fast supervised learning,”
Neural networks, vol. 6, pp. 525–533, 1993.
[13] R. A. Jacobs, “Increased rates of convergence through learning rate adaptation,”
Robert A. Jacobs, vol. 1, pp. 295–307, 1998.
[14] D. Nguyen and B. Widrow, Eds., Improving the learning speed of 2-Layer Neural
networks by choosing Initial values of the adaptive weights., vol. 3, no. 21-26. Proc.
of Intern. Joint Conference on Neural Networks.
[15] S. J. Russell and P. Norvig, Artificial Intelligence: A Modern Approach, second
edition ed. Prentice Hall, 2002.
[16] T. M. Mitchell, Machine Learning, first edition ed. McGraw Hill, 1997.
[17] A. J. Smith, “Dynamic generalisation of continuous action spaces in reinforcement
learning: A neurally inspired approach,” Ph.D. dissertation, University of Edin-
burgh, October 2001.
[18] C. M. Bishop, Neural Networks for Pattern Recognition. Oxford University Press,
1996, ch. Radial-Basis Function Networks, pp. 256–317.

BIOGRAPHICAL STATEMENT
Heng Kou received her Bachelor of Science degree in Computer Science from Branch
of Tianjin University, China. She started her graduate studies in August 2003 and
received her Master of Science degree in Computer Science and Engineering from The
University of Texas at Arlington in August 2006.
61