learning across megaprojects€¦ · 3 contents page about this report 4 the importance of learning...
TRANSCRIPT

Learning Across Megaprojects
The INNOMET Working Group Report Authors Naomi Brookes Giorgio Locatelli Miljan Mikic

2
COST – European Cooperation in Science and
Technology is an intergovernmental framework
aimed at facilitating the collaboration and
networking of scientists and researchers at
European level. It was established in 1971 by 19
member countries and currently includes 35
member countries across Europe, and Israel as a
cooperating state.
COST funds pan-European, bottom-up networks of
scientists and researchers across all science and
technology fields. These networks, called „COST
Actions‟, promote international coordination of
nationally-funded research.
By fostering the networking of researchers at an
international level, COST enables break-through
scientific developments leading to new concepts and
products, thereby contributing to strengthening Europe‟s
research and innovation capacities.
COST‟s mission focuses in particular on:
+ Building capacity by connecting high quality scientific
communities throughout Europe and worldwide;
+ Providing networking opportunities for early career
investigators;
+ Increasing the impact of research on policy makers,
regulatory bodies and national decision makers as
well as the private sector.
Through its inclusiveness, COST supports the
integration of research communities, leverages national
research investments and addresses issues of global
relevance.
Every year thousands of European scientists benefit
from being involved in COST Actions, allowing the
pooling of national research funding to achieve common
goals.
As a precursor of advanced multidisciplinary research,
COST anticipates and complements the activities of
EU Framework Programmes, constituting a “bridge”
towards the scientific communities of emerging
countries. In particular, COST Actions are also open to
participation by non-European scientists coming from
neighbour countries (for example Albania, Algeria,
Armenia, Azerbaijan, Belarus, Egypt, Georgia, Jordan,
Lebanon, Libya, Moldova, Montenegro, Morocco, the
Palestinian Authority, Russia, Syria, Tunisia and
Ukraine) and from a number of international partner
countries. COST‟s budget for networking activities has
traditionally been provided by successive EU RTD
Framework Programmes. COST is currently executed
by the European Science Foundation (ESF) through
the COST Office on a mandate by the European
Commission, and the framework is governed by a
Committee of Senior Officials (CSO) representing all its
35 member countries.
More information about COST is available at
www.cost.eu
© University of Leeds
Published by the University of Leeds, April 2015
ISBN 978-0-9576805-5-5
While the publisher and author have used their best efforts in preparing this book, they make no representations or warranties with respect to the accuracy or completeness of the contents of this book and specifically disclaim any implied warranties of merchantability or fitness for a particular purpose. No warranty may be created or extended by sales representatives or written sales materials. The advice and strategies contained herein may not be suitable for your situation. You should consult with a professional where appropriate. Neither the publisher nor authors shall be liable for any loss of profit or any other commercial damages, including but not limited to special, incidental, consequential, or other damages.
All rights reserved. No part of this publication may be reproduced, stored in a retrieval system or transmitted, in any form or by any means, electronic, mechanical, photocopying, recording or otherwise, without the prior permission.

3
Contents
Page
About This Report
4
The Importance of Learning Across Megaprojects
5
Learning Across Megaprojects: Inductive Cross-Case Analysis
6
Learning Across Megaprojects: Non-Parametric Techniques
11
Learning From Learning: What Really Matters to European Megaprojects
22
Appendices
Appendix A – INNOMET Members and Working Group Meetings
25
Appendix B – Publications Produced by the INNOMET Working Group
26

4
About this report
This volume forms part of the MEGAPROJECT suite of reports that document the
work of the MEGAPROJECT COST Action. This report aims to give a swift and
succinct account of the work of the INNOMET Working Group and its related
activities, one of the teams established by MEGAPROJECT to undertake further
work in developing the MEAPROJECT key themes. The other volumes in this series
are:
Delivering European Megaprojects
A Megaproject Research Framework
The MEGAPROJECT Portfolio
Risk in the Front-End of Megaprojects
Managing Stakeholders in Megaprojects
Special Purpose Entities in Megaprojects
All the guides can be downloaded from the MEGAPROJECT website (www.mega-
project.eu)
MEGAPROJECT identified that learning across megaprojects was a critical activity
in improving their performance. Because of this, it established the INNOMET
Working Group to achieve two goals:
To develop rigorous and transferrable mechanisms for linking megaproject
characteristics with megaproject performance
To apply these mechanisms to the MEGAPROJECT portfolio, to identify critical
characteristics that affect European megaproject performance.
Appendix A gives more information about the members of the INNOMET Working
Group and the activities that they undertook to achieve these goals and to arrive at
the findings contained in this report.
This report contains the following sections:
The Importance of Learning Across Megaprojects
Learning Across Megaprojects: Inductive Cross-Case Analysis
Learning Across Megaprojects: Non-Parametric Techniques
Learning Across Megaprojects: Machine Learning Techniques
Learning Across Megaprojects: What Really Matters in European
Megaprojects
This report is aimed at practitioners, researchers and policy makers who are
interested in improving megaproject performance. The INNOMET Working Group
have produced a variety of publications and outputs relating to their findings and
these are detailed in Appendix B.

5
The importance of learning across megaprojects
The successful transfer of learning across projects has been a long-held desire by
project professionals. The difficulties in achieving this activity are created by the
very nature of projects themselves: their separation from a „permanent‟ organization
and their uniqueness. Despite considerable efforts by organizations to develop
reliable systems to transfer learning across projects, it is rare to find an organization
that does not feel that it would derive significant benefits from being able to transfer
project learning more successfully. In the context of megaprojects, the ability to
learn across megaprojects becomes even more difficult. The size and complexity of
megaprojects make it very difficult to discern which actors and element of its myriad
configurations have actually influenced performance. The experience of
megaprojects is even more unique (if one can excuse the tautology) than that of
smaller projects making the number of comparable megaprojects extremely small.
The situation is further complicated by much of the learning that is transferred
between megaprojects being anecdotal in nature. Many „lessons learnt systems‟
rely solely on unreflective recollections of individuals. No rigorous attempt is made
to discover if characteristics ascribed to the project‟s performance were actually
associated with the ensuing project performance. Some academic studies have
now been formulated to explore more rigorously the foundations of megaproject
performance but these are few and far between and tend to rely on very historic
data.
The INNOMET Working Group was established to answer the need for rigorous
analytical tools to assist in identifying and transferring knowledge between
megaprojects. In doing so, it created ways of dealing with the vast complexity
exhibited by megaprojects.
6
Learning Across Megaprojects: Inductive Cross-case Analysis
One of the first techniques that was used by INNOMET to learn across
megaprojects (and thus identify characteristics that were associated with
megaproject performance) was „inductive cross-case analysis.‟ This is a technique
that takes similarly constructed cases of megaproject and uses a structured process
to review the cases to arrive at „cross-case‟ patterns. It is based on the seminal
work of the US academic, Kathleen Eisenhardt (1989). Eisenhardt derived a
process where theoretical generalizations could be generated from reviewing a
sample of cases of a particular phenomenon. In laymen‟s terms, this means that an
organization could use a standardized presentation of each of its megaproject
experiences to identify common systems or processes that are associated with a
particular outcome.
One of the strengths of the cross-case analysis employed by INNOMET was its
„inductive‟ rather than „deductive‟ nature. An explanation of these terms is usefully
provided by Gill and Johnson (Gill and Johnson 2002):
“Deduction: The deduction of particular instances from general inferences. It entails
the development of a conceptual and theoretical structure that is then tested by
observation.
Induction: The induction of general inferences from particular instances or the
development of a theory from the observation of empirical reality.”
In the context of the MEGAPROJECT COST Action, a deductive approach to theory
generation would mean generating a series of hypotheses or propositions about
megaproject characteristics and performance and then testing the validity of these
uses the multi-case experiences. An inductive approach to theory generation would
involve reviewing the empirical evidence of the megaproject cases to generate a
series of propositions or hypotheses formed from patterns of common experience.
Inductive approaches, such as that adopted by INNOMET, allow the important
relationships to „emerge‟ from the data and not to be influence by pre-conceptions
or biases.
INNOMET took as its starting point the MEGAPROJECT Portfolio‟s collection of
cases. (The approach to developing the standardized data template to capture
these megaproject cases is explained in „The MEGAPROJECT Portfolio‟ volume in
this series) The initial cross-case analysis was confined to Portfolio cases from the
Energy Sector and used all aspects of the template. The results of this exercise
were presented in Table 1 below:

7
Pattern Explanation
Formation of
SPE/JVs
based on the
megaproject
There is frequently a joint venture organisation ( often an equity joint venture) formed between organisations to be the client/owner for the megaproject. The degree to which this is a „real‟ organisation ( staffed with people and with project management responsibility) or a „ghost‟ organisation ( not staffed with the project activities still being undertaken by the owners varies.
Similar
Patterns of
Actors
Energy Megaprojects in Europe have a similar pattern of stakeholder actors and those actors are often act in the same capacity across a number of cases:
Owners (either directly or of temporary project organisation): Trans-
European Energy Companies with a substantive state ownership, e.g. E-ON, RWE, EDF, ENEL
Prime contractors: Turbo-machinery ( Siemens, Rolls-Royce,
Alstom); Nuclear Steam Systems (Arreva); EPC ( Aker, Fluor, AMEC, Saipem
Lack of scope
changes
Energy megaprojects don‟t seem subject to scope creep (e.g. target for MWe seems to remain the same throughout the project) This may be something to do with the clarity of purpose. Energy megaprojects are often simply about generating electricity and do not have the complexity of objectives such as cultural events of the Olympics or even iconic transport projects. And they might be connected to policy targets and as such have a binding MWe target. And of course the selection of most important technologies involves often proven and consolidated technology that sets the MWe target and cannot be altered easily.
Similar Scale Energy megaprojects in Europe seem to be of a similar scale. They take about 10 years from the first project idea to full operation. They involve a peak of 3000-5000 person months/years? in construction. They cost
€2bn-€7bn.
Table 1: Inductive Analysis of Energy Megaprojects
Having first focused on the Energy Sector Megaprojects, the investigation then
turned to the whole MEGAPROJECT portfolio to see if similar patterns emerged.
Given the results of the cross-case analysis of the energy ector, the process of
inductive pattern-spotting in the INNOMET investigation was confined to pattern
spotting across the „stakeholder‟ related aspects of the dataset in particular the
social network maps collated for each megaproject case1.
The investigation then juxtaposed the social network maps of each of the
megaprojects against each other to see if any common pattern of actors and
relationships could be identified.
Two patterns of interactions were identified that relate directly to those identified
through the analysis of the Energy sector megaproject cases. These were:
1 It was decided that this was an appropriate response given the issues of reliability in the secondary data that we
collected. A formal relationship between stakeholders as evidenced through publically documentation publication (e.g. contractual relationship, ownership relationship, regulatory relationships) is an easily and clearly discernible and therefore a highly reliable data element)

8
The widespread use of special purpose entities in the delivery of European megaprojects
Omni-present actors in European megaprojects
The Widespread Use of Special Purpose Entities
Pattern-spotting across the social network maps enabled the identification of
particular organizational actors who demonstrated high levels of centrality (i.e. they
had a large number of relationships with other organizations in the network). These
actors all had characteristics in common. They were all equity based special
purpose entities (SPEs) whose specific purpose was to design, deliver and
sometimes to operate large scale infrastructure megaprojects in the EU. See Figure
1 below:
Figure 1: SPEs in the A2 Polish Motorway Megaproject
Whilst SPEs have received attention in project management literature, their
behavior has not been considered beyond their ability to mitigate and share risks
The critical role that SPEs play in determining the whole governance of a
megaproject has not been considered. Interestingly, the lifespan of the identified
SPEs matched the design, construction and, frequently, the operation of their
associated megaprojects and could run, therefore, into decades. The investigations
labelled this phenomenon of a legally separate SPE organisation associated and
centred within a particular megaproject as an „enduring project.‟ Summary
characteristics of sample „enduring projects‟ encountered in the MEGAPROJECT
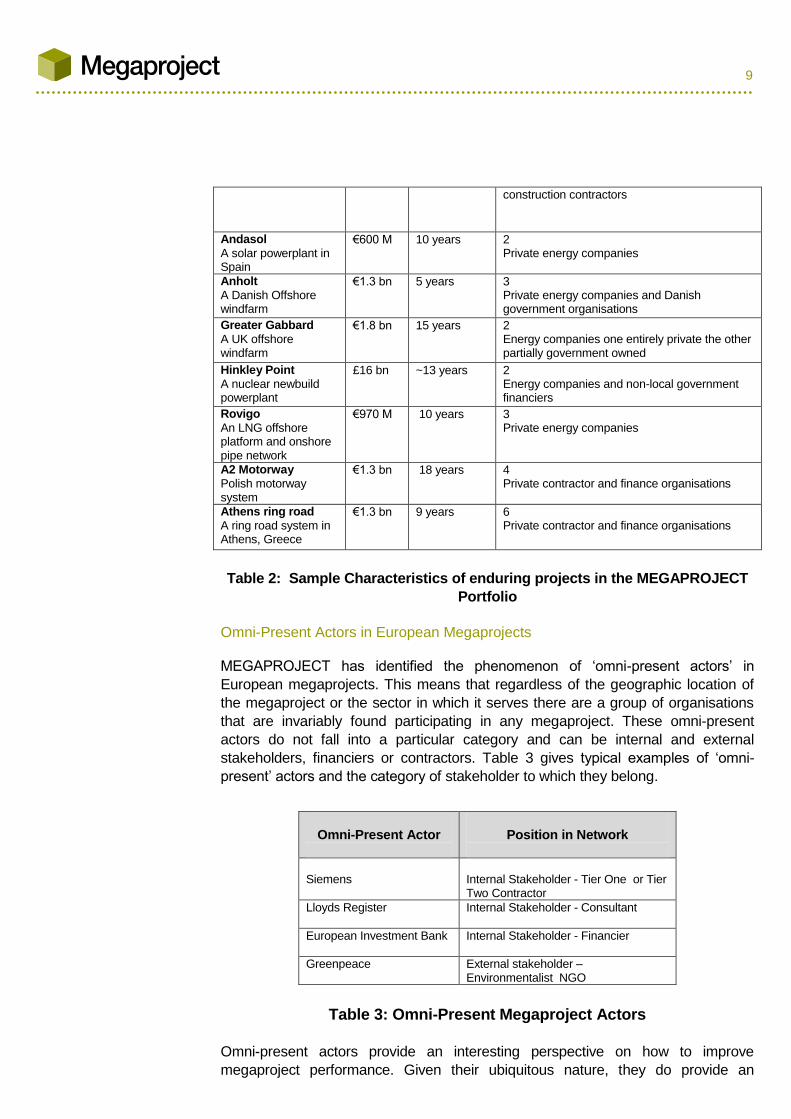
portfolio of cases are captured in the Table 2 below.
Project Title and
Description Project Value
Design & Construction
Lead-time
Number and nature of owners of enduring project
MOSE
A flood protection scheme for Venice
€2.3 bn ~45 years 7 A combination of regional government bodies, conservation organisations and private
9
construction contractors
Andasol
A solar powerplant in Spain
€600 M 10 years 2 Private energy companies
Anholt
A Danish Offshore windfarm
€1.3 bn 5 years 3 Private energy companies and Danish government organisations
Greater Gabbard
A UK offshore windfarm
€1.8 bn 15 years 2 Energy companies one entirely private the other partially government owned
Hinkley Point
A nuclear newbuild powerplant
£16 bn ~13 years
2 Energy companies and non-local government financiers
Rovigo
An LNG offshore platform and onshore pipe network
€970 M 10 years 3 Private energy companies
A2 Motorway
Polish motorway system
€1.3 bn 18 years 4 Private contractor and finance organisations
Athens ring road
A ring road system in Athens, Greece
€1.3 bn 9 years 6 Private contractor and finance organisations
Table 2: Sample Characteristics of enduring projects in the MEGAPROJECT
Portfolio
Omni-Present Actors in European Megaprojects
MEGAPROJECT has identified the phenomenon of „omni-present actors‟ in
European megaprojects. This means that regardless of the geographic location of
the megaproject or the sector in which it serves there are a group of organisations
that are invariably found participating in any megaproject. These omni-present
actors do not fall into a particular category and can be internal and external
stakeholders, financiers or contractors. Table 3 gives typical examples of „omni-
present‟ actors and the category of stakeholder to which they belong.
Table 3: Omni-Present Megaproject Actors Omni-present actors provide an interesting perspective on how to improve
megaproject performance. Given their ubiquitous nature, they do provide an
Omni-Present Actor
Position in Network
Siemens
Internal Stakeholder - Tier One or Tier Two Contractor
Lloyds Register
Internal Stakeholder - Consultant
European Investment Bank
Internal Stakeholder - Financier
Greenpeace
External stakeholder – Environmentalist NGO

10
interesting conduit into influencing megaproject practice in Europe especially in
terms of „learning across‟ megaprojects and transferring best practice across sector
boundaries. They should be of particular interest to pan-European pan-sectoral
initiatives such as the „Connecting Europe Facility‟ and development activities of
the European Commission‟s Directorate for regional development.

11
Learning Across Megaprojects: Non-Parametric Techniques
Challenges in Identifying Statistically Significant Relationships in Megaprojects
Whilst cross-case analysis provided a structured approach to learning across
projects, it did not provide results that could „prove‟ a relationship with a certain level
of confidence. INNOMET therefore sought further approaches that related
characteristics of megaprojects to their performance in a way that demonstrated a
statistically significant correlation.
There are real challenges in identifying statistically significant relationships in
megaproject performance. They relate to:
- sample size
- the nature of the data
Sample size: In order to undertake most statistical tests sample sizes need to be in
the region of hundreds if not thousands. Only when the sample size reaches these
dimensions can statistically significant relationships be confidently identified. This is
problematic for megaprojects as there are simply not that many of them. Global
estimates on the number of megaprojects are difficult to estimate (and many argue
that they are rising) but they do not have the size to make statistical analysis
straight forward. For example, at the start of its activities the MEGAPROJECT
Portfolio (which INNOMET aimed to use for its data source) only had 26 cases. This
meant that any technique needed to be able to work with small samples.
The nature of megaproject data: Megaprojects are extremely large and complex
phenomenon. The pursuit of statistical significance means that their complexity has
to be „stripped away.‟ Statistical relationships can only be demonstrated between
variables and so some (much reduced) representation needs to be made of a
project in terms of key characteristics. This is true for both independent „descriptive‟
variables that relate to the nature of the megaproject and of dependent
„performance‟ variables that relate to the megaproject‟s success or failure. This
reductionism is dangerous as it moves way from enabling investigators to identify
complex holistic phenomena but it is necessary if statistical significance is to be
sought.
In converting the real-life complexity of megaprojects to a dataset amenable to
statistical analysis, it is necessary to identify some way of measuring variables.
Frequently the conversion process adopted by researchers resorts to the use of
„likert‟ type scales which use integer scales to rank qualitative variables. INNOMET

12
rejected the use of these approaches because it felt it could not insure an adequate
reliability across the team of investigators, let alone a wider practitioner audience, in
using this. (Ranking the complexity of a megaproject on a scale of 1-7 , for example,
seemed a futile exercise). To the end, INNOMET determined independent and
dependent variables that were „binary‟ in nature. This meant that independent
variable „measurement‟ could be enacted by identifying whether or not a
characteristic was present in the megaproject: an activity for which it was more likely
to insure reliability in using across the investigator population.
The sample size and the nature of the data led the INNOMET Working Group to the
use of the Fisher Exact Test as an appropriate mechanism to establish statistically
significant relationships between megaproject characteristics and megaproject
performance.
The Fisher Exact Test
There are a bewildering variety of statistical techniques that can be employed to
spot relationships between independent and dependent variables. INNOMET
reviewed these and identified the Fisher Exact Test as being the most suitable for
analyzing the MEGAPROJECT dataset. The Fisher Exact Test‟s purpose is to
ascertain whether or not an independent variable is associate with the presence (or
absence) of a dependent variable. The key features of the Fisher Exact Test are as
follows:
It makes no assumption about distributions. The Fisher Exact Test is a non-
parametrical statistical significance test. Parametric tests assume that the data have
come from a particular type of probability distribution (e.g. a normal distribution) and
makes inferences about the parameters of the distribution (in case of normal
distribution mean and variance). Making these assumptions about the shape of a
distribution can make its use unreliable. With a non parametrical test (like the Fisher
Exact Test), it is not necessary to make “a priori” assumptions on the data
distribution and therefore this type of test can have a wide application.
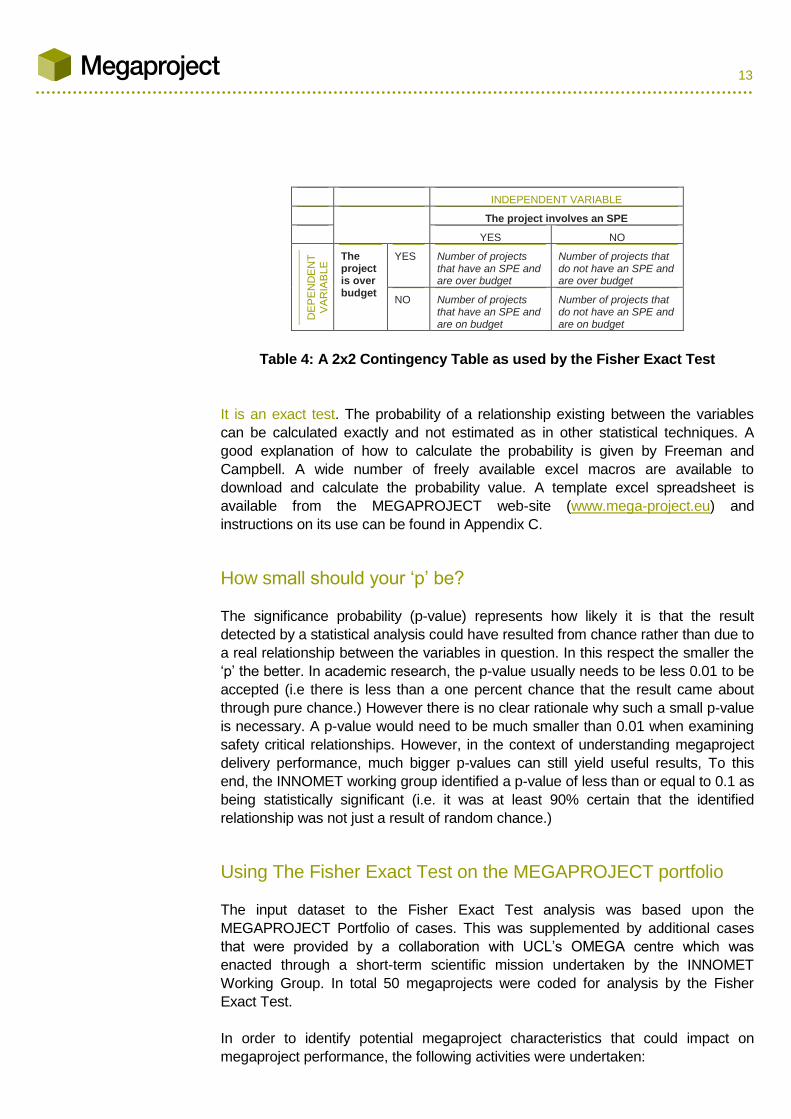
It uses categorical data in the form of a contingency table. The test is used for
categorical binary data. (In statistics, a categorical variable is a variable that can
take on one of a limited, and usually fixed, number of possible values: in the case of
binary categorical data there are only two possible values.) The Fisher Exact Test is
used to examine the significance of the correlation between the two binary
categorical variables. The Fisher test requires a 2 x 2 contingency table for its input
data. A contingency table looks like in that shown in Table 4.
13
INDEPENDENT VARIABLE
The project involves an SPE
YES NO
DE
PE
ND
EN
T
VA
RIA
BLE
The project is over budget
YES Number of projects that have an SPE and are over budget
Number of projects that do not have an SPE and are over budget
NO Number of projects that have an SPE and are on budget
Number of projects that do not have an SPE and are on budget
Table 4: A 2x2 Contingency Table as used by the Fisher Exact Test
It is an exact test. The probability of a relationship existing between the variables
can be calculated exactly and not estimated as in other statistical techniques. A
good explanation of how to calculate the probability is given by Freeman and
Campbell. A wide number of freely available excel macros are available to
download and calculate the probability value. A template excel spreadsheet is
available from the MEGAPROJECT web-site (www.mega-project.eu) and
instructions on its use can be found in Appendix C.
How small should your „p‟ be?
The significance probability (p-value) represents how likely it is that the result
detected by a statistical analysis could have resulted from chance rather than due to
a real relationship between the variables in question. In this respect the smaller the
„p‟ the better. In academic research, the p-value usually needs to be less 0.01 to be
accepted (i.e there is less than a one percent chance that the result came about
through pure chance.) However there is no clear rationale why such a small p-value
is necessary. A p-value would need to be much smaller than 0.01 when examining
safety critical relationships. However, in the context of understanding megaproject
delivery performance, much bigger p-values can still yield useful results, To this
end, the INNOMET working group identified a p-value of less than or equal to 0.1 as
being statistically significant (i.e. it was at least 90% certain that the identified
relationship was not just a result of random chance.)
Using The Fisher Exact Test on the MEGAPROJECT portfolio
The input dataset to the Fisher Exact Test analysis was based upon the
MEGAPROJECT Portfolio of cases. This was supplemented by additional cases
that were provided by a collaboration with UCL‟s OMEGA centre which was
enacted through a short-term scientific mission undertaken by the INNOMET
Working Group. In total 50 megaprojects were coded for analysis by the Fisher
Exact Test.
In order to identify potential megaproject characteristics that could impact on
megaproject performance, the following activities were undertaken:

14
- a review of megaproject performance literature
- a „brainstorming‟ exercise with MEGAPROJECT Associates
The resulting list of potential variables was then supplemented with the findings of
the inductive cross-case analysis described earlier in this report. In total a list of
over 70 megaproject characteristics which would form the independent variables for
the Fisher analysis. Having identified the characteristics, each was operationalized
through a „binary‟ definition. Table 5 gives some sample operationalizations. This
enabled the particular independent characteristic for a particular megaproject case
to be allocated a value of „1‟ or „0.‟
Characteristic
Operationalization
The megaproject has a foreign EPC company
The EPC is not registered for tax and/or is legally incorporated in the county hosting the project
The EPC has a clear goal
There is at the least one publically issued statement from the EPC explaining how the project fits with the strategy of the EPC
The megaproject is mono -cultural
Country of registration of client, owner and EPC are the same
The megaproject is owned by its government
The national government of the country in which the project is situated owns directly or indirectly more than 50% of of the client organisation
Table 5: Megaproject Characteristic Operationalizations
The „dependent‟ megaproject performance variables were based on two aspects of
the „iron triangle‟ associated with project performance namely on-time and to-budget
delivery. Given that the iron triangle itself has been subject to a great deal of
criticism for its efficacy in characterizing megaproject succinct, it may be considered
as dangerously simplistic and contentious to characterize success in terms of two
element of a discredited framework. Furthermore, by chosing to measure „on-time‟
and „to budget‟ aspects of performance, the investigation was actually measuring
the ability to forecast these attributes rather than any absolute measure of
performance.2 However, given the difficulty of obtaining performance data and the
relevance that adherence to forecast has been given by other megaproject
researchers ( c.f. Merrow and Flyvbjerg), measuring megaproject performance
through it ability to deliver on-time and to budget was deemed and appropriate way
forward. To this end binary operationalizations were created for each of the
dependent performance variables and these are given in Table 6 below:
2 The data within the portfolio does allow the generation of absolute „benchmarking‟ data,
15
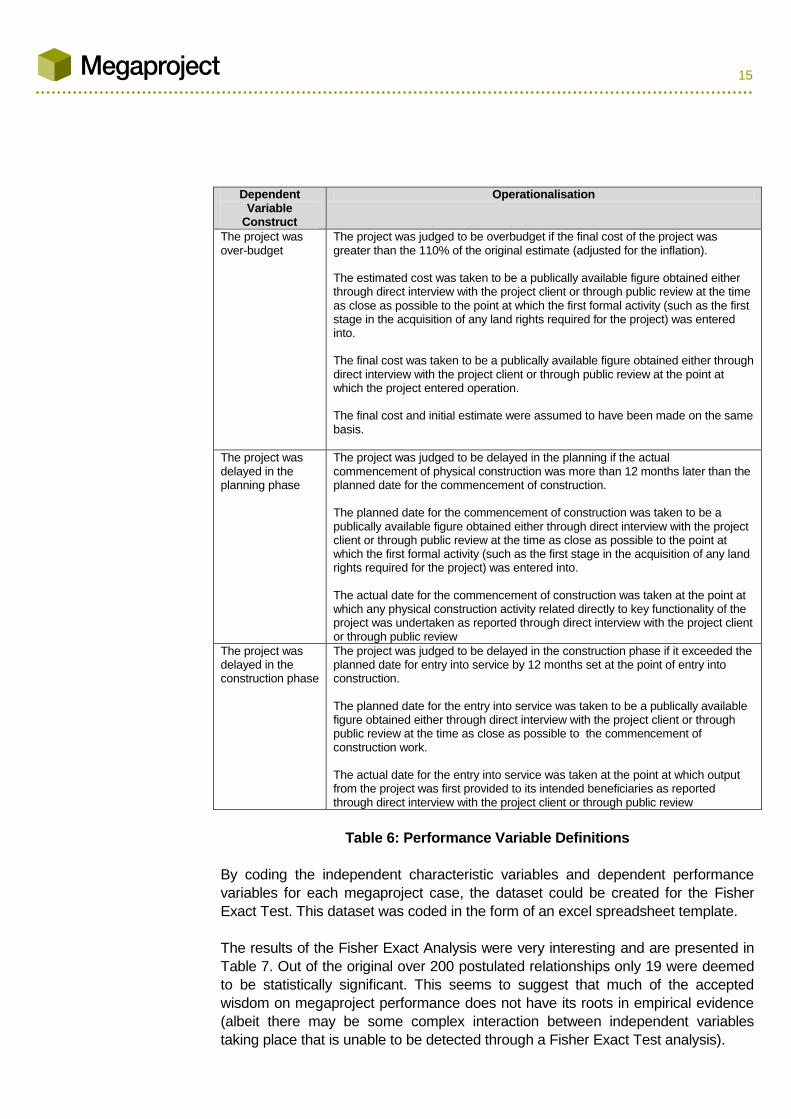
Dependent Variable
Construct
Operationalisation
The project was over-budget
The project was judged to be overbudget if the final cost of the project was greater than the 110% of the original estimate (adjusted for the inflation). The estimated cost was taken to be a publically available figure obtained either through direct interview with the project client or through public review at the time as close as possible to the point at which the first formal activity (such as the first stage in the acquisition of any land rights required for the project) was entered into. The final cost was taken to be a publically available figure obtained either through direct interview with the project client or through public review at the point at which the project entered operation. The final cost and initial estimate were assumed to have been made on the same basis.
The project was delayed in the planning phase
The project was judged to be delayed in the planning if the actual commencement of physical construction was more than 12 months later than the planned date for the commencement of construction. The planned date for the commencement of construction was taken to be a publically available figure obtained either through direct interview with the project client or through public review at the time as close as possible to the point at which the first formal activity (such as the first stage in the acquisition of any land rights required for the project) was entered into. The actual date for the commencement of construction was taken at the point at which any physical construction activity related directly to key functionality of the project was undertaken as reported through direct interview with the project client or through public review
The project was delayed in the construction phase
The project was judged to be delayed in the construction phase if it exceeded the planned date for entry into service by 12 months set at the point of entry into construction. The planned date for the entry into service was taken to be a publically available figure obtained either through direct interview with the project client or through public review at the time as close as possible to the commencement of construction work. The actual date for the entry into service was taken at the point at which output from the project was first provided to its intended beneficiaries as reported through direct interview with the project client or through public review
Table 6: Performance Variable Definitions
By coding the independent characteristic variables and dependent performance
variables for each megaproject case, the dataset could be created for the Fisher
Exact Test. This dataset was coded in the form of an excel spreadsheet template.
The results of the Fisher Exact Analysis were very interesting and are presented in
Table 7. Out of the original over 200 postulated relationships only 19 were deemed
to be statistically significant. This seems to suggest that much of the accepted
wisdom on megaproject performance does not have its roots in empirical evidence
(albeit there may be some complex interaction between independent variables
taking place that is unable to be detected through a Fisher Exact Test analysis).

16
Ability to deliver
on budget
Ability to deliver to construction
schedule
Ability to deliver to planning schedule
FIS
HE
R
YY
-NN
CO
UN
TS
FIS
HE
R
YY
-NN
CO
UN
TS
FIS
HE
R
YY
-NN
CO
UN
TS
client and epc have the same nationality (n/a if they are the same)
8% 34% 32
2.2
Sta
keh
old
ers
-
Exte
rnal
Pre-existing environmental group(s) have objected to the project
3% 68% 40
There was public acceptability to the project at national level (no protest)
2% 36% 39
Environmental activists have been engaged ex-ante, not ex post
1% 31% 29
5.1
Pro
ject
En
vir
on
men
t -
Leg
al
The project has a strong regulation system as evidenced by:
B) An authority fined the an actor in the project
5% 65% 26 6% 63% 27
C) actions from the authority postponed the project
3% 67% 39
The project has the support of the local government
10% 51% 41
No
t cla
ssif
ied
Offshore project
7% 32% 41
The compensation to the local community >0,1% of total budget
3% 65% 23
The project is renewable
5% 9% 11
The project contains an SPE 2% 33% 39 5% 36% 39 10% 63% 38
Within the project scope, were there the following objects:
A) one or more bridges
1% 19% 16
C) other underground structures 7% 67% 21
E) high-way
7% 23% 13
Table 7: Statistically Significant Relationships Between Megaproject
Characteristics and Megaproject Performance Identified
by the Fisher Exact Test
KEY:
favourable unfavourable

17
Learning Across Megaprojects: Machine Learning Techniques
What is machine learning?
Machine learning is a scientific discipline that explores algorithms that can
learn from data (Kovahi & Provost, 1998). Machine learning (also data mining)
techniques are techniques for finding and describing structural patterns in data, as
tools for helping to explain the data and make predictions from it (Witten, et al.,
2011). The data takes the form of a set of examples and the output takes the form
of predictions about new examples. The output may also include an actual
description of a structure that can be used to classify unknown examples.
Descriptions can become fairly complex and are typically expressed as sets of
rules. Experience shows that machine learning is frequently used not only for
prediction, but to gain knowledge as well.
Machine learning techniques are applicable for projects' performance prediction.
Salient literature review showed that certain machine learning techniques can be
used to predict projects' performance based on the past experience. However, they
have not yet been used in the area of megaprojects.
Beyond the Fisher Test: Advantages of Machine Learning
Why machine learning. It is said that one should not look for the dividing line
between machine learning and statistics because they belong to the continuum of
data analysis techniques (Witten, et al., 2011). In the case of megaproject dataset
analysis, INNOMET WG needed to look for techniques which would enable rigorous
„pattern spotting‟ analysis of the existing, relatively small dataset, that did not allow
the application of multivariate statistical analysis. As a step after the application of
Fisher test, which could not answer to the question of more complex patterns of
dependence, application of some of machine learning techniques was proposed,
although the machine learning techniques usually also require larger datasets.
In the experiment of applying machine learning techniques to megaproject
database, the goals were to:
Propose a procedure of applying machine learning techniques to datasets
such as this one (small dataset, binary attributes);
Examine possibility of megaproject success prediction;
Identify which subsets of attributes are the most informative for prediction
and can be considered as megaproject critical success factors.

18
Applying machine learning approaches to the MEGAPROJECT dataset
The process of collecting and preparation of data for the analysis was explained in
the previous section. A data set, consisting of 50 megaprojects described with 46
project characteristics (binary input attributes) and 3 success indicators (binary
class attributes) was derived to be used in this experiment.
A classification learning scheme has been followed, where a set of classified
examples is given, from which it is expected to learn a way of classifying unseen
examples. The relationship between several attribute space reduction techniques
and the resulting prediction performance (trough classification) has been
investigated.
Analysis was performed in three iterative steps:
1. Selection of the subsets of the most informative attributes:Correlation
Based Feature Subset Selection (CFS) and feature selection based on
Information Gain (IG) were applied to find the most informative subsets
of megaproject input attributes for predicting each of the three class
attributes. CFS is an algorithm for feature selection for machine
learning through a correlation based approach (Hall, 1999). Based on
the hypothesis that good feature sets contain features that are highly
correlated with the class, yet uncorrelated with each other, the
algorithm couples evaluation formula with an appropriate correlation
measure and a heuristic search strategy. Feature selection using IG
considers the ranking of attributes based on the Information Gain.
Information Gain is the expected reduction in entropy caused by
partitioning the examples according to a given attribute. The entropy
(very common in Information Theory) characterizes the (im)purity of an
arbitrary collection of examples
2. Training predictive models: Six different predictive (classification)
models (Decision tree (DT), Naive Bayes (NB), Artificial Neural
Network (ANN), Support Vector Machine (SVM), K Nearest Neighbour
(KNN) and Logistic Regression (LR) were trained on the available input
data. DT is a non-parametric, supervised learning method used
for classification and regression. The goal is to create a model that
predicts the value of a target variable by learning simple decision rules
inferred from the data features (Mitchel, 1997) The NB classifier uses
the Bayes theorem for solving classification problems. The classifier is
easy to implement and although good results can be obtained in most
of the cases, the classifier is dependent on class conditions (Yun &
Caldas, 2009) ANN stands for a family of learning algorithms inspired
by biological neural networks and used to estimate
or approximate functions that can depend on a large number
of inputs and are generally unknown. ANNs are presented as systems
of interconnected “neurons” which can compute values from inputs,
and are capable of learning, as well as pattern recognition thanks to

19
their adaptive nature (Mitchel, 1997). Here, the ANN-based prediction
model is built by the feed-forward network using a back-propagation
algorithm that uses a gradient decent approach for adjusting the ANN
weights.
KNN classifier is among the simplest of all machine-learning
algorithms. It uses a normalized Euclidean distance to find the training
instance closest to the given test instance, and it predicts the same
class as this training instance. The neighbours are taken from a set of
objects for which the correct classification (or, in the case of
regression, the value of the property) is known. This can be thought of
as the training set for the algorithm, though no explicit training step is
required. The K-nearest neighbour algorithm is sensitive to the local
structure of the data (Yun & Caldas, 2009).
SVM model for classification (as well as for regression) is a relatively
novel and powerful learning method based on statistical learning
theory, which is a small sample statistical theory introduced by Vapnik
(Vapnik, 1995). Since the generalization ability of the SVR model does
not depend on the dimensionality of input space, it is known to possess
high generalization ability with small datasets compared to the ANN
model (Son, et al., 2012).
LR is a type of probabilistic statistical classification model, used to
predict categorical dependent variable based on one or more predictor
variables (features). It measures the relationship between the
categorical dependent variable and one or more independent
variables, which are usually (but not necessarily) continuous, by using
probability scores as the predicted values of the dependent variable.
(Hair, et al., 2009).
3. Evaluation of predictive models‟ performance
Models were evaluated on a separate test data using evaluation
procedure originally designed for this problem and compared using
prediction performance measures: precision, recall (for each class and
overall), accuracy rate and F-measure.
The most significant results of the conducted analysis are:
1. The identification of a feasible method to build a model for prediction of
megaproject performance.(The method is universal and can be applied in
other construction and project management sectors. It is especially
convenient for small data set analysis.)

20
2. The identification of the best parameters for each examined prediction
model.
3. The comparison of models‟ prediction possibilities with best model
identification.
It was discovered that models where CFS was applied as a feature
selection method gave better results. Therefore, it was possible to identify
small subsets of attributes (containing 5-7 attributes, depending on the
problem, see Table 8) that were most informative for prediction of
megaproject success within existing dataset.
Machine learning methods that, combined with CFS, gave best results
were:
For prediction of Overbudget – Naïve Bayes and Logistic
Regression;
For prediction of Delay in Construction – Naïve Bayes;
For prediction of Delay in Planning Phase – Decision Tree.
4. Identification of the subsets of attributes (megaproject characteristics) most
informative for prediction, for each class attribute (megaproject success
indicator). For some models, it was possible to identify type and level of
dependence of dependent variable (class attributes) on the independent
variables (input attributes).
In Table 8, the attributes identified as the most informative (in the group) for
prediction of Overbudget, Delay in Construction and Delay in Planning Phase
of Megaprojects within existing dataset are presented.
Table 8; The Most Informative Characteristics of Megaprojects as
Identified by Machine Learning Analysis
Categories of
attributes
The most informative subsets of attributes for prediction of
ability to affect (both positively and negatively):
BUDGET CONST.
SCHED.
PLAN.
SCHED.
There was public acceptability to the project at national level
X
Environmental activists have been engaged ex-ante, not ex post
X
Project
Environment –
Legal
The project has a strong regulation system as evidenced by:
b) The authority give fine to an actor in the project
X
c) Actions from the Authority postponed the the project
X
Project
Environment -
There is planned a long term stability in usage and value of the megaproject
X X

21
Socio –
Economic
Financial Support from the national government received by project
X
Technological
aspects
The megaproject is composed of more than 1 identical independent unit
X
The project is modular with dependent modules
X
FOAK wide definition: FOAK at least in the country
X
The project is nuclear X X
Offshore project X X Project physically connects two countries
X
SPE (Special Purpose Entity) established
X X

22
Learning from Learning: What Really Matters to European Megaprojects?
The INNOMET Working Group succeeded in delivering its objectives:
It developed rigorous and transferrable mechanisms for linking megaproject
characteristics with megaproject performance
It applied these mechanisms to the MEGAPROJECT portfolio, to identify critical
characteristics that affect European megaproject performance.
Developing Rigorous and Transferrable Mechanism
INNOMET developed three approaches to analyse megaprojects in order to identify
key learning points that should be transferred across megaprojects.
Inductive cross-case analysis
Analysis using the Fisher Exact Test
Analysis using machine learning techniques
The first two of these techniques have been developed as stand-alone approaches
and more information on their use can be obtained from the MEGAPROJECT
COST Action ([email protected]).
Critical Characteristics in European Megaprojects
Table 9 shows how the Fisher Exact Analysis and the Machine Learning Analysis
were triangulated together to identify the most impactive characteristics on
megaproject performance in Europe.
Megaproject Characteristic Fisher Exact
Test Analysis
Machine
Learning
Analysis
BU
DG
ET
PL
AN
. SC
HE
D.
CO
ST
R. S
HC
ED
.
BU
DG
ET
PL
AN
. SC
HE
D.
CO
ST
R. S
HC
ED
.
SHARED CHARACTERISTICS:
An SPE is present in the megaproject X X X X X
Public acceptability for the megaproject at national level X X

23
Environmentalists engaged ex-ante X X
A regulator fined an actor in the megaproject X X X
A regulator delayed an activity in the megaproject X X
UN-SHARED CHARACTERISTICS:
Client and EPC have the same nationality X
Pre-existing environmental group objected X
The megaproject was supported by local government X
Local compensation is >0,1% of the total budget X
The megaproject is a renewable energy project X
The megaproject encompasses bridges X
The megaproject encompasses other underground structures X
The megaproject encompasses highways X
There is planned a long term stability in usage and value of the megaproject
X X
Financial Support from the national government was received by the megaproject
X
The megaproject is composed of more than 1 identical independent unit
X
The project is modular with dependent modules X
First-of-a-kind megaproject: wide definition X
The megaproject is nuclear X X
Project physically connects two countries X
Table 9: Triangulating Significant Megaproject Characteristics as Identified by
Fisher Exact and Machine Learning Analysis.
These results indicate that, if the successful delivery of European megaprojects is to
be secured, projects need to:
Engage better with external stakeholders of the megaproject especially
environmental groups, the affected population and regulators
Understand how to make best use of SPE in the governance of
megaprojects.

24
References:
Eisenhardt, Kathleen M. "Building theories from case study research." Academy of management review 14.4 (1989): 532-550.
Freeman, Jenny V., and Michael J. Campbell. "The Analysis Of Categorical Data:
Fisher‟s Exact Test." http://www.sheffield.ac.uk/polopoly_fs/1.43998!/file/tutorial-9-
fishers.pdf
Gill, J., & Johnson, P. (2010). Research methods for managers. Sage. Hair, J. F. J., Black, W. C., Babin, B. J. i Anderson, R. E., 2009. Multivariate Data Analysis. 7th ed. s.l.:Prentince Hall.
Hall, M. A., 1999. Correlation-based Feature Selection forMachine Learning, PhD thesis. Hamilton, New Zealand: Department of Computer Science, University of Waikato.
Kovahi, R. & Provost, F., 1998. Glossary of terms. Machine Learning, Volume 30,
pp. 271-274.
Mitchel, T. M., 1997. Machine Learning. New York: McGraw-Hill .
Son, H., Kim, C. & Kim, C., 2012. Hybrid principal component analysis and support vector machine model for predicting the cost performance of commercial building projects using pre-project planning variables. Automation in Construction, 27, pp.60–66.
Vapnik, V.N., 1995. The nature of statistical learning theory. New York: Springer-
Verlag
Witten, I. H., Frank, E. i Hall, M. A., 2011. Data mining: practical machine learning tools and techniques. 3rd ed. Burlington, USA: Morgan Kaufmann publishers.
Yun, S. & Caldas, C.H., 2009. Analysing decision variables that influence
preliminary feasibility studies using data mining techniques. Construction
Management and Economics, 27(1), pp.73–87.

25
Appendix A: INNOMET members and working Group Meetings
INNOMET Group Members
Giorgio Locatelli
Miljan Mikic Jan Christoph Albrecht Milos Kovacevic Prince Boateng Zhen Chen.
INNOMET Group Guests
Naomi Brookes
Tristano Sainati
Working Group Meetings
Meeting Type Date Location
Planning Meeting 17-10-13 Lincoln, UK
Working Group 3-3-14 Edinburgh, UK
Combined Working Group 7-7-14 Liverpool, UK
Mini Working Group 2-2-14 Belgrade, Serbia

26
Appendix B: Publications produced by the INNOMET Working Group
Published
BROOKES N.J. SAGE D, DAINTY A, LOCATELLI G. Temporal not temporary:
Using megaproject empirics to explore enduring projects In Proceedings of the
30th EGOS Colloquium „Reimagining, Rethinking, Reshaping: Organizational
Scholarship in Unsettled Times‟ July 3–5, 2014 Rotterdam School of Management,
Erasmus University, The Netherlands 2014
BROOKES N.J. HICKEY R. LITTAU P. LOCATELLI G. OLIOGMOBE G. “Using Multi-Case Approaches In Project Management Research: Learning from the MEGAPROJECT Experience” in „Designs, Methods and Practices for the Research of Project Management‟ Edited by Beverley Pasian, Published Gower April 2015 ISBN: 978-1-4094-4880-8 LOCATELLI, G., LITTAU, P., BROOKES, N. J., & MANCINI, M. (2014). Project characteristics enabling the success of megaprojects: an empirical investigation in the energy sector. Procedia-Social and Behavioral Sciences, 119, ISBN 625-634.
Submitted
BROOKES, NJ, DAINTY AJR, SAGE D.J, LOCATELLI G. (2015) Enduring
Projects and Temporal Flipping, International Journal of Project Management
Ms. Ref. No.: JPMA-D-14-00703
Planned MIKIĆ, M., KOVACEVIC, M, LOCATELLI, G., BROOKES, N. Getting The Most From Small Samples With Many Variables. The Case Of Developing A Model To Predict The Performance Of A Megaproject, Automation in Construction LOCATELLI, G., MIKIĆ, M., BROOKES, N., KOVACEVIC, M. Infrastructural Megaprojects: What Really Matters For Their Succesfull Delivery, IEEE Transactions on Engineering Management