learning algorithm evaluation. algorithm evaluation: outline why? overfitting how? train/test vs...
TRANSCRIPT

Learning Algorithm Evaluation
Algorithm evaluation: Outline
Why? Overfitting
How? Train/Test vs Cross-validation
What? Evaluation measures
Who wins? Statistical significance
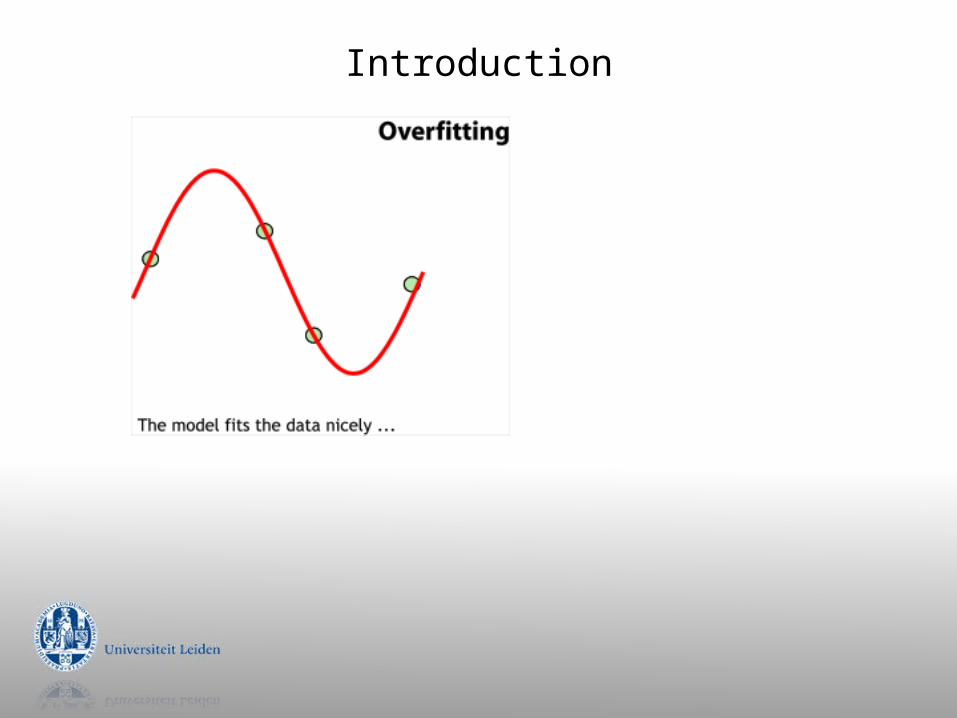
Introduction
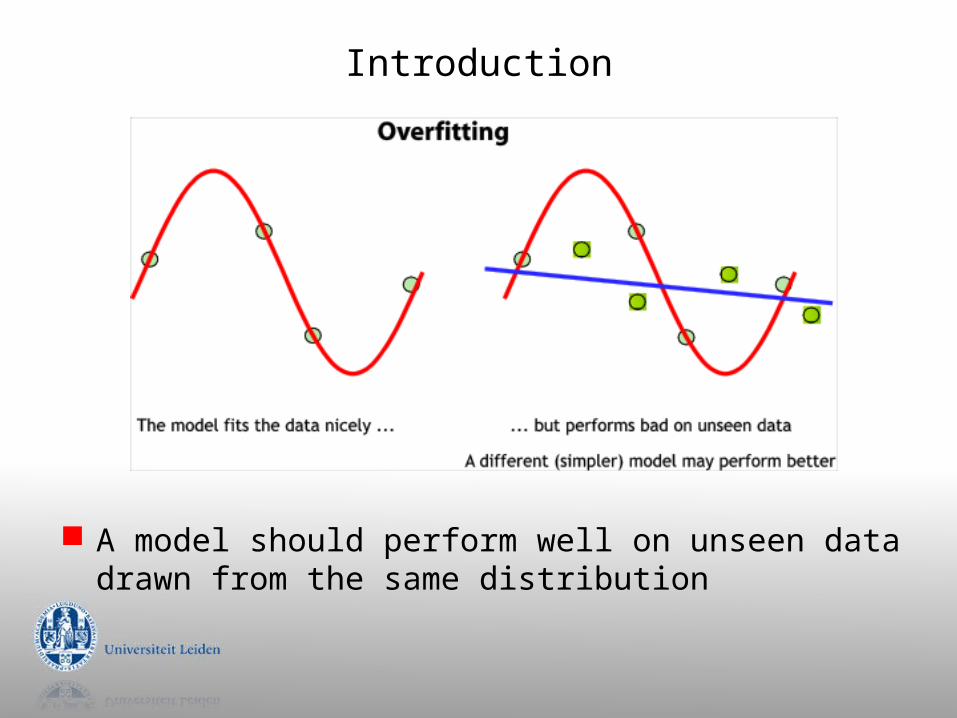
Introduction
A model should perform well on unseen data drawn from the same distribution
Classification accuracy
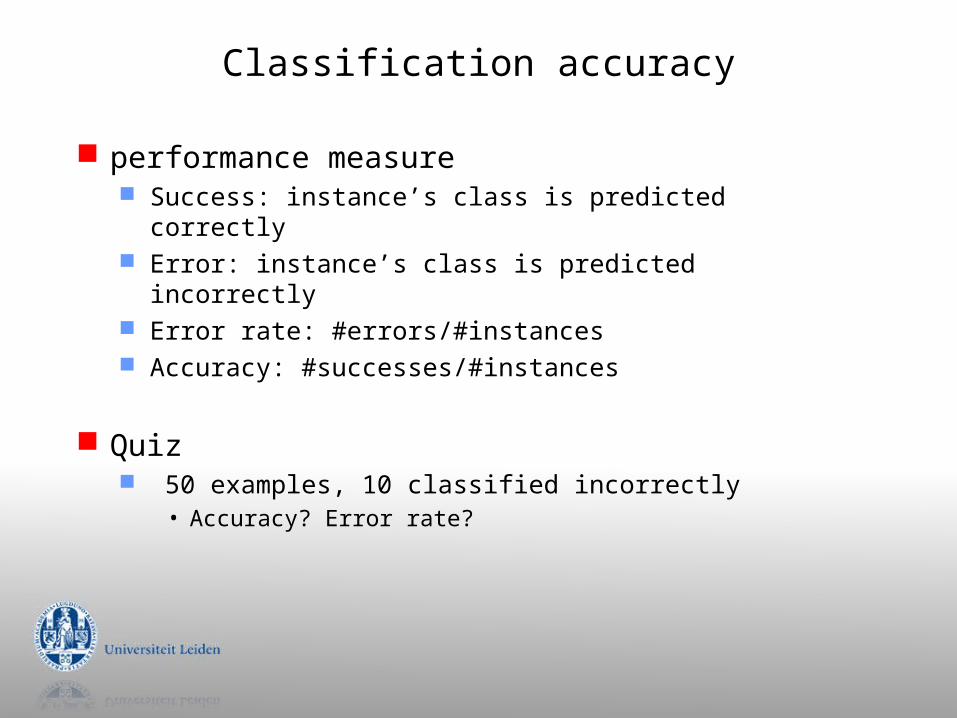
performance measure Success: instance’s class is predicted correctly Error: instance’s class is predicted incorrectly Error rate: #errors/#instances Accuracy: #successes/#instances
Quiz 50 examples, 10 classified incorrectly
• Accuracy? Error rate?

Evaluation
Rule #1
Never evaluate on training data!
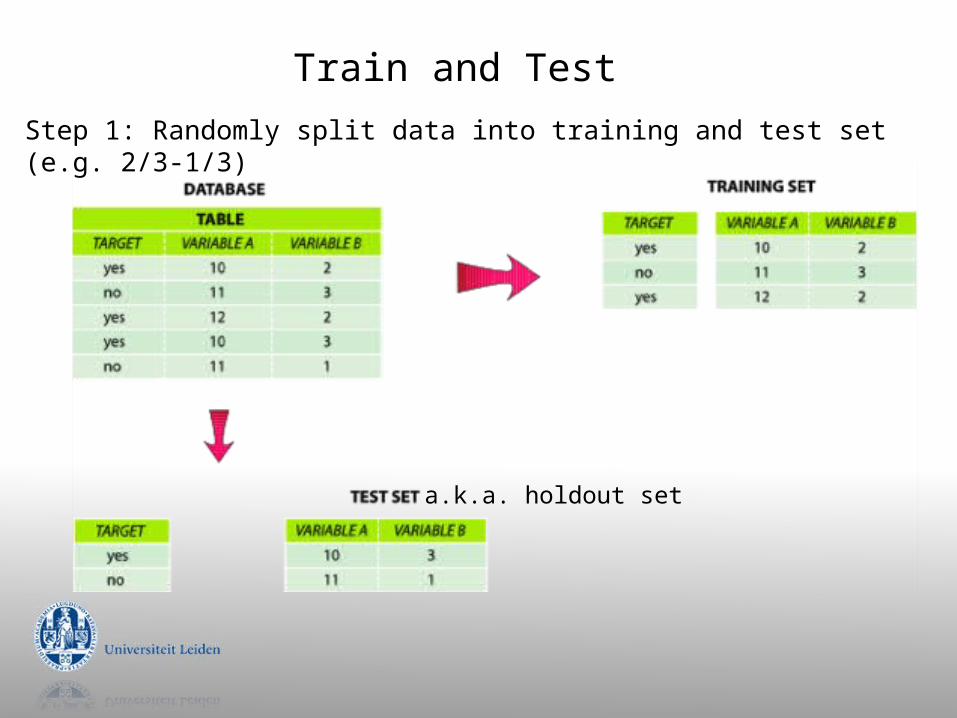
Train and Test
Step 1: Randomly split data into training and test set (e.g. 2/3-1/3)
a.k.a. holdout set

Train and Test
Step 2: Train model on training data

Train and Test
Step 3: Evaluate model on test data

Train and Test
Quiz: Can I retry with other parameter settings?Quiz: Can I retry with other parameter settings?
Evaluation
Rule #1
Never train on test data!(that includes parameter setting or feature selection)
Never evaluate on training data!
Rule #2

Train and TestStep 4: Optimize parameters on separate validation set
validation
testing
Test data leakage
Never use test data to create the classifier Can be tricky: e.g. social network
Proper procedure uses three sets training set: train models validation set: optimize algorithm parameters test set: evaluate final model

Making the most of the data
Once evaluation is complete, all the data can be used to build the final classifier
Trade-off: performance evaluation accuracy More training data, better model (but returns diminish) More test data, more accurate error estimate
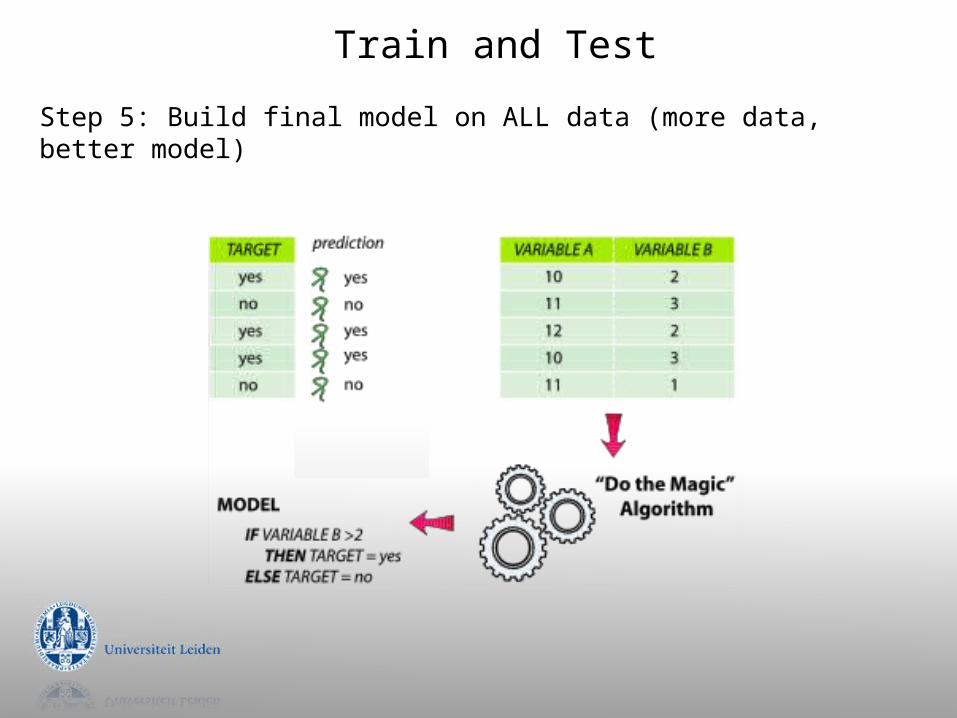
Step 5: Build final model on ALL data (more data, better model)
Train and Test
Cross-Validation
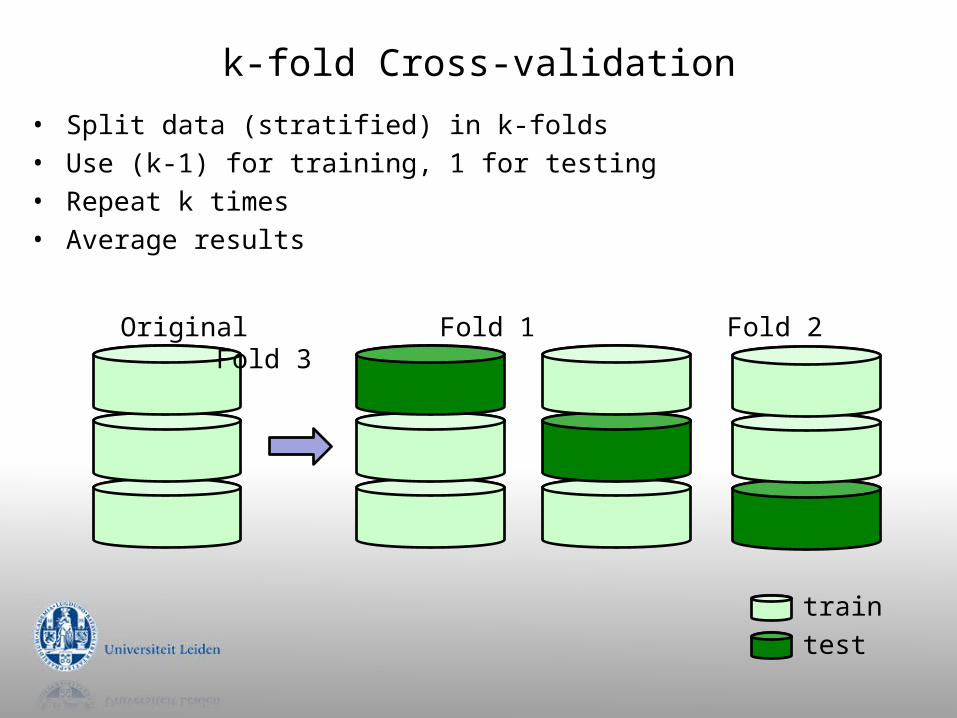
k-fold Cross-validation
• Split data (stratified) in k-folds• Use (k-1) for training, 1 for testing • Repeat k times• Average results
traintest
Original Fold 1 Fold 2 Fold 3
Cross-validation
Standard method: Stratified ten-fold cross-validation
10? Enough to reduce sampling bias Experimentally determined
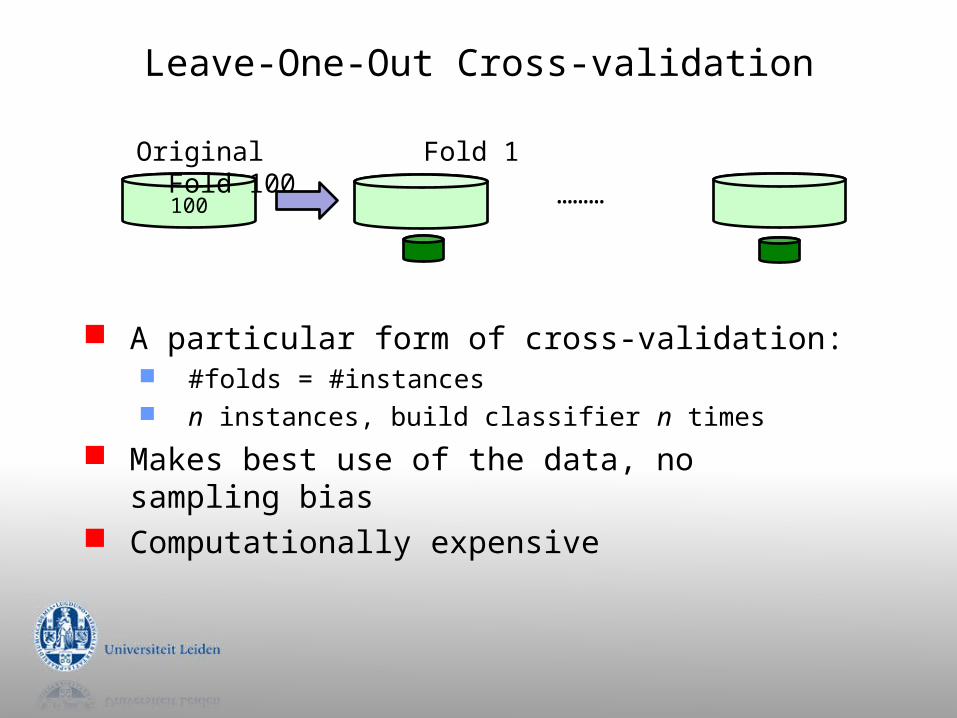
Leave-One-Out Cross-validation
A particular form of cross-validation: #folds = #instances n instances, build classifier n times
Makes best use of the data, no sampling bias Computationally expensive
100
Original Fold 1 Fold 100
………
ROC Analysis

ROC Analysis
Stands for “Receiver Operating Characteristic” From signal processing: tradeoff between hit rate
and false alarm rate over noisy channel Compute FPR, TPR and plot them in ROC space Every classifier is a point in ROC space For probabilistic algorithms
Collect many points by varying prediction threshold Or, make cost sensitive and vary costs (see below)
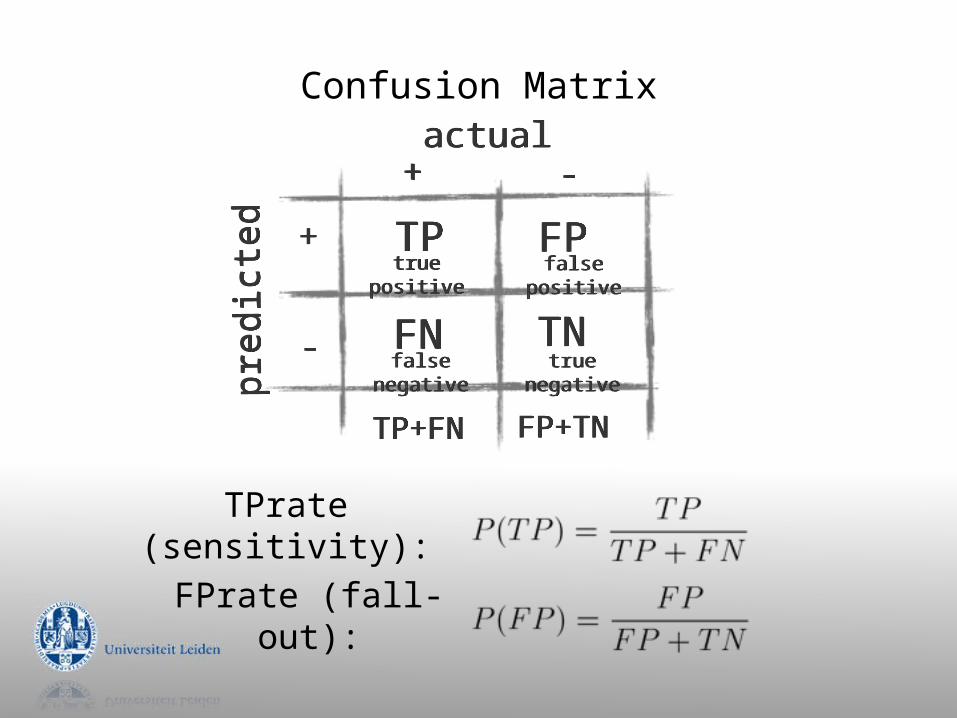
Confusion Matrix
TPrate (sensitivity):
FPrate (fall-out):
++ --
++
--
TPTP
FNFN
FPFP
TNTN
actualactual
pre
dic
ted
pre
dic
ted
TP+FNTP+FN FP+TNFP+TN
true positivetrue positive false positivefalse positive
false negativefalse negative true negativetrue negative
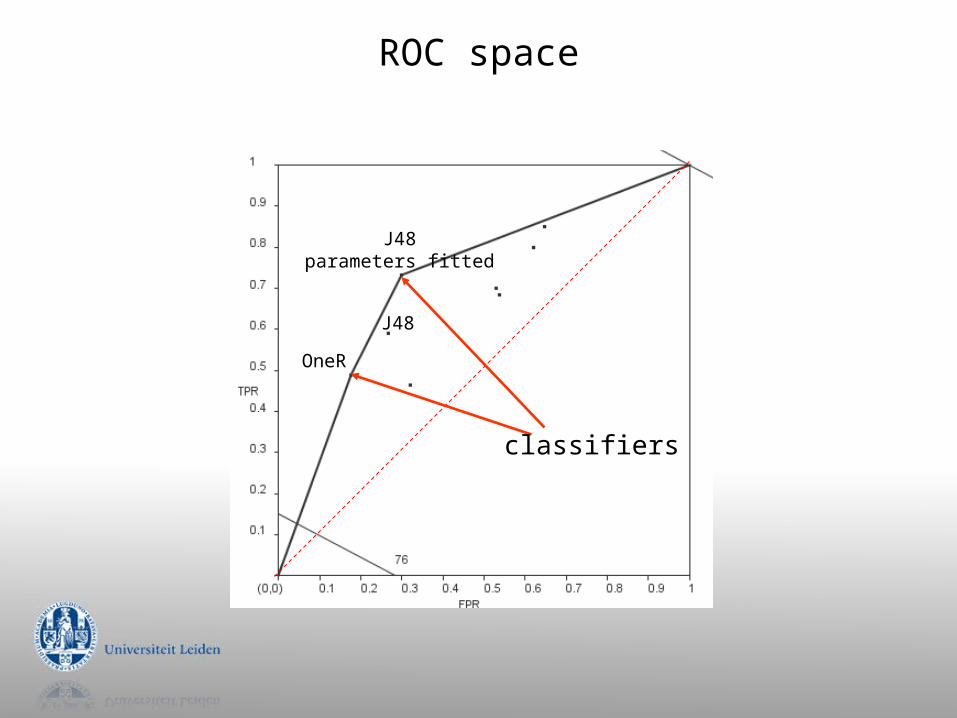
ROC space
classifiers
J48
OneR
J48parameters fitted

ROC curvesChange prediction threshold:Threshold t: (P(+) > t)
Area Under Curve (AUC)=0.75
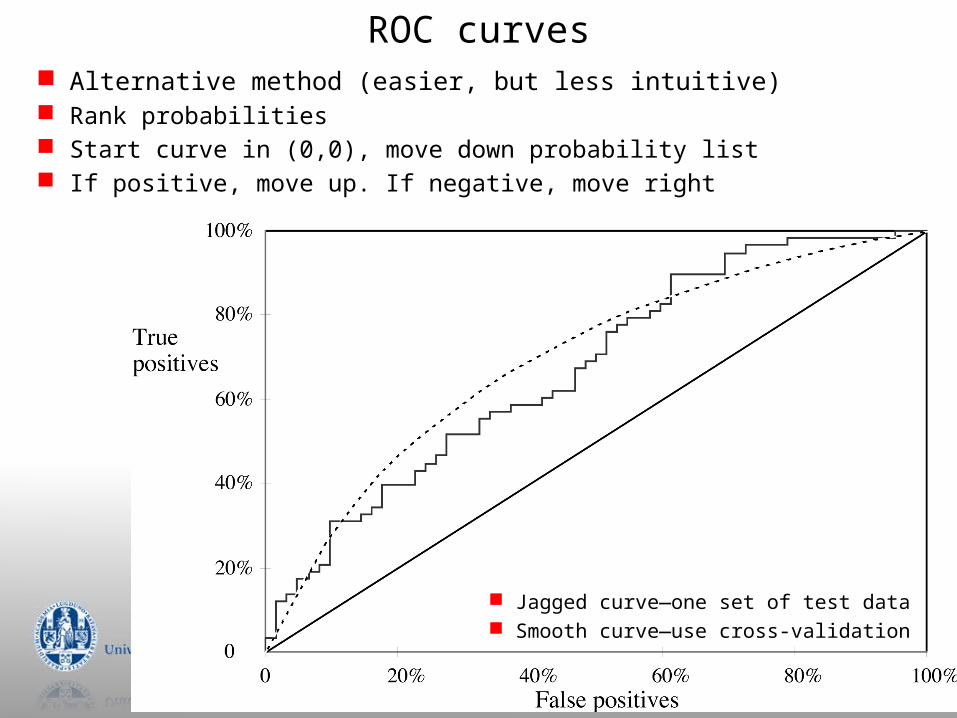
ROC curves
Jagged curve—one set of test data Smooth curve—use cross-validation
Alternative method (easier, but less intuitive) Rank probabilities Start curve in (0,0), move down probability list If positive, move up. If negative, move right
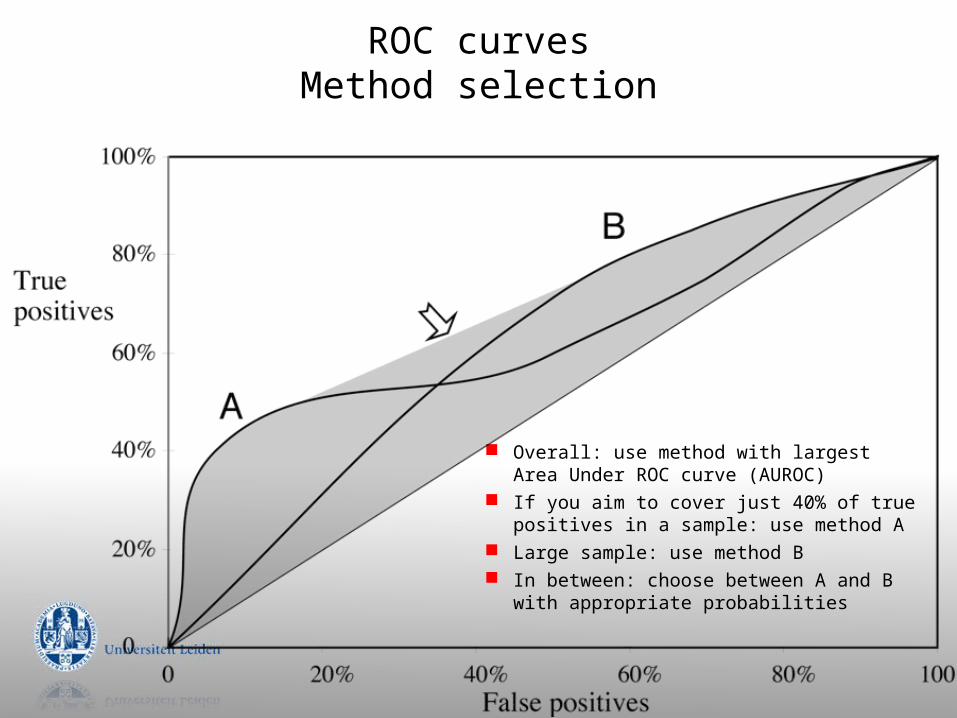
ROC curvesMethod selection
Overall: use method with largest Area Under ROC curve (AUROC)
If you aim to cover just 40% of true positives in a sample: use method A
Large sample: use method B In between: choose between A and B with
appropriate probabilities

ROC Space and Costs
equalcosts
skewedcosts
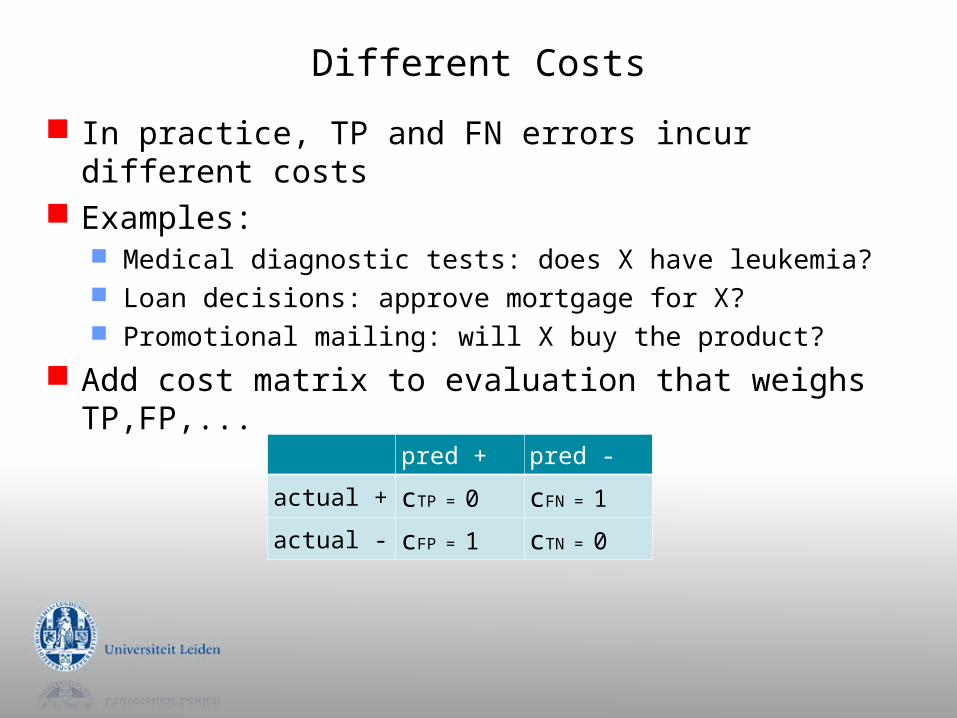
Different Costs
In practice, TP and FN errors incur different costs Examples:
Medical diagnostic tests: does X have leukemia? Loan decisions: approve mortgage for X? Promotional mailing: will X buy the product?
Add cost matrix to evaluation that weighs TP,FP,...
pred + pred -
actual + cTP = 0 cFN = 1
actual - cFP = 1 cTN = 0

Statistical Significance

Comparing data mining schemes
Which of two learning algorithms performs better? Note: this is domain dependent!
Obvious way: compare 10-fold CV estimates Problem: variance in estimate
Variance can be reduced using repeated CV However, we still don’t know whether results are reliable
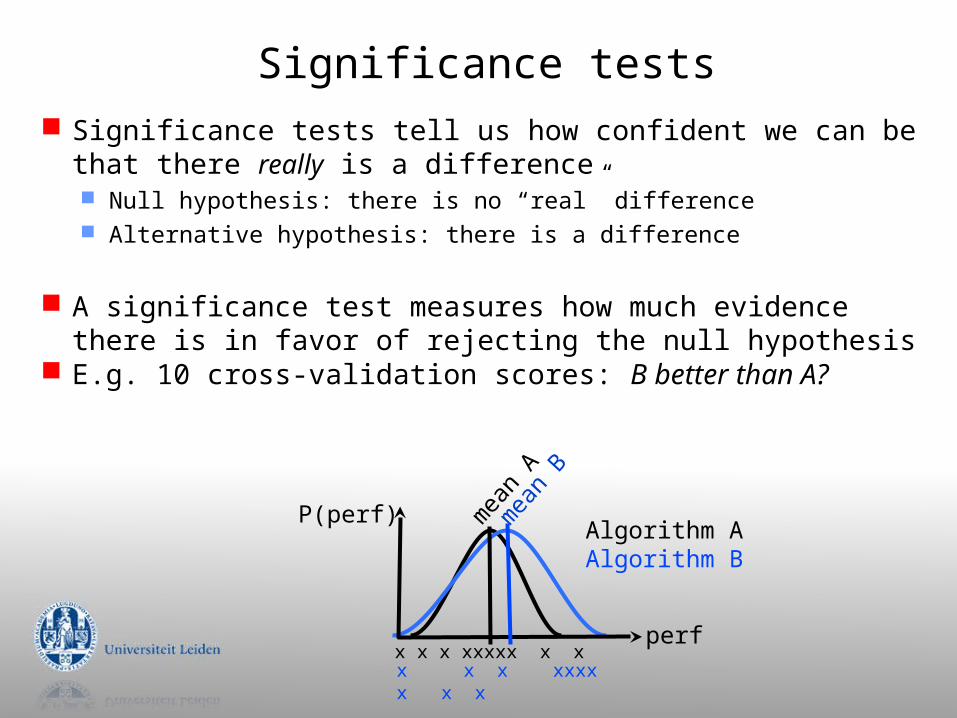
Significance tests Significance tests tell us how confident we can be
that there really is a difference Null hypothesis: there is no “real” difference Alternative hypothesis: there is a difference
A significance test measures how much evidence there is in favor of rejecting the null hypothesis
E.g. 10 cross-validation scores: B better than A?
Algorithm AAlgorithm B
perf
P(perf) mea
n A
mea
n B
x x x xxxxx x xx x x xxxx x x x

Paired t-test
Student’s t-test tells whether the means of two samples (e.g., 10 cross-validation scores) are significantly different
Use a paired t-test when individual samples are paired
i.e., they use the same randomization Same CV folds are used for both algorithms
32
William Gosset
Born: 1876 in Canterbury; Died: 1937 in Beaconsfield, England
Worked as chemist in the Guinness brewery in Dublin in 1899. Invented the t-test to handle small samples for quality control in brewing. Wrote under the name "Student".
Algorithm AAlgorithm B
perf
P(perf)
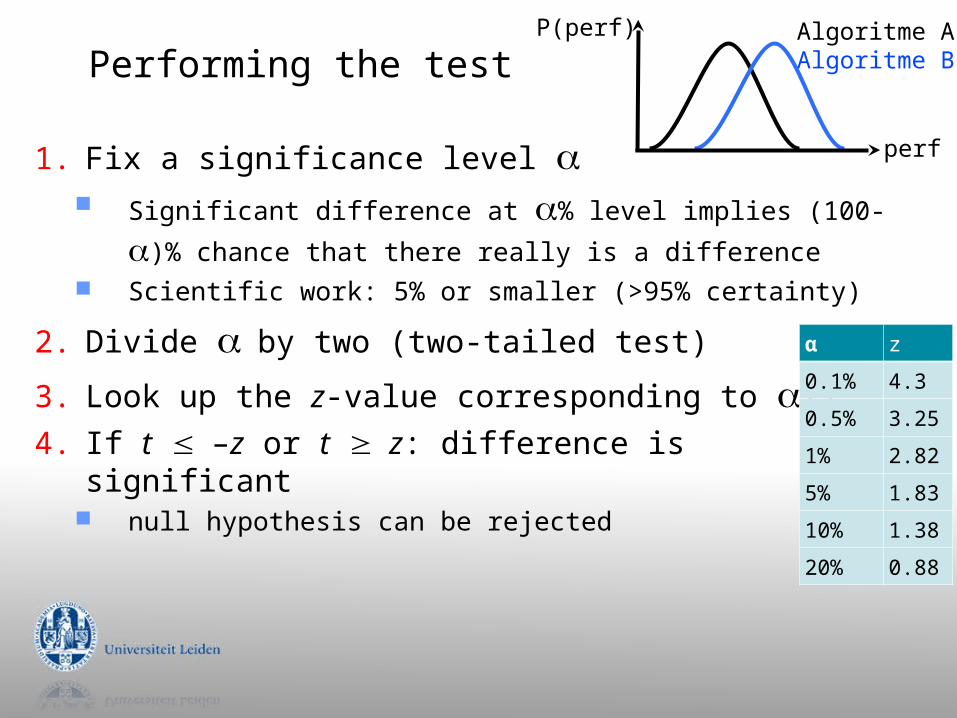
Performing the test
1. Fix a significance level Significant difference at % level implies (100-)%
chance that there really is a difference Scientific work: 5% or smaller (>95% certainty)
2. Divide by two (two-tailed test)
3. Look up the z-value corresponding to /2:
4. If t –z or t z: difference is significant null hypothesis can be rejected
Algoritme AAlgoritme B
perf
P(perf)
α z
0.1% 4.3
0.5% 3.25
1% 2.82
5% 1.83
10% 1.38
20% 0.88