learning analaytics and information visualization
TRANSCRIPT
Learning Analytics and Information Visualization Monitoring students’ activity and participation during online course MathGeAr and MetaMath, 26 – 27 June 2014 in Tampere
Tampere University of Technology Department of Mathematics Intelligent Information Systems Laboratory (IISLab) Kirsi Kuosa, Development manager Anne Tervakari, Juho Koro, Meri Kailanto, Jukka Paukkeri
Content of the presentation
• Learning Analytics
● Learning Analytics for TUT Circle and Moodle
● Research articles and references
2 Intelligent Information Systems Laboratory (IISLab)

Learning analytics
● Learning analytics can be defined as collection of methods for measuring, collecting, analyzing and reporting of data about learners, their actions and contexts, which can be utilized for understanding and optimizing learning (e.g. LAK 2011.)
● Focus is on the learning process including an analysis of the relationship between learner, content, teacher, and institution (Long & Siemens 2011.)
3 Intelligent Information Systems Laboratory (IISLab)

Learning Analytics – Why?
● Information about students' participation and activity is required while the course is still in progress, for example, to
● motivate and activate students, and promote their ongoing participation
● help identify students who may be at risk of failing, and ● help make decisions on pedagogical strategies, actions and
interventions. ● The rich information about students' actions is recorded and stored
automatically in the log data of learning environment. However,
● large amounts of data is difficult to utilize for developing learning and teaching
– data mining techniques, analysing methods, and visualizations tools are usually not developed for pedagogical purposes
– methods and tools may be cumbersome for use by teachers and students.
4 Intelligent Information Systems Laboratory (IISLab)
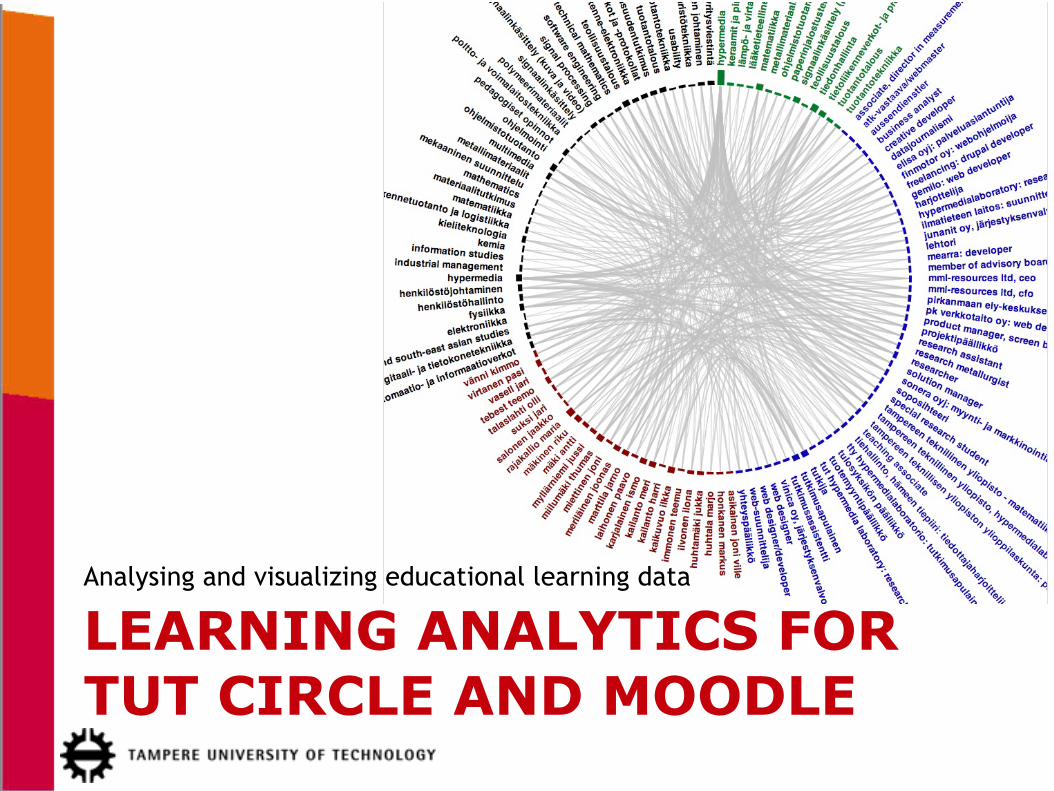
LEARNING ANALYTICS FOR TUT CIRCLE AND MOODLE
Analysing and visualizing educational learning data

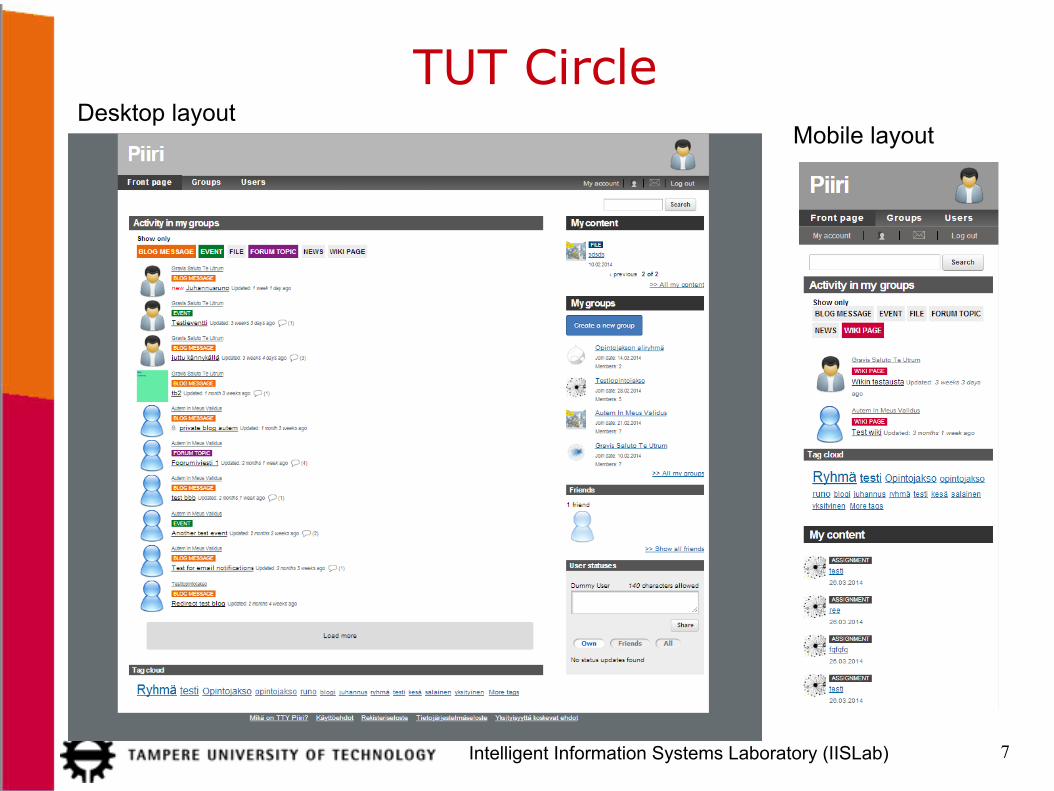
TUT Circle ● A social media enhanced learning environment developed by IISLab
of TUT. http://www.tut.fi/piiri
● Built on Drupal, an open source content management framework.
● Contains all the basic functionalities of a modern social media web service including possibilities
● to publish different types of content (wiki pages, blog posts, forum messages, news, events)
● to form groups and friendships with each others ● to send private messages, chat, exchange opinions, create,
contribute and comment on contents, share resources within and between the groups
● to control the visibility of their information and control the access to the information.
6 Intelligent Information Systems Laboratory (IISLab)
7 Intelligent Information Systems Laboratory (IISLab)
TUT Circle Desktop layout
Mobile layout
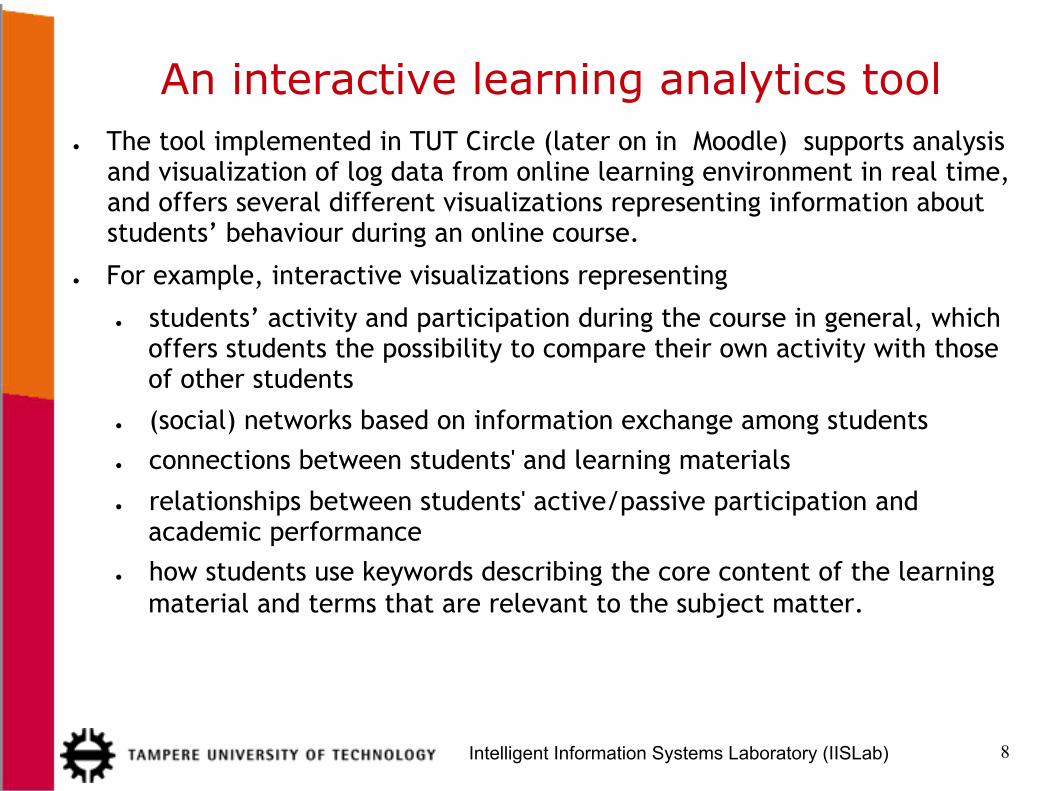
An interactive learning analytics tool ● The tool implemented in TUT Circle (later on in Moodle) supports analysis
and visualization of log data from online learning environment in real time, and offers several different visualizations representing information about students’ behaviour during an online course.
● For example, interactive visualizations representing
● students’ activity and participation during the course in general, which offers students the possibility to compare their own activity with those of other students
● (social) networks based on information exchange among students ● connections between students' and learning materials
● relationships between students' active/passive participation and academic performance
● how students use keywords describing the core content of the learning material and terms that are relevant to the subject matter.
8 Intelligent Information Systems Laboratory (IISLab)
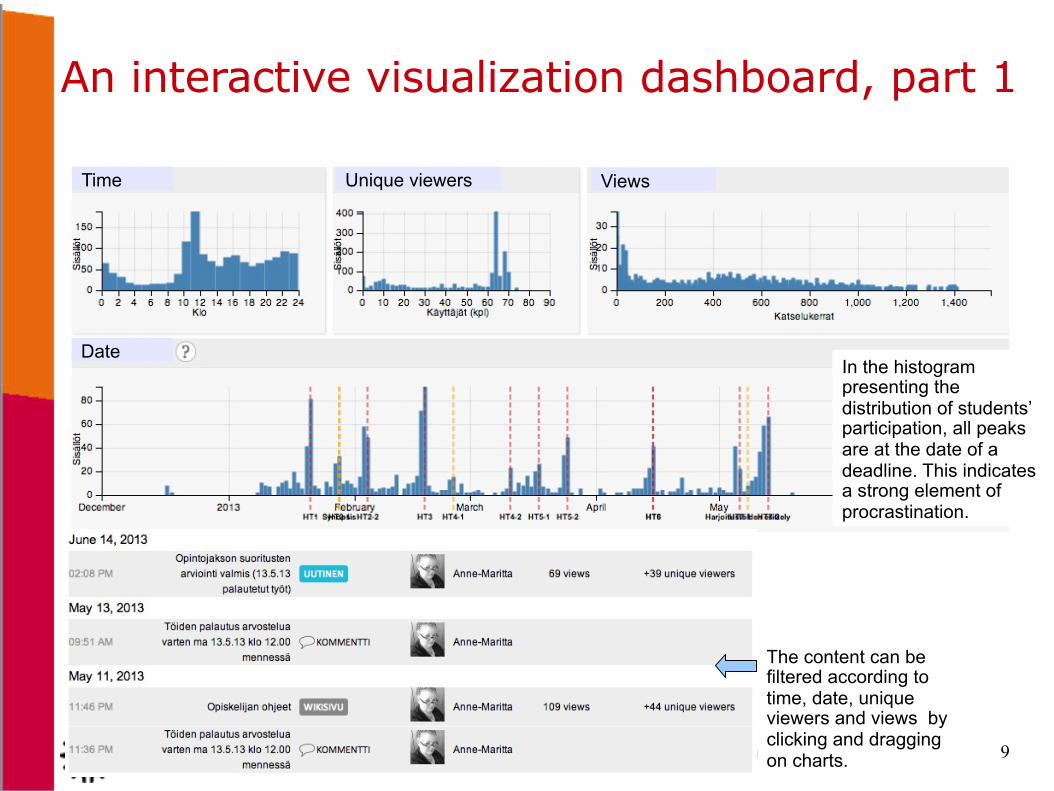
An interactive visualization dashboard, part 1
9 Intelligent Information Systems Laboratory (IISLab)
Time Unique viewers
Date
Views
The content can be filtered according to time, date, unique viewers and views by clicking and dragging on charts.
In the histogram presenting the distribution of students’ participation, all peaks are at the date of a deadline. This indicates a strong element of procrastination.

An interactive visualization dashboard, part 2
10
Type of content Activity of students
X-axis: number of content produced. Y-axis: views of content Size of bubble: size of content produced Green: Active Red: Passive
For teacher: possibility to make a comparison between students' activity and filter content according to an author.
For student: possibility to compare his/her own activity to other students’ activity and filter content according to an author.
Intelligent Information Systems Laboratory (IISLab)
The content can be filtered according to an author or type of content by clicking on the visualization.
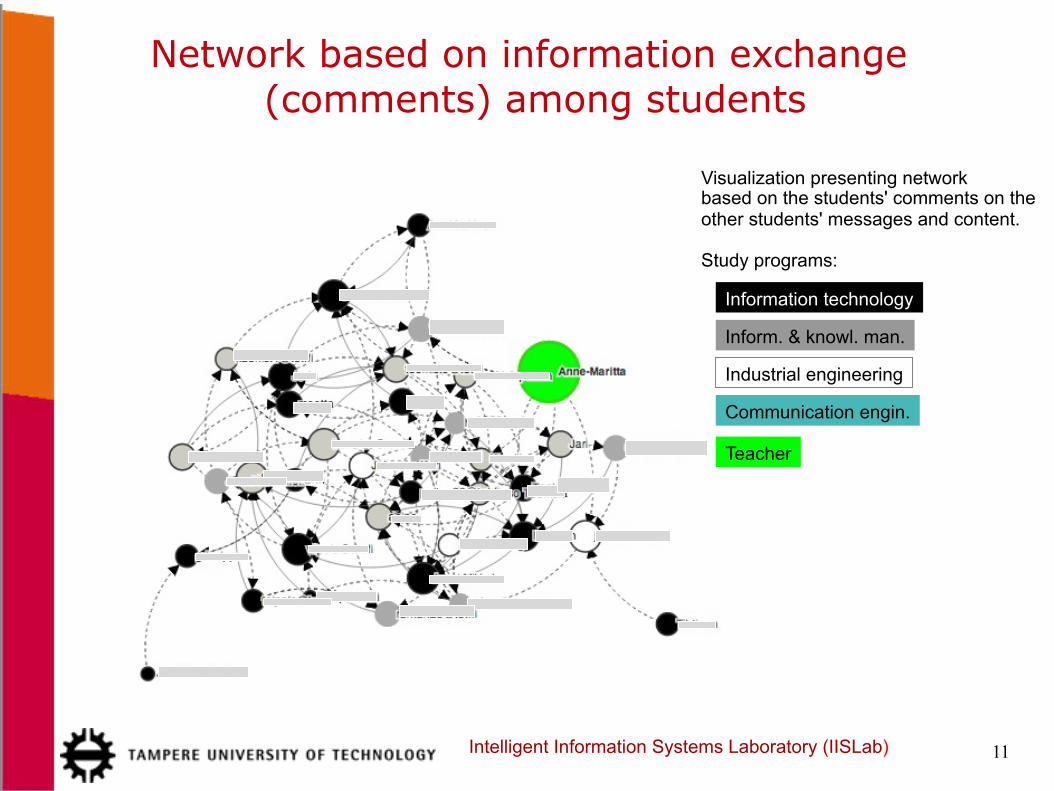
Network based on information exchange (comments) among students
11
Visualization presenting network based on the students' comments on the other students' messages and content. Study programs:
Information technology
Inform. & knowl. man.
Industrial engineering
Communication engin.
Teacher
Intelligent Information Systems Laboratory (IISLab)

Network based on information exchange (readings) among students
12
Visualization presenting network based on students' readings of the other students' content. The nodes may be filtered by study program. Study programs:
Information technology
Electrical engineering
Mechanical engineering
Inform. & knowl. man.
Electrical engineering
Industrial engineering
Communication engin.
Teacher
Intelligent Information Systems Laboratory (IISLab)
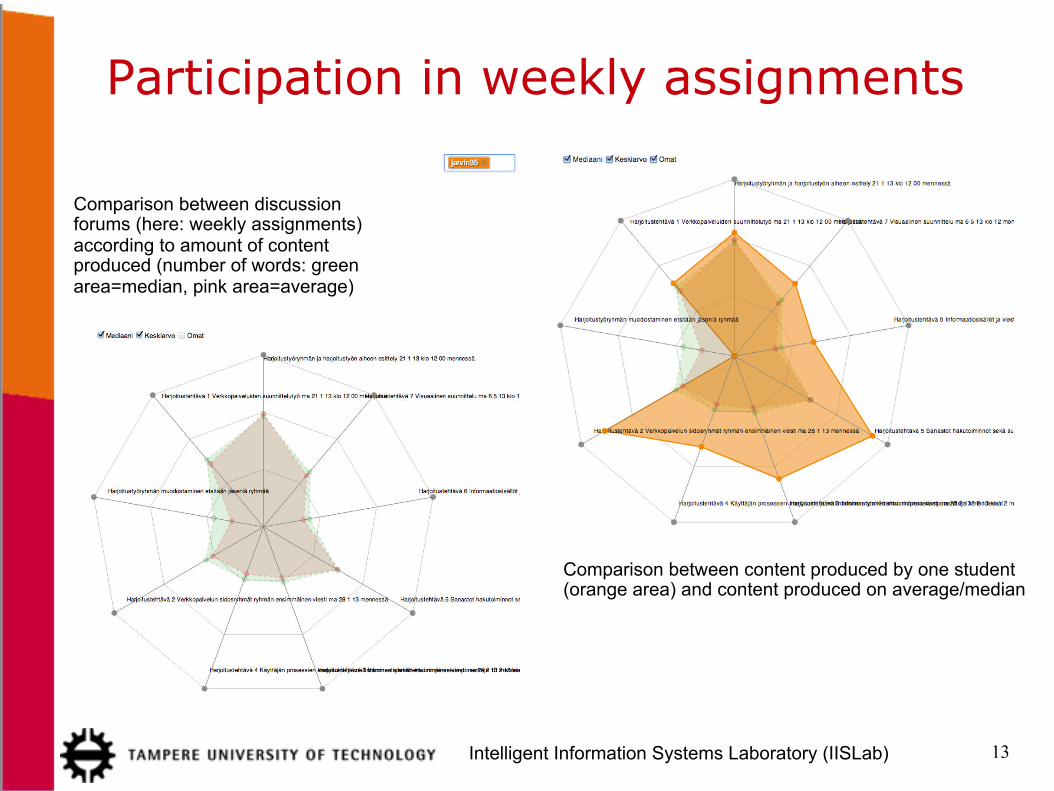
Participation in weekly assignments
13 Intelligent Information Systems Laboratory (IISLab)
Comparison between discussion forums (here: weekly assignments) according to amount of content produced (number of words: green area=median, pink area=average)
Comparison between content produced by one student (orange area) and content produced on average/median

Connections between students and learning materials
14 Intelligent Information Systems Laboratory (IISLab)
Students
Learning material available in TUT Circle
Discussion forums
Cited web sources
The visualization shows connections between the student (here: Petri) and 1. discussion forums he participated in 2. chapters of learning material he cited in his messages 3. web sources he cited in his messages.
For student: Possibility to examine his/her use of references, and compare his/her own actions to other students’ actions. For teacher: Also possibility to filter information presented in visualization according to grades.
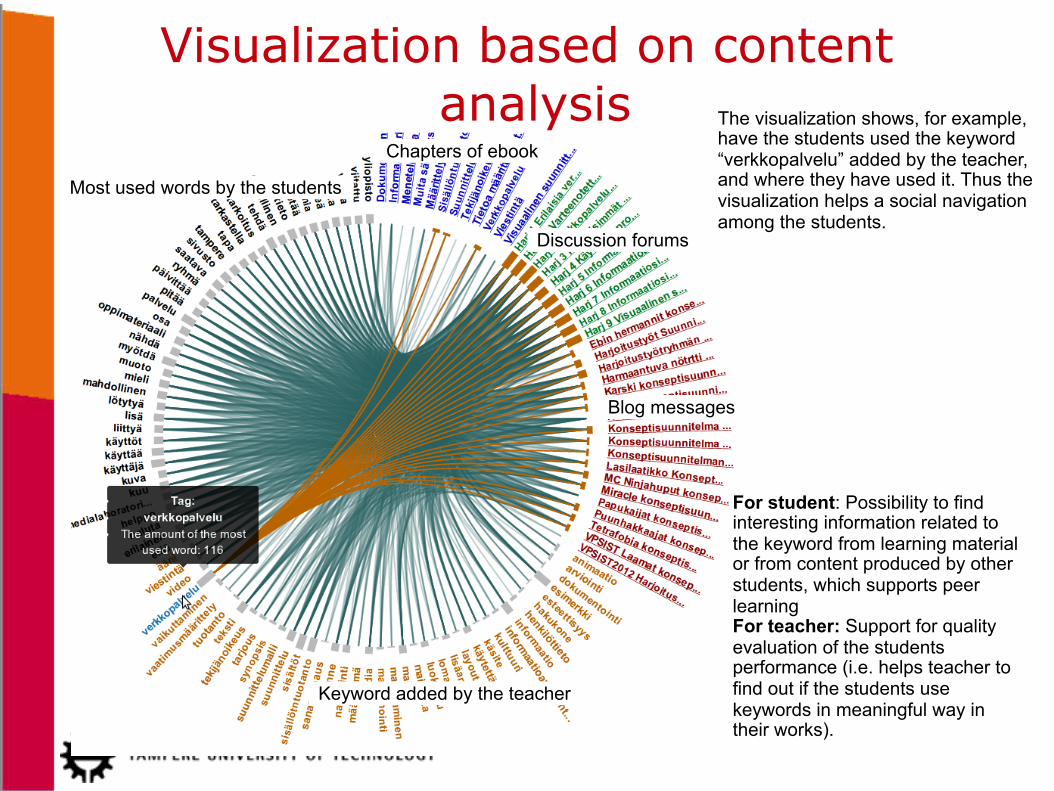
Visualization based on content analysis
Keyword added by the teacher
Most used words by the students
Blog messages
Discussion forums
Chapters of ebook
The visualization shows, for example, have the students used the keyword “verkkopalvelu” added by the teacher, and where they have used it. Thus the visualization helps a social navigation among the students.
For student: Possibility to find interesting information related to the keyword from learning material or from content produced by other students, which supports peer learning For teacher: Support for quality evaluation of the students performance (i.e. helps teacher to find out if the students use keywords in meaningful way in their works).
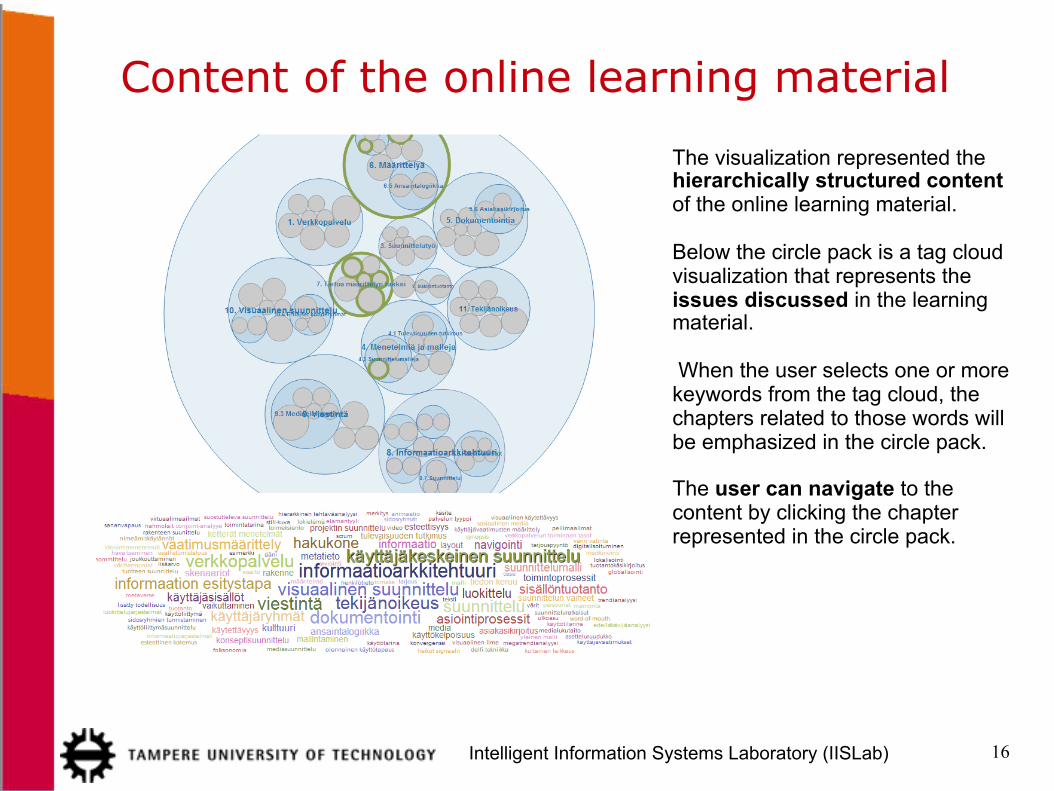
Content of the online learning material
16 Intelligent Information Systems Laboratory (IISLab)
The visualization represented the hierarchically structured content of the online learning material. Below the circle pack is a tag cloud visualization that represents the issues discussed in the learning material. When the user selects one or more keywords from the tag cloud, the chapters related to those words will be emphasized in the circle pack. The user can navigate to the content by clicking the chapter represented in the circle pack.
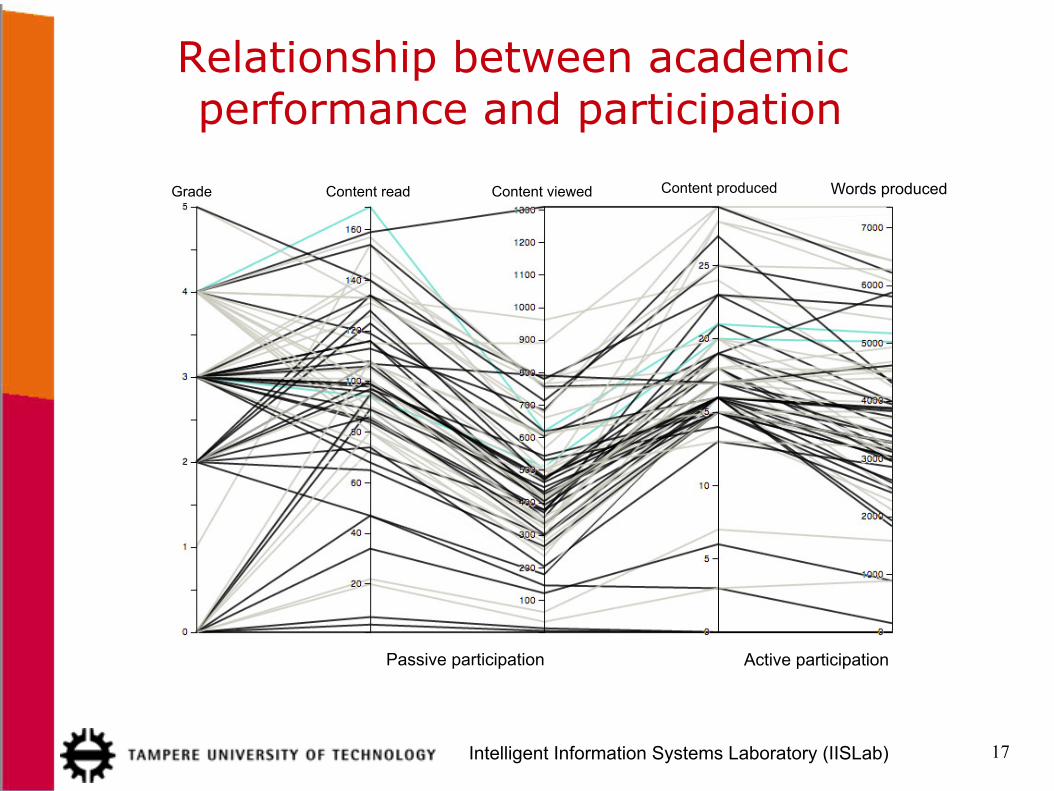
Relationship between academic performance and participation
17 Intelligent Information Systems Laboratory (IISLab)
Grade Words produced Content produced Content viewed Content read
Passive participation Active participation
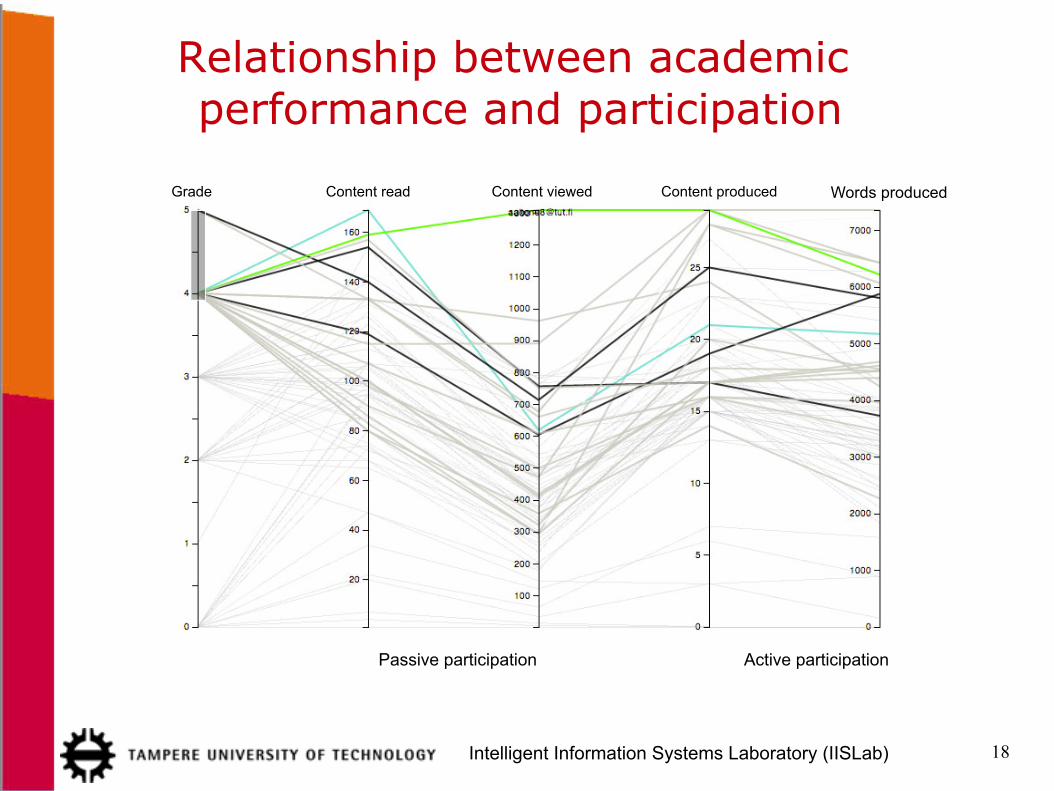
Relationship between academic performance and participation
18 Intelligent Information Systems Laboratory (IISLab)
Grade Content read Content viewed Content produced Words produced
Passive participation Active participation
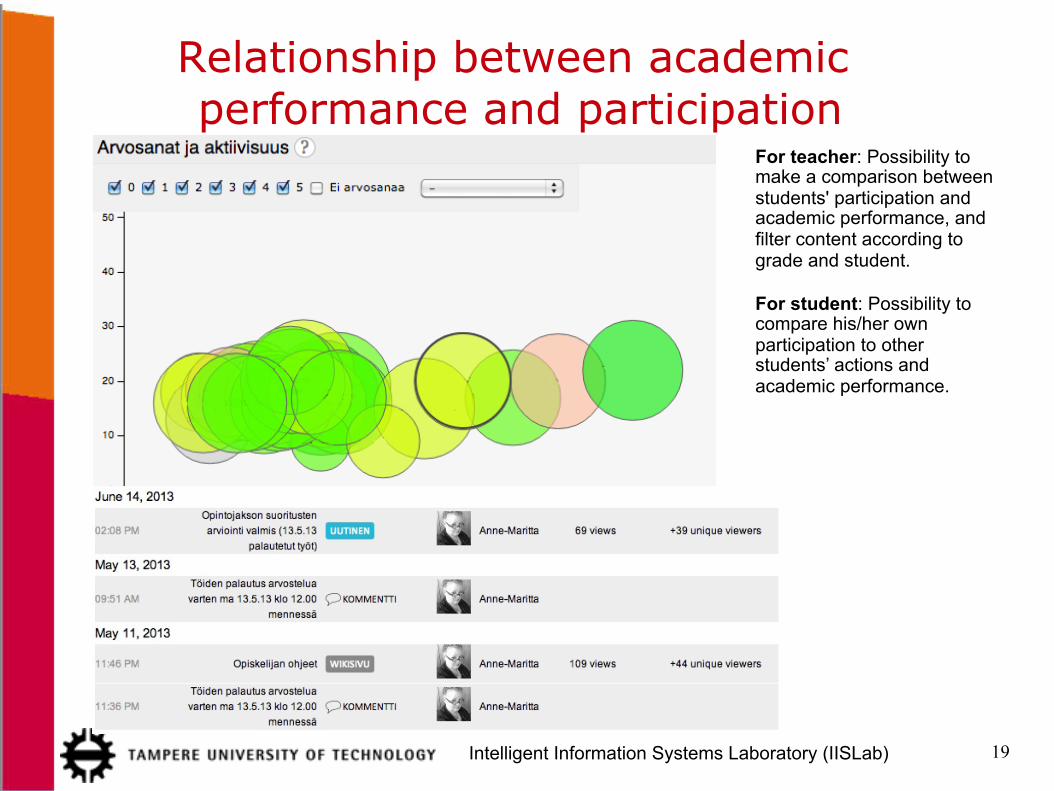
Relationship between academic performance and participation
19 Intelligent Information Systems Laboratory (IISLab)
For teacher: Possibility to make a comparison between students' participation and academic performance, and filter content according to grade and student.
For student: Possibility to compare his/her own participation to other students’ actions and academic performance.
Summa summarum ● Learning analytics and visualization of learning data can produce valuable
information for both teachers and students. For example possibilities to
● verify student interaction and collaboration activities, ● see latent ties among students and learning materials or external web
resources
● observe the evolution of student active/passive participation ● investigate relationship between active/passive participation or
undesired behaviour like procrastination and academic performance.
● Visualizations based on content analysis can support to obtain overviews, categorize, navigate, search for relevant content, and evaluate the quality of the content.
20 Intelligent Information Systems Laboratory (IISLab)
Please, see the video that gives an overview of the different visualizations done at IISLab in 2009-2013 in a Finnish national Campus Conexus project financed by the European Social Fund: http://vimeo.com/84297046
Benefits for the teachers ● Help to evaluate the quality of a course’s instructional design from
viewpoint of pedagogical usability (Silius & Tervakari 2003,2007).
● Provide useful information about students’ learning types and activity, and evolution of the participation.
● Help to identify undesired behaviour such as procrastination, and students who might have risk of failing or dropping out. à Possibilities to make strategic interventions or provide guidance just in time.
● Support comparison of activity and active/passive participation among the students, and the quality evaluation of the students’ performance. à Support for fair and just assessment of the students’ learning performance.
● Help the to maintain the quality of the learning material, for example, by helping to identify the least used parts of the material.
21 Intelligent Information Systems Laboratory (IISLab)
Benefits for the students
• Helps to monitor and evaluate own performance processes and learning outcomes, and compare own activity levels with those of other students. à Support strategic adjustments for improving own performance.
• Helps to find new and interesting references to utilize in own works.
• Visualization based on content analysis can help to see the overview of the actual topics discussed, reflect the quality of own content, and support educational knowledge discovery.
• May increase motivation (especially among the students who have a competitive spirit).
22 Intelligent Information Systems Laboratory (IISLab)
Research articles 1/3 ● Kuosa, K., Koro, J., Tervakari, A-M., Paukkeri, J. & Kailanto, M. 2014. Content analysis and
visualizations, Tools for social enhanced learning environment. 17th International Conference on Interactive Collaborative Learning (ICL 2014), 3 – 6 December 2014 in Dubai. Accepted for publication.
● Silius, K., Kailanto, M. & Tervakari, A-M. 2011. Evaluating the quality of the social media in an educational context. International Journal of Emerging Technologies in Learning, vol. 6, issue 3, 21 -27. doi: http://dx.doi.org/ijet.v6i3.1732
● Silius, K. & Miilumäki, T. 2009. Students’ Motivations for Social Media Enhanced Studying and Learning. In: Proceedings of International Technology Enhanced Learning Conference 2009 (TELearn 2009) on the 6-8 October 2009 Taipei, Taiwan. CD-ROM.
● Silius, K., Miilumäki, T., Huhtamäki, J., Tebest, T., Meriläinen, J. & Pohjolainen, S. 2010. Social Media Enhanced Studying and Learning in Higher Education. In Education Engineering (EDUCON), 2010 IEEE, Conference Proceedings, 14-16 April 2010, Madrid, Spain, pp. 137-143.doi: http://dx.doi.org/10.1109/EDUCON.2010.5492586
● Silius, K., Miilumäki, T., Huhtamäki, J., Tebest, T., Meriläinen, J. & Pohjolainen, S. 2010. Students’ Motivations for Social Media Enhanced Studying and Learning. In Knowledge Management & E-Learning: An International Journal (KM&EL), Vol. 2, No. 1, pp. 51-67. Available at http://www.kmel-journal.org/ojs/index.php/online-publication/article/view/55/39 .
23 Intelligent Information Systems Laboratory (IISLab)

Research articles 2/3 ● Silius, K., Tervakari, A-M. & Kailanto, K. 2013. Visualizations of user data in social media
enhanced web-based environment in higher education. In: Proceedings of Global Engineering Education Conference (EDUCON), Synergy from Classic and Future Engineering Education, 2013 IEEE, the 13-15 March 2013 in Berlin, Germany. Extended version published in International Journal of Emerging Technologies in Learning, vol. 8, Special issue. DOI: http://dx.doi.org/10.3991%2Fijet.v8iS2.2740
● Silius, K., Tervakari, A-M., Huhtamäki, J., Tebest, T., Marttila, J., Kailanto, M. & Miilumäki, T. 2011. Programming of Hypermedia – Course Implementation in Social Media. In: Proceedings of the 2011 2nd International Congress on Computer Applications and Computational Science. Advances in Intelligent and Soft Computing, 2012, Volume 144/2012, 369-376. Springer Berlin/Heidelberg. DOI: http://dx.doi.org/10.1007/978-3-642-28314-7_50
● Silius, K., Tervakari, A-M., Kailanto, M., Huhtamäki, J., Marttila, J., Tebest, T. & Miilumäki, T. 2011. Developing an Online Publication – Collaborating among Students in Different Disciplines. In: Proceedings of the 2011 2nd International Congress on Computer Applications and Computational Science. Advances in Intelligent and Soft Computing, 2012, Volume 144/2012, 361-367. Springer Berlin/Heidelberg. DOI: http://dx.doi.org/10.1007/978-3-642-28314-7_49
● Tervakari, A-M., Kuosa, K., Koro, J., Paukkeri, J. & Kailanto, M. 2014. Teacher’s learning analytics tools in social media enhanced learning environment. 17th International Conference on Interactive Collaborative Learning (ICL 2014), 3 – 6 December 2014 in Dubai. Accepted for publication.
24 Intelligent Information Systems Laboratory (IISLab)
Research articles 3/3 ● Tervakari, A-M., Marttila, J., Kailanto, M., Huhtamäki, J., Koro, J. & Silius, K. 2013.
Developing Learning Analytics for TUT Circle. In: Ley, T., Ruohonen, M., Laanpere, M. & Tatnall, A. (eds.). Open and Social Technologies for Networked Learning. IFIP Advances in Information and Communication Technology. Springer Berlin/Heidelberg, 101 – 110. http://dx.doi.org/10.1007/978-3-642-37285-8_11
● Tervakari, A-M., Silius, K. & Kailanto, K. 2013. Students’ Participation in a Social Media Enhanced Learning Environment. In: Proceedings of Global Engineering Education Conference (EDUCON), Synergy from Classic and Future Engineering Education, 2013 IEEE, the 13-15 March 2013 in Berlin, Germany. Extended version is published in International Journal of Emerging Technologies in Learning, vol. 8, Special issue. DOI: http://dx.doi.org/10.3991%2Fijet.v8iS2.2740
● Tervakari, A-M., Silius, K., Koro, J., Paukkeri, J., and Pirttilä, O. 2014. Usefulness of information visualizations based on educational data. In Proceedings ofn the 4th IEEE Global Engineering Education Conference (EDUCON 2014) on 2nd – 6th of April 2014 in Istanbul, Turkey, 142 - 151. doi: http://dx.doi.org/10.1109/EDUCON.2014.6826081
● Tervakari, A-M., Silius, K., Tebest, T. Marttila, J., Kailanto, M, & Huhtamäki, J. 2012. Peer learning in Social Media Enhanced Learning. International Journal of Emerging Technologies in Learning, vol. 7, issue 3, 35-42. http://dx.doi.org/10.3991/ijet.v7i3.2173
25 Intelligent Information Systems Laboratory (IISLab)

References
• LAK 2011. 1st International Conference on Learning Analytics and Knowledge, Banff, Alberta, 27 Feb – 1 March, 2011, https://tekri.athabascau.ca/analytics/
• Long, P, and Siemens, G. 2011. Penetrating the Fog: Analytics in Learning and Education. EDUCAUSE Review, vol. 46, no. 5, 30 – 40. https://net.educause.edu/ir/library/pdf/ERM1151.pdf
• Silius, K. & Tervakari, A-M. 2003. An Evaluation of the Usefulness of Web based Learning Environments, The Evaluation Tool into the Portal of Finnish Virtual University,” in: Pearrocha, V. & alt. (ed.) mENU 2003 – Int. Conf. on University Networks and E-learning 2003, 8-9 May 2003 in Valencia, Spain. Proc. of mENU.
• Silius, K. & Tervakari, A-M. 2007. Variety of Quality Experiences on Web-Based Courses. In: Spector, J. M. et al. (eds.). Proc. of the 7th IEEE Int.Conference on Advanced Learning Technologies ICALT 2007, July 18-20 2007, Niigata, Japan, 858-86. DOI: http://dx.doi.org/10.1109/ICALT.2007.278
Thank you for your attention! Questions?
27 Intelligent Information Systems Laboratory (IISLab)
Photo: Mika Hirsimäki
Campus Conexus (2009-04/2014)
• This study is part of a Finnish national project called Campus Conexus.
• Purpose is to strengthen the cultural practices of five Finnish universities and to promote learning and teaching.
• Aim is to study how to engage students into university studies by enriching learning experiences for example with online communities.
• Financed by European Social Fund.