learning by doing - 1008 - economics - fiu · many of the distinctive theoretical implications of...
TRANSCRIPT

LEARNING BY DOING Peter Thompson
Department of Economics, Florida International University, Miami, FL 33165
email: [email protected]
October 2008
Abstract. This chapter reviews the theoretical and empirical literature on learning by do-ing. Many of the distinctive theoretical implications of learning by doing have been derived under the assumption that the cost-quantity relationships observed in numerous empirical studies are largely the result of passive learning, and some further require that passive learning is unbounded. The empirical literature raises doubts about both assumptions. When observed cost-quantity relationships indicate sustained productivity growth, factors other than passive learning are generally at work. When passive learning is the dominant factor, productivity growth is invariably bounded. Thus, empirically-relevant theories in-corporating learning by doing are hybrid models in which passive learning coexists with other sources of growth. But in such models, many of the distinctive implications of passive learning become unimportant. Moreover, passive learning is often an inessential component of long-run growth; to the contrary, too much learning can lead to stagnation.
Keywords: Learning by doing, learning curves, passive learning, progress curves, cost-quantity relationship, knowledge spillovers, forgetting.
JEL Classification: D24, D92, F12, L11, L16, O3.
Prepared for Bronwyn Hall and Nathan Rosenberg (eds.) Handbook of Economics of Tech-nical Change, Elsevier/North-Holland. Forthcoming, 2009.

1
Contents
1. Introduction 1
2. Microeconomic Implications of Passive Learning 5
2.1 Pricing and output decisions 5
2.2 Cost functions and price-taking behavior 7
2.3 Endogenous heterogeneity 8
2.4 Learning and industry concentration 9
2.5 Strategic implications of learning 11
2.6 Alternative specifications of passive learning 16
3. Empirical Evidence 20
3.1 Large sample evidence 23
3.2 Individual learning by doing 26
3.3 Case study evidence 27
4. Theories of Passive Learning 34
4.1 Models with unbounded learning 34
4.2 Models with bounded learning 36
5. Passive Learning and Aggregate Growth 41
5.1 A simple model 41
5.2 Hybrid models 44
6. Concluding Remarks 49
References 50

1
1. Introduction Learning by doing (LBD) is the colloquial name given by economists to the phenomenon of productivity growth associated with, but incidental to, the accumulation of production ex-perience by a firm. The experience of a firm at any given age may be measured in a number of ways including, inter alia, the age of the firm, the cumulative prior output of the firm, the average tenure of its employees, or the average length of related work-experience of its employees. The most popular implementation assumes that the current unit cost of a firm of age v, c(v), is a decreasing function of its cumulative prior output, 0( ) ( )vy v x s ds∫= ; in much research, most especially in empirical and macroeconomic applications, a power rule of the form ( ) (0) ( )c v c y v β−= is assumed.
The term LBD was in widespread use by the beginning of the twentieth century, largely mo-tivated by its expanding popularity as a philosophy of educational method [cf. Dewey (1897)]. Even in economics journals, for much of the century its context was limited to education. Not until Arrow (1962) was the term applied to firm learning, but thereafter its application to firms and even higher levels of aggregation quickly gained currency. Throughout the 1960s and 1970s, much of the focus of the literature was on documenting the importance and prevalence of LBD, especially in industrial settings. The literature in the late 1970s and through the next decade was dominated by theoretical work on the strategic implications of LBD; for a period much of this work was conducted in the context of indus-trial trade policy. Beginning around 1990, LBD factored prominently in macroeconomic models of endogenous growth. Most recently, the focus appears to have reverted to empiri-cal work, which has mainly been concerned with identifying underlying sources of LBD.
One can point to several explanations for the prompt and sustained interest in LBD after Arrow’s seminal paper. First, influential studies by Abramowitz (1956) and Solow (1957) had already established that technical change was a far more important source of long-run economic growth than had previously been realized. The consequent reduction of the theory of long-run growth to a time trend was intellectually unsatisfying and left economists with little to say about policy [Arrow (1962:155)]. LBD simultaneously appeared to offer a source of technical change that was intuitively plausible, that was susceptible to manipulation by appropriate policy intervention, and that did not increase the dimensionality of the optimi-zation problems that economists needed to solve.
Second, LBD generated sufficiently distinctive implications for firm behavior and policy to sustain interest in models that incorporated it. For example, equating static marginal cost to marginal revenue is neither privately nor socially optimal; price-taking equilibria may not exist; and monopolies may be socially preferable to competitive markets. Competition

2
policy is necessarily rather complicated in such circumstances, both in terms of philosophy (traditional anti-trust policies may be unwise), and implementation (pricing below marginal cost need not signify predatory behavior). Moreover, LBD leads to hystereris effects, where temporary shocks and policy interventions that alter output have permanent effects on productivity. Thus, not only the design of policy interventions, but also their appropriate duration, are more complicated in the presence of LBD.
Third, LBD appeared to be amply motivated by a large empirical literature, appearing pre-dominantly in engineering and management fields, showing a robust relationship between cumulative output and unit costs. The nature of the relationship was often reported to be precisely or very nearly that indicated by the power rule. Wright’s (1936) study of the cost-quantity relationship in aircraft manufacturing was the first to mention an organizational learning curve in the academic literature (see Figure 1-1), although by this time the phe-nomenon appears to have already been well known in the aircraft industry. During World War II, the U.S. Government incorporated expectations of strong organizational learning into the contracts it signed with aircraft manufacturers [Asher (1956:84)] and shipbuilders [Lane (1951)], and studies released soon after the war showed that these expectations were well founded [Alchian (1963[1950]), Montgomery (1943), Middleton (1945), Searle (1945)]. During the 1960s, many dozens of studies documented strong cost-quantity relationships in a broad range of industries. Some of these continued the practice of earlier studies, estimat-ing changes in average costs over time [see, for example, Hirsch (1952) and Baloff (1966) on machine manufacturing, and Preston and Keachie (1964) on radars]; this activity attained industrial proportions when the Boston Consulting Group (1972) estimated hundreds of
FIGURE 1-1. Wright’s (1936) rendition of the learning curve. Wright provides no information about the data used to construct this figure, which may even have come from cross-sectional data obtained from different aircraft.

3
curves, and used them to promote a management strategy of maximizing market share. Around the same time other studies, beginning with Rapping (1965) and Sheshinski (1967a), began to estimate experience as an input in an otherwise conventional production function, also finding evidence of significant learning effects.
This paper reviews theoretical research conducted over the last forty years on the economic implications of LBD, as well as concurrent empirical research on its nature and importance. To summarize the plan of the paper, it is useful to distinguish between different concepts of what Wright (1936) had rather generically called the cost-quantity relationship. I shall use the term passive learning to refer throughout this paper to the conventional economic char-acterization of organizational LBD as an incidental and costless byproduct of a firm’s pro-duction activities. A firm that increases productivity through passive learning will be said to move along an experience curve. I shall use the term progress curve to refer to the em-pirical relationship between current unit cost (or productivity) and a firm’s cumulative ex-perience. The term cost-quantity relationship will be used in the same way that Wright used it: to refer to the observed relationship between cumulative output and the average cost of producing that cumulative output. Finally, I reserve the rather special term learning curve for increases in productivity or, more generally, advances in knowledge, that indi-viduals exhibit as they accumulate experience in a task.1
The progress curve encompasses a broader range of sources of growth than does the experi-ence curve. In addition to passive learning, it allows for research, innovation, product de-sign changes, capital investment, and other costly activities that might, with the passage of time, enable a firm to become more productive. In turn, the cost-quantity relationship is a broader concept than the progress curve. Wright (1936:124) offered three explanations for the cost-quantity relationship he had observed in his career as an aircraft engineer and ex-ecutive. The first was the “improvement in proficiency of a workman with practice”, char-acterized by the learning curve. Wright’s other explanations were “the greater spread of machinery and fixture set up time in large quantity production,” and “the ability to use less skilled labor as more and more tooling and standardization of procedure is introduced.” These two are, of course, static scale economies, under which one would observe a cost-quantity relationship even in the absence of learning.
The distinctions between these concepts are not trivial. For example, if movement along the progress curve is driven solely by costly R&D, and not at all by passive learning, then equating static marginal cost to static marginal revenue is socially optimal. Similarly, if the
1 Empirical work on the learning curve considerably predates that on progress curves. See Ebbinghaus’ (1885) experiments on memory, Bryan and Harter’s (1899) study of telegraph op-erators, and Book’s (1908) study of typists.

4
cost-quantity relationship is purely a result of static scale economies, then it and the pro-gress function have distinct economic implications. Consider, for example, an unanticipated transitory demand shock that raises the rate of production for a period of time. The pro-gress function predicts a permanent decline in unit costs from this point forward. In con-trast, static scale economies predict that transitory shocks have no effect on long-run costs. In the short-run, unit costs may bear a positive or negative relationship to output shocks, even when long-run average cost is declining, because the firm must respond to unantici-pated shocks by moving along its short-run cost curve.2 In summary, many of the distinc-tive (and intriguing) implications of LBD are lost when firm progress is not driven by pas-sive learning.
I begin in Section 2 with a review of some theoretical implications of passive learning. The section considers, inter alia, its consequences for the pricing decision of a single firm, condi-tions for the existence of a competitive equilibrium, and its strategic implications. Many of the intriguing implications of learning turn out to depend upon auxiliary assumptions that may not hold. For example, it is a widely–held belief that learning generates dynamic scale economies that are incompatible with price-taking equilibria; whether this is so depends on assumptions made about the static cost function, as well as assumptions about the form of the experience curve. Section 3 provides a selective review of empirical work. Two central questions emerge from the empirical literature. First, what fraction of the cost-quantity re-lationship is accounted for by passive learning? Second, is the contribution of passive learn-ing unbounded as experience accumulates? The answers to these questions are clouded by considerable empirical difficulties caused in large part by the poor quality of data that have typically been available to researchers.3 Early studies invariably indicated an important role for passive learning, and favored specifications consistent with unbounded productivity. But recent studies using highly detailed data have raised doubts about the conventional wis-dom. The tenor of this newer literature is that relatively little of the cost-quantity relation-ship observed in industrial settings can be attributed to passive learning, and thus that much of the theoretical work on passive learning might be barking up the wrong tree. In settings where LBD or passive learning is likely to be a major factor in the cost-quantity relationship, the likely conclusion is that it is bounded.
Section 4 reviews theories of learning, in two parts. The section first reviews theories that have attempted to generate a power rule for passive learning, before turning to a treatment
2 That is, with declining long-run average cost, small positive shocks to demand reduce average cost while sufficiently large shocks increase it. 3 Perhaps it is more accurate to say that the answers are unusually demanding of the data, to an extent that strains even what high-quality datasets can offer.

5
of models with bounded learning. One lesson from these latter models is that alternative theories with potentially distinct policy implications, may be exactly or nearly exactly ob-servationally equivalent. Section 5 reviews macroeconomic models of economic growth, with a focus on models that incorporate bounded learning. These models are essentially hybrids involving the sequential introduction of generations of products or technologies, with pas-sive learning within each generations. New generations are introduced either exogenously or as the result of some purposive activity distinct from passive learning, such as R&D, al-though there may also be learning spillovers across generations. In these hybrid models, passive learning is often an inessential component of long-run growth. To the contrary, too much passive learning can under certain circumstances lead to stagnation.
2. Microeconomic Implications of Passive Learning This section reviews some theoretical implications of passive learning under the conven-tional assumption that learning proceeds in lockstep with cumulative production volume. The review begins, in subsection 2.1, with the pricing and output decisions of a single firm. Because passive learning generates dynamic increasing returns, much of the early theoreti-cal literature confined itself to imperfect competition. However, perfect competition is com-patible with passive learning when static marginal costs rise sufficiently rapidly; subsection 2.2 reviews the conditions under which a price taking equilibrium can exist. Subsections 2.3 and 2.4 consider some implications of passive learning for industry concentration. Subsec-tion 2.5 reviews some strategic implications of passive learning in imperfectly competitive markets. It begins by holding fixed the number of firms and exploring how passive learning influences pricing behavior when there are strategic considerations. The second part is con-cerned with the incentives that passive learning creates for incumbent firms to engage in predatory behavior designed to deter entry or promote exit. The section closes with a dis-cussion of the robustness of results to alternative formulations of passive learning.
2.1 Pricing and Output Decisions
Let x(t) denote the rate of output of a firm, 0
( ) ( )t
y t x s ds= ∫ its cumulative output, R(x(t)) its revenues, and ( ( ), ( ))c x t y t its total costs. Assume 0
xc ≥ , 0
yc < , and 0
xyc < ; static
marginal costs are non-decreasing at any level of experience, while experience lowers total and marginal costs at any output level. The firm has a planning horizon of T and faces an interest rate of r. Its objective is
{ }
0( ) 0
max ( ( )) ( ( ), ( ))T
Trt
x t
V R x t c x t y t e dt− = − ∫ , (2.1)
subject to the constraint ( ) ( )y t x t= . Let ( )tλ denote the shadow price of experience. Equa-

6
tion (2.1) is a standard free-endpoint optimal control problem, so ( ) 0Tλ = . The necessary condition for an interior maximum is
( ( )) ( ( )) ( )x
c x t R x t tλ′= + , (2.2)
and substituting the forward solution for the shadow price yields
( )( ( )) ( ( )) ( ( ), ( ))T
r s tx y
t
c x t R x t c x s y s e ds− −′= − ∫ . (2.3)
The optimal strategy sets marginal cost above marginal revenue by an amount equal to the discounted present value of the cost savings obtained from an increment to experience to-day. How large this wedge between static marginal cost and revenue is depends on the form of the cost function and the path that future output will take. Rosen (1972) was the first to study the problem. He was content to leave the form of ( ( ), ( ))c x t y t unspecified, and conse-quently he limited himself to deriving and discussing the condition (2.3). Spence (1981) considered the special case of a zero real interest rate and a constant static marginal cost, of the form ( ( ), ( ))c x t y t =
0( ( )) ( )c y t x tθ . Noting that / ( )d dt y yθ θ′= = ( )y xθ′ , Spence’s spe-
cial case reduces (2.3) to
0
( ( )) ( ( ))c y T R x tθ ′= . (2.4)
This is Spence’s well-known terminal marginal cost rule. The firm sets marginal revenue equal to the marginal cost that it will attain at the end of the planning horizon. As a re-sult, price and output remain constant over the life of the firm, even though current mar-ginal cost is falling. Current marginal cost consistently exceeds marginal revenue, although whether it also exceeds price at any point in time depends upon the elasticity of demand and the rate of learning.
The terminal marginal cost rule does not depend upon the precise form of the experience curve, but it is not robust to changes in the auxiliary assumptions. For example, if 0r > and the planning horizon is infinite, (2.3) becomes
( )0
( ( )) ( ( ))r s t
t
rc y s e ds R x tθ∞
− − ′=∫ , (2.5)
so that marginal revenue is set equal to the annuitized discounted present value of all the marginal costs that will prevail in the future. In this case, as ( )yθ is declining over time, marginal revenue declines monotonically along with current marginal cost.
When static marginal cost is not constant, the optimality condition cannot generally be

7
written in a way more informative than has already been given in (2.3). While it remains true that marginal revenue will be less than current marginal cost it turns out that mar-ginal revenue is not necessarily non-increasing over time: Cost-functions of the form ( ( ), ( ))c x t y t =
0( ( )) ( ( ))c h x t y tθ+ , with h an increasing convex function, induce monotonically
declining paths for marginal revenue; functions of the form ( ( ), ( ))c x t y t =
0( ( )) ( ( ))c h x t y tθ+ + yield monotonically increasing paths [Clarke, Darrough, and Heinecke
(1982); example 1 in Petrakis, Rasmusen and Roy (1997)]; other functional forms can yield non-monotonic paths.
In general, the firm’s strategy is not socially optimal. But the divergence between the so-cially and privately optimal output paths is a result only of the market power of the firm. To see this, let ( )p x denote the inverse demand function. Assuming the interest rate and discount rate coincide, the planner maximizes
( )
0 0
( ) ( ( ), ( ))x tT
rtW p v dv c x t y t e dt− = −
∫ ∫ , (2.6)
which yields the necessary condition
( )( ( )) ( ( )) ( ( ), ( ))T
r s tx y
t
c x t p x t c x s y s e ds− −= − ∫ . (2.7)
The solutions to (2.3) and (2.7) coincide if and only if ( ( )) ( ( ))R x t p x t′ = for all t, i.e. if the firm is a price-taker. If the firm has market power, its optimal strategy involves less output and slower learning than the social planner prefers. The static exercise of market power induces a monopolist to reduce output relative to the social optimum, thereby reducing the rate at which experience is accumulated. Deviations from the static optimum depend on the size of the gains from cost reductions. When the demand curve is downward sloping, part of the social gains accrue to consumers, and so the planner gains more from a cost reduction than does a monopolist. Thus, both static and dynamic considerations induce deviations of the same sign between privately and socially optimal behavior. Put another way, passive learning exacerbates the sub-optimality of monopoly output, but it does not create ineffi-ciency on its own.
2.2 Cost Functions and Price-Taking Behavior
The welfare consequences of passive learning clearly depend in large part on the question of whether price taking behavior can be sustained in equilibrium. The answer to this question in turn depends on the structure of marginal cost. Fudenberg and Tirole (1983) prove that a price-taking equilibrium does not exist when static marginal cost is constant, and this

8
induces them to study, inter alia, the sub-optimality of monopoly output. In contrast, Petrakis, Rasmusen and Roy (1997) show that price-taking equilibria can exist when static marginal cost is increasing. As one should expect from the discussion following equation (2.7), the equilibria they analyze are socially efficient.
The intuition behind these results is straightforward. When static marginal cost is constant, learning has much the same impact on price taking equilibria as does static increasing re-turns: it forces average cost below marginal cost and generates losses. For example, in Spence’s special case, (2.4), the optimality condition for a price taker is
0( ( ))c y T pθ = , but
average cost over the life of the firm is 10 0
( ( ))T
T c y s dsθ− ∫ 0
( ( ))c y Tθ> . Another way to think about the issue is to consider an arbitrary firm’s problem in a two-period setting where all firms are ex ante identical. A price taking equilibrium in period 2 requires a mass of atomistic firms producing with the same average cost and earning zero profit, which re-quires in turn that each firm had produced identical output in period 1. But this cannot be an equilibrium when static marginal cost is independent of scale. Any firm can choose to raise its output marginally in the first period by selling below cost; second period cost is then strictly less than its competitors and so it captures the entire market. In contrast, when static marginal cost rises sufficiently rapidly, average cost over the life of the firm is no longer above marginal cost. On the one hand, increasing output today lowers future marginal costs, but the price of doing so is to raise current marginal cost. When a firm is behaving optimally, its marginal cost is locally increasing. As a result, a firm with lower costs captures a greater share of, but not all, the market, and a price-taking equilibrium can be sustained.
2.3 Endogenous Heterogeneity
Passive learning can endogenously generate heterogeneous behavior among firms that are ex ante identical. Petrakis et al. (1997) show this in a deterministic two-period model with free entry and exit, which has three possible equilibria. In the first, all firms enter in period 1 and remain for the life of the industry. In the second, all firms enter in period 1, but some of them depart at the end of the first period. In the third, there is no exit at the end of the first period, and some firms enter only in period 2. There is no equilibrium that combines early exit and late entry. To see why this is the case, let ( ( ), ( ))c x t y t denote the cost func-tion, and assume that static average cost is ∪-shaped. Thus all firms that enter in period 1 face costs
1( , 0)
ic x in period 1 and
2 1( , )
i ic x x in period 2. Further, let min ( , 0)/
m xp c x x=
( , 0)/m m
c x x= denote the minimum average cost for a firm with zero experience. Free entry implies that price cannot exceed pm in either period, but it may be strictly less than this.
Consider first the equilibrium in which some firms exit after period 1, so that 1 m
p p= . Firms that exit early produce xm and earn zero profit in period 1. For this to be optimal,

9
the second period price can be no greater than 2 2 2
min ( , )/x m m
c x x x p< . As a result, an equilibrium with early exit requires a strictly falling price, which is incompatible with late entry. Firms that remain in the industry produce
1c mx x> in order to benefit from passive
learning; they consequently earn negative profit in the first period but recover this by earn-ing positive profit in the second.4 Thus, in an equilibrium with early exit, some firms ini-tially produce more than others and sell at a price below their current average cost; these firms survive while the smaller firms exit. If the second period price exceeds
2 2( , ) /
mc x x x ,
there is no early exit. In this case, either 2 2 2
( , ) /m m
c x x x p p< < , in which case there is no late entry, or
2 mp p= and some firms enter in period 2. Whenever there is late entry (and
sometimes when there is not), 2 1
p p> , so passive learning is compatible with rising prices.
2.4 Learning and Industry Concentration
Passive learning is generally associated with increasing industry concentration. This is im-mediately apparent in Petrakis et al.’s analysis of price-taking equilibrium. Absent learning, ex ante identical firms have equal market shares at every point in time. Learning can in-duce ex post heterogeneity and consequently may increase concentration. Increasing concen-tration under passive learning appears also to be a phenomenon of imperfectly competitive markets. Dasgupta and Stiglitz (1988) consider a duopoly with linear industry demand. They show that, even without allowing for strategic considerations, passive learning can amplify a small initial cost advantage for one of the firms, perhaps even to the point that the disadvantaged firm chooses to exit. These effects are most likely when firms are ap-proximately myopic and the rate of learning does not decline too rapidly as experience is accumulated. Cabral and Riordan (1994) explore the same question in a differentiated du-opoly model in which firms sell to a sequence of buyers with uncertain demands. They find that a sufficient condition for initial differences in the probability of securing the next sale to widen with the passage of time is that the discount rate be either very large or very small.
To abstract from strategic considerations (which will be considered in subsection 2.5), I show here how initial differences in costs influence the evolution of concentration in a monopolistically competitive industry. Time is continuous, there is a continuum of firms indexed by [0,1]i ∈ , industry revenues are set to unity, and the elasticity of substitution is denoted by 1σ > . Static marginal cost is constant and, following the notation of subsec-tion 2.1, satisfies ( ) ( ( ))
i i ic t c y tθ= with ( ( )) 0
iy tθ′ ≤ . For simplicity, I explore the conse-
4 The second-period costs of continuing firms must decline sufficiently as a result of producing
1c mx x> so that they can recover the first-period losses at a price satisfying
22 2 2min ( , 0)/x mp c x x x< .

10
quences of passive learning under the extreme cases of myopia and no discounting.
Consider first myopia. Using standard calculations, demands are given by
1 1
0
( )( ) ,
( )
ii
j
p tx t
p t dj
σ
σ
−
−=
∫ (2.8)
so the myopically optimal price is a constant markup over current marginal cost:
( ( ))
( ) .( 1)i
i
c y tp t
σ θθ
=−
Then firm i’s share of industry revenues is
( )( )
1
11
0
( ( ))( ) ,
( ( ))
i i
i
j j
c y ts t
c y t dj
σ
σ
θ
θ
−
−=
∫ (2.9)
the growth rate of which satisfies
( )
1 1
011
0
(1 ) ( ( )) ( ( )) ( )( ) (1 ) ( ( )) ( )
( ) ( ( )) ( ( ))
j j j ji i i
i i ij j
c y t y t x t djs t y t x t
s t y t c y t dj
σ σ
σ
σ θ θσ θθ θ
− −
−
′−′−= − ∫
∫
( )
2
111
0
( 1) ( ( ))( ),
( ( )) ( ( ))
i i
i i j j
y t ct
y t c y t dj
σ
σσ
σ θµ
θ θ
−
−+
′−= − −
∫ (2.10)
where ( ) 0tµ > is the loss of market share suffered by any firm as a result of learning by its competitors. As (0) 0
iy = for all i, (2.9) and (2.10) show that both market share and the
growth rate of market share are initially decreasing in .i
c As a result, concentration must initially increase, but whether it continues to do so forever depends upon the functional form of the learning curve. In particular, if learning stops after some finite accumulation of experience (i.e. ( ) 0yθ′ = for all *y y> ), then an early period of increasing concentration is followed by a period of decreasing concentration as initially disadvantaged firms catch up with the leaders.
Consider now the other extreme, where the discount rate is very small. In this case, too, passive learning is associated with greater concentration. To see this, assume a zero dis-count rate and a planning horizon of length T, so that Spence’s terminal marginal cost pric-ing rule, ( ( )) ( ( )),
i i ic y T R x tθ ′= applies. Firm i sets a constant price equal to
( ( ))/ ( 1)i i i
p c y Tσ θ σ= − and, noting that ( )i i
y T xT= under a constant pricing rule, de-

11
mands are
( )( )11
0
( ).
( )
i i
i
j j
c xTx
c x T dj
σ
σ
θ
θ
−
−=
∫ (2.11)
Differentiating (2.11) with respect to xi and ci, and evaluating at the symmetric equilib-rium, yields
( )
(1 )
1 1 1
0
( 1)
1 ( 1)
i
i j j i
dx cdc c dj xT
σ σ
σ σ θθ
σ θ
θ σ
− + −
− − ′
−= −
+ −∫. (2.12)
As long as ( 1) / 1i
x Tσ θ θ′− > − , which condition is necessary for concavity of the Hamilto-nian, equation (2.12) is negative. If there were no learning, (i.e. 0θ′ = ), then the direct impact on output is simply /
i idx dc = (1 )( 1)c σ σσ θ− + −− −
1 1 1
0/
j jc djσ σθ− −∫ , as is evident from
treating θ as a constant in (2.11). The term ( ) 11 ( 1) 1
ix T θ
θσ−
′+ − > is the learning multi-plier, showing that the increase in firm i’s output resulting from a decline in its initial cost is greater in the presence of learning. Moreover, the multiplier is larger with stronger learn-ing effects and a longer planning horizon.
2.5 Strategic Implications of Learning
Pricing and output decisions under passive learning with small numbers of firms are com-plicated by the potential for strategic behavior. As in the monopoly and price-taking set-tings, each firm continues to face a trade-off between current profits and investment in the form of overproduction to increase the rate of learning. But this trade-off is complicated by the fact that a firm’s current output level influences its competitors’ current and future output levels, the latter by altering the future structure of costs in the industry. Passive learning may also create motivations to overproduce with the intention of deterring poten-tial future entrants, and to induce exit through predatory pricing.
Dynamic oligopoly models quickly become intractable, so much of the analysis has been conducting in specialized settings. As a consequence, some of the findings reported in this subsection are unlikely to be especially robust to perturbations in the auxiliary assump-tions. Nonetheless, some results have been found to hold in several settings. First, there are a set of results that apply to industries with a fixed number of firms: passive learning in such markets appears to be pro-competitive, raising output above the level that would be attained absent learning; output may fall over time even in settings in which monopoly output would unambiguously rise; and learning can lower industry profits even though it reduces costs and raises economic welfare. A second set of results concerns strategic behav-

12
ior designed to deter entry and to force exit. In particular, passive learning induces aggres-sive pricing by incumbents to deter future entry, and it also creates a rationale for preda-tion.
• Fixed numbers of firms. Consider the two-period linear duopoly model developed by Fudenberg and Tirole (1983).5 Denote the two firms by A and B and denote their outputs in period 1,2i = by A
ix and .Bix Demand is 1 ( )A B
i i ip x x= − + , and each firm’s first-period unit cost is (0,1).c ∈ Second period unit cost is given by
2 1j jc c xλ= − , , .A Bj = In quan-
tity competition, the second period is a standard static Cournot, in which average cost is a decreasing function of first-period output. Hence second-period output is increasing in the speed of learning and in first-period output.
Let β denote the discount factor. The Nash equilibrium for first-period output is
1 2
(1 )(9 4 ),
27 4j c
xβλ
βλ− +
=−
(2.13)
which is strictly increasing in λ for all but myopic firms. Thus, passive learning is associ-ated with increased first-period output. It then follows that second-period costs are lower, and that second-period output is higher. This is, of course, equally true in the absence of strategic considerations. A more useful exercise, therefore, compares (2.13) with the output that would be attained in a precommitment equilibrium, which Fudenberg and Tirole define as an equilibrium in which firms ignore the consequences of dynamic changes in the cost structure on their competitor’s future output. First-period output under precommitment is
1 2
(1 )(3 ).
9j c
xβλ
βλ− +
=−
(2.14)
Although each firm ignores the effect of learning on its competitor’s future output in the precommitment equilibrium, it continues to behave strategically with respect to current output and it takes into account the effect of its own first-period output on its own future cost. The degree to which passive learning alters strategic behavior in duopoly can therefore be summarized by the ratio 1 1/j jx x , which equals one when 0λ = , and is strictly increasing in λ. Thus, strategic considerations i the presence of passive learning promote competition in the first-period and, by extension, in the second period as well. In fact, when the rate of learning is high and firms do not discount the future much, market performance is surpris-ingly good in the first-period: if one allows 2βλ to approach its upper limit of 3
4 ,6 and sets
5 The qualitative results here hold for n-firm oligopolies with equivalent auxiliary assumptions. 6 ‘Conventional’ comparative statics and stability require that 2 3
4βλ < .

13
the discount factor to unity, then the duopoly attains 3233 of the competitive output.7 The
second-period duopoly output remains at two-thirds the output level that would be at-tained under marginal cost pricing, although learning has of course reduced cost.8
It is a standard result that duopoly profits are inversely related to production costs. It is therefore somewhat surprising that, under a wide range of values for λ and β, passive learn-ing reduces discounted lifetime profits, 1 2( , ) .j j jv λ β π βπ= + In particular, if β is sufficiently large, then ( , )jv λ β is decreasing in λ for all admissible rates of learning.9 Profits are always increasing in λ in the precommitment equilibrium, so this surprising finding is clearly the competitive consequence of raising first-period output to influence the competitor’s future output. There is no reason to expect this result to be especially robust, but Spence (1981) reports that in his model rates of return are generally lower when learning is rapid.
With constant static marginal cost, output rises monotonically in monopoly. It does so also in the duopoly precommitment equilibrium, but not in the subgame perfect equilibrium characterized by (2.14). The strategic incentive to raise first-period output may be suffi-ciently strong that first-period output is higher than second-period output, even though costs have declined in the second period.
• Predation and Entry Deterrence. The preceding analysis admits unavoidable fixed costs, which are irrelevant to outcomes (although they affect whether the duopoly would have been created in the first place). When there are avoidable fixed costs, however, strategic interactions are further complicated by the possibility of exit. More specifically, avoidable fixed costs create a motive for predation in the presence of learning. Cabral and Riordan (1997) explore this with a simple extension of Fudenberg and Tirole’s two-period duopoly model.
Returning to our model, assume that firm A is committed to production in the second pe-riod, but firm B must pay a fixed cost, k, if it wishes to remain active. To ensure smooth-ness of the first-order conditions, assume that the fixed cost is stochastic with distribution and density functions Φ(k) and φ(k); its realization is observed at the end of the first pe-riod. If the realized fixed cost is sufficiently low, B remains active and payoffs in the second
7 Recall that in a static duopoly with linear demand and constant marginal cost, output is two-thirds of that attained in competition. This output level is attained when either λ=0 or β=0. 8 Spence (1981) obtains similar results for market performance, measured by the fraction of the maximum surplus archived, in his computational examination of a nonlinear oligopoly model. He reports performance rates of between 84 percent and 94 percent, and also finds performance is better the more rapid the learning rate. Interestingly, performance is not monotonically in-creasing in the number of firms. 9 For modest values of β, ( , )jv λ β first increases and then decreases with λ.

14
period are given by the duopoly profits
2
1 11 2
,3
j jjD
c x xλ λπ
− − + − = i= A, B. (2.15)
These payoffs are realized with probability ( )BD
πΦ . With probability ( )1 BD
π− Φ , firm B ex-its, leaving A to earn monopoly profits
2
11
.2
AAM
c xλπ
− + = (2.16)
Taking the possibility of exit into account, the first-period necessary condition for firm A is
( ) ( ) ( )( )1 1
1 1
1 2 1A A
A B B BD MD DA A
c x xx x
π πβ π π
∂ ∂ − − − + Φ + − Φ ∂ ∂
( ) ( )1
BB A ADD M DAx
πβφ π π π
∂= −
∂. (2.17)
The first term on the left hand side, when set to zero, is the usual static first-order condi-tion for Cournot duopoly. The second term reflects the influence of learning on firm A’s de-cision when the probability of B’s exit is taken as given. Under the restrictions on λ and β given in the previous subsection, the left-hand side is strictly decreasing in
1Ax . The term
on the right hand side captures the incentive learning creates for predation; from (2.15),
1/ 0B A
Dxπ∂ ∂ < , so this term is negative. Firm A is induced to increase output because doing
so reduces B’s profits under duopoly, and this increases the probability that B chooses to exit. Cabral and Riordan define the degree of predation as the difference between A’s out-put given by (2.17) and its output obtained after replacing the right hand side of (2.17) with zero. Noting that
1/ 2B A B
D Dxπ λ π∂ ∂ = − , predation is by this definition greater when
the learning effect is stronger. In the absence of passive learning the right hand side of (2.17) is identically zero, and there is no incentive to engage in predatory pricing.
The preceding discussion might lead one to suppose that a firm will set its first-period price lower when its competitor faces a risk of exit. But this is by no means certain, because the possibility of exit induces two responses, one of them countervailing, from firm B. The first-order condition for B is given by
( ) ( ) ( ){ }1 1
1
1 2 0B
B A B B BDD D DB
c x xx
πβ π φ π π
∂− − − + Φ + =
∂. (2.18)

15
On the one hand, the increase in profit that would correspond to a lower second-period cost is obtained only with probability Φ<1, which effect reduces B’s first-period output. On the other hand, reducing second period costs raises the probability of remaining in business by an amount that depends on φ. The term in braces is equal to unity when exit is not a pos-sibility, but may sum to more or less than one when exit is possible. Consequently, the pos-sibility of exit (and, more precisely, of avoiding exit by aggressive first-period pricing) may in fact raise B’s first-period output, which in turn would reduce A’s first-period output. This ambiguity is exacerbated when both firms face avoidable fixed costs.
It has previously been noted that in the presence of passive learning pricing below marginal cost does not constitute evidence of predation, and this creates difficulties for the imple-mentation of antitrust policy. But Cabral and Riordan have shown how passive learning creates an incentive for predation that would not otherwise exist. The lesson might be that predation is more likely with passive learning, but proving it in court will be more challeng-ing. But even if a plaintiff is successful in court, it is not clear what the appropriate remedy should be, because the welfare consequences of predation are ambiguous. Cabral and Riordan analyze the welfare consequences of prohibiting predation in their model. They find that consumer surplus may rise or fall when predation is outlawed. The intuition is straightforward. Predation reduces price in the first period, favoring consumers. In the sec-ond period, successful predation leads to monopoly pricing, which hurts consumers, but unit costs are lower than they would have been absent predation.
The principles behind entry deterrence are analogous to those behind predation. An incum-bent monopolist increases output with the aim of reducing future costs, thereby limiting entry [see, for example, Scherer (1980:250-252); Saunders (1985)]. Successful entry deter-rence is associated with the maintenance of monopoly pricing, but its implications for con-sumer welfare are again ambiguous because future costs are lower than they would be ab-sent the aggressive first-period pricing. However, as with much of the analysis in this sec-tion, one can develop market structures in which straightforward, intuitive, results do not hold. Hollis (2002) considers a two-period model in which firms learn at different rates, ei-ther because some firms are intrinsically better than others at learning or because some firms are further down a common progress curve. He shows that an incumbent firm with relatively little left to learn may be ambivalent about entry. While the incumbent would prefer no entry at all, it may prefer a lot of entry to a little: when there are just a few en-trants, each may be able to learn a sufficient amount to become an effective competitor in the second period; but when there are many entrants, none learns much and so none be-comes an effective competitor.

16
2.6 Alternative Specifications of Learning
So far, it has been assumed that passive learning is a product of a firm’s own experience; that experience is best measured by cumulative output, rather than by alternatives such as elapsed time or cumulative investment; that learning remains proprietary; and that the ef-fects of past experience are persistent. This subsection briefly considers some consequences of, and evidence in favor of, changing elements in this list of assumptions.
• Spillovers. Most of the work on the strategic implications of passive learning assumes that what is learned remains proprietary. Ghemawat and Spence (1985), Stokey (1986), and Lieberman (1987a) have shown that many implications of passive learning, including first-mover advantages, the raising of entry barriers, and excess concentration are muted at a rate that varies inversely with the degree of learning spillovers. Moreover, when spillovers are sufficiently strong to effectively eliminate the incentives to deviate from static optimum pricing and output levels, prices fall in lockstep with static marginal costs. It may seem somewhat paradoxical therefore that many models exploring the implications of passive learning for strategic trade policy in large economies assume purely external learning [e.g. Krugman (1987), Redding (1999)]. However, in these cases, the usual assumption is that there are effective barriers to international knowledge diffusion, thereby enabling national policymakers to engage in strategic behavior.
The evidence points to the presence of significant learning spillovers in a variety of indus-tries. Using survey data, Mansfield (1985) found that information about new processes and products in ten industries surveyed had widely diffused within a year. Spillovers have also been found in econometric studies: Irwin and Klenow (1994) find them in semiconductors; Thornton and Thompson (2001) in wartime shipbuilding; Lieberman (1989) in chemicals; Foster and Rosenzweig (1995) in the adoption of high-yielding seed varieties; and Conley and Udry (2007) in the adoption of best practices by Ghanaian pineapple farmers. How-ever, the reliability of evidence for spillovers is especially sensitive to problems of measure-ment error at the firm level. It is likely in many applications that firm-level experience is mismeasured, because cumulative output is measured with error or because it is only a proxy for a more appropriate but unobserved index of experience. The industry-wide ex-perience assumed to give rise to learning spillovers is typically measured by average or total industry cumulative output. By construction, this variable suffers less from measurement error than does firm-level experience. At the same time, it is positively correlated with firm-experience, not least because firms share correlated market conditions that influence output decisions. The result is that the coefficient on own-experience is attenuated, while the con-

17
tribution to a firm’s productivity of industry-wide experience is overstated.10
• Learning as a function of cumulated investment. The earliest macroeconomic models of passive learning -- Arrow (1962), Levhari (1966), and Sheshinski (1967b) -- associated learning with cumulative investment rather than cumulative output. Sheshinski (1967a) observed that this is a plausible assumption because new investment changes the produc-tion environment and provides a stimulus for renewed learning. A similar argument was made much later by Mishina (1999), whose detailed study of the wartime production of the B17 heavy bomber led him to conclude that learning arose out of the new experiences af-forded by scaling up plant capacity. It also seems reasonable to suppose that many of the consequences of passive learning would be robust to switching the engine of growth from output to investment: the excess of output over static optimum levels induced by passive learning is in fact often interpreted as a form of investment.
Nonetheless, linking learning to investment has received scant attention from microeco-nomic theorists.11 One can conjecture why. First, by the time industrial organization theo-rists were beginning to turn their attention to passive learning in the early 1980s, there al-ready existed a sizeable literature on the use of physical capacity as a strategic device, no-tably to deter entry but also to pre-empt existing rivals [Wenders (1971), Spence (1977), Salop (1979), and others; see Lieberman (1987b) for a concise review]. Second, it quickly emerged that the implications of strategic investment was, like passive learning, sensitive to auxiliary assumptions. For example, in a linear model it is not in the interests of an incum-bent to invest in excess capacity following entry [Dixit (1980)], so investment in excess ca-pacity prior to entry does not constitute a credible threat to potential entrants. However, this result can be reversed with an appropriately nonlinear demand curve [Bulow, Geana-koplos, and Klemperer (1985)]. Third, the empirical challenges involved in separating the learning effects of investment from scale economies in capacity expansion, or from vintage capital effects, must have seemed quite daunting.12
10 Tambe and Hitt (2007) have tackled a similar problem involved in the measurement of knowl-edge spillovers resulting from investments in information technology. They obtained two distinct measures of IT capital, and argued that the measurement error in each is likely to be uncorrelated; this allowed one measure to serve as an instrument for the other. This approach to the measurement error problem in passive learning spillovers has not yet been attempted, probably because of the difficulty in identifying plausible candidate instruments. 11 One notable exception is Jovanovic and Lach (1989). Their paper also studies the effects of spillovers, but does so in a non-strategic setting. 12 One identification strategy is to contrast the effects of capacity contractions on productivity: scale economies in capital would be associated with a decline in productivity, while learning would not. Assuming capacity reductions are accomplished by retiring the oldest machines, vin-

18
• Learning as a function of time. If learning is a function of the passage of time spent pro-ducing, most of the strategic consequences of passive learning discussed earlier vanish. The intuition is straightforward: deviations of output from static optimization do not increase the rate of learning, so while the cost structure in the industry evolves over time this is, from the perspective of firms, an intrinsically exogenous process. There is, however, one notable exception: learning as a function of elapsed time continues to create first-mover advantages, and motivates early entry in oligopolies.
The evidence does not favor elapsed time over cumulative output or investment [Argote (1993, p. 41)]. Investigating this is in principle as simple a matter as assessing the coeffi-cients in the regression ln ln lnx a b y c t ε= + + + . Collinearity produces imprecise results for the samples typically available in early studies. Panel data can expand the effective sample size, although it does so at the cost of constraining key parameters to be equal across units. Rapping (1965) exploits the panel structure of fifteen shipyards engaged in the wartime construction of Liberty ships to assess the relative contributions of cumulative output and elapsed time on the current rate of output. Rapping allows for yard-specific level effects, but assumes the slope coefficients are equal across yards. His best-fit regression produces a coefficient of 0.26 on cumulative output and −0.03 on elapsed time, clearly fa-voring the conventional formulation of the progress curve.13
However, a caution is again in order. When rates of progress differ across units, panel tech-niques can provide spurious evidence in favor of the conventional formulation.14 For exam-ple, if firm progress depends on elapsed time, but the rate of progress is different for each firm, a panel estimator that imposes the same coefficient on time for each firm but also in-cludes cumulative output invariably indicates a significant impact of cumulative output. The reason is, much as in the well-known problem of confounding unobserved heterogeneity and contagion effects, cumulative output contains information about a firm’s type.15
• Forgetting. A sequence of papers by Linda Argote, Dennis Epple, and colleagues [Argote, Beckman and Epple (1990), Epple, Argote and Devadas (1991), Darr, Argote and Epple
tage capital effects would induce a rise in productivity Unfortunately, capital specificity ensures that significant declines in plant capacity are infrequent in most datasets. 13 Although Rapping’s findings are consistent with the majority of the literature, there are ex-ceptions. Levin (2000), for example, concluded that time spent producing automobiles is a bet-ter predictor of reliability than is cumulative output. 14 Thompson (2007, Table A.1) shows that rates of progress varied widely across the Liberty shipyards. 15 Concern with the confounding problem has an especially long history in count data, beginning with Greenwood and Yule (1920). A recent and important application to learning can be found in Wilcox (2006).
19
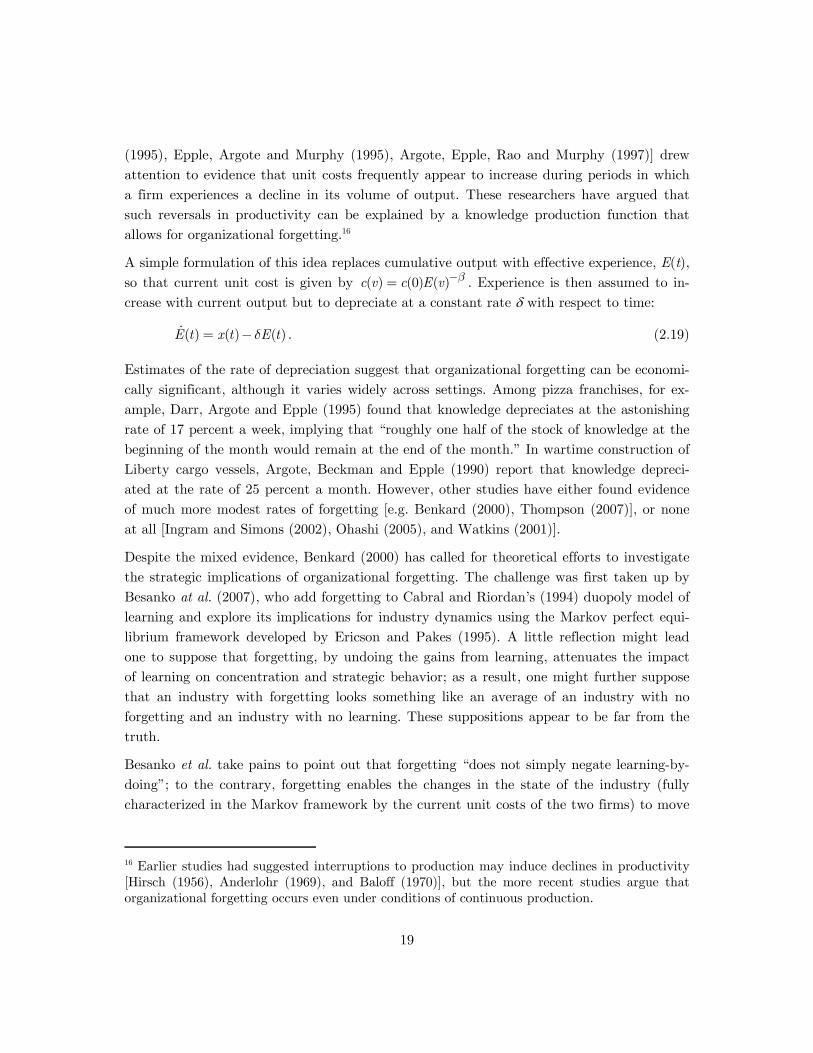
(1995), Epple, Argote and Murphy (1995), Argote, Epple, Rao and Murphy (1997)] drew attention to evidence that unit costs frequently appear to increase during periods in which a firm experiences a decline in its volume of output. These researchers have argued that such reversals in productivity can be explained by a knowledge production function that allows for organizational forgetting.16
A simple formulation of this idea replaces cumulative output with effective experience, E(t), so that current unit cost is given by ( ) (0) ( )c v c E v β−= . Experience is then assumed to in-crease with current output but to depreciate at a constant rate δ with respect to time:
( ) ( ) ( )E t x t E tδ= − . (2.19)
Estimates of the rate of depreciation suggest that organizational forgetting can be economi-cally significant, although it varies widely across settings. Among pizza franchises, for ex-ample, Darr, Argote and Epple (1995) found that knowledge depreciates at the astonishing rate of 17 percent a week, implying that “roughly one half of the stock of knowledge at the beginning of the month would remain at the end of the month.” In wartime construction of Liberty cargo vessels, Argote, Beckman and Epple (1990) report that knowledge depreci-ated at the rate of 25 percent a month. However, other studies have either found evidence of much more modest rates of forgetting [e.g. Benkard (2000), Thompson (2007)], or none at all [Ingram and Simons (2002), Ohashi (2005), and Watkins (2001)].
Despite the mixed evidence, Benkard (2000) has called for theoretical efforts to investigate the strategic implications of organizational forgetting. The challenge was first taken up by Besanko at al. (2007), who add forgetting to Cabral and Riordan’s (1994) duopoly model of learning and explore its implications for industry dynamics using the Markov perfect equi-librium framework developed by Ericson and Pakes (1995). A little reflection might lead one to suppose that forgetting, by undoing the gains from learning, attenuates the impact of learning on concentration and strategic behavior; as a result, one might further suppose that an industry with forgetting looks something like an average of an industry with no forgetting and an industry with no learning. These suppositions appear to be far from the truth.
Besanko et al. take pains to point out that forgetting “does not simply negate learning-by-doing”; to the contrary, forgetting enables the changes in the state of the industry (fully characterized in the Markov framework by the current unit costs of the two firms) to move
16 Earlier studies had suggested interruptions to production may induce declines in productivity [Hirsch (1956), Anderlohr (1969), and Baloff (1970)], but the more recent studies argue that organizational forgetting occurs even under conditions of continuous production.

20
forwards and backwards through the state space. The main consequence of this is that there may be multiple sunspot equilibria – as many as nine for some parameter configura-tions – even though Cabral and Riordan (1994) had already established uniqueness in the absence of forgetting. When there is no forgetting, it is inevitable that firms that do not exit eventually attain their terminal productivity, and this defined endpoint pins down a unique equilibrium path. At the other extreme, with an extremely high rate of forgetting, there can be little departure from initial costs, yielding a unique stationary equilibrium similar to that obtained in a duopoly without learning. But for intermediate rates of forget-ting – especially rates similar to the rate of learning, multiple equilibria can be sustained by rational beliefs that different points on the learning curve can be sustained in the long-run. For example, if both firms believe that the long-run equilibrium involves two producers with little decline in costs, they have little incentive to price aggressively; as a result little net learning takes place and the beliefs are fulfilled in equilibrium. On the other hand, if both firms believe that the long-run equilibrium involves a single firm with low cost, both firms will induce this outcome by pricing aggressively in an attempt to be the surviving firm. In the latter case, Besanko et al. note, firms will price more aggressively in the pres-ence of forgetting than in its absence.
3. Empirical Evidence The empirical literature on firm progress curves is distressingly large, consisting of literally thousands of reported progress curves in widely different industrial settings.17 Much of this literature consists of somewhat naïve studies consisting of simple least squares regressions of output or productivity on cumulative output or time, most often assuming a log-linear functional form. The naïve studies, because of their ubiquity, have shown us that the pro-gress curve is a widespread phenomenon. They also reveal that rates of progress vary dra-matically across industries and firms, across products within firms, and even across differ-ent production runs of the same product within a firm (see Figure 3-1).
The estimation of progress curves induces a number of statistical problems that are in prac-tice difficult to overcome. Prominent among them is the fact that progress curves relate two non-stationary variables, so the explanatory power of OLS regressions are inevitably high. Even so, out-of-sample predictions are often wide of the mark [Alchian, (1963 [1950]), Hirsch (1952, 1956), Conway and Schultz (1959)], so estimated progress ratios are unreli-able as a management planning tool. High coefficients of determination (in conjunction
17 Asher (1956) provides a detailed review of the earliest work on airframe production. Between them, Yelle (1979), Argote and Epple (1990), Dutton and Thomas (1994), and Dar-El (2000: ch. 8) provide extensive references on subsequent literature.

21
with an absence of guiding theory) also encouraged many researchers to express satisfaction with the appropriateness of the power rule specification. There are of course studies in which alternative specifications were considered, but these alternatives are usually non-nested. The resulting horse race between models, especially for short samples in which a terminal productivity had not been attained by the end of the sample period, is conse-quently reduced to a comparison of coefficients of determination that differ by margins of no real economic or statistical significance.18
The persistence of the power rule is all the more surprising in view of repeated evidence that after sufficient passage of time the rate of progress declines markedly, often to zero. Figures 3-2 and 3-3, which replicate plots from Searle (1945) from Conway and Schultz (1959), provide two neat early illustrations. In Conway and Schultz’s paper, in fact, six out of ten plots revealed compelling evidence that a terminal productivity had been attained and progress had stopped altogether. This study was one among several that led Baloff. (1966) to assert that although the power rule curve may describe the startup phase in manufacturing, it does not describe a subsequent steady-state phase.
18 Feller (1940) pointed out long ago that it is difficult to discriminate between alternative growth functions.
FIGURE 3-1. Distribution of 162 estimated progress ratios reported in 24 studies. Source: Dutton and Thomas (1984, Figure 1). Let y be cumulative output, and c(y) the current unit cost. The progress ratio is given by c(2y)/c(y). Ιn the power rule specification, c=ay−b, the progress ratio is 2−b.

22
There is little reason to detain ourselves with further discussion of the early empirical lit-erature, and the remainder of this section provides a selective review of the more recent empirical literature. Subsection 3.1 reviews attempts to measure learning in large, plant-level, datasets. Subsection 3.2 briefly discusses empirical studies of individual learning (by doing). Finally, subsection 3.3 reviews small-sample evidence from detailed case studies
FIGURE 3-2. Progress curves for U.S. wartime shipbuilding. Source: Searle (1945, Chart 1).
FIGURE 3-3. A progress curve for final assembly of a large electro-mechanical product. Source: Conway and Schultz (1959, Figure 9).

23
that shed some further light on the role of passive learning, and on the difficulties involved in measuring the importance of passive learning in large samples.
3.1 Large Sample Evidence
Since confidential establishment data became available to researchers in the 1980s, a large body of evidence has accumulated showing that a firm’s size increases with its age. New plants tend to be smaller than incumbent plants, but surviving plants grow most rapidly when young. In one of the best-known studies, Dunne, Roberts and Samuelson (1989) re-port that among 208,000 US manufacturing plants that survived any given five-year period of observation, annual employment growth rates averaged 7.6 percent for plants under five years of age, 3.7 percent for plants aged six to ten years, and 2.9 percent for plants eleven to fifteen years of age. Comparable age effects have been observed in other multi-industry samples constructed from census data [Disney, Haskel and Heden (2000); Baldwin et al. (2000); Persson (2002)] in Dun and Bradstreet data [Evans (1987a, 1987b)], Compustat data [Hall (1987)], and numerous specialized samples [e.g. Audretsch (1991); Audretsch and Mahmood (1995); Baldwin and Gorecki (1991), Mata and Portugal (1994); Wagner (1994)].
Although these findings have often been attributed to learning in young plants,19 evidence for passive learning based on firm size is of limited value because the relationship between plant size and productivity is quite tenuous. For example, Baily, Hulten and Campbell (1992) conclude that across 23 US manufacturing industries, productivity is in fact margin-ally lower in older plants than in younger plants. Bartelsman and Dhrymes (1998) restrict attention to the productivity rankings of plants in a large sample drawn from three US high-technology sectors. They also find that average productivity in young plants is mar-ginally higher than in older plants. Similarly, Jensen, McGuckin and Stiroh (2001) report that average labor productivity in their sample of manufacturing plants does not vary with age in any systematic fashion.
One candidate explanation for this disparity in the effects of age on size and productivity is that productivity data confound the effects of capital vintage and firm progress. On the one hand, new firms typically invest in technology of recent vintage, which raises their produc-tivity relative to incumbents. Countervailing this vintage effect, older firms may have moved further down their progress curve. Jensen et al. (2001) conclude that these two ef-fects have more or less the same magnitude in the Longitudinal Research Database (LRD). For example, the 1992 cohort of entering plants in US manufacturing was 51 percent more productive than the 1967 cohort had been when they entered; but the surviving plants in
19 Dunne, Roberts and Samuelson, for example, motivate their empirical analysis by appeal to Jovanovic’s (1982) model of learning and selection (reviewed in section 4.2).

24
the 1967 cohort had by 1992 experienced an average productivity gain of 57 percent. Simi-lar results hold for other entering years, so that in 1992 all cohorts of surviving firms had average productivity within seven percent of the industry mean.20
Identifying age and vintage effects is not trivial. It is well known [cf. Hall (1971)] that pro-ductivity and output regressions with a full set of vintage and age effects cannot be identi-fied along with a full set of time effects intended to capture industry-wide factors. Jensen et al. resolved this problem by assuming that time effects can be measured by industry-wide variables such as average labor productivity and total output; these are imperfectly corre-lated with time, which is then dropped from the regressions. Bahk and Gort (1993) also use the LRD to separate vintage and learning effects, but they adopt a different identification strategy. For each year of a plant’s life they construct the current average vintage of capi-tal out of its investment history. Doing so breaks the collinearity between vintage, time and age, especially among older plants, allowing Bahk and Gort to capture industry-wide effects with a time trend. Bahk and Gort found that plant age accounted for output growth among young plants equivalent to about one percent per year; this was somewhat less than half the estimated contribution of embodied technical change of physical capital.21
Jensen et al. are careful to note that their finding of significant age effects among surviving plants may be due to a number of reasons, including scale economies gained from expansion over time, equipment investment, selection effects, and of course passive learning. Bahk and Gort are rather more willing to identify age effects directly with passive learning, and they go further than others in attempting to decompose its sources. To do so, they estimate a production relation of the form
ln ln ln lnK L wi i i i i
y K L wτ τ τ τ τ τ τ τ τβ β β β ε= + + + + (3.1)
on repeated cross-sections of plants of the same age. In (3.1), yiτ is output of plant i at age τ, Kiτ is vintage-adjusted capital, Liτ is labor, and wiτ is the average wage, intended to measure general human capital. Bahk and Gort assert that passive learning can be inferred from increases over time in the estimated elasticities. They distinguish three potential sources of learning: manual or task learning accomplished by workers, learning how to use
20 This should not be a surprising equilibrium outcome. If vintage effects dominated learning effects, there would be few surviving firms from early cohorts; if learning effects dominated, there would be few late entrants. 21 Power (1998) develops this approach further by looking at productivity responses to spikes in investment. She finds a positive effect on productivity of plant age after controlling for invest-ment spikes, but no effect of time that has elapsed since an investment spike.

25
capital, and organizational learning that raises the productivity of employees by improving, inter alia, the match between worker skills and task requirements [cf. Prescott and Visscher (1980)]. Plant level data does not allow manual learning to be distinguished from increases in human capital associated with changes in the composition of workers as a plant ages, so Bahk and Gort focus on learning how to use capital, measured by changes in K
τβ , and or-ganizational learning, measured by changes in L
τβ and wτβ . Figure 3-4 summarizes the re-
sults of their decomposition, which despite the strong identifying assumptions met with only limited success. They found no evidence of organizational learning, both indicators of which first exhibited declines before rising modestly. In contrast, the elasticity of output with respect to physical capital rose markedly. Even for capital, though, “learning” appears to have been completed after four or five years. Moreover, as Bahk and Gort note, most of this apparent learning probably arises from the fact that capital goods are not initially fully installed and operational.
Studies using large samples have provided extensive evidence on the effects of plant and firm age on size and growth. But because of the tenuous link between age and productivity, these studies provide at best indirect evidence that passive learning may be taking place. Relatively few large sample studies directly measure productivity dynamics, and even fewer have attempted to measure the importance of passive learning. One challenge for large-sample studies is that researchers are really only able to measure movement along a firm’s progress curve; they invariably lack the detailed data necessary to understand how much of this progress is driven by passive learning and how much is due to unmeasured factors. Un-
Figure 3-4. Decomposition of passive learning, Bahk and Gort (1993, table 4). All coefficients normalized to indexes relative to their means over the ten cross sections. Coefficients on L and w in column form. The line plots coefficients on K, with shaded 95% confidence interval.
-0.5
0
0.5
1
1.5
2
1 2 3 4 5 6 7 8 9 10
L w K

26
able to measure passive learning directly, these studies are also unable to shed much light on whether passive learning is short-lived and bounded.
3.2 Individual Learning by Doing
One possible way out of this impasse is to focus on special cases in which the context leads us to believe that progress is almost certainly dominated by passive learning. Unfortu-nately, these are almost invariably cases in which individual learning by doing is the focus of the study. Jovanovic and Nyarko (1995) collected together a number of datasets on learning by doing in commercial settings. Figure 3-5, which plots the productivity of new line-workers at a British munitions factory operating during World War I, illustrates the typical result that productivity quickly attains an upper bound (in this case within four to five weeks after initiating employment). Similar results have been obtained in studies of learning by doing among surgeons,22 and in experimental settings [e.g., Mazur and Hastie (1978)].
For our purposes, however, studies of learning by doing have two limitations. The first is that the firm or plant can do better than the average performance of individuals because it
22 See Waldman, Yourstone, and Smith (2003) for citations to a small fraction of this extensive literature.
40
50
60
70
80
90
100
110
0 5 10 15 20 25 30
Inde
x of
hou
rly o
utpu
t .
Cumulative worker output
Figure 3-5. Average worker productivity (index) of new workers on four tasks at a munitions factory, plotted against average cumulative output per worker. Observations are recorded weekly, at the points indicated by circles. Source data: Jovanovic and Nyarko (1995, table A-4).

27
can exploit variations in individual learning rates to reallocate workers to the most appro-priate tasks [cf. Prescott and Visscher (1980)]. This process may also be drawn out beyond the period in which individuals learn as the firm dismisses workers that have failed to learn and hires replacements who have yet to demonstrate their ability to learn. Second, in many of the settings examined learning is bounded by construction, so their findings about termi-nal productivities cannot readily generalize to other settings. This is especially true of medical applications, where the post-surgery complication rate or survival rate is the most common measure of performance.
3.3 Case Study Evidence
A second approach that avoids the limitations of studies based on large sample evidence involves case studies, typically of individual plants. Such case studies are potential sources of the detailed information that is missing from large-sample studies and that might pro-vide rich insights into the sources of a firm’s movement along the progress curve. Case studies become necessary here because the construction of data on these omitted sources of growth is extremely time-consuming. In this subsection, I describe two case studies in some detail; they are interesting in their own right, but they also illustrate two useful points. First, case studies frequently suggest that large sample studies are likely to mislead because much of what might be construed as passive learning is in fact the result of a variety of sometimes complex forces. Second, as will become equally evident, the very complexity of the forces identified in these case studies, while qualitatively revealing about the sources of growth, often make it difficult to measure the contribution of passive learning.
• Omitted Variables. The most obvious danger of large-samples studies, of course, is that measures of experience are correlated with variables known to be associated with rising la-bor productivity but that are simply not available. Their omission inevitably leads us to overstate the importance of passive learning [cf. Rosenberg (1976)].23 For example, Thomp-son (2001) points out that earlier studies of the Liberty shipbuilding program, which did not have access to data on the capital stock, constructed a crude proxy for capital that was essentially constant over time. The inaccuracy of this proxy is dramatically illustrated by the photographs in Figure 3-6. Thompson recovered capital stock data from the National Archives for six of the thirteen Liberty shipyards and concluded that, for these yards, at least half of the increase in output per worker was accounted for by capital deepening.24 In
23 In much the same way as Abramowitz (1956, p. 10) urged caution in interpreting the Solow residual, strong measured passive learning effects may in fact be a measure of our ignorance. 24 Bell and Scott-Kemmis (1990), Thompson (2001), and Thornton and Thompson (2001) cata-log further omitted variables for which data are still unavailable.

28
FIGURE 3-6. Top: The first Liberty ship keel being laid at Todd-Houston, May 1942. Because of the urgent need for rapid delivery, production of vessels began long before the yard was completed and all capital installed. Bottom: A fully operational shipyard, two years later. Source: Lane (1951). Originals in Records of the Historian’s Office, Records of the US Maritime Commission, RG178, National Archives.

29
a similar vein, Mishina (1999) undertook a closer look at Alchian’s sample of aircraft facto-ries, concluding that, inter alia, capital investments were a significant source of labor pro-ductivity growth in the production of the flying fortress bomber.
A particularly interesting case study by Sinclair, Klepper and Cohen (2000) is revealing about the efforts sometimes needed to construct the necessary data. They investigated the sources of cost reductions for specialty chemicals manufactured by a Fortune 500 company. The company produced over one thousand different chemicals, but only a few batches of many of these were produced during their thirty-month sampling period. Thus, their analy-sis focused on cost reductions for 99 chemicals that were each produced in at least ten batches during the sample period. For these chemicals, Sinclair et al. had privileged access to a wealth of information, including batch-specific manufacturing costs and output, and (most remarkably) chemical-specific R&D expenditures. Equally important, they had access to personnel and to company records from which they were able to develop a sophisticated understanding of the firm’s operational practices.
Sinclair et al. began by estimating a learning curve of the form j iju
ij ij ijc y t e
βγα −−= , where cij is the unit manufacturing cost for the ith batch of chemical j, yij is the quantity produced in batch ij, and experience, tij, is measured by the time elapsed since the chemical was first produced. Column (1) of Table 3-1 reports the distribution of estimates, ˆ
jβ , for the 99
learning parameters. The average is 0.48 but the range is wide, with as many as one third of the estimates indicating declining productivity. Sinclair et al. were able to identify four mutually exclusive groups of chemicals: seven chemicals that were “campaigned”,25 thirteen that were affected by a project to reduce the frequency with which chemicals were sampled during the production process,26 25 that were the subject of formal R&D efforts, and a re-sidual 59 chemicals that did not fall into any of these categories. Columns (2)-(5) summa-rize the distributions of estimated learning rates for each of these groups. The contrast be-tween the first three groups and the residual group is quite remarkable: the learning rates for the seven campaigned chemicals are all in the upper tail of the distribution, with an average ˆ
jβ of 1.4 percent; almost all the chemicals in the two groups that were affected by
R&D returned positive values for ˆj
β , with averages exceeding 1.0. In contrast, the ˆj
β in
25 During the sample period, a large-volume product was launched that required the largest re-actor. Seven chemicals were as a result displaced to smaller reactors. In order to minimize the effect on costs, each of these chemicals were produced in consecutive batches in the same reactor so that, inter alia, the small reactors would not need cleaning between batches. As a result, af-ter controlling for the change in batch size, unit costs fell as a result of the displacement. 26 A team was formed to study for each chemical which stages of the production process always seemed to run smoothly, and therefore did not need sampling. Thirteen products saw the num-ber of samples reduced, and as a result registered sharp reductions in sampling costs.

30
the residual group are centered on zero, with an average of −0.1.
Sinclair et al. made use of data not usually available to outside researchers to establish the dominant role of R&D in cost reduction. Chemicals that were not the subject of R&D effort experienced on average no cost reduction. It is of course possible that production experience revealed which chemicals had problems that might be addressed by R&D. But, Sinclair et al. noted, requests for process R&D on a particular chemical came from only two sources, neither of which were informed by production experience. The first was in response to an inability to meet industry specifications for the chemical. The second, and more common, source was marketing and sales, which requested R&D after it identified a large potential demand if production could be scaled up and units costs reduced. Finally, Sinclair et al. observed that if expected future demand conditions R&D expenditure and future demand is correlated with past demand, then past cumulative output will be negatively correlated with cost if data are not available to control adequately for costly R&D effort.
TABLE 3-1. Distribution of OLS Estimates of Learning Parameter for 99 Specialty
Chemicals
(1) (2) (3) (4) (5)
RANGE
ALL 99
PRODUCTS
7
CAMPAIGNED
PRODUCTS
13 AFFECTED
BY SAMPLING
REDUCTION
25 PRODUCTS
SUBJECT TO
R&D
REMAINING
59 PROD-
UCTS
β̂ < −1.4
−1.4 < β̂ < −1.0
−1.0 < β̂ < −0.6
−0.6 < β̂ < −0.2
−0.2 < β̂ < 0.2
0.2 < β̂ < 0.6
0.6 < β̂ < 1.0
1.0 < β̂ < 1.4
1.4 < β̂
4
5
2
13
14
21
11
10
19
0
0
0
0
0
0
2
2
3
0
0
0
0
1
4
0
4
4
0
0
0
2
1
5
5
3
9
4
5
2
11
12
12
4
1
3
MEAN 0.48 1.41 1.04 1.20 −0.11
Source: Sinclair, Klepper, and Cohen (2000: Table 1).

31
• Institutional Complexities: The Upper Weave Room of Lawrence Company Mill No. 2, Lowell, Mass. David (1973) documents an apparently clean example of passive learning in the Lawrence Manufacturing Company Mill No. 2, an integrated textile mills established in Lowell, Mass., in 1834. David is careful to show that there was essentially no capital in-vestment during twenty years that followed the founding of the mill. In particular, every loom that had been installed in 1834 was still in operation in 1856. Nonetheless, output per worker rose by an average two percent per year during this period. Recalling the Horndal Steel mill brought to economists’ attention by Arrow (1962), David concluded that
the evidence . . . provides sufficient cause for American historians to insist that Horn-
dal share with Lowell the honor . . . in giving his name to the productivity effects of
learning by doing in the context of a fixed industrial facility.
[David (1973, p. 142)].
The data available to David [from McGouldrick (1968)] consisted of plant level data on annual unit production costs. Using much more detailed records that survive in the Baker Library at Harvard, Lazonick and Brush (1985) also document a marked rise in output per worker. However, they reach more nuanced conclusions about its cause, in which passive learning plays only a modest role.
Lazonick and Brush’s conclusions are driven by two significant changes in the composition of the mill’s labor force between the late 1830s and the late 1850s. In the 1830s the labor force in the mill consisted primarily of “Yankee farm girls”, who lived in boarding houses under paternalistic contractual arrangements with the mill. The farm girls were literate, but two characteristics limited their productivity. First, they tended to have little experi-ence, it being the norm to abandon work in the mills upon marriage. Second, they fre-quently did not work in the mills during the summer, either returning to the farm to help during a busy time of year or taking summer teaching jobs.27 Both characteristics limited the extent to which the farm girls could learn from experience. But they also limited the extent to which the mill’s managers could extract effort from them. If work at the mill be-came too onerous, most employees had the option of returning to the farm.28
In the late 1830s the supply of farm girls began to fall behind demand. The number of mills in Lowell doubled between 1835 and 1847. At the same time the New England farming
27 In 1839-40, 93 percent of summer teaching jobs in Massachusetts were held by women, com-pared with only 33 percent during the winter months. 28 One could frame the language in terms of exploitation of labor or, more palatably for econo-mists, in terms of the effect of the value of the outside option on equilibrium effort [e.g. Shapiro and Stiglitz (1984)].

32
population was declining, both as a proportion of the labor force and in absolute numbers. Offsetting these changes, the population of Lowell rose markedly, primarily due to an influx of native-born families. The changing labor force, which remained predominantly female, created a more experienced labor force, thereby raising productivity.29 However, Lazonick and Brush argue, managers remained constrained in their ability to extract greater effort, because native-born male heads of household were generally able to earn sufficient wages to support a family, and female workers continued to abandon the mills upon marriage.
In the mid-1840s a second transformation of the labor force began, with an influx to New England of mostly Irish-born immigrants. The immigrants were mostly illiterate, and ini-tially inexperienced in textiles. However, they had fewer outside options available to them. Irish heads of households could not earn a subsistence wage alone, and were unable to ob-ject to changes in work rules that intensified their work effort. Moreover, the existence of a “reserve army” of Irish workers made it increasingly difficult for native-born employees to resist intensification of effort, and rapidly forced them out of the mills. As a result the frac-tion of the labor force in mill No. 2 that were not Irish declined from about 93 percent in 1845, to only 35 percent a decade later.
Thus, Lazonick and Brush argue, increases in output per worker were the result of two dis-tinct processes. The first, until the mid 1840s, was primarily due to individual learning by doing. However, it required a compositional change of the labor force that raised the aver-age experience level of the workforce for this individual learning to translate into rising productivity at the plant level. The second process was an increase in the intensification of effort made possible by the second demographic change in Lowell. Lazonick and Brush note two especially important pieces of evidence for their story. First, despite continuously rising labor productivity, real wages rose only until the mid-1840s. After that date, until the end of the sample period, they fell markedly. Second, a direct intensification of work effort is observed in what has been termed the “stretch-out” at Lowell. Between 1835 and 1842, most weavers were assigned two looms. In 1842, however, the number was raised to three, and in 1851 to four. The number of overseers in the mill, charged both with supervising the workers and intervening when there were problems with the machines, did not fall. As a result, effective monitoring of work effort increased.
Lazonick and Brush attempt to decompose the contributions to plant productivity of, inter alia, individual learning and effort intensification. The variables underlying these two con-
29 Lazonick and Brush do not report the trend in experience. However, evidence is available in Bessen (2003, Figure 1), which shows that the fraction of new hires at Lawrence Mill No. 2 who had previous experience in other mills rose from around ten percent when the mill was opened, to around fifty percent in the mid 1840s.

33
tributions are not independent, so only a range could be provided. They concluded that between four and fourteen percent of the variance of productivity can be explained by learning effects, while between eleven and 23 percent can be explained by effort intensifica-tion effects. Thus, they concluded,
[the] results suggest that the production-relations hypothesis should be given at least
as much attention as the learning by doing hypothesis in research into the ‘Horndal
effect’. There is more to the process of labor productivity growth than the technical
development of inputs. Social influences on productivity growth must be considered as
well.
[Lazonick and Brush (1985, p. 83)]
The story does not end quite here. Bessen (2003) revisited learning at Mill No. 2 yet again:
Lazonick and Brush do not attempt to develop a complete picture of employers’ moti-
vations for these changes [in effort requirements] . . . Employers could have hired al-
legedly docile Irish and ‘low class’ girls during the early decades, but did not. . . .
More significantly . . . the timing of this story is off.
[Lazonick and Brush (1985, p. 83)]
Bessen notes that the stretch-out from two to three looms per weaver occurred in 1842, be-fore the influx of Irish immigrants had taken on significant proportions, but after the arri-val in Lowell of significant numbers of native-born permanent residents. Bessen argues that the decision to stretch out the workers must have been driven by the greater work experi-ence of the Yankee permanent residents. To support this claim, Bessen shows that workers assigned to just two looms learned more quickly than those assigned to three or four, al-though the latter eventually became more productive. Initial productivity for those working on two looms was about 25 percent of terminal productivity, and it took about six months to attain terminal productivity. For those working on three or four looms, initial productiv-ity was less than twenty percent of terminal productivity, which took a year to attain. The profitability of the stretch-out therefore depended upon the labor turnover rate: workers must have been expected to remain in the job long enough to recoup the greater initial in-vestment in human capital associated with assignment to more than two looms. Bessen cal-culates the profitability of the stretch-out directly as a function of the turnover rate: it was profitable in 1842, he concludes, but not in 1834.
Both studies agree that the transition from Yankee farm girls to Yankee permanent resi-dents raised productivity because it increased average work experience in a setting in which LBD was important. Bessen continues this explanation into the second demographic trans-formation, while Lazonick and Brush turn to an explanation based on effort intensification.

34
The timing of the first stretch-out seems to favor Bessen’s story, but there was a second stretch-out in 1851 that, alongside the decline in real wages after the late 1840s, is consis-tent with Lazonick and Brush. Perhaps we should wait for yet another visit to the data from Mill No. 2 in order to decide between these stories. But regardless of the outcome of further research, one lesson from this case study is clear. Except perhaps in the earliest pe-riod after the founding of the Mill, even strong individual LBD cannot explain progress at the plant level without the broad process of social change that changed the composition of the labor force.
4. Models of Passive Learning
Although a variety of models that contain passive learning have been discussed, I have yet to describe any theory of learning. In this section, I discuss theories under two rubrics. Sub-section 4.1 describes a model of learning that induces the familiar power rule. Subsection 4.2 describes models generating bounded learning.
4.1 Models with Unbounded Learning
Muth (1986) asserts that March and Simon (1958) were the first economists to develop a theory of organizational learning. They were followed by contributions from Crossman (1959), Levy (1965), Sahal (1979), and Roberts (1982). Muth succinctly describes each of them,30 but then dismisses each of them in short order either because they fail to induce the power rule for passive learning, or because the way they do so “assumes the desired an-swer” [p. 952].
Muth (1986) constructs a theory of learning that leads to the power rule from somewhat deeper assumptions. He models a process of random sampling from a distribution of cost draws, where the current unit cost is the minimum of the draws. Let F(c) denote the dis-tribution of costs, let
0( ) 0F c = , and let
( )nc denote the minimum of n draws from this sam-
ple. When sampling is random, the distribution of ( )n
c is
( )( )1 1 ( )
n
nG c F c = − − . (4.1)
Let ( ) ( )u c nF c= . For any draw, { } { }pr pr ( ) ( )c x u c u x≤ = ≤ , and so { }( )pr
nc x≤
= { }pr min ( ) ( )u c u x≤ . It then follows that
30 So I shall not describe them here.

35
( ) ( )
( )
( )1 pr min ( ) n
n
u cG c F c
n
= − ≥
( )( )
1 1
n
nu c
n
= − − . (4.2)
The second line makes use of the fact that F(c) is a distribution and therefore is uniformly distributed on [0,1] . The large-sample approximation to (4.2) is
( ) ( )( )
( )1 lim 1
n
n
n n
u cG c
n→∞
≈ − −
( )( )1 nnF ce
−= − . (4.3)
Muth then assumes that, at least near the left tail of the distribution, F(c) can be ap-proximated by the power function, 1/
0( )c c λα − . Then (4.3) is a Weibull distribution,
( ) ( )( )( ) ( )
( )1 n on c c
nG c e
λλα− −
≈ − , (4.4)
with expected value
( ) 0
1( )
n
kE c c n
kλα
+ ≈ + Γ . (4.5)
If one further assumes that the lower bound to cost is zero, and that the rate of sampling is proportional to the current rate of production, (4.5) can be written in the form of the power rule,
( )
( )y
E c Ay t λ− ≈ . (4.6)
The assumption that the lower tail of the distribution can be adequately approximated by a power function is less onerous than it may seem: in the context of applications to extreme value distributions, this assumption must hold as long as F(c) has no mass point at zero.31 Perhaps more onerous is the assumption that sampling is random out of F(c): as costs de-
31 In fact, the limiting distribution of the minimum [maximum] of a large set of independent draws is Weibull for any distribution that has a finite lower [upper] bound and does not having a mass point at that bound [e.g., Galambos (1978)].

36
cline, firms spend more and more time observing new ways of doing things that are far worse than the current state of the art. One might suppose instead that firms observe variations on how they are doing things today, in which case the distribution F(c) should itself evolve over time. For example, firms may be able to eliminate from their search space any costs greater than, say, c v+ . Then, the sampling space has the distribution
1( ) ( )F c v F c−+ for [0, ]c c v∈ + , and zero otherwise. In this case, the auxiliary assumptions necessary to induce the power rule for passive learning become quite contrived.32
4.2 Models with Bounded Learning
• Two simple models. One of the reasons that the power learning rule has remained popular has been the ease with which it can be empirically implemented. But mathematical psy-chologists long ago developed some equally straightforward models of bounded learning. Two specifications have been especially popular [Restle and Greeno (1970, ch.1)]. One is the replacement model, which models productivity, qt, as
1( )(1 ) ty
tq a a b λ −= − − − , (4.7)
where a, b, and λ are positive parameters and 1,2,y = …, is cumulative output. The second is the accumulation model, which takes the form
( 1)
1 ( 1)t
tt
b a yq
y
λ
λ
+ −=
+ −. (4.8)
Both models predict an initial productivity of b, and a terminal productivity of a. The pa-rameter λ governs the rate of learning. In the replacement model,
1( ) / ( )
i i iq q a qλ
+= − − ,
which is the change in productivity expressed as a fraction of the amount left to learn. The replacement model is a little more complicated, as
1 1( ) / ( ( ))
i i i i iq q a q i q qλ
+ += − − − − con-
tains an extra term in the denominator.
The names for the two specifications are derived from two urn problems that generate these functions. There are two urns, A and B. Urn A contains a fixed number of marbles, of which a fraction b is red and a fraction 1−b is white. On each trial, one marble is drawn
32 In Roberts (1983), agents are able to eliminate parts of the sample space. His model is an ad-aptation of the traveling salesman problem, in which it becomes progressively easier to eliminate from consideration whole subsets of the search space because they are known without inquiry to contain only routes that are longer than the fastest route currently known. Roberts applies his model to machine efficiency and devises a set of auxiliary assumptions that leads to the power rule for learning. Muth, however, objects that Roberts’ assumptions might be reasonable for machine efficiency, but they cannot be justified in a model of manufacturing costs.

37
from A. If it is red a ‘correct’ response is recorded. Urn B contains an infinite number of marbles, a fraction a>b of which are red. In the replacement model, a fraction λ of the marbles currently in A are replaced after each draw by marbles drawn from B. Let qt de-note the probability of a correct response. Then [ | ]t tE q y is given by (4.7). In the accumu-lation model, a constant number of marbles equal to a fraction λ of the marbles initially in A are transferred from B to A. For this model, [ | ]t tE q y is given by (4.8).
• Bayesian models. The urn problems are a rather abstract way of thinking about learning. Although they capture the idea that learning can be thought of as either the replacement of incorrect ways of doing tasks with correct ways of doing them, or as the accumulation of new skills on top of existing skills, the analogy has proved too loose for economists. Instead, economists have preferred to develop models based explicitly on Bayesian learning.
Bayesian models of learning take two main forms: learning about one’s time-invariant abil-ity to carry out a task, and learning how to accomplish the task. Both models may be ap-plied to individual learning by doing, and to passive learning at the organizational level. Jovanovic (1979, 1982) pioneered the development of learning about ability at both indi-vidual and firm levels. Jovanovic (1979) studies the implications for job turnover of indi-viduals learning about their ability to undertake a firm-specific task; individuals who dis-cover they are not good at their current job leave to pursue other activities. This type of model is now commonly referred to as a model of learning about match quality. Jovanovic (1982) studies the implications for industry dynamics of firms learning about their produc-tion costs, which are stochastic but have time-invariant means; firms that learn they are low-cost producers expand, while firms that discover they are high-cost contract before ex-iting entirely.33 Jovanovic, along with Yaw Nyarko, was also the first to apply a Bayesian approach to learning about how to accomplish a task [Jovanovic and Nyarko (1995, 1996)].
Let the current output of an agent with t periods of experience be given by
t t t
x Ah= (4.9)
where At reflects the match quality, and ht reflects task learning. The term At is given by
( )t t
A uµ= + , (4.10)
33 Because firms are equally likely to receive bad news as good news, learning about firm ability need not be associated with rising productivity or output. However, selection removes the high-cost firms so that surviving firms are those that have grown in the past. Moreover, firms may still grow on average from learning about individual task ability, because they may be able to reallocate workers to tasks for which they are better suited [Prescott and Visscher (1980)] or to replace low-ability workers [Jovanovic (1979)].

38
In each period, ut is known to be a random draw from ( )20,u
N σ , but µ is initially only known to be a random draw from the prior distribution ( )20,N µσ . One problem for the agent (and his employer) is to learn the value of µ. The task-learning term is given by
( )21
t t th zθ ε = − − +
, (4.11)
which consists of a target, θ, a decision in period t, zt, and noise, εt. The target is fixed across periods, but initially is only known to be a draw from ( )20,N θσ . The noise in each period is known to be an i.i.d. random draw from ( )20,N εσ . The second and third tasks for the agent are to learn θ while choosing in each period the optimal decision zt.34
If 2 0µσ = , the match quality is known, and (4.9) reduces to the pure task-learning model. Similarly, if 2 0θσ = , the target is known and (4.9) is the pure match quality model. Each of these models is straightforward to analyze under the standard assumption that the agent learns by observing the sequence
1{ }txτ τ= . The combined model, however, is not easy to
analyze under this same assumption. Nagypál (2007) greatly simplifies matters by assuming instead that in each period the agent observes At and ht separately. This simplifying as-sumption will be maintained here.
Before proceeding, two features of the model that also contribute greatly to tractability merit comment. First, one signal is assumed to be observed in each period regardless of the level of output. There is, as result, no incentive to deviate from the static optimum choice for zt.; this is clearly a departure from the usual assumption that the amount of information obtained depends on the rate of output. Second, all distributions are Normal with known variances. This assumption conveniently ensures that posterior variances depend on the number of signals received but not the realizations of those signals. Moreover, the variance is decreasing in the number of signals observed, so learning can be said to be monotonic.35
Consider first the task-learning function, ht. The decision zt is obviously known, so observ-ing ht is equivalent to observing a normally distributed signal,
t ts θ ε= + . Then, the
agent’s posterior variance of the target after t periods is [e.g., DeGroot (1970, ch. 9)]
34 Distributions have been chosen to minimize notation. As a result, the model admits negative output; this could easily be corrected (without adding insight) by assuming output is an appro-priate monotonic transformation of xt. 35 Pakes and Ericson (1998) point out that under alternative distributional assumptions agents may fail to learn the unknown parameters even after receiving an infinite number of signals. Thompson (2000) develops a model of growth with an alternative distributional assumption that does ensure learning.

39
2 2
1 1 2 2( )
( 1)t tE E
tθ ε
θ ε
σ σθ θ
σ σ− − − = − +
. (4.12)
The agent’s decision in period t, is to set 1t t
z E θ− = . It then follows that
2 2
21 2 2
1( 1)t t
E ht
θ εε
θ ε
σ σσ
σ σ− = − − − +
. (4.13)
Turning now to At, it is easy to see that
121
1 2 2[ ]
( 1)
t
t t
u
AE A
tτµ τ
µ
σ
σ σ
−=
− =− +
∑, (4.14)
and hence that
12 2 21 2
1 2 2 2 2[ ] 1
( 1) ( 1)
t
t t
u
AE x
t tτµ τ θ ε
εµ θ ε
σ σ σσ
σ σ σ σ
−=
−
= − − − + − +
∑. (4.15)
Equation (4.15) has endpoints of 0 1[ ] 0E x = and 2
1lim [ ] (1 )
t t tE x εµ σ→∞ − = − , so the function
is clearly bounded. Because the prior mean of µ is zero, (4.15) yields (stochastically) posi-tively-sloped functions of t only when the realized value of µ exceeds zero. Taking averages over all individuals with a given strictly positive match quality,
1[ ]
t tE x− is strictly convex,
although for any individual both 1[ ]
t tE x− and xt are only stochastically increasing.
• Empirical discrimination. It can be very difficult to distinguish between the two types of learning in field data. For example, assume there is no uncertainty about the target, so the task learning component is simply 2(1 )εσ− . Then, taking expectations of (4.15) over all agents with match quality µ yields
2 2
1 2 2
( 1)(1 )[ ]
( 1)t t
u
tE E x
tµ ε
µ
µσ σµ
σ σ−
− − = − +. (4.16)
If instead there is no uncertainty about match quality (i.e., it is known to be µ), but there is task learning, then
2 2 2 2 2
1 2 2 2 2
( 1)(1 ) (1 )[ ]
( 1) ( 1)t t
tE x
t tθ ε ε θ ε
µθ ε θ ε
µσ σ µσ σ σ
σ σ σ σ−
− − − −= +
− + − + (4.17)
Equation (4.16) has an initial value of zero. Imposing the same initial value on (4.17) re-quires that 2 2 1θ εσ σ+ = . Then (4.17) simplifies to (4.16), with 2
uσ and 2
µσ replaced by 2εσ

40
and 2θσ , so both learning models yield much the same expression. Appropriate changes in
2 2θ εσ σ+ allow for different prior means of µ. Thus, average behavior in the pure match
quality model for individuals with any given µ can be replicated by the average behavior of a particular parameterization of the task-learning model.
To distinguish between the models, one must therefore move beyond their average behav-ior. Farber (1994) has done so by exploiting the fact that the two models have different implications for the hazard of job separation. When there is only learning about match quality, a poorly matched worker-firm pair waits to observe a number of signals before con-cluding there is sufficient evidence to warrant separation. After sufficient passage of time, only high-quality matches survive. Thus, the hazard of job separation rises before it falls. In contrast, when there is only (positive) task learning, the hazard falls monotonically with job tenure. In this case, rising expected productivity insulates the worker from exogenous shocks that make continued employment less attractive (either to the firm or to the worker). Farber uses a large sample from the National Longitudinal Survey of Youth to study the hazard of job separation as a function of job tenure. He reports that, consistent with the match quality model, the hazard rises before it falls, reaching a peak at about three months. Thus, Farber’s analysis suggests that learning about match quality is domi-nant in the first few months of employment, although either type of learning may be more important thereafter.
Nagypál (2007) instead focuses on the effect of firm-specific price shocks on turnover. In the task learning model, negative price shocks primarily affect workers with limited tenure for reasons already explained. In contrast, negative price shocks adversely affect workers of all tenures in the match quality model. This is the result of two off-setting forces. On the one hand, selection implies that the match quality of workers with short tenure is on average lower and, as in the task learning model, this makes them susceptible to adverse shocks. On the other hand, workers with long tenure have a smaller option value of continuing the match because there is little for them to learn about its quality. This makes workers with long tenure susceptible to adverse shocks. Nagypál uses these insights to estimate the pa-rameters of a structural model that embeds both types of learning. She finds, in contrast to Farber’s results, that task learning is important in the first few months, while learning about match quality dominates at longer tenures. Indeed, task learning is all but complete after six months or so, but learning about match quality persists for up to ten years. None-theless, Nagypál’s point estimates suggest that the magnitude of task learning is much the greater of the two: about eighty percent of the estimated increase in average output is at-tributable to task learning.
These two studies appear to the only ones to date that attempt to discriminate between match quality and task learning. Their contrasting results, and limitations of both studies,

41
should induce caution. Nagypál objects that estimates of the hazard during the first few months of tenure are especially susceptible to measurement error, so Farber’s inferences are unreliable. At the same time, Nagypál’s estimates of the rate of task learning are extremely imprecise (and cannot be distinguished statistically from zero). Thus, there appears room for more work on testing these theories of learning.
5. Passive Learning and Aggregate Growth This section addresses the consequences of passive learning for aggregate growth. Subsec-tion 5.1 presents a simple one-sector model of growth driven by passive learning that con-tains some of the key features in the models developed by Arrow (1962) and Romer (1986a). These models predict that per capita income growth is positively related to the size of the population or to its growth rate, neither of which is consistent with evidence. Moreover, both models require that passive learning be unbounded, a feature inconsistent with empirical evidence. Subsection 5.2 therefore restricts attention to hybrid models in which learning within any given technology is bounded, but new technologies are intro-duced as a result of some mechanism distinct from passive learning.
5.1 A Simple Model
Let aggregate output be given by ( ) ( ) ( ) ( )Y t A t K t L tα α1−= , where A is knowledge, K aggre-gate physical capital and L labor. Labor grows exogenously at the rate n, K evolves accord-ing to ( ) ( )K t sY t= , where s is the exogenous saving rate (there is no depreciation), and knowledge advances as a result of passive learning. In the conventional formulation, knowl-edge advances at a rate that depends upon cumulative output, but it is somewhat easier to follow Arrow (1962) and Romer (1986a) and link knowledge to cumulative investment,
( ) ( )A t K t λβ= . Dropping time arguments for compactness, constant returns to scale allows us to write the model in intensive form. Letting lower case letters denote per capita vari-ables, per capita income is
y Akα= , (5.1)
and the equations of motion are
1ksAk n
kα−= − , (5.2)
and
A k
nA k
λ λ= + . (5.3)

42
Hence, per capita income grows at the rate
1( )( )y
n sAk ny
αλ λ α −= + + − , (5.4)
so a steady-state with constant per capita income growth requires that the growth rates of knowledge and capital are related by
(1 )A k
A kα= − . (5.5)
This in turn implies that per capita income and the capital-labor ratio grow at the same rate. Equations (5.3) and (5.5) yield
(1 )k
nk
λ α λ= − − . (5.7)
What (5.7) implies for long-run growth depends upon the auxiliary assumptions we choose to make. Consider first the choices made in Romer’s (1986a) launch of the modern theory of endogenous growth. He sets 0n = , in which case steady state growth rate can only be sustained under the knife-edge assumption of exactly constant returns to scale in accumu-lable factors, 1α λ+ = .36 If α λ+ exceeds unity, even by a small margin, growth acceler-ates without limit and, moreover, infinite income is attained within a finite amount of time; if 1α λ+ < the steady-state is one of stagnation. The knife-edge assumption demands that the learning parameter, λ, be exactly equal to the elasticity of aggregate output with re-spect to labor, 1 .α− As Solow (1994, p. 51) observed, “you would have to believe in the tooth fairy to expect that kind of luck.”
Even with that kind of luck, Romer’s model yields an unpalatable scale effect. When n=0, and 1λ α= − , per capita income growth is
1 1ys K K L sL
yλ α α αβ − 1− −= = . (5.8)
The long-run growth rate is sensitive to policies that induce a permanent change in the sav-ing rate (and in this sense the growth rate is said to be endogenous). Unfortunately, (5.8)
36 Romer’s exposition is nominally more general than this. He notes that a steady state can exist in the presence of increasing returns as long as the rate at which knowledge can be accu-mulated has an upper bound [a formal proof is given in Romer (1986b)]. Of course, the upper bound defines a point, below which there may be increasing returns to scale and above which the marginal product of experience is zero.

43
also implies that that “a country such as India should have an enormous growth advantage over a country such as Singapore” [Lucas (1993, p. 263)]. There is, of course, no empirical support for this latter conclusion.
Arrow (1962) had assumed 1α λ+ < , which allows for positive population growth. Then, from (5.7) we have
(1 )
k y n
k y
λα λ
= =− −
. (5.8)
Per capita income growth does not depend on the saving rate (so Arrow’s assumption pro-duces a model without endogenous growth), but the model has the virtue that growth is no longer increasing in the scale of the economy. However, Arrow’s formulation has the almost equally unpalatable implication that income growth is proportional to the rate of popula-tion growth. This prediction also finds no empirical support, at least in modern data [cf. Mankiw, Romer and Weil (1992, Tables IV and V)].37
This analysis is following a path that has been well-trodden by specialists in the “new growth theory.” The scale effect inherent in Romer’s specification of the passive learning model is also present in early models of R&D-driven endogenous growth [Romer (1990), Grossman and Helpman (1991), Aghion and Howitt (1992)] and was the subject of detailed criticism by Jones (1995a). Jones’ (1995b) approach to eliminate the scale effect yielded a new class of R&D-driven growth models for which Jones coined the moniker “semi-endogenous growth.” These models turn out to be a translation into R&D of Arrow’s pas-sive learning model, and they too yield long-run per capita growth proportional to the rate of population growth. An alternative approach [Aghion and Howitt (1998, ch. 12), Di-nopoulos and Thompson (1998), Peretto (1998), Young (1998)] eliminates the scale effect while preserving the endogeneity of growth, but it does so at the price of introducing a sec-ond knife-edge assumption in addition to the one already in Romer’s models.
The treatment of scale effects in endogenous growth models has consumed an inordinate amount of space over the last fifteen years or so. However, models in which passive learning is the engine of growth figure nowhere in this literature. This is not because passive learn-ing presents insurmountable technical obstacles (to the contrary, translating to passive learning the scale-free models of R&D-driven endogenous growth seems almost a trivial ex-ercise), but rather because passive learning models took a different tack just about the time
37 Kremer (1993) offers some suggestive data linking population growth and income growth in very long run data, but data preceding the demographic transition reflect in part Malthusian effects of income on population growth.

44
the first-generation R&D models were appearing.
5.2 Hybrid Models
Empirical evidence has established that productivity gains from passive learning eventually dry up absent new sources of stimulation. As a result, a plausible model of long-run growth likely cannot be constructed out of a one-sector model with passive learning as the sole en-gine of growth. This realization led to the development of hybrid models that combine pas-sive learning with the introduction of new, superior, vintages of technology. Within any vintage passive learning takes place, but at a rate that diminishes as experience is gained with that particular technology.
Hybrid models are of three kinds. First, there are models in which superior technologies are always available, but their adoption first requires the accumulation of experience in inferior technologies [e.g., Stokey (1988), Young (1991), Parente (1994), Jovanovic and Nyarko (1996)]. Second, there are models in which new technologies arrive at an exogenous rate [e.g., Chari and Hopenhayn (1991)]. Third, there are models in which new technologies are developed through R&D [e.g. Young (1993), Stein (1997)]. Only in the first kind is passive learning the sole engine of growth; but such models fail to explain how superior technolo-gies came to exist.38 Models of the second kind more plausibly allow for sequential discovery of superior technologies, but they run the risk of leaving the engine of growth entirely un-explained.39 Models of the third kind are most representative of what we may have in mind as a hybrid model.
How does the rate of passive learning influence the rate of aggregate growth in hybrid mod-els? Almost any answer is correct, depending upon the auxiliary assumptions one chooses to make. An increase in the rate of learning may have no effect on long-run growth, it may increase it, or it may decrease it. Too much learning may lead to stagnation, and there may be stagnation that arises independently of the rate of learning. Passive learning may also induce clustering of innovations and, more generally, cyclical growth.
• Growth independent of the rate of learning. I begin with a simple hybrid model of the second kind, developed by Lucas (1993). The model is one of a small open economy in which new goods are introduced continuously with respect to time at the constant rate γ.
38 But they are very useful for other questions. In particular, models of this kind have been used to assess the conditions under which firms will abandon a technology with which they have ex-perience in favor of a superior, but unfamiliar, technology. 39 Again, such models are very useful for other questions. For example, Chari and Hopenhayn (1991) explain which some firms choose to invest in inferior technologies while other (identical) firms adopt technologies at the frontier.

45
More recent vintages are superior in the sense that the world price of the newest goods ex-ceeds the price of the previous vintage by a constant proportion, eµ , so the price of a good introduced at time v is ( ) vp v eµγ= . The labor supply is normalized to unity, and output at time t of vintage v is given by the Ricardian technology,
( , ) ( , ) ( , )vx v t e A v t v tµγ φ= , (5.9)
where ( , )v tφ is the fraction of the labor force employed in the production of vintage v. ( , )A v t advances as a result of within-vintage passive learning,
( , ) ( , ) ( , )A v t A v t v tλφ= , (5.10)
where λ<1 is the learning parameter. Let ( , ) 1A v v α= > denote productivity at the time the good is introduced. From (5.9) and (5.10), output of vintage v is given by
/(1 )
1( , ) ( , ) (1 ) ( , )t
v
v
x v t e v t v s ds
λ λ
µγ λφ α λ φ
−
− = + −
∫ (5.11)
Integrating over all vintages, aggregate output is given by
/(1 )
1
0
( ) ( , ) (1 ) ( , )t t
v
v
y t e v t v s ds dv
λ λ
µγ λφ α λ φ
−
− = + −
∫ ∫ . (5.11)
Assume that the distribution of labor over goods of different ages remains constant over time (as must be the case along a balanced growth path), and let a t v= − denote the age of a good. Then the labor devoted to a good over its life, ( , )
t
vv s dsφ∫ , is the same as the
labor devoted in the cross-section to all goods with age less than t v− . Let ( )aψ denote employment on the good of age a, so that ( , ) ( )v t t vφ ψ= − , and let ( )aΨ denote the corre-sponding distribution. Equation (5.11) can now be written as
/( )
( ) 1
0
( ) ( ) (1 ) ( )t
t ay t e a a daλ λ
µγ λφ α λ1−
− − = + − Ψ ∫ , (5.12)
which yields the following aggregate rate of growth:
1
( ) 1
0
( ) (1 )( )( )
( ) (1 ) ( )t
t a
ty ty t
e a a da
λ
µγ λ
ψ α λµγ
φ α λ
−
− −
+ − = + + − Ψ ∫
. (5.13)
The integral term in (5.13) is unbounded, so the asymptotic growth rate is
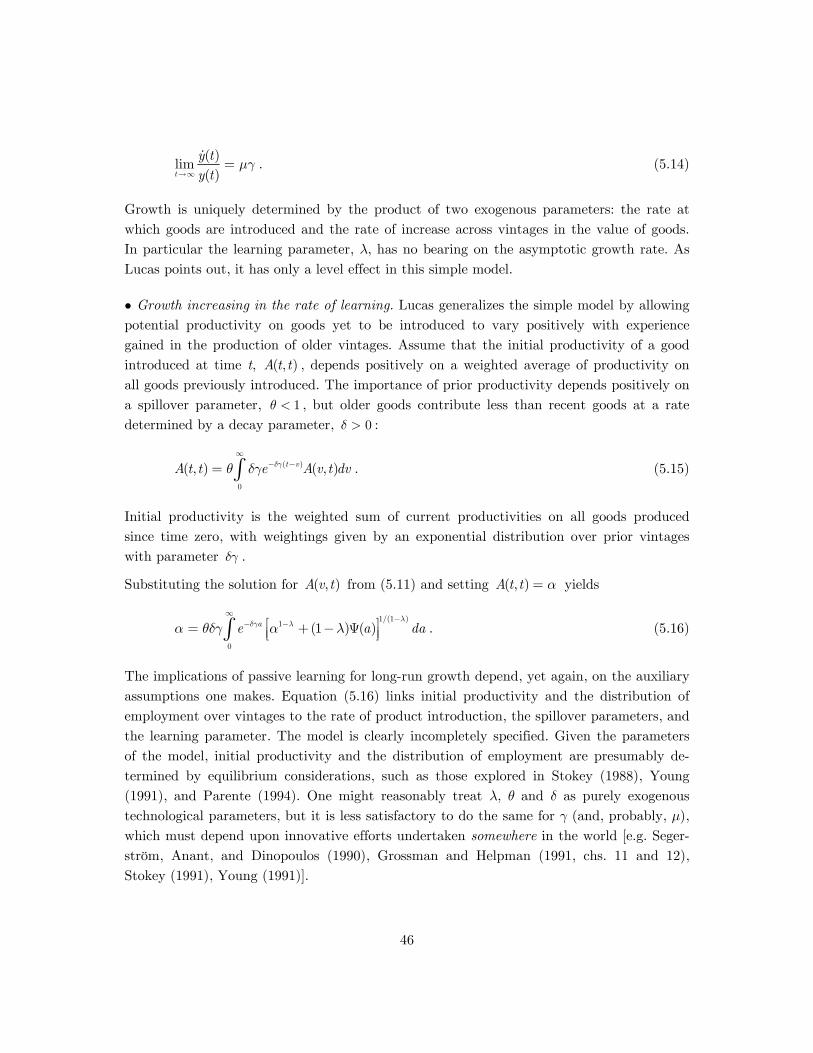
46
( )
lim( )t
y ty t
µγ→∞
= . (5.14)
Growth is uniquely determined by the product of two exogenous parameters: the rate at which goods are introduced and the rate of increase across vintages in the value of goods. In particular the learning parameter, λ, has no bearing on the asymptotic growth rate. As Lucas points out, it has only a level effect in this simple model.
• Growth increasing in the rate of learning. Lucas generalizes the simple model by allowing potential productivity on goods yet to be introduced to vary positively with experience gained in the production of older vintages. Assume that the initial productivity of a good introduced at time t, ( , )A t t , depends positively on a weighted average of productivity on all goods previously introduced. The importance of prior productivity depends positively on a spillover parameter, 1θ < , but older goods contribute less than recent goods at a rate determined by a decay parameter, 0δ > :
( )
0
( , ) ( , )t vA t t e A v t dvδγθ δγ∞
− −= ∫ . (5.15)
Initial productivity is the weighted sum of current productivities on all goods produced since time zero, with weightings given by an exponential distribution over prior vintages with parameter δγ .
Substituting the solution for ( , )A v t from (5.11) and setting ( , )A t t α= yields
1/(1 )
1
0
(1 ) ( )ae a daλ
δγ λα θδγ α λ∞
−− − = + − Ψ ∫ . (5.16)
The implications of passive learning for long-run growth depend, yet again, on the auxiliary assumptions one makes. Equation (5.16) links initial productivity and the distribution of employment over vintages to the rate of product introduction, the spillover parameters, and the learning parameter. The model is clearly incompletely specified. Given the parameters of the model, initial productivity and the distribution of employment are presumably de-termined by equilibrium considerations, such as those explored in Stokey (1988), Young (1991), and Parente (1994). One might reasonably treat λ, θ and δ as purely exogenous technological parameters, but it is less satisfactory to do the same for γ (and, probably, µ), which must depend upon innovative efforts undertaken somewhere in the world [e.g. Seger-ström, Anant, and Dinopoulos (1990), Grossman and Helpman (1991, chs. 11 and 12), Stokey (1991), Young (1991)].

47
Lucas leaves these elaborations to others, assuming that (5.16) pins down γ as a function of the other, exogenous, parameters and functions. Noting that (5.14) continues to define the asymptotic growth rate, if a solution to (5.16) exists it satisfies
( ), , , ( )y
ay
µγ λ δ θ= Ψ , (5.17)
where γ is increasing in λ, and θ, and decreasing in δ. The rate of introduction of new goods is also greater if labor is concentrated in recent vintages, which confer greater spillover benefits to new goods than do older vintages. Thus, treating all parameters other than γ as given, learning spillovers enable the rate of passive learning to positively influence the long-run growth rate. It is easy to verify that the greater are the spillovers (i.e. the greater is θ or the smaller is δ), the greater is the influence of changes in the rate of learning on long-run growth.
Passive learning in the presence of spillovers raises long-run growth by inducing the econ-omy to adopt new vintages more rapidly. This mechanism makes most sense if one assumes that new products are developed elsewhere, perhaps in advanced economies, and that the model applies only to developing economies some distance behind the technological frontier (and this is exactly the application Lucas focuses on). An alternative, also reasonable, as-sumption is that (5.16) identifies α, with γ held fixed. But in this case, variations in the learning parameter have only level effects despite the presence of spillovers.
In advanced economies, the appropriate assumption likely lies between these two extremes, in the sense that both γ and α are endogenous. This is generally the case in models of the third kind, where the rate of innovation depends on the cost of R&D. In these models, however, a wide variety of outcomes are possible. Young (1993) studies the steady states of a model with domestic R&D and full learning spillovers across sectors. First, there is a steady state in which new products are invented and immediately enter into production. Second, when R&D costs are sufficiently low relative to the size of the market, a gap emerges between the time new products are invented and the time they enter into produc-tion; inventors wait until learning spillovers raise the productivity of the new good suffi-ciently to merit implementation. In both these equilibria, the growth rate is increasing in the rate of learning and decreasing in the cost of invention.
• Stagnation independent of the rate of learning. Young’s model has a third steady state, without innovation, which emerges when the cost of innovation is high relative to the size of the market. With the passage of time, learning on increasingly aged technologies ceases and so this steady state is one of stagnation. The learning rate does not figure in the condi-tions that determine the existence of the zero-growth steady state (which depends only on

48
the size of the economy, the innovation cost, and the discount rate): if learning has been exhausted, its rate prior to exhaustion does not affect the present value of profits earned from sticking with the current technology. Young restricts his attention to steady-state analysis, so it is not known whether this zero-growth steady-state is attainable from arbi-trary initial conditions, or from a set of initial conditions that is independent of the rate of learning.
• Stagnation induced by learning. If there are insufficient learning spillovers across tech-nologies, experience gained in learning can halt the adoption or development of new tech-nologies altogether. A firm that has gained extensive experience on one good may find it more profitable to stick with the old technology than to adopt a new technology that would, with the passage of time, prove superior.
Lucas’ model admits stagnation, but it is stagnation caused by the absence of productivity spillovers, not the presence of passive learning. To see this, note that (5.16) yields a posi-tive solution for γ if and only if
1/ 1
11 (1 )λ
λθ λ α−
− > + − . (5.18)
Intuitively, spillovers across vintages must be sufficiently large to maintain long-run growth. The right hand side of (5.18) has an upper bound at / ( 1) 1α α + < , so under full spillovers (i.e., 1θ = ) growth is always positive. However, the right hand side of is strictly decreasing in λ: passive learning lowers the size of the spillovers necessary to sustain growth and makes stagnation less likely.40
Jovanovic and Nyarko (1996) have analyzed the economics of stagnation in some detail, using the single-agent task-learning model described in Section 4.2. They show that stagna-tion is more likely to occur if a firm has extensive experience with its current technology (as measured by the posterior variance of the current target), when spillovers across prod-uct generations are weak (as measured by the cross-product correlation in the targets) and when the difference between product generations in the terminal productivities is modest. The results are intuitive: the first characteristic raises the profitability of the current tech-nology, while the second and third reduce the expected profitability of the new technology.
Jovanovic and Nyarko assume firms are myopic, comparing only the single-period payoff from sticking with the current technology and adopting the new one. For any given level of
40 Curiously, the possibility of stagnation does not depend upon the decay parameter, δ, or the distribution of employment across products, ( )aΨ , even though both affect the growth rate should it be positive.

49
experience a high rate of learning raises the static payoff from sticking with the current technology more than it raises the one-period payoff from switching. In the limit when all experience is product-specific, the one-period payoff from switching is independent of the rate of learning. Thus, rapid learning unambiguously raises the probability of stagnation. However, myopia may not be an innocent assumption here, and this result may not hold when firms are forward-looking. While the value of sticking with the current technology is generally higher with rapid learning, so is the value of switching to a technology that is ex-pected to be mastered quickly. Forward-looking firms will trade off these two consequences of rapid learning and the conditions under which one effect dominates remain unexplored.
• Clusters and cycles induced by learning. Klenow (1998) considers the case of forward-looking firms, but focuses on the possibility of generating cycles. Myopic firms do not switch to a new technology until its initial productivity exceeds the current productivity of the old technology. Forward-looking firms note that switching at an earlier stage is a form of investment, enabling them to gain experience on a technology that will eventually be more productive. As a result, forward-looking firms switch to new technologies that initially yield lower productivity, generating cyclical productivity at the plant or firm level.41
Klenow’s model is consistent with evidence that plants switching technologies initially have lower productivity [e.g. Cochran (1960), Garg and Milliman (1961), Yorukoglu (1998)], but for the mechanism to induce aggregate cycles, innovations must be coordinated in some way. In Shleifer (1986), innovations are coordinated because of aggregate demand external-ities, but this mechanism for coordination induces countercyclical productivity. The devel-opment of a general purposes technology affecting multiple sectors may do the trick: Greenwood and Yorukoglu (1997), for example, have argued that the widespread adoption of information technology lay behind the productivity slowdown of the 1970s. However, Basu, Fernald, and Kimball (2006) reject the GPT mechanism, concluding that sticky prices and not learning link recessions to technology improvements.
6. Concluding Remarks This chapter has reviewed the theoretical and empirical literature on learning by doing.
41 In Stein (1997), passive learning induces cycles through a rather different mechanism. Firm-specific learning makes it harder over time for potential entrants to invent and unseat the in-cumbent. Thus, potential entrants expend less effort on R&D when faced by a long-entrenched incumbent. If, eventually, the incumbent is replaced, the new incumbent is inexperienced and is more readily overturned by further innovations. As a result new potential entrants invest heav-ily in R&D, making rapid innovation more likely. In this way, innovations appear in clusters through a stochastic process characterized by contagion.

50
Many of the distinctive theoretical implications of learning by doing have been derived un-der the assumption that the cost-quantity relationships observed in numerous empirical studies are largely the result of passive learning, and some further require that passive learning is unbounded. The empirical literature raises doubts about both assumptions. When observed cost-quantity relationships indicate sustained productivity growth, factors other than passive learning are generally at work. When passive learning is the dominant factor, productivity growth is invariably bounded. Thus, empirically-relevant theories in-corporating learning by doing are hybrid models in which passive learning coexists with other sources of growth. But in such models, many of the distinctive implications of passive learning become unimportant. Moreover, passive learning is often an inessential component of long-run growth; to the contrary, too much learning can lead to stagnation.
References
Abramovitz, Moses (1956): Resource and Output Trends in the United States Since 1870. New York: National Bureau of Economic Research.
Aghion, Philippe and Howitt, Peter (1992): “A model of growth through creative destruction.” Econometrica, 60(2):323-351.
Aghion, Philippe and Howitt, Peter (1998): Endogenous Growth Theory. Cambridge, MA: MIT Press.
Alchian, Armen (1963): “Reliability of progress curves in airframe production.” Econometrica, 31(4):679-693 [originally Rand Corporation RM-260-1 (1950)].
Anderlohr, G. (1969): “Determining the cost of production breaks.” Management Review, 58(12):16-19.
Argote, Linda (1993): “Group and organizational learning curves: Individual, system, and envi-ronmental components.” British Journal of Social Psychology, 32:31-51.
Argote, Linda, Sara L. Beckman and Dennis Epple (1990): “The persistence and transfer of learning in industrial settings.” Management Science, 36(2):140-154.
Argote, Linda, and Dennis Epple (1990): “Learning curves in manufacturing.” Science, 247:920-924.
Argote, Linda, Dennis Epple, Rukmini Devadas Rao, and Kenneth Murphy (1997): “The acqui-sition and depreciation of knowledge in a manufacturing organization: Turnover and plant productivity.” Working Paper, Carnegie Mellon University.
Arrow, Kenneth J. (1962): “The economic implications of learning by doing.” Review of Economic Studies, 29(3):155-173.
Asher, Harold (1956): Cost-Quantity Relationships in the Airframe Industry. Santa Monica, CA: RAND Corporation.
Audretsch, David B. (1991): “New firm survival and the technological regime.” Review of Eco-nomics and Statistics, 60(3):441-50.
Audretsch, David B., and Talat Mahmood (1995): “New firm survival: New results using a haz-ard function.” Review of Economics and Statistics, 77(1):97-103.

51
Bahk, Byong K., and Michael Gort (1993): “Decomposing learning by doing in new plants.” Journal of Political Economy, 101(4):561-583.
Baily, Martin N., Charles Hulten, and David Campbell (1992): “Productivity dynamics in manufacturing plants.” Brookings Papers on Economic Activity. Microeconomics, Vol. 1992, pp. 187-267.
Baldwin, John R., Lin Bian, Richard Dupuy, and Guy Gellatly (2000): “Failure rates for new Canadian firms: New perspectives on entry and exit.” Working paper, Statistics Canada.
Baldwin, John R., and Paul Gorecki (1991): “Entry, exit and productivity growth.” In Paul Geroski and Joachim Schwalbach (eds.), Entry and Market Contestability: An Interna-tional Comparison. Oxford: Basil Blackwell, pp. 244-56.
Baloff, Nicholas (1966): “Startups in machine-intensive production systems.” Journal of Industrial Engineering, 31:679-693.
Baloff, Nicholas (1970): “Startup management.” IEEE Transactions on Engineering Manage-ment, 17:132-141.
Bartelsman, Eric J., and Phoebus J. Dhrymes (1998): “Productivity dynamics: U.S. manufactur-ing plants, 1972-1986.” Journal of Productivity Analysis, 9(1):5-34.
Basu, Susanto, John G. Fernald, and Miles S. Kimball (2006): “Are technology improvements contractionary?” American Economic Review, 96(5):1418-1448.
Bell, R. M., and Scott-Kemmis, D. (1990): “The mythology of learning-by-doing in World War II airframe and ship production.” Working paper, Univ. Sussex, Science Policy Research Unit.
Benkard, C. Lanier (2000): “Learning and forgetting: The dynamics of aircraft production.” American Economic Review, 90(4):1034-1054.
Besanko, David, Ulrich Doraszelski, Yaroslav Kryukov, and Mark Satterthwaite, (2007): “Learning-by-doing, organizational forgetting, and industry dynamics.” Working paper, Northwestern University.
Bessen, James (2003): “Technology and learning by factor workers: The stretch-out at Lowell, 1842.” Journal of Economic History, 63(1):33-64.
Book, William F. (1908): The Psychology of Skill. University of Montana Publications in Psy-chology, Bulletin No. 53.
Boston Consulting Group (1972): Perspectives on Experience. Boston: Boston Consulting Group.
Bryan, W.N., and N. Harter (1899): “Studies in the telegraphic language: The acquisition of a hierarchy of habits.” Psychological Review, 6:345-375.
Bulow, Jeremy, John Geanakoplos, and Paul Klemperer (1985): “Holding idle capacity to deter entry.” The Economic Journal, 85:178-182.
Cabral, Luis M.M., and Michael H. Riordan (1994): “The learning curve, market dominance, and predatory pricing.” Econometrica, 62(5):1115-1140.
Cabral, Luis M.M., and Michael H. Riordan (1997): “The learning curve, predation, antitrust, and welfare.” Journal of Industrial Economics, 45(2):155-169.
Chari, V. V., and Hugo Hopenhayn (1991): “Vintage human capital, growth, and the diffusion of new technology.” Journal of Political Economy, 99(6):1142-1165
Clarke, Frank H., Masako N. Darrough, John M. Heineke (1982): “Optimal pricing policy in the

52
presence of experience effects.” Journal of Business, 55(4):517-530. Cochran, E.B. (1960): “New concepts of the learning curve.” Journal of Industrial Engineering,
11:317-327.
Conway, R.W., and Andrew Schultz, Jr. (1959): “The manufacturing progress function.” Jour-nal of Industrial Engineering, 10(1):39-54.
Conley, Timothy G., and Christopher R. Udry (2007): “Learning about a new technology: Pine-apple in Ghana.” Working paper, University of Chicago.
Crossman, E. (1959): “A theory of the acquisition of speed skill.” Ergonomics, 2:153-166.
Dar-El, Ezey M. (2000): Human learning: From Learning Curves to Learning Organizations. Dordrecht: Kluwer Academic Publishers.
Darr, Eric D., Linda Argote and Dennis Epple (1995): “The acquisition, transfer, and deprecia-tion of knowledge in service organizations: Productivity in franchises.” Management Sci-ence, 41(11):1750-1762.
Dasgupta, Partha, and Joseph E. Stiglitz (1988): “Learning-by-doing, market structure, and industrial and trade policies.” Oxford Economic Papers, 40(2):246-268.
David, Paul A. (1973): “The ‘Horndal effect’ in Lowell, 1834–1856: A short-run learning curve for integrated cotton textile mills.” Explorations in Economic History, 10(1):131–50.
DeGroot, Morris H. (1970): Optimal Statistical Decisions. New York: McGraw-Hill.
Dewey, John (1897): “My pedagogic creed.” School Journal, 54:77-80.
Dinopoulos, Elias, and Peter Thompson (1998): “Schumpeterian growth without scale effects.” Journal of Economic Growth, 3(4):313-337
Disney, Richard, Jonathan Haskel, and Ylva Heden (2000): “Entry, exit and establishment sur-vival in UK manufacturing.” Working paper, Queen Mary and Westfield College, Lon-don.
Dixit, Avinash (1980): “The role of investment in entry deterrence.” The Economic Journal, 90:95-106.
Dunne, Timothy, Mark J. Roberts, and Larry Samuelson (1989): “The growth and failure of U.S. manufacturing plants.” Quarterly Journal of Economics, 104(4):671-698.
Dutton, John M., and Annie Thomas (1994): “Treating progress functions as a managerial opportunity.” Academy of Management Review, 9(2):235-247.
Ebbinghaus, Herman (1885): Memory: A Contribution to Experimental Psychology. Transl. by Henry A. Ruger & Clara E. Bussenius [1913]. New York: Columbia University.
Epple, Dennis, Linda Argote and Rukmini Devadas (1991): “Organizational learning curves: A method of investigating intra-plant transfer of knowledge acquired through learning by doing.” Organization Science, 2(1):58-70.
Epple, Dennis, Linda Argote and Kenneth Murphy (1995): “An empirical investigation of the microstructure of knowledge acquisition and transfer through learning by doing.” Opera-tions Research, 44(1):77-86.
Ericson, Richard, and Ariel Pakes (1995): “Markov-perfect industry dynamics: A framework for empirical work.” Review of Economic Studies, 62(1):53-82.
Evans, David S. (1987a): “Tests of alternative theories of firm growth.” Journal of Political Economy, 95(4):657-674.

53
Evans, David S. (1987b): “The relationship between firm growth, size, and age: Estimates for 100 manufacturing industries.” Journal of Industrial Economics, 35(2):567-581.
Farber, Henry S. (1994): “The analysis of interfirm worker mobility.” Journal of Labor Econom-ics, 12(4):554-593.
Feller, W. (1940): “On the logistic law of growth and its empirical verifications in biology.” Acta Biotheoretica, 5(1):51-66.
Foster, Andrew D., and Mark R. Rosenzweig (1995): “Learning by doing and learning from oth-ers: Human capital and technical change in agriculture.” Journal of Political Economy, 103(6):1176-1209.
Fudenberg, Drew, and Jean Tirole (1983): “Learning-by-doing and market performance.” Bell Journal of Economics, 14(2):522-530.
Galambos, Janos (1978): The Asymptotic Theory of Extreme Order Statistics. New York: Wiley.
Garg, A., and P. Milliman (1961): “The aircraft progress curve – modified for design changes.” Journal of Industrial Engineering, 12(1):23-27.
Ghemawat, Pankaj, and A. Michael Spence (1985): “Learning curve spillovers and market per-formance.” Quarterly Journal of Economics, 100 (Supplement):839-852.
Greenwood, Jeremey, and Mehmet Yorukoglu (1997): “1974.” Carnegie-Rochester Conference Series on Public Policy, 46:49-95.
Greenwood, Major, and G. Udny Yule (1920): “An enquiry into the nature of frequency distri-butions representative of multiple happenings, with particular reference to the occurrence of multiple attacks of disease or repeated accidents.” Journal of the Royal Statistical So-ciety, 83:255-279.
Grossman, Gene M., and Elhanan Helpman (1991): Innovation and Growth in the Global Econ-omy. Cambridge, MA: MIT Press.
Hall, Bronwyn H. (1987): “The relationship between firm size and firm growth in the U.S. manufacturing sector.” Journal of Industrial Economics, 35(4):583-606.
Hall, Robert E. (1971): “The measurement of quality changes from vintage price data.” In Zvi Griclihes (ed.) Price Indexes and Quality Change, Cambridge, MA: Harvard University Press, pp. 240-271.
Hirsch, Werner Z. (1952): “Manufacturing progress functions.” Review of Economics and Statis-tics, 34(2):143-155.
Hirsch, Werner Z. (1956): “Firm progress ratios.” Econometrica, 24(2):136-143.
Hollis, Aiden (2002): “Strategic implications of learning by doing.” International Journal of the Economics of Business, 9(2):157-174.
Ingram, Paul, and Tal Simons (2002): “The transfer of experience in groups of organizations: Implications for performance and competition.” Management Science, 48(12):1517-1533.
Irwin, Douglas A., and Peter J. Klenow (1994): “Learning-by-doing spillovers in the semicon-ductor industry.” Journal of Political Economy, 102(6):1200-1227.
Jensen, J. Bradford, Robert H. McGuckin, and Kevin J. Stiroh (2001): “The impact of vintage and survival on productivity: Evidence from cohorts of U.S. manufacturing plants.” Re-view of Economics and Statistics, 83(2):323-332.
Jones, Charles I. (1995a): “Time series tests of endogenous growth models.” Quarterly Journal of Economics, 110(2):495-525.

54
Jones, Charles I. (1995b): “R&D-based models of economic growth.” Journal of Political Econ-omy, 103(4):759-784.
Jovanovic, Boyan (1979): “Job matching and the theory of turnover.” Journal of Political Economy, 87(5, part 1):972-990.
Jovanovic, Boyan (1982): “Selection and the evolution of industry.” Econometrica, 50(3):649-670.
Jovanovic, Boyan, and Saul Lach (1989): “Entry, exit, and diffusion with learning by doing.” American Economic Review, 79(4):690-699.
Jovanovic, Boyan, and Yaw Nyarko (1995): “A Bayesian learning model fitted to a variety of empirical learning curves.” Brookings Papers on Economic Activity. Microeconomics, vol. 1995, pp. 247-305.
Jovanovic, Boyan, and Yaw Nyarko (1996): “Learning by doing and the choice of technology.” Econometrica, 64(6):1299-1310.
Klenow, Peter J. (1998): “Learning curves and the cyclical behavior of manufacturing indus-tries.” Review of Economic Dynamics, 1:531-550.
Kremer, Michael (1993): “Population growth and technological change: One million B.C. to 1990.” Quarterly Journal of Economics, 108(4):681-716.
Krugman, Paul R. (1987): “The narrow moving band, the Dutch disease and the competitive consequences of Mrs. Thatcher: Notes on trade in the presence of dynamic scale econo-mies.” Journal of Development Economics, 27(1):41-55.
Lane, Frederic C. (1951): Ships for Victory. Baltmore, MD: Johns Hopkins University Press.
Lazonick, William, and Thomas Brush (1985): “The ‘Horndal Effect’ in early U.S. manufactur-ing.” Explorations in Economic History, 22(1):53–96.
Levhari, David (1966): “Extensions of Arrow's ‘learning by doing’.” Review of Economic Stud-ies, 33(2):117-131.
Levin, Daniel Z. (2000): “Organizational learning and the transfer of knowledge: An investiga-tion of quality improvement.” Organization Science, 11(6):630-647.
Levy, Ferdinand K. (1965): “Adaptation in the production process.” Management Science, 11(6):B136-B154
Lieberman, Marvin B. (1987a): “The learning curve, diffusion, and competitive strategy.” Stra-tegic Management Journal, 8(5):441-452.
Lieberman, Marvin B. (1987b): “Excess capacity as a barrier to entry: An empirical appraisal.” Journal of Industrial Economics, 35(4):607-627.
Lieberman, Marvin B. (1989): “The learning curve, technology barriers to entry, and competi-tive survival in the chemical processing industries.” Strategic Management Journal, 10(5):431-447.
Lucas, Robert E. Jr. (1993): “Making a Miracle.” Econometrica, 61(2):251-272. Mankiw, N. Gregory, David Romer, and David N. Weil (1992): “A contribution to the empirics
of economic growth.” Quarterly Journal of Economics, 107(2):407-437.
Mansfield, Edwin (1985): “How rapidly does new industrial technology leak out?” Journal of Industrial Economics, 35:607-635.
March, James G., and Herbert A. Simon (1958): Organizations. New York: Wiley.

55
Mata, José, and Pedro Portugal (1994): “Life duration of new firms.” Journal of Industrial Eco-nomics, 27:227-46.
Mazur, James E., and Reid Hastie (1978): “Learning as accumulation: A reexamination of the learning curve.” Psychological Bulletin, 85(6):1256-1274.
McGouldrick, Paul F. (1968): New England Textiles in the Nineteenth Century: Profits and In-vestment. Cambridge, MA: Harvard University Press
Middleton, K.A. (1945): “Wartime productivity changes in the airframe industry.” Monthly La-bor Review, 61(2):215-225.
Mishina, Kazuhiro (1999): “Learning by new experiences: Revisiting the flying fortress learning curve.” In Naomi Lamoreaux, Daniel M. Raff, and Peter Temin (eds.) Learning by Doing in Markets, Firms, and Countries, Chicago: University of Chicago Press (for NBER).
Montgomery, Francis J. (1943): “Increased productivity in construction of Liberty vessels.” Monthly Labor Review, 57(11):861-864.
Muth, John F. (1986): “Search theory and the manufacturing progress function.” Management Science, 32(8):948-962.
Nagypál, Éva (2007): “Learning by doing vs. learning about match quality: Can we tell them apart?” Review of Economic Studies, 74(2):537-566.
Ohashi, Hiroshi (2005): “Learning by doing, export subsidies, and industry growth: Japanese steel in the 1950s and 1960s.” Journal of International Economics, 66(2):297-323.
Pakes, Ariel, and Richard Ericson (1998): “Empirical implications of alternative models of firm dynamics.” Journal of Economic Theory, 79(1):1-45.
Parente, Stephen L. (1994): “Technology adoption, learning-by-doing, and economic growth.” Journal of Economic Theory, 63(2):346-369.
Peretto, Pietro (1998): “Technological change and population growth.” Journal of Economic Growth, 3(4):283-311.
Persson, Helena (2002): “The survival and growth of new establishments in Sweden, 1987-1995.” Working paper, Stockholm University.
Petrakis, Emmanuel, Eric Rasmusen, and Santanu Roy (1997): “The learning curve in a com-petitive industry.” RAND Journal of Economics, 28(2):248-268.
Power, Laura (1998): “The missing link: Technology, investment, and productivity.” Review of Economics and Statistics, 80(2):300-313.
Prescott, Edward C., and Michael Visscher (1980): “Organization capital.” Journal of Political Economy, 88(3):446-61.
Preston, Lee E., and Edward C. Keachie (1964): “Cost functions and progress functions: An integration.” American Economic Review, 54(2):100-107.
Rapping, Leonard (1965): “Learning and World War II production functions.” Review of Eco-nomics and Statistics, 47(1):81-86.
Redding, Stephen (1999): “Dynamic comparative advantage and the welfare effects of trade.” Oxford Economic Papers, 51(1):15-39.
Restle, Frank, and James G. Greeno (1970): Introduction to Mathematical Psychology. Reading, MA: Addison-Wesley.
Roberts, Peter C. (1983): “A theory of the learning process.” Journal of the Operations Re-search Society, 34(1):71-79.

56
Romer, Paul M. (1986a): “Increasing returns and long-run growth.” Journal of Political Econ-omy, 94(5):1002-1037.
Romer, Paul M. (1986b): “Cake eating, chattering and jumps: Existence results for variational problems.” Econometrica, 54(4):897-908.
Romer, Paul M. (1990): “Endogenous technological change.” Journal of Political Economy, 98(5):S71-S102.
Rosen, Sherwin (1972): “Learning by experience as joint production.” Quarterly Journal of Economics, 86(3):366-382.
Rosenberg, Nathan (1976): Perspectives on Technology. Cambridge, UK: Cambridge University Press.
Sahal, Devendra A. (1979): “A theory of progress functions.” AIIE Transactions, 11(1):29-29.
Salop, Steven C. (1979): “Strategic entry deterrence.” American Economic Review, 69(2):335-338.
Saunders, Ronald S. (1985): “Learning by doing and dominant firm pricing strategy.” Review of Industrial Organization, 2(1):32-39.
Scherer, F.M. (1980): Industrial Market Structure and Economic Performance. 2nd edition. Chi-cago: Rand McNally.
Searle, Allan D. (1945): “Productivity changes in selected wartime shipbuilding programs.” Monthly Labor Review, December:1132-1147.
Segerström, Paul S., T.C.A. Anant, and Elias Dinopoulos (1990): “A Schumpeterian model of the product life cycle.” American Economic Review, 80(5):1077-1091.
Shapiro, Carl, and Joseph E. Stiglitz (1984): “Equilibrium unemployment as a worker discipline device.” American Economic Review, 74(3):433-444.
Sheshinski, Eytan (1967a): “Tests of the ‘learning by doing’ hypothesis.” Review of Economics and Statistics, 49(4):568-578.
Sheshinski, Eytan (1967b): “Optimal accumulation with learning by doing.” In Karl Shell (ed.), Essays on the Theory of Optimal Economic Growth. Cambridge, MA: M.I.T. Press, pp. 31−52.
Shleifer, Andrei (1986): “Implementation cycles.” Journal of Political Economy, 94(6):1163-1190.
Sinclair, Gavin, Steven Klepper, and Wesley Cohen (2000): “What’s experience got to do with it? Sources of cost reduction in a large specialty chemical’s producer.” Management Science, 46(1):28-45.
Solow, Robert M. (1957): “Technical change and the aggregate production function.” Review of Economics and Statistics, 39(3):312-320.
Solow, Robert M. (1994): “Perspectives on growth theory.” Journal of Economic Perspectives, 8(1):45-54.
Spence, A. Michael (1977): “Entry, capacity, investment and oligopolistic pricing.” Bell Journal of Economics, 10(1):1-19.
Spence, A. Michael (1981): “The learning curve and competition.” Bell Journal of Economics, 12(1):49-70.
Stein, Jeremy C. (1997): “Waves of creative destruction: Firm-specific learning-by-doing and the dynamics of innovation.” Review of Economic Studies, 64:265-288.

57
Stokey, Nancy L. (1986): “The dynamics of industry-wide learning.” In W.P. Heller, R.M. Starr, and D.A. Starrett (eds), Essays in Honor of Kenneth Arrow Volume II. Cambridge, UK: Cambridge University Press.
Stokey, Nancy L. (1988): “Learning by doing and the introduction of new goods.” Journal of Political Economy, 96(4):701-717.
Stokey, Nancy L. (1991): “The volume and composition of trade between rich and poor coun-tries.” Review of Economic Studies, 58(1):63-80.
Tambe, Prasanna, and Lorin Hitt (2007): “The effects of measurement error on knowledge spill-over estimates.” Working paper, Wharton School, University of Pennsylvania.
Thompson, Peter (2000): “Learning from the experience of others: Parameter uncertainty and economic growth in a model of creative destruction.” Journal of Economic Dynamics and Control, 24(9):1285-1313.
Thompson, Peter (2001): “How much did the Liberty shipbuilders learn? New evidence for an old case study.” Journal of Political Economy, 109(1):103-137.
Thompson, Peter (2007): “How much did the Liberty shipbuilders forget?” Management Sci-ence, 53(6):908-918.
Thornton, Rebecca Achée, and Peter Thompson (2001): “Learning from experience and learning from others: An exploration of learning and spillovers in wartime shipbuilding.” Ameri-can Economic Review, 91(5):1350-1368.
Wagner, Joachim (1994): “The post-entry performance of new small firms in German manufac-turing industries.” Journal of Industrial Economics, 42:141-54.
Waldman, J. Deane, Steven A. Yourstone, and Howard L. Smith (2003): “Learning curves in health care.” Health Care Management Review, 28(1):41-54.
Watkins, Patrick N. (2001): “The persistence of learning and acquisition strategies.” Acquisition Review Quarterly, Winter:15-30.
Wenders, John T. (1971): “Excess capacity as a barrier to entry.” Journal of Industrial Eco-nomics, 20(1):14-19.
Wilcox, Nathaniel T. (2006): “Theories of learning in games and heterogeneity bias.” Economet-rica, 74(5):1271-1292.
Wright, Theodore P. (1936): “Factors affecting the cost of airplanes.” Journal of the Aeronauti-cal Sciences, 3(4):122-128.
Yelle, Louis E. (1979): “The learning curve: Historical review and comprehensive survey.” Deci-sion Sciences, 10(2):302–328.
Yorukoglu, U. Mehmet (1998): “The information technology productivity paradox.” Review of Economic Dynamics, 1(2):551-592.
Young, Alwyn (1991): “Learning by doing and the dynamic effects of international trade.” Quarterly Journal of Economics, 106(2):369-405.
Young, Alwyn (1993): “Invention and bounded learning by doing.” Journal of Political Econ-omy, 101(3):443-472.
Young, Alwyn (1998): “Growth without scale effects.” Journal of Political Economy, 106(1):41-63.