learning from the fcc’s lifeline broadband pilot projects · learning from the fcc’s lifeline...
TRANSCRIPT

Learning from the FCC’s Lifeline Broadband Pilot Projects
March 2016
Scott Wallsten
1099 NEW YORK AVE, NW SUITE 520 WASHINGTON, DC 20001 PHONE: 202.828.4405 E-MAIL: [email protected] WEB: www.techpolicyinstitute.org

Learning from the FCC’s Lifeline Broadband Pilot Projects Scott Wallsten* March 23, 2016
Abstract In 2013, the Federal Communications Commission facilitated 14 experimental broadband Lifeline projects proposed by wireline and wireless broadband providers around the country. The projects tested consumer responses to a range of issues, including preferences for speed, the effects of different levels and types of discounts, and the effectiveness of different methods of outreach. In order to focus on the unconnected, participants could not have subscribed to broadband service within the past 60 days. In practice, the vast majority of them had never had broadband. The most consistent result was unexpected: an extremely low participation rate. Wireline providers and mobile providers (except those in Puerto Rico) managed to sign up less than 10 percent of the number of participants they had expected despite extensive outreach efforts. Puerto Rico mobile providers met their participation goals probably because of mass-market television advertising. These results demonstrate the difficulty of encouraging low-income people without connections to sign up even with large discounts, suggesting that subsidies are likely to go to people who already subscribe rather than working to close the digital divide. The trials also revealed subscribers’ willingness to trade off speed for lower prices, with subscribers regularly choosing plans that offered less than 10 Mbps, which is the FCC’s current required minimum for rural broadband subsidies. Because faster broadband typically costs more, higher minimum speeds are likely to blunt the (already likely low) beneficial effects of subsidies by increasing the price of eligible plans. Finally, subscribers generally expressed a preference to avoid digital literacy training classes. In one project, many participants were willing to forego an additional $10 per month savings or a free computer in order to avoid taking those classes. However, those results do not necessarily mean digital literacy training is not, or could not be, beneficial. The data from the pilot programs (weakly) show that those who took such classes were somewhat more likely to continue to subscribe once the subsidies expired. While that may reflect a self-selection effect, it nevertheless suggests that digital literacy training can plan a role. Still, the results also suggest that digital literacy training should be studied further to evaluate which aspects of it are most effective.
* I thank Brandon Silberstein for excellent research assistance and Tom Lenard for comments. All mistakes are my own. This paper represents my views alone, and not necessarily those of TPI, its staff, or its board of directors
1

Introduction The FCC is set to vote on an order that would allow Lifeline subsidies to be used for broadband rather than only voice. The reforms are timely, but if the Commission truly wants to encourage more low-income people to connect, it must confront two difficult issues. First and most importantly, how will the program try to ensure that the subsidy goes primarily to people who do not currently have Internet access or would not purchase it anyway? This question is crucial because if the subsidy goes to people who would otherwise be connected, then it becomes a general welfare program rather than a program that encourages adoption. Second, should the Commission set a minimum speed that qualifies for subsidy? This question matters because higher speeds generally mean higher prices, which means that higher speeds may cause some people to choose not to sign up and that others may end up paying more for additional speeds that they do not particularly value. As part of its process to modernize the Lifeline program, which provides telecommunications subsidies to low-income people, the FCC worked with 14 providers to test different ways of encouraging people without broadband connections to join the network.1 Those 14 providers took different approaches to testing different aspects of low-income broadband support, including randomized controlled trials, quasi-experimental, and non-experimental designs. For both fixed and mobile broadband service they tested the effects of up-front and recurring prices on adoption, digital literacy on adoption and retention, and (for mobile) consumer preferences for devices. Yet, the Lifeline reform process appears to have largely ignored the information generated by these experiments, despite an excellent FCC Staff Report summarizing and analyzing them.2 While the Notice of Proposed Rulemaking extensively and approvingly cites pilots by other organizations purporting to support its ideas of required services,3 of its own pilots it notes supposed shortcomings of the studies and asks whether the Staff Report and “underlying data will provide guidance to the Commission as it considers reforms to the Lifeline program.”4 The answer to the Commission’s question is “yes.” The pilot projects are the only real-world information that exists on the likely effects of broadband subsidies to low-income people and, therefore, they are worth a close look. With respect to Lifeline reforms, the pilots yield two important lessons. First, it is exceedingly difficult to encourage the disconnected to subscribe. Subsidies are likely to go to people who already subscribe and to generate few new subscribers. Second, new low-income subscribers are
1 For a detailed description of the pilot process, see Wireline Competition Bureau, “In the Matter of Lifeline and Link Up Reform and Modernization” (Federal Communications Commission, December 19, 2012), https://apps.fcc.gov/edocs_public/attachmatch/DA-12-2045A1.pdf. 2 Wireline Competition Bureau, “Low-Income Broadband Pilot Program,” Staff Report (Federal Communications Commission, May 22, 2015), https://apps.fcc.gov/edocs_public/attachmatch/DA-15-624A1.pdf. 3 Federal Communications Commission, “In the Matter of Lifeline and Link Up Reform and Modernization | Telecommunications Carriers Eligible for Universal Service Support | Connect America Fund,” June 22, 2015, paras. 5, 18, 20, 21, https://apps.fcc.gov/edocs_public/attachmatch/FCC-15-71A1.pdf. 4 Ibid., para. 31.
2
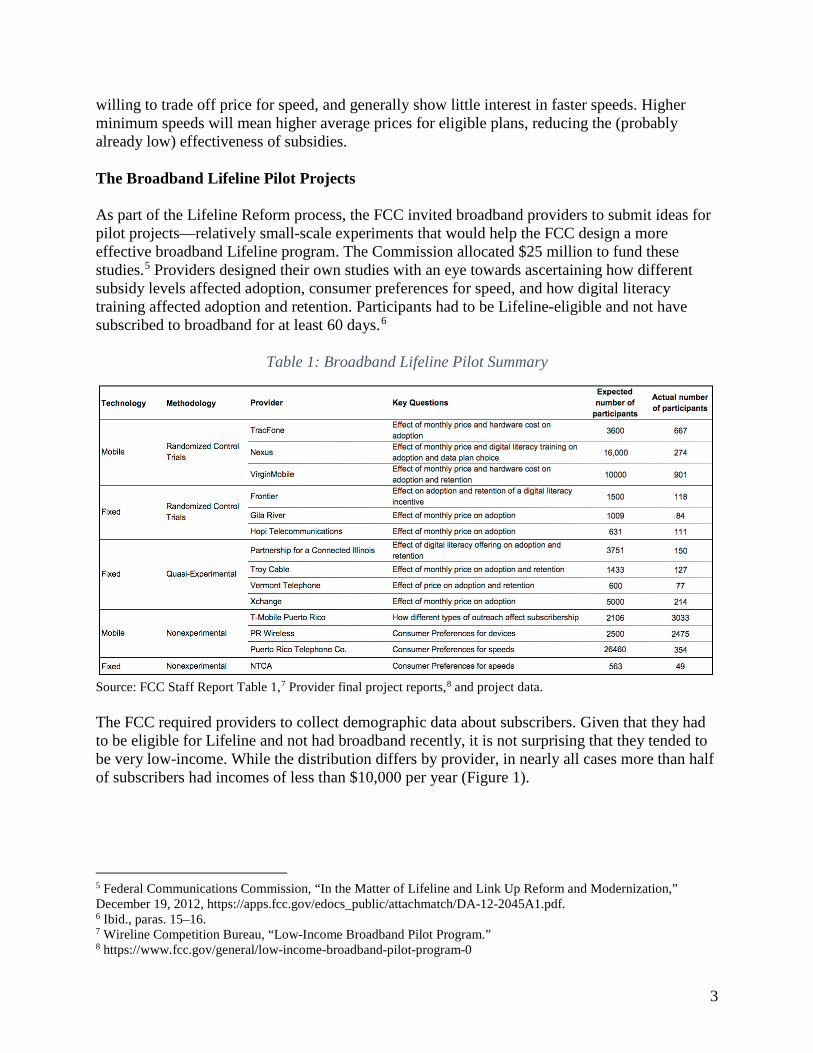
willing to trade off price for speed, and generally show little interest in faster speeds. Higher minimum speeds will mean higher average prices for eligible plans, reducing the (probably already low) effectiveness of subsidies. The Broadband Lifeline Pilot Projects As part of the Lifeline Reform process, the FCC invited broadband providers to submit ideas for pilot projects—relatively small-scale experiments that would help the FCC design a more effective broadband Lifeline program. The Commission allocated $25 million to fund these studies.5 Providers designed their own studies with an eye towards ascertaining how different subsidy levels affected adoption, consumer preferences for speed, and how digital literacy training affected adoption and retention. Participants had to be Lifeline-eligible and not have subscribed to broadband for at least 60 days.6
Table 1: Broadband Lifeline Pilot Summary
Source: FCC Staff Report Table 1,7 Provider final project reports,8 and project data. The FCC required providers to collect demographic data about subscribers. Given that they had to be eligible for Lifeline and not had broadband recently, it is not surprising that they tended to be very low-income. While the distribution differs by provider, in nearly all cases more than half of subscribers had incomes of less than $10,000 per year (Figure 1).
5 Federal Communications Commission, “In the Matter of Lifeline and Link Up Reform and Modernization,” December 19, 2012, https://apps.fcc.gov/edocs_public/attachmatch/DA-12-2045A1.pdf. 6 Ibid., paras. 15–16. 7 Wireline Competition Bureau, “Low-Income Broadband Pilot Program.” 8 https://www.fcc.gov/general/low-income-broadband-pilot-program-0
3

Figure 1: Income Distribution of Subscribers to Broadband Lifeline Pilots by Provider
The FCC Staff Report describes each project and highlights the main conclusions from each.9 This paper, by contrast, builds on that report to tease out lessons that might be applied to Lifeline reforms. Encouraging the Disconnected to Sign Up is Difficult If Lifeline is to help close a digital divide it must encourage those who do not currently subscribe to sign up for some type of broadband service. The pilot programs show, however, that it is challenging to entice this group to connect. Many of the participating companies expected to see thousands of new subscribers to the discounted broadband plans they were offering based on the number of invitations they sent out. Instead, the number of subscribers was typically in the hundreds or less (Figure 2). XChange expected 5,000 people to subscribe, but only found 214 takers. Frontier expected 1,500 people to respond to its discounted offers, but ultimately only 118 people signed up.
9 Wireline Competition Bureau, “Low-Income Broadband Pilot Program,” Staff Report (Federal Communications Commission, May 22, 2015), https://apps.fcc.gov/edocs_public/attachmatch/DA-15-624A1.pdf.
0%
10%
20%
30%
40%
50%
60%
70%
80%
90%
100%
TMobilePR
PRTelco
Tracfone Nexus Troy Frontier GilaRiver
NTCA PCI PRWireless
VirginMobile
<$5k $5k-$9.9k $10k-$19.9k $20k-$29.9k $30k+
4

Figure 2: Expected vs. Actual Subscribers to Pilot Projects
These low numbers were not for lack of trying. Partnership for a Connected Illinois, for example, notes,
Partnering with Citizens Utility Board, PCI developed marketing materials advertising the program benefits, with pricing tailored to each ETC’s rates. Flyers were placed in community areas and postcards were mailed to every household in ETC area zip codes. Marketing materials directed interested parties to call a toll-free number to determine eligibility. Throughout the project, additional marketing was done via newspaper advertisements, editorials, billing inserts, school district competitions, and via televisions.10
Other providers invariably noted similar efforts to advertise their projects with similarly poor response. Nexus Communications discussed the low response rate in its final report.11 The provider hypothesized that the low number of subscriptions was due to three factors. First, even the discounts the program offered were not enough to entice these very low-income consumers.
10 Lacey Buss, “FCC Broadband Lifeline Pilot Project Final Report” (Partnership for a Connected Illinois, February 15, 2015), 1, http://apps.fcc.gov/ecfs/document/view?id=60001039221. 11 Nexus Communications, Inc., “FCC Broadband Lifeline Pilot Project Final Report,” May 18, 2015, http://apps.fcc.gov/ecfs/document/view?id=60001047836.
5

Second, its potential pool of consumers was not sufficiently digitally literate. Third, potential subscribers may have been hesitant to sign up with the subsidies expiring after 18 months.12 Unfortunately, it is not possible to test those hypotheses with the data available. Other pilots provide some additional insight, however.
Mass Marketing (TV and Print) Attracted Signups The two exceptions to the low response rate were Puerto Rico Wireless and T-Mobile Puerto Rico. PR Wireless came within a whisker of its goal of 2,500 subscribers, while T-Mobile PR exceeded its goal by more than 900 subscribers. It is possible that there is something unique about Puerto Rico—after all, it is poorer and has lower broadband penetration than any state. The experience of Puerto Rico Telephone Company, however, casts doubt on that theory—it expected to sign up more than 26,000 people, but attracted only 354. Another possibility is that differences in outreach affected signup. Fortunately, T-Mobile designed its experiment to evaluate the effectiveness of different types of advertising (Figure 3).
Figure 3: T-Mobile Signups and Advertising Type
Sources: T-Mobile Final Report.13
12 http://apps.fcc.gov/ecfs/document/view?id=60001047836 pp.13-16. 13 Main figure is http://apps.fcc.gov/ecfs/document/view?id=60001048054 Figure p.50. Data on advertising type from http://apps.fcc.gov/ecfs/document/view?id=60001048053 p.38; http://apps.fcc.gov/ecfs/document/view?id=60001048053 p.26.
0
100
200
300
400
500
600
May1-4
May6-1
May13-18
May20-25
May27-31
Jun1-8
June10-15
June17-22
June23-30
July1-6
July8-13
July15-20
July22-27
July29-31
TV Print SMS DM
6

T-Mobile noted that direct marketing yielded the weakest response—even word-of-mouth and in-store marketing were more effective. Its most effective advertising was via mass-market print and, primarily, TV. It is probably not a coincidence that the two companies that used mass-market advertising, including television, had the highest signup rates.
Many of Those Who Tried To Sign Up Already Had Broadband Of course, the problem with mass-market advertising is that it does not specifically target those who do not have broadband, and it would be natural for people who already have broadband to respond to advertisements for something that would reduce the price they pay. To participate in the pilots, subscribers had to certify that they had not subscribed to broadband for some period of time. In addition to the number of subscribers, TracFone also provided the number of people who applied to the program. TracFone noted that it sent out 67,016 offers, received 12,038 applications, approved 5,505 applications, and, finally, 881 signed up.14 In addition, Tracfone noted that slightly more than half of those rejected were turned down because they had broadband sometime within the past six months. Figure 4 shows this information.
Figure 4: TracFone Pilot Application Pipeline
Source: TracFone (2015).15
14 The raw data indicate Tracfone signed up 667 subscribers, which I take as the true number. For the purposes of this discussion, however, I will use the number Tracfone supplied in its report. 15 TracFone Wireless, Inc., “TracFone Wireless, Inc. Broadband Adoption Lifeline Pilot Program Report,” February 13, 2015, 3.
0
2000
4000
6000
8000
10000
12000
Applications Approved Subscribers Rejected-hadbroadband
Rejected -other reasons
7
If more than 25 percent of those who applied but already had broadband were given subsidies rather than being rejected, the pilot would have yielded more inframarginal subscribers than additional subscribers. These results reveal deep, existential questions about Lifeline with which the Commission should grapple. Connecting the disconnected—the group that we should want to target with these subsidies if the goal is to reduce the digital divide—is difficult. Pilot project subsidies failed to entice many people to subscribe, suggesting that subsidies given to anyone who meets income-based criteria are likely to go largely to those who already have broadband. In that case, the Universal Service Fund becomes an inefficient general welfare fund rather than a mechanism that encourages connectivity. Targeting those who are not connected requires having recipients certify, like pilot participants did, in some way that they have not had broadband recently. Additionally, if people come to value the Internet more once they are connected, then it would raise the question of how the Commission should reevaluate a recipient’s eligibility over time. And, of course, the Commission has to balance the need to target subsidies with the costs of doing so—it is likely that better targeting effectiveness is likely to require greater costs. Why Weren’t People Interested? Several surveys have investigated why people do not subscribe to broadband. Generally, people cite some version of the service being too expensive. For example, a 2015 Pew survey found that 33 percent of responding non-subscribers said the monthly cost was too high, while another 10 percent said the equipment was too expensive.16 The surveys of subscribers done as part of the pilot projects are partially consistent with those results but suggest that the reasons are more complicated. Specifically, most state that they did not subscribe in the past due to price, but also do not cite “good price” as a primary reason for participating in the pilot. Subscribers to pilot programs commonly reported service being too expensive as the main reason for not subscribing in the past, though they also reported other reasons for not subscribing (Figure 5).17 And, to be sure, in each pilot program more people subscribed to the less expensive plans, confirming, at least, that broadband is a normal economic good even to very low-income people.
16 http://www.pewinternet.org/2015/12/21/home-broadband-2015/pi-2015-10-21_broadband2015-02/ 17 Puerto Rico Telephone Company and Nexus Communications are the exceptions. In both cases too expensive was the second-most commonly cited reason for not having subscribed in the past.
8

Figure 5: Share of Subscribers Reporting Reason for Not Subscribing Previously, Top 3 Reasons
But even though many reported not having subscribed in the past due to price, the same people did not report using the Internet through the pilot program because the provider offered a good price (Figure 6). Instead, they offered a myriad of reasons and activities for participating. By far the most common top reason provided was that the subscriber wanted to use the Internet for staying in touch with friends and family. The second-most cited reason at four providers was to get medical information. “Good price” was the most commonly cited reason for subscribing only among Nexus subscribers, and it was the second-most cited reason for T-Mobile Puerto Rico subscribers.
9

Figure 6: Share of Subscribers Reporting Use of Internet in Pilot Program, Top 3 Reasons/Activities
In other words, even though the non-connected report that they did not subscribe because of price, when they do finally subscribe, for the most part it is not primarily because of price. This combination of answers, of course, seems nonsensical: the top reasons they did not subscribe previously was price, but the reason they did subscribe now is generally not because they got a good price. Part of the reason is probably because the survey does not ask precisely the same question, and the post-subscription question is confusing. The survey first asks for “reasons for not previously obtaining broadband,” with one possible answer being “monthly cost too expensive.” But rather than asking directly about reasons for subscribing, the survey asks “reasons for use of Internet,” although the possible responses, such as “Internet provider offered a good price,” “children need it for school,” “subscriber needs it for school,” and “children want Internet access” make more sense as answers to the question “why did you subscribe now.” Thus, the answers are probably a muddled combination of why they like to use the Internet and why they subscribed now. Should the FCC Set a Minimum Speed? In its NPRM the FCC inquired about setting minimum service levels. As the Commission put it,
10
We propose to establish minimum service levels for fixed and mobile voice and broadband service that Lifeline providers must offer to all Lifeline customers in order to be eligible to receive Lifeline reimbursement….We believe taking such action will extract the maximum value for the program, benefitting both the recipients as well as the ratepayers who contribute to the USF. It also removes the incentive for providers to offer minimal, un-innovative services that benefit providers, who continue to receive USF support above their costs, more than consumers. We also believe it is consistent with our statutory directives. We seek comment on this proposal.18
The contention, however, that it will extract “maximum value” by setting a minimum speed implicitly assumes that all consumers value certain speeds equally and that they place sufficiently higher values on higher speeds to offset any increased cost of those higher speeds. Additionally, there is no reason to believe that providers would necessarily earn higher profits from the program by offering lower speeds—indeed, given approximately the same marginal costs, higher prices from higher speeds could yield higher profits. In short, the Commission is drawing conclusions on the benefits of higher speeds for which it has presented no evidence. The pilot projects, meanwhile, show that consumers are willing to trade off speed for lower prices. Consider Frontier’s experiment.19 Frontier designed a project intended to test aspects of digital literacy training, but its design also makes it possible to see how low-income consumers trade off speed and price. In particular, Frontier offered different speeds at different prices (and with different incentives). The different types of incentives, discussed below, make it difficult to compare plan prices in an apples-to-apples sense. The incremental price between speed tiers is identical regardless of the incentive type offered to consumers. For example, the cheapest plan offered 1 Mbps down and 128 Kbps up and cost $1.99 per month, although the subscriber was required to take a digital literacy course. Other groups had to pay $11.99 for the 1Mbps/128Kbps plan. But regardless of the group, subscribers faced the same price increases for choosing speedier plans. It cost an additional $3 per month to get 6Mbps/1Mbps, $10 to get 12Mbps/1Mbps, and $20 to get 24Mbps/1Mbps, with those prices all relative to the 1Mbps/128Kbps plan. Regardless of the set of prices and incentives offered, subscribers almost all chose the 6 Mbps/1 Mbps (Figure 7). 96 percent of subscribers were willing to pay an additional $3 to get more than the slowest plan, but less than one percent—only one subscriber, in fact—was willing to pay an additional $10 per month to go to 12 Mbps. Nobody was willing to pay an additional $20 per month to go to 24 Mbps.
18 Federal Communications Commission, “In the Matter of Lifeline and Link Up Reform and Modernization | Telecommunications Carriers Eligible for Universal Service Support | Connect America Fund,” para. 34. 19 Details on Frontier’s project are available here: https://www.fcc.gov/general/frontier-pilot-project.
11

Figure 7: Frontier Subscribers by Speed and Incremental Price
This relationship is visible when analyzing all the data from the 14 projects pooled together into a single dataset. The FCC smartly required all the companies to provide the same variables.20 Each company provided two datasets. The project dataset contains information on each plan offered, including information on discounts, prices, the technology used, speeds, how many people were offered the plan, and how many people subscribed. The subscriber dataset contains detailed information about the subscribers, gathered by a survey the providers were required to conduct. To explore how prices and speeds affect subscribership I estimate three versions of the following equation:
𝑦𝑦𝑖𝑖𝑖𝑖 = 𝑓𝑓�𝑑𝑑𝑑𝑑𝑑𝑑𝑑𝑑𝑑𝑑𝑑𝑑𝑑𝑑𝑑𝑑 𝑠𝑠𝑠𝑠𝑠𝑠𝑠𝑠𝑑𝑑𝑖𝑖𝑖𝑖,𝑑𝑑𝑑𝑑𝑑𝑑𝑑𝑑𝑑𝑑𝑑𝑑𝑑𝑑𝑑𝑑 𝑠𝑠𝑠𝑠𝑠𝑠𝑠𝑠𝑑𝑑𝑖𝑖𝑖𝑖2 ,𝑠𝑠𝑝𝑝𝑝𝑝𝑝𝑝𝑠𝑠𝑖𝑖𝑖𝑖, 𝑠𝑠𝑠𝑠𝑑𝑑𝑑𝑑𝑑𝑑𝑑𝑑𝑑𝑑𝑑𝑑𝑑𝑑𝑠𝑠 𝑏𝑏𝑏𝑏𝑑𝑑𝑖𝑖𝑖𝑖 ,𝐷𝐷𝐷𝐷𝑖𝑖𝑖𝑖, 𝛾𝛾𝑖𝑖� where i indicates the provider, p indicates the broadband plan being offered, yip is the number of subscribers to plan p offered by provider i, download speed is the download speed of the plan, standalone bbd is indicates whether the offered plan is broadband only or bundled with other features, DL is whether digital literacy training is offered along with the plan, and 𝛾𝛾i are provider fixed effects. Additionally, I estimate this equation only for wireline providers as wireless providers typically did not advertise speeds.
20 The providers did not always enter the data the same way. For example, a plan offering 4 Mbps down and 1 Mbps up might be entered as “4 Mbps down and 1 Mbps up” or “4/1” and so on. This issue required some modest data cleaning.
12

The first version of the equation uses the number of subscribers as the dependent variable and controls for the number of offers made. The second version is a log-transformation of the same specification. The final version uses the number of subscribers as a share of offers as the dependent variable. Table 2 shows the results of these regressions.
Table 2: Regression Results, Subscribers on Plan Characteristics
The table shows, not surprisingly, that people subscribe to less expensive plans, all else equal. It also shows that, all else equal, people subscribe to plans with faster bandwidth, but only up to a point. The negative coefficient on the squared download speed variable shows that the increase in the number of subscribers to a plan decreases as the speed increases. Indeed, these estimates suggest that higher speeds are associated with reduced subscribership once the speeds go beyond 50 Mbps. However, the sample size at those higher speeds is so small that the 95 percent confidence interval is large. These estimates also make it possible to compare the incremental effects of price and speed. Figure 8 shows this analysis. The top (blue) line shows the effects of changes in speeds when a plan costs $0 per month. The middle (red) line shows the effects of changes in speed when a plan
13

costs $10 per month. The bottom (green) line shows the effects of changes in speed when a plan costs $20 per month.
Figure 8: Incremental Effects of Speed and Price on Subscribership
Following the blue line across the x-axis, therefore, shows how the number of subscribers as a share of offers would be expected to change (based on the regression estimates) as speed increases from 1 Mbps to 5 Mbps and so on. Similarly, dropping from a point on the blue line to a point on the red line shows how much the regression predicts subscribership to drop as the price increases from $0 per month to $10 per month. The figure shows that the price effect is larger than the speed effect. For example, for any given price, increasing the download speed from 1 Mbps to 5 Mbps increases subscribers as a share of offers by 0.03 percentage points. Increasing the price from $0 to $10 per month at 5 Mbps decreases the share by 0.12 percentage points. While it is not immediately obvious how one should compare changes in speed to changes in price, the regression suggests that plausible changes in speed have a much smaller positive effect than the negative effect from plausible changes in price. These results have implications for the FCC’s plan to set a minimum eligible speed. Faster speeds typically cost consumers more, meaning the faster the FCC sets the minimum speed the more expensive Lifeline-eligible plans will be, on average. Given that broadband demand is
14

downward-sloping even for the very poor, the more expensive those plans are, the fewer people that will benefit from them. Digital Literacy Training and Sign-Ups Speed and price were only two of the factors the pilots studied. Some experiments also explored the effects of digital literacy training by partnering with established training groups like Connected Nation. In all cases, potential subscribers showed little interest in participating in digital literacy training; in fact, subscribers were often willing to pay to avoid having to attend classes. Frontier’s pilot was the only one designed to explicitly explore how potential subscribers viewed digital literacy training. Frontier randomly assigned potential subscribers to a treatment and a control group. Both groups were offered a $20/month subsidy over regular subscription rates. The experimental group was offered an additional set of incentives to take digital literacy classes—either an additional $10 per month discount plus waiving a one-time $34.99 fee or a free computer. While 59 people took the additional incentives along with digital literacy, 58 others were willing to forgo those incentives in order to avoid the training program (Figure 9). Among the control group, which was offered the discount but also had to take digital literacy training, only a single person signed up.
Figure 9: Subscribers to Frontier's Lifeline Pilot by Plan
Similarly, XChange offered potential subscribers a choice of plans that varied by price, features, and availability of free digital literacy training. Not surprisingly, the cheapest plan ($4.99 per
15

month) with the most features (broadband bundled with nationwide calling) was the most attractive (Figure 10). However, not a single person wanted the free digital literacy training.
Figure 10: XChange Subscribers by Plan and Price
It is important to note, however, that the lack of desire to take a digital literacy training course does not necessarily mean that digital literacy training is not useful. After all, Horrigan (2014) estimated that nearly one-third of adult Americans had little understanding of basic Internet terms or confidence in using computers.21 Additionally, “digital literacy” does not have only a single meaning, and some classes might be valuable while others might not be. Second, a participant has to spend time on a class, so even a supposedly “free” class is not truly free. Potential subscribers may not have the time to spare or otherwise do not believe the class would be helpful. Weak evidence from the pilots suggests that people who take digital training classes continue subscribing longer than others. Frontier subscribers that agreed to take digital literacy training were more likely to continue subscribing after the subsidy period ended (Figure 11).
21 John B. Horrigan, “Digital Readiness: Nearly One-Third of Americans Lack the Skills to Use next-Generation ‘Internet of Things’ Applications,” March 2014.
$14.99$9.99
$4.99$4.99 + digital literacy
0
20
40
60
80
100
120
140
160
standalone bb+localvoice
bb+metrovoice
bb+usavoice
16

Figure 11: Share of Frontier Subscribers Continuing to Subscribe After Subsidies End by Whether They Took Digital Literacy Classes
The Partnership for Connected Illinois (PCI) generated three groups related to digital literacy: subscribers who were offered training and accepted it, those who were offered it and rejected it, and others who were not offered training. Like with Frontier, PCI subscribers who took the digital literacy training were somewhat more likely to continue subscribing after the subsidies ended than those who did not (Figure 12). Figure 12: Share of PCI Subscribers Continuing to Subscribe After Subsidies End, By Whether
They Took Digital Literacy Classes
One curious result is that those who were not offered digital literacy had the lowest rate of continued subscription following the end of the subsidies, suggesting that perhaps something regarding how they were chosen for that group was related to the outcome.
0%
10%
20%
30%
40%
50%
60%
70%
80%
1 month later 2 months later
Did not take DL Took DL
0%
10%
20%
30%
40%
50%
60%
70%
80%
90%
1 month later 2 months later 3 months later
offered/accepted offered/declined Not offered/not taken
17

It is also possible that the training itself was not responsible for the longer subscriptions, but that people self-selected into the training. For example, if new subscribers who were more serious about taking advantage of their subscriptions were more likely to participate in the training classes, then those may have been the same people who would have stayed on longer even without training. However, in this case the self-selection is not necessarily bad: having classes available for highly-motivated people may present opportunities to provide them with more advanced training. Overall, the experiments involving digital literacy suggest that potential subscribers generally do not see the value in such training classes. At the same time, those who do take these classes seem to continue to subscribe even without the subsidies at a higher rate than those who do not take the classes. It is clear that digital literacy training requires more study to understand why so many new subscribers reject them and to disentangle positive effects of the courses from the effects of more motivated people self-selecting into classes. Conclusion The FCC is to be commended for encouraging and funding pilot projects. Such experimentation should be required before spending billions of dollars on new programs. In this case, the experiments revealed fundamental challenges facing Lifeline reforms. Most importantly, the pilots demonstrate the difficulty in connecting the unconnected, even with subsidies. Because of this difficulty, the subsidies are likely to go primarily to people who already have broadband. The problem of subsidizing people who already have service presents a difficult challenge to any Lifeline reform. In particular, if the program is intended to help close the digital divide, then it must encourage those who do not have connections to subscribe. Moreover, once someone does subscribe for the first time, how long should the subsidies continue? If new subscribers derive sufficient value from being connected then at some point a subsidy should become unnecessary. However, targeting those who would not subscribe without subsidies is likely to be difficult and identifying when they no longer need subsidies even harder. Given the already high costs of the program, adding additional costs seems unwise. But without some effort to ensure that subsidies are necessary to encourage and sustain broadband connectivity among low-income people, the subsidy risks becoming general welfare support. And while recipients, who generally tend to have very low incomes, will benefit from any subsidy, it is not the FCC’s role to provide general welfare support. Moreover, given the way money is raised for the program—through regressive taxes on telecommunications services—the net result could still be negative for low-income consumers. If the FCC truly wants to help close the digital divide it will take the pilot programs seriously, consider their implications, and confront the difficult challenges they imply before committing an additional $2.5 billion per year.
18