learning how to learn from failures: the fukushima nuclear
TRANSCRIPT

1
Learning how to learn from failures: the Fukushima nuclear disaster1
Ashraf Labib*1
and M.J. Harris**
*University of Portsmouth, UK
**University of Manchester, UK
1 Corresponding Author
ABSTRACT Analysis of the Fukushima nuclear reactor disaster will show how to learn from failures using
multi-models. This type of analysis can enrich the modelling of causal factors, provide
insight into policy making and support decisions for resource allocations to prevent such
disasters.
The analysis presented here is based on a workshop on learning from failures in which
participants were first given a brief about the related theory, then an introduction to the
analytical techniques that can be used such as FTA, and RBD. They were then given a brief
in the form of a narrative of the accident derived from investigation reports and divided into
small groups tasked to analyse the disaster and to present their recommendations both orally
and in a written report.
All the participants were asked to follow a certain presentation format. Firstly there would be
a technical account of the sequence of events that would be based on research of greater
depth than provided in the initial summary, one related more to the scope of their analysis.
This would be followed by a review of the consequences of the accident, a presentation of
their multi-model analysis of the event and a summary of generic lessons and
recommendations to prevent future failures of such systems. Finally, collective feedback,
focused on the generic lessons gained, was offered.
KEYWORDS Fukushima, Hydrogen explosion, common mode failure, loss of cooling, design failure, fault
tree.
1. Introduction
In the wake of the Fukushima disaster few investigation reports, aimed at explaining the
accident and outlining the lessons learnt, have been published. Most notably, it has been
suggested that in the nuclear power industry, probabilistic safety assessment (PSA) is under-
1 This research builds on and extends previous work presented at the PSAM Conference, 2014, and in chapter
9 of Labib (2014).

2
utilized. A report of the Japanese government to the International Atomic Energy Agency
(IAEA) observed that “…. PSA in risk management has not always been effectively utilized in
the overall reviewing processes or in risk reduction efforts at nuclear power plants” (Report,
2011). Moreover, the British Office of Nuclear Regulation (ONR) final report on Fukushima
commented that “This [under-utilization of PSA in the nuclear power sector] is an important
lesson, … effective use of PSA could have helped to prevent accidents like that at Fukushima
escalating and deal with them should they occur”(Weightman, 2011b). In the same report the
final recommendations include “The circumstances of the Fukushima accident have
heightened the importance of Probabilistic Safety Analysis for all nuclear facilities that could
have accidents with significant off‐site consequences”. Also responding to the Fukushima
disaster George Apostolakis of the United States Nuclear Regulatory Commission (NRC),
has argued that “probabilistic risk assessment (PRA) can support a more holistic,
performance-based safety case, with an appropriate emphasis on systems and components
that are shown to contribute the most to technological risk” (Apostolakis, 2012).Others have
also supported the use of PRA approaches in the nuclear industry (Mohagheg and Mosleh,
20013; Labib, 2013). In this paper the Fukushima disaster is analysed and a hybrid modelling
approach, using PSA- related techniques, is developed. It is hoped that through the provision
of an example of PRA/PSA tools used to analyse Fukushima disaster, such analysis can lead
to the realisation of a learning culture within organizations and governments.
Although the literature on organizational learning has been well established since the seminal
work of Cyret and March (1963) and Argyris and Schon (1979), the literature in the field of
learning from rare events of high severity is largely multi-disciplinary and fragmented (Saleh
et al, 2010; Pidgeon and O'Leary, 2000). A reason for its being treated as marginal to the
mainstream research has probably been the perception that such a field of research was a
statistical outlier (Lampel et al., 2009). Also, there have been few text books on this topic,
other than those of Turner (1978) on man-made disasters and Kletz (1991) on learning from
accidents. The fragmentation of the topic has been reflected in the variety of its names, e.g.
Learning from Incidents, Learning from Disasters, Learning from Major Events and Near
Misses, and Learning from Crises. Recently, however, there has been a revival of interest and
research activity, the Journal of Safety Science dedicating an issue to learning from events
and near-misses (Carroll and Fahlbruch, 2011) and another to learning from accident reports
(Dechy et al, 2012), The Journal of Contingencies and Crisis Management running an issue
on learning from crises and major accidents (Deverell and ans n and The Journal of
Organization Science publishing a special on rare events and organizational
learning (Lampel et al., 2009). Also recently published have been reviews of the literature on
learning from incidents, accidents and disasters (Lindberg et al, 2010; Lukic et al, 2010; Le
Coze, 2013; Drupsteen and Guldenmund, 2014). In a recent work by Saleh et al (2014), an
excellent analysis of a failure of a defense-in-depth (a concept originated in nuclear industry),
was studied and applied to the case of BP Texas refinery accident.
After the Three Mile Island and Chernobyl accidents research in learning from failures has
resulted in recommendations, for becoming learning organizations, specifically addressed to
the nuclear power sector (IAEA, 2002). Unfortunately, these have not been matched with
guidance on how this could be achieved (Wahlstrom, 2011).One unique feature of nuclear
power plants is that they are initially designed for a very long operational life, typically sixty
years. This poses major challenges such as those of having to cope with technical
developments, new safety requirements and sustaining skills and competencies, over two or
three generations of staff (Wahlstrom, 2011).
3
The following section is a narrative summarizing the abundance of information in the
literature on the Fukushima accident. It is suggested that, the disaster having happened a
while ago, a primary data collection would be of lower quality, as memories have faded and
key observers have dispersed, and a secondary data analysis (which is a proven and widely
used research method) is therefore employed for structuring the problem. This also offers the
possibility of triangulating sources and easy checking by other researchers. The same
narrative was provided in the workshop conducted by the first author. The participants were
then divided into groups, each of which was required to scrutinise the literature to find more
evidence about the disaster and utilize reliability engineering and decision science techniques
in order to analyse the failure and make recommendations. The background of the
participants were practitioners from different industries such as oil and gas, power and
nuclear power generation. They workshop was part of a masters class related to learning from
failures. They were also initially provided with the theoretical background of the tools used in
the analysis such as FTA and RBD.
1.1 The evolution of the disaster. On 11 March 2011 Japan suffered its worst ever recorded
earthquake, known as the Great East Japan Earthquake. It was classified as a seismic
event of magnitude 9.0, with maximum measured ground acceleration of 0.52g
(5.07m/s2). The epicentre was 110 miles E.N.E. from the Fukushima-1 reactor site, where
Reactor Units 1, 2 and 3 were operating at power. On detection of the earthquake all the
units shutdown (tripped) safely.
Initially, on-site power was used to provide essential post-trip cooling. About an hour
after shutdown a massive tsunami, generated by the earthquake, swamped the site and
took out the AC electrical power capability. Sometime later, alternative back-up cooling
was also lost. With the loss of these cooling systems Reactor Units 1 to 3 overheated, as
did a spent-fuel pond in the building containing Reactor Unit 4. This resulted in several
disruptive explosions, because the overheated zirconium-containing fuel-cladding reacted
with water and steam and generated a hydrogen cloud which was then ignited. Major
releases of radioactivity occurred, initially to air but later via leakage to the sea. The
operators struggled to restore full control.
This was a serious nuclear accident, provisionally estimated to be of Level 5 on the
Nuclear Event Scale (INES), a figure which was later amended to a provisional Level 7
(the highest category). The Japanese authorities imposed a 20km radius evacuation zone,
a 30km sheltering zone and other countermeasures. Governments across the world
watched with concern and considered how best to protect those of their citizens who were
residents in Japan from any major radioactive release that might occur (Weightman,
2011a).
Some have commented on reports of plant damage caused by the earthquake itself,
concluding that the loss of effective cooling for the reactors stemmed directly from the
earthquake rather than the subsequent tsunami. However, the information available about
the emergency cooling systems, and analysis of the circumstances, do not support such a
hypothesis (Weightman, 2011b).
This case study is a good example of a double-jeopardy, where the combination of
earthquake and tsunami caused destruction on a scale that was not anticipated in the
4
initial design specifications. For example, the plant was protected by a sea-wall -
designed to withstand a tsunami of 5.7 meters (19 ft), but the wave that struck the plant
on March 11 was estimated to have been more than twice that height, at 14 meters (46 ft).
This, coupled with land movement, ensured that the tsunami caused enormous damage
along the coast (IMechE, 2011).
1.2 The consequences of the failure. The earthquake, occurring under the sea near the north
east coast of Japan, lasted over 90 seconds, and caused widespread damage to property,
although, due to the civil building design standards most structures did not collapse. As a
result of the earthquake Japan has moved 2.4m laterally, and dropped 1m vertically. Also,
the earth’s axis has moved .17m and the length of the earth’s day is now shorter by 1.8
microseconds (IMechE, 2011). This was by any measure a major global event. The 14m
high tsunami travelled up to 10km inland, devastating infrastructure already weakened by
the earthquake. There were approximately 15,000 confirmed deaths and 10,000 people
remain missing. It has been reported that the accident eventually cost Japan between 5-
7% of its GDP, or US$300-600 billion (Kashyap et al, 2011).
The infrastructure affected included many different types of facility: homes, hospitals,
electricity and water supplies, petrochemical and oil installations. However, it can be
argued that the most significant damage, in a global context, was to the Fukushima
nuclear power station. Fukushima itself is a city in the Tohoku Region of Japan,
lying250km north of Tokyo and covering an area of 746.43km2. As of May 2011, it had a
population of 290,064.
The damaged caused by the earthquake and subsequent tsunami, which arrived at 15.41
JST (Weightman, 2011a), resulted in mandatory evacuation of the population within a
20km radius around the site, loss of containment of radiological material to air,
contamination in the sea and in drinking water in Japan.
1.3 The Japanese nuclear power industry. Prior to Fukushima disaster, Japan was heavily
dependent on its nuclear power, with 54 reactors currently in operation: 30 Boiling Water
(BWR) and 24 Pressurised Water (PWR) reactors. The industry is regulated by the
Nuclear Safety Commission (NSC) through the Nuclear and Industrial Safety Agency
(NISA), who are accountable to the government through the Ministry of Economy, Trade
and Industry (METI) (Weightman, 2011a). It was the stated goal of the Japanese
government, prior to this event, that 50% of their electrical power should be nuclear
(although this, of course, may not continue to be the case). In the short to medium term
the Japanese government has suspended operations at Tohoku until the sea defences are
improved, which is estimated could take years to complete. Currently (in 2014), all
nuclear power plants are stopped for safety enhancement, and some of them are preparing
for restart by submitting the additional safety analysis to regulatory body.
In an article in the Guardian newspaper (Guardian, 2013) Mr. Naomi Hirose, president of
the Tokyo Electric Power Company (TEPCO), which runs the Fukushima plant, said
“nuclear managers should be prepared for the worst" in order to avoid repeating Japan's
traumatic experience” and “…we have to keep thinking: what if...” Hirose also said that
“although the situation facing Fukushima Daiichi on 11 March was exceptional,
measures could have been adopted in advance that might have mitigated the impact of the
disaster. TEPCO was at fault for failing to take these steps”. According to him
“preventative measures included fitting waterproof seals on all the doors in the reactor

5
building, or placing an electricity-generating turbine on the facility's roof, where the
water might not have reached it. In addition, wrong assumptions were made” he said.
Finally he concluded with the following lesson: “What happened at Fukushima was, yes,
a warning to the world," The resulting lesson was clear: "Try to examine all the
possibilities, no matter how small they are, and don't think any single counter-measure is
fool proof. Think about all different kinds of small counter-measures, not just one big
solution. There's not one single answer. We made a lot of excuses to ourselves … Looking
back, seals on the doors, one little thing, could have saved everything”.
1.4 Some basic information about risk assessment in the nuclear industry. The
International Nuclear and Radiological Event Scale (INES) was introduced in 1990, and
updated in 2013 by the IAEA (2013) in order to enable prompt communication of safety
significant information in the event of nuclear accidents.
The selection of a level on the INES (see Figure 1), for a given event, is based on three
parameters: whether people or the environment have been affected; whether any of the
barriers to the release of radiation have been breached; whether any of the layers of safety
systems are breached. Broadly speaking, events with consequences only within the affected
facility itself are usually categorised as 'deviations' or 'incidents' and set below-scale or at
levels 1, 2 or 3. Events with consequences outside the plant boundary are classified at levels
4, 5, 6 and 7 and are termed 'accidents'.
The scale is intended to be logarithmic, similar to the movement magnitude scale that is used
to describe the comparative magnitude of earthquakes. Each increasing level represents an
accident approximately ten times more severe than one on the previous level (INES,2013).
Compared to earthquakes, where the event intensity can be quantitatively evaluated, the level
of severity of a man-made disaster such as a nuclear accident is more subject to
interpretation. Because of this the INES level is assigned well after the incident of interest
occurs. Therefore, the scale has a very limited ability to assist in disaster-aid deployment.
Nuclear reactor incidents/accidents are classified using the following scale (In descending
order of criticality):
7 - Major accident (Chernobyl, USSR. 1986;Fukushima, Japan,2011)
6 - Serious accident
5 - Accident with wider consequences (Three Mile Island, USA,1979)
4 - Accident with local consequences (Windscale, UK,1957)
3 - Serious incident
2 - Incident
1 - Anomaly
0 - Below scale/no safety significance.

6
Figure 1 The INES scale of nuclear accidents (IAEA, 2013)
Note that up to Level 3 the event is classified as an incident, from Level 4 upwards as an
accident.
In the next sections the analysis provided by one of the groups are presented.
2. Analysis of one group of participants
This report discussed the accident and proposed that this loss of control event was due to poor
design, leading to a common mode failure of the critical system (the cooling water) and the
installed backup systems, and that there was insufficient provision for alternative cooling
water supply or for controlled safe pressure relief. This argument was encapsulated in a fault
tree.
2.1 Technical background. The nuclear plant complex at Fukushima Daiichi was operated
by TEPCO. It consisted of six BWRs with a combined power output of 4.7 Gigawatts (see
Table 1) (Weightman, 2011a).
In the case of Fukushima-Daiichi NPP, only unit 3 was operated with mixed oxide (MOX)
fuel, while the other two reactors under operation were loaded with only uranium-dioxide
(UO2) fuel at the time of the accident. In general, BWR can be operated either UO2 fuel or
mixture of UO2 and plutonium (PuO2) fuel. The fuel is used to produce heat by nuclear
fission in the reactor core, the heat being transferred into water to produce steam, the same
water also being used for the neutron ‘moderation’ essential for the promotion of the fission
reaction. The steam is conditioned (heated) to ensure it is suitably dry and then used to
produce electricity via a turbo-generator. The steam is then cooled and condensed, the
resultant water being returned to the reactor via variable-speed pumps (see Figure2) (Areva,
201i).
TABLE 1 Overview of the Fukushima BWR design types and outputs
(Weightman, 2011a)

7
Unit 1 2 3 4 5 6
Reactor model BWR-3 (*)
BWR-4 BWR-4 BWR-4 BWR-4 BWR-5
Containment
model
Mark 1 Mark 1 Mark 1 Mark 1 Mark 1 Mark 2
Electrical
output (MWe)
460 784 784 784 784 1100
Commercial
operation
1971 1974 1976 1978 1978 1979
(*) Fukushima-1 Unit 1 is an early BWR-3 model that has a number of features of the
earlier BWR-2 model.
When the earthquake struck, Reactors 1, 2 and 3 were operational and at full output. Reactors
4, 5 and 6 were not on-line, but were shut down for routine periodic inspection.
2.2 The cooling water system.I rradiated nuclear fuel is self-heating; the radioactive decay
of the products of nuclear fission releasing energy that ultimately appears as heat. It follows
that the safe operation of BWR nuclear reactors is dependent on the provision at all times of
adequate cooling water. Even when a reactor is shut down and the nuclear fission chain
reaction stopped, the products of the nuclear fissions will be decaying radioactively and
producing heat. So, if the cooling water flow is interrupted the water will gradually heat to
the point of boiling and evaporate. If this is not corrected, the fuel rods, whether in the reactor
or in the spent (i.e. used) fuel storage pond, will eventually be uncovered, will overheat and
explosive hydrogen will be produced by the reaction of steam and water with the hot
zirconium-containing fuel cladding. Finally, the fuel rods will melt, distort, and the melted
material slump to the bottom of the reactor.
8
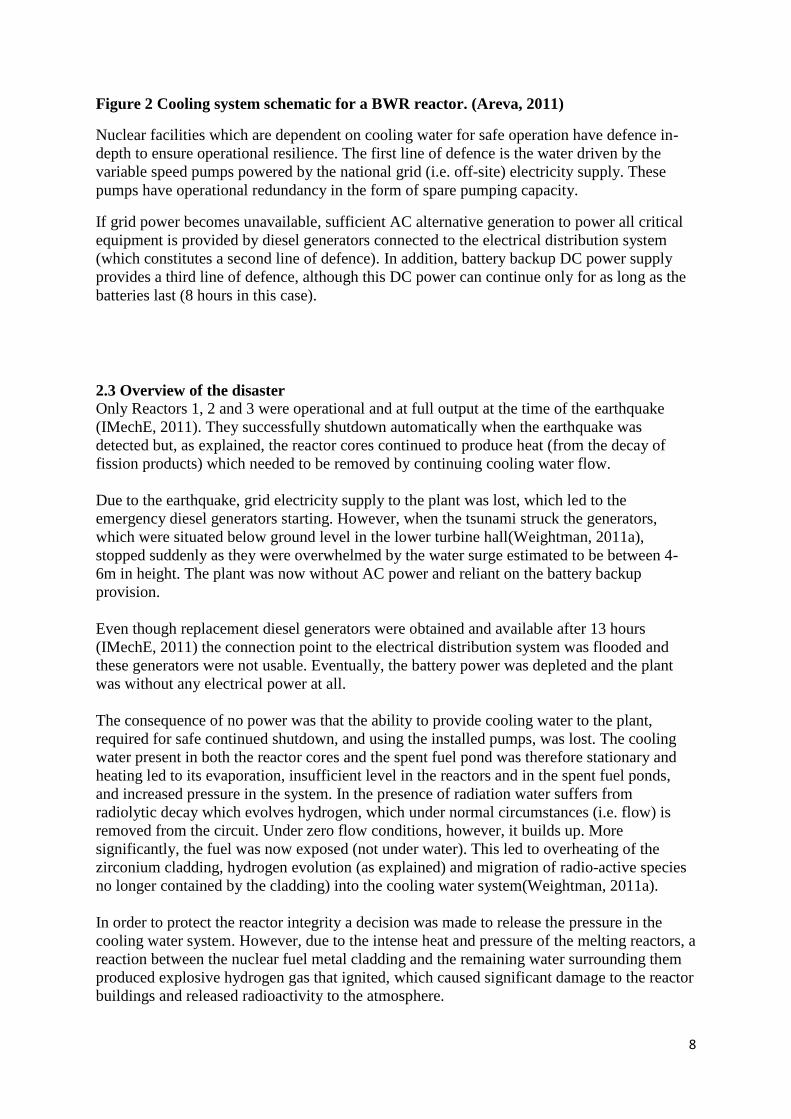
Figure 2 Cooling system schematic for a BWR reactor. (Areva, 2011)
Nuclear facilities which are dependent on cooling water for safe operation have defence in-
depth to ensure operational resilience. The first line of defence is the water driven by the
variable speed pumps powered by the national grid (i.e. off-site) electricity supply. These
pumps have operational redundancy in the form of spare pumping capacity.
If grid power becomes unavailable, sufficient AC alternative generation to power all critical
equipment is provided by diesel generators connected to the electrical distribution system
(which constitutes a second line of defence). In addition, battery backup DC power supply
provides a third line of defence, although this DC power can continue only for as long as the
batteries last (8 hours in this case).
2.3 Overview of the disaster Only Reactors 1, 2 and 3 were operational and at full output at the time of the earthquake
(IMechE, 2011). They successfully shutdown automatically when the earthquake was
detected but, as explained, the reactor cores continued to produce heat (from the decay of
fission products) which needed to be removed by continuing cooling water flow.
Due to the earthquake, grid electricity supply to the plant was lost, which led to the
emergency diesel generators starting. However, when the tsunami struck the generators,
which were situated below ground level in the lower turbine hall(Weightman, 2011a),
stopped suddenly as they were overwhelmed by the water surge estimated to be between 4-
6m in height. The plant was now without AC power and reliant on the battery backup
provision.
Even though replacement diesel generators were obtained and available after 13 hours
(IMechE, 2011) the connection point to the electrical distribution system was flooded and
these generators were not usable. Eventually, the battery power was depleted and the plant
was without any electrical power at all.
The consequence of no power was that the ability to provide cooling water to the plant,
required for safe continued shutdown, and using the installed pumps, was lost. The cooling
water present in both the reactor cores and the spent fuel pond was therefore stationary and
heating led to its evaporation, insufficient level in the reactors and in the spent fuel ponds,
and increased pressure in the system. In the presence of radiation water suffers from
radiolytic decay which evolves hydrogen, which under normal circumstances (i.e. flow) is
removed from the circuit. Under zero flow conditions, however, it builds up. More
significantly, the fuel was now exposed (not under water). This led to overheating of the
zirconium cladding, hydrogen evolution (as explained) and migration of radio-active species
no longer contained by the cladding) into the cooling water system(Weightman, 2011a).
In order to protect the reactor integrity a decision was made to release the pressure in the
cooling water system. However, due to the intense heat and pressure of the melting reactors, a
reaction between the nuclear fuel metal cladding and the remaining water surrounding them
produced explosive hydrogen gas that ignited, which caused significant damage to the reactor
buildings and released radioactivity to the atmosphere.

9
Attempts to provide alternative cooling continued, including the use of:
Fire-fighting equipment/water cannons to spray the building exterior (Weightman,
2011a)
Helicopters to drop water.
Portable pumping systems to supply sea water, via a fire hose connection, to the
cooling circuit. However, the supply rate was limited to ~2m3/hr due to limited
connection size (Weightman, 2011a).
It is now known that during the disaster the radiological containment integrity was degraded.
Subsequently, radiological measurement has confirmed that contamination spread to the
atmosphere and then to the sea, and subsequently into drinking water supplies.
2.4 Analysis of contributory factors The full picture of the events at Fukushima has yet to become apparent. However, the
following is a discussion of the contributory factors which also impacted (sometimes
positively, sometimes not) on cooling, and hence on nuclear safety and plant integrity.
2.4.1 The basis of the design The design of Reactor Unit 1, which was the oldest design and suffered the most damage,
was based upon a 0.18g (1.74m/s2) earthquake, which is equivalent to one of magnitude 7.5.
The March 11th
earthquake was much more severe at 0.52g (5.07m/s2), or magnitude 9.0,
which in terms of energy is a factor of 1015 greater than the design basis event. But, due to
the factors of safety built into the design the civil structure survived (IMechE, 2011).
Regarding a tsunami, the design basis was for a 6m wave. The actual wave was 14m. An
internal TEPCO safety review, in 2007 (around four years prior to the accident), identified
that the occurrence of a wave that could overtop the seawall was a 1 in 50 year event
(Krolicki et al, 2011). Fukushima 1 was under construction in 1967 (44 years ago), and
therefore the 1 in 50 year estimate was both accurate and equivalent to a once in a plant
lifetime event. The sea defence, however, had not been improved, and actually fell by
approximately 1m during the earthquake.
2.4.2 The cooling water system The mains power supply was lost during the initial earthquake. Typically, such supply is
duplicated, protected and provided via diverse routes to allow for catastrophic damage. It was
initially unclear whether this was the case at Fukushima, i.e. were there two routes and, if so,
why were they both allowed to be susceptible to the same common mode failure? We now
know from the investigation report by the Japanese Government (Report, 2011) that at
Fukushima-Daiichi NPP, the off-site grid was designed based on the general civil-
engineering standard rather than the enhanced safety standard for nuclear facility. That is why
all off-site grids were damaged by the earthquake.
Initially, the diesel generator system was successfully used when the earthquake led to a loss
of mains power. However, the location of both the generators and the associated distribution
board (below ground level) and the lack of appropriate protection, allowed the tsunami to
overwhelm and damage them beyond use. This could have been avoided by simply locating
them above the height of any possible tsunami surge.

10
There was no duplicate or alternative connection point for any additional diesel generators, as
evidence by the fact that some 13 hours later generators were available but not connectable.
In fact, it was deemed that repairing the mains supply would have been the quickest method
of re-instating the pump power supply (IMechE, 2011).
No evidence has been identified regarding whether the cooling water systems from the other
reactors were cross-connectable, i.e. could the cooling water pumps, generators etc. from
adjacent reactors (in cold shutdown and therefore with spare capacity) be used to cool an
uncooled reactor?
There were difficulties in providing seawater to the cooling system while the cooling water
pumps were unavailable. There were deficiencies in the pre-planning and readiness of the
workforce to use the temporary pumping system commissioned to pump via hose connection
points. Due to the limits of physical size of the connection the maximum throughput was
insufficient to achieve the required cooling rates (Weightman, 2011a).
Due to insufficient cooling the pressure rose to unacceptably high levels, requiring venting to
atmosphere. The safety relief valves were not controllable due to depletion of DC battery,
which lead to overpressure of reactor vessel and prevented the water injection to reactor core.
In a documentary about the accident, it states that operators were working in the dark due to
loss of power supply and had great difficulty in controlling the safety relief valves.
2.5 Fault Tree It is proposed that the process of evolution of the hydrogen explosion above Fukushima can
be represented by a Fault Tree, as in Figure 3.

11
Figure 3 (a,b,c) Fault Tree Analysis (FTA) of Fukushima Disaster in terms of
hydrogen explosion and meltdown
(as proposed by the first group)

12
As shown in Figure 3, the hydrogen explosion and the meltdown were due to three
simultaneous factors: loss of coolant (ultimate heat sink) – details in Figure 3a; hydrogen
build-up in cooling water – details in Figure 3b; ignition– details in Figure 3c. The term
‘ultimate heat sink’ refers to the function of dissipation of residual heat after a shutdown or
an accident. Note that in this fault tree model, the most difficult part to assess was figure 3c
as the relationship between hydrogen explosion and containment vent is not clear yet and
there are some discrepancies among investigation reports. For example, an alternative view
argues that the hydrogen leaked mainly through the penetration of containment vessel (e.g.,
top flange) that are degraded by the radiative heat from reactor vessel.
The equivalent Reliability Block Diagram (RBD) is shown in Figure 4a .The RBD is a mental
model that is extracted from the FTA model. The FTA model depends on how one knows
about the problem and it tends to be the outcome of brainstorming carried out by the
investigation team. Whereas, the RBD attempts to visualise the relationship among causal
factors which can lead to identification of vulnerable aspects of the model.
The following rules describe how the RBD can be extracted from the FTA model (Labib,
2014):
1. Every OR in an FTA is a Series configuration in the equivalent RBD.
2. Every AND in an FTA is a Parallel configuration in the equivalent RBD.
3. Start from the Top of the Tree.
4. Only model Basic events.
5. The order in an RBD does NOT matter.
6. Look for a real root cause.
7. Both FTA and RBD are mental models for risk analysis rather than risk assessment.
Therefore, every OR gate in the FTA in Figure 3 is mapped into a ‘series’ structure in the
RBD and every AND gate into a ‘parallel’ structure. So one would expect that an RBD with a
majority of series structure to be ‘bad news’ as any box fails the whole system will collapse.
Whereas an RBD model with prevailing parallel arrangements to be ‘good news’ as there is
much redundancy in the system.
Note here that the term ‘failure’ in the title of the present paper and throughout the text
implies a major failure (a disaster). However, the techniques of FTA and RBD were
originally designed to analyse failures at equipment level; for example a failure of a gas
turbine, pump or compressor. We have utilised these techniques for the analysis of
Fukushima as well as other disasters (Labib, 2014). Therefore, we argue in this paper that the
same techniques can be used for analysis of any failure despite its scale.

13
Figure 4a: Proposed RBD of Fukushima Nuclear Disaster for the first group (ideal
scenario).
Notice that in Figure 4a, the system at the first instance the system looks to be of a safe
structure as there are plenty of parallelism in the structure and hence the smiley face.
What has actually happened in this disaster is a failure that has affected all parallel structures
as shown in Figure 4b, as depicted by the shaded boxes in the diagram.

14
Figure 4b: Proposed RBD of Fukushima Nuclear Disaster for the first group (actual
scenario).
2.6 Discussion of the group of participants.
This serious accident was fundamentally down to poor design, in that the normal mains and
both backup power supplies were allowed to fail due to a single common cause, albeit an
extreme natural event. The mains supply integrity was such that the earthquake damaged it
beyond repair and no diverse supply remained intact. The diesel generator system was located
in a plant room likely to be swamped, and again no diverse connection point remained. And
finally, neither could be repaired before the backup power supply was exhausted. The threat
from an earthquake-generated tsunami that could overcome the existing sea defences, and
would therefore be capable of these effects, was not only plausible and real, it was actually
foreseen in 2007 and calculated as likely in the lifetime of the plant (Krolicki etal, 2011). But
the plant continued to be operated, the sea defences were not improved, and the resilience of
the cooling water system was not increased.
Furthermore, the ability to provide cooling by other means was insufficient both with respect
to the training and readiness to do so, and also as regards the physical hardware required.
Without the installed pumps not enough water could be provided - by any other installed
emergency system - to prevent the pressure rising to unacceptable levels (Weightman,
2011a).
The ability of the installed design to control, contain and direct excessive pressure was
insufficient. The basic concept of reinforced containment vent is to use the atmosphere as an

15
ultimate heat sink by releasing the overly pressured gas and water vapour inside the primary
containment vessel (PCV). The containment represents the largest barrier to the release of
radioactive elements to the environment and should not be allowed to fail at any cost.
Therefore, the planned response to an event like this is to vent some of the steam to the
atmosphere just to keep the pressure under control (MIT, 2011). From this perspective, the
outside atmosphere is "the suitable location" to release the gas and water vapour from reactor
containment vessel. This is a planned procedure since it involves a process of scrubbing and
filtering the released material through the effect caused by the water in the suppression
chamber, which contribute to the reduction of the amount of radioactive material released
during the containment vent by the factor of 10-100. While some of these gases are
radioactive, they did not pose a significant risk to public safety to even the workers on site.
This procedure is justified as its consequences are very low, especially when compared to the
potential consequences of risking the integrity of the containment structure (MIT, 2011).
Given that the possibility of such a large tsunami was foreseen, it follows that its
consequences were also foreseeable via a suitable FMEA. Therefore, the failure to carryout
suitable hazard analysis, and to implement the actions thus identified, was also a design
failure.
2.7 Conclusion of the group of participants
The event was foreseen and design shortcomings were neither investigated nor addressed.
This aspect of the disaster, the hydrogen explosions, was fundamentally due to the lack of
resilience of the cooling water circuit.
3. DISCUSSION:
Here, the tutors (the authors) offered feedback to the groups, intended to provide more insight
into the accident, the company and its culture, and hence addressing various specific and
generic issues. This view here can be considered also as a third view (after the narrative, and
the group’s report so as to add to the richness of the topic being discussed.
3.1 Overall criticism of the group
It is clear from the FTA that the main causal factor was the initial poor design specifications,
especially those related to the height of the sea walls, and the installed backup systems (in
that there was insufficient provision for alternative cooling water supply or for controlled safe
pressure relief.
3.2 Wider generic lessons for the nuclear power industry On a more strategic level the nuclear power generation debate concerns the issue of
regulation. Pfotenhauer et al.( 2012) and Aoki and Rothwell (2013) have proposed that the
time has come to introduce a Japanese and a global independent nuclear safety commission,
in order to separate national economic and political interests from the regulatory function, in
promoting nuclear power, something which concerns all nations. Accordingly, it has been
recommended that the mandate of the IAEA should be elevated to include a licensing
function for nuclear power plants, thereby changing its status from an advisory body to that
of an international institution with authority to make legally binding decisions. This is in line
with the findings of this paper, since it was noticed that the root causes for the disaster can be
attributed to two main factors, viz. deficiencies in regulation and inadequate setting of design

16
specifications based on risk assessment. Regarding the second of these it can be claimed that
more research is needed in this field, where the emphasis should shift from ‘probability’
assessment to ‘possibility’ identification. Currently, the ‘P’ in PRA and PSA stands for
‘probabilistic’. Mathematically, it is easier to formalise ‘probability’ than ‘possibility’,
despite the fact that it is now clear, from Fukushima, that the main challenge concerns
possibility, hence a paradigm shift is needed to conduct more research on modelling
possibility.
In order to demonstrate how it can be misleading to just rely on probability with assumptions
that are more aspirational than fact-based, let us apply this to the nuclear power generation
industry. To test for a probability of a less than one in ten million chance per reactor-year of a
nuclear plant failure would require building 1,000 reactors and operating them for 10,000
years and anticipating a failure of no more than one during that period.
Now let us compare these ambitious estimates with the current state. Across the world there
are about 435 nuclear power reactors operating in 30 countries, with over 140 in Europe, and
54 in Japan (Weightman, 2011), and around 100 in the USA. Fukushima is the third major
nuclear accident (i.e. it was preceded by Three Mile Island and Chernobyl) and all three
happened within less than half a century, which makes us question our models and original
assumptions. So the current record suggests that the Mean Time between Failures (MTBF)
for the three major accidents (in 1979, 1986, and 2011) currently stands at just 10 years,
which is very far from the ambitious 1 in a 10 million per reactor-year chance. This view is
supported by Smythe (2011), who also suggests a catastrophic accident to be expected every
12-15 years. Clearly, the three accidents each arose from very different circumstances,
invalidating various modelling and risk assessment assumptions, and resisting assimilation
into a single data set. It is difficult, with such a small sample size, to make generalizations
about where current risk models fail, though we agree with the argument put forward by
Pfotenhauer et al (2012) which suggests that the original ambitious annual failure risk
estimates were serious underestimates.
In an article titled ‘Learning lessons from Fukushima’ Mike Weightman, who was the UK
Chief Inspector of Nuclear Installations, and head of an IAEA fact-finding mission,
concluded that “The Magnitude-9 earthquake caused severe ground motions that lasted for
several minutes at the Daiichi plant. The measured motions reasonably matched the
predictions of the designers of the seismic protection measures. Upon detection of these
ground motions, the safety systems at Daiichi shut down the reactors and started the back-up
systems. All the evidence I have seen, including from the other Japanese nuclear power
plants that witnessed similar ground motions, supports the view that the Daiichi plant safely
survived this massive earthquake. However, the flood protection measures at the Daiichi
plant were originally designed to withstand a 3.1m high tsunami, whereas the largest wave
that crashed into the site in March inundated it to around 15m. A review in 2002 by the
operators of the Daiichi plant did result in increases to the tsunami defences to enable it to
better survive a 5.7m high tsunami. This improvement still proved to be inadequate,
especially considering the history of tsunamis along that coast over the past century”
(Weightman, 2012).
These accounts show the importance of the previous stated recommendations, that the
mandate of the IAEA should be elevated to include a licensing function for nuclear power

17
plants, thereby changing its status from an advisory body to that of an international institution
with authority to make legally binding decisions.
On the other hand, when one looks at other sources of energy, nuclear power is one of the
safest based on the criteria of lost life per GWh and CO2 emissions, and when compared to
alternative energy sources such as coal, oil and even photovoltaic, hydro and wind (Nuclear
Energy Outlook, 2008; Simic et al 2011).
4. CONCLUSION:
In any process industry, and especially in nuclear energy, failure can be attributed to one of
two main reasons: either a design integrity failure or an operational and maintenance failure.
Fukushima was clearly caused by the former rather than the latter. Its impact was limited,
because of the Japanese safety procedures to which we should pay tribute. However, it is
clear that the design of the plant did not include a sufficient factor of safety, which has been
attributed to inadequate regulations.
Overall, this study demonstrates, using the case of the Fukushima nuclear disaster, that both
qualitative and quantitative approaches are important techniques, which are useful for gaining
better insight into the analysis of risk at different levels. This is in line with what Apostolakis
(2004) has previously proposed and is also in line with what all investigation reports have
called for in the wake of this disaster.
Acknowledgement:
The authors are grateful to the participants at both University of Manchester (MSc Reliability
Engineering) and University of Portsmouth (MBA). Specifically the authors are grateful to
the two groups involved in the Fukushima project. The authors are grateful to the three
anonymous reviewers for their valuable comments that have helped us to improve the paper.
References:
[1] Apostolakis G.E., Risk informing the Regulatory System: An uphill climb, power-point
presentation, Near and long-term regulatory changes after Fukushima: Does the
accident in Japan call for a major overhaul of nuclear safety regulations? Panel,
slides 5-6, 9, 12, 16-17, American Nuclear Society (ANS) Winter Meeting, San
Diego, California, November,11-15, 2012.
[2] Apostolakis G.E., How useful is quantitative risk assessment? Risk Analysis 2004;
24(3):515–20.
[3] Aoki, M., and Rothwell, G., A comparative institutional analysis of the Fukushima
nuclear disaster: Lessons and policy implications, Energy Policy, 53, 240-247, 2013.
[4] Areva, The Fukushima Daiichi Incident, 2011 (Presentation can be found at:
hps.org/documents/areva_japan_accident_20110324.pdf
[5] Argyris C. and Sch n D.A. 1 79), Organizational Learning: A Theory of Action
Perspective, Addison Wesley, Reading, MA.

18
[6] Carroll, J.S. and Fahlbruch, B. (2011), The Gift of Failure: New Approaches to
Analyzing and Learning from Events and Near-Misses. Honoring the Contributions of
Bernhard Wilpert, Safety Science, Volume 49, Number 1, pp. 1–4.
[7] Cyret, R. M. and March, J.G., (1963), A Behavioral Theory of the Firm. Englewood
Cliffs, NJ: Prentice Hall.
[8] Deverell . and ans n D. Learning from Crises and Major Accidents:
From Post-Crisis Fantasy Documents to Actual Learning in the Heat of Crisis,
Journal of Contingencies and Crisis Management, Volume 17, Number 3, pp. 143–
145.
[9] Dechy, N., Dien, Y., Funnemark, E., Roed-Larsen, S., Stoop, J. and Valvisto, T.
(2012),Results and Lessons Learned from the Esreda’s Accident Investigation
Working Group, Introducing Article to “Safety Science” Special Issue on “Industrial
vents Investigation” ’ Safety Science Volume 5 Number 6 pp. 138 –1391.
[10] Drupsteen, L., and Guldenmund, F.W., What Is Learning? A Review of the
Safety Literature to Define Learning from Incidents, Accidents and Disasters, Journal
of Contingencies and Crisis Management, 2014 (on-line).
[11] IAEA, 2002. Key Practical Issues in Strengthening Safety Culture, INSAG-
15. Self- Assessment of Safety Culture in Nuclear Installations Highlights and Good
Practices, TECDOC-1321. Safety Culture in Nuclear Installations: Guidance for Use
in the Enhancement of Safety Culture, TECDOC-1329.
[12] IAEA, 2013, The The International Nuclear and Radiological Event Scale
(INES) Scale (http://www-pub.iaea.org/MTCD/publications/) accessed November
2013.
[13] IMechE, On Fukushima Daiichi Nuclear Power Plant and Tohoku
Earthquake: What Happened When? 11th
March, 2011.
[14] Ishizaka A, Labib A. W.,Review of the main developments of AHP, Expert
Systems With Applications Volume 38, Issue 11, 2011, Pages 14336-14345, 2011.
[15] JNES, Outline of Safety Design – A Case of BWR, Long-term Training Course
Notes, Japan Nuclear Energy Safety, 2005
[16] Kashyap, A., et al, The Economic Consequences of the Earthquake in Japan,
Web Publication. Freakonomics Web, 2011
[17] Kletz, T., 2001. Learning From Accidents. Butterworth-Heinmann.
[18] Krolicki, K., DiSavino, S., Fuse, T., Engineers knew Tsunami Could
Overwhelm Fukushima Plant, Insurance Journal, 2011.
http://www.insurancejournal.com/news/international/2011/03/30/192204.htm
[19] Labib, A.W., Learning from failures using decision making techniques, Risk
management for complex socio-technical systems, American Nuclear Society (ANS)
Winter Meeting, Washington DC, USA, November, 12-14, 2013.
[20] Labib, A., Learning from Failures: Decision Analysis of Major Disasters,
Butterworth-Heinemann, Oxford, 450 p, 2014.
[21] Lampel, J., Shamsie, J., Shapira, Z., 2009. Experiencing the improbable: rare
events and organizational learning. Organ. Sci. 20 (5), 835–845.
[22] Le Coze, J.C. (2013), What Have We Learned about Learning from
Accidents? Post-Disasters Reflections, Safety Science, Volume 51, Number 1, pp.
441– 543.
[23] Lindberg, A.K., Hansson, S.O. and Rollenhagen, C. (2010), Learning from
Accidents – What More Do We Need to Know?Safety Science, Volume 48, Number 6,
pp. 714–721.

19
[24] Lukic, D., Margaryan, A. and Littlejohn, A. (2010), How Organizations Learn
from Safety Incidents: A Multifaceted Problem, Journal of Workplace Learning,
Volume 22, Number 7, pp. 428–450.
[25] MIT, Explanation of Hydrogen Explosions at Units 1 and 3, Nuclear Science
and Engineering at MIT, March, 2011.
[26] Morris-Suzuki, T., Boilley, D., McNeill, D., andGundersen. A., Lessons from
Fukushima. Netherlands: Greenpeace International, February 2012.
[27] Mohagheg, Z., and Mosleh, A, Special session on risk management for
complex socio-technical systems, American Nuclear Society (ANS) Winter Meeting,
Washington DC, USA, November, 12-14, 2013.
[28] Nuclear Energy Outlook, NEA-OCED, 2008.
[29] Pfotenhauer, S.M., Jones, C.F., Saha, K., and Jasanoff, S, Learning from
Fukushima, Issues on Science and Technology, University of Texas, 2012.
[30] Pidgeon, N., O'Leary, M., (2000) Man-made disasters: why technology and
organizations (sometimes) fail, Safety Science, 34 (1-3), 15-30.
[31] Report of the Japanese Government to the IAEA Ministerial Conference on N
uclear Safety:The Accident at T PCO’s Fukushima Nuclear Power Stations Nuclear
Emergency Response Headquarters Government of Japan June 2011.
[32] Saaty T (1980). The Analytic Hierarchy Process. McGraw-Hill: New York.
[33] Saleh JH, Marais KB, Bakolas E, Cowlagi RV. Highlights from the literature
on system safety and accident causation: review of major ideas, recent contributions,
and challenges. Reliability Engineering and System Safety 2010; 95(11):1105–16.
[34] Saleh, JH, Haga, RA, Favaro, FM, Bakolas, E, Texas City refinery accident:
Case study in breakdown of defence-in-depth and violation of the safety-
diagnosability principle in design, Engineering Failure Analysis 36 (2014) 121-133.
[35] Seneviratne G., Director General to Set Out Post-Fukushima Action Plan,
IAEA Ministerial Conference, Nuclear News, August 2011.
[36] Simic, Z., Mikulicic, V., and Vukovic, I., Risk from nuclear power utilization
after Fukushima accident, International Journal of Electrical and Computer
Engineering Systems, Vol 2, No 1, pp 25-35, 2011.
[37] Smythe, D., An objective nuclear accident magnitude scale for quantification
of severe and catastrophic events, Physics Today: Points of view, December, 12,
2011.
[38] Taleb, N. N., The Black Swan: The Impact of the Highly Improbable, Penguin
Books, 2010.
[39] The Guardian, UK government must learn from Japan's catastrophe as it
plans a new generation of plant, nuclear chief claims, Tisdall, S., 19 November 2013.
[40] Turner, B.A., 1978. Man-made Disasters. Wykeham Science Series, 1978, pp.
254.
[41] Wahlstrom, B. (2011), Organizational Learning – Reflections from the
Nuclear. Industry, Safety Science, Volume 49, Number 1, pp. 65–74.
[42] Weightman M., Japanese Earthquake and Tsunami: Implications for the UK
Nuclear Industry- Interim Report, Office for Nuclear Regulation, May 2011a
[43] Weightman M., Japanese Earthquake and Tsunami: Implications for the UK
Nuclear Industry - Final Report, Office for Nuclear Regulation, September 2011b
[44] Weightman, M., Learning from Fukushima, Physics World.com (online
journal), 6th
March, 2012.