learning qlik sense® the offi cial guide - second edition - sample chapter
TRANSCRIPT
P r o f e s s i o n a l E x p e r t i s e D i s t i l l e d
Get the most out of your Qlik Sense® investment with the latest insight and guidance direct from the Qlik Sense® team
Learning Qlik Sense®
The Offi cial GuideSecond Edition
Christopher Ilacqua
Henric C
ronströmJam
es Richardson
Learning Qlik Sense
® The O
ffi cial Guide
Second Edition
Learning Qlik Sense®
The Offi cial GuideSecond Edition
The intuitive and powerful Qlik Sense® visual analytics software allows you to engage in data discovery, explore your data, and fi nd meaningful insights to empower your business. Qlik Sense lets you easily create personalized reports and visualizations and reveal essential connections to show new opportunities from every angle.
Written by members of the Qlik Sense team, this book is the offi cial guide from Qlik to understanding and using their powerful new product. Benefi t from the vision behind the development of Qlik Sense and get to grips with how Qlik Sense can empower you as a data discovery consumer. Learn how to create your own applications for Qlik Sense to customize it to meet your personal needs for business intelligence, and how to oversee and administer the Qlik Sense data architecture. Finally, explore utilizing Qlik Sense to uncover essential data with practical examples on fi nding and visualizing intelligence for sales fi gures, human resources information, travel expense tracking, and demographic data discovery.
Who this book is written forThis book is for anyone seeking to understand and utilize the revolutionary new approach to business intelligence offered by Qlik Sense. Familiarity with the basics of business intelligence will be helpful when picking up this book, but not essential.
$ 49.99 US£ 31.99 UK
Prices do not include local sales tax or VAT where applicable
Christopher Ilacqua Henric CronströmJames Richardson
What you will learn from this book
Understand the vision behind the creation of Qlik Sense, and the promise that data discovery offers to you and your organization
Get to grips with the life cycle of a Qlik Sense application
Load and manage your data for app creation
Visualize your data with Qlik Sense's engaging and informative graphing
Administer your Qlik Sense system and monitor its security
Learn how to build effi cient and responsive associative models
Learn how to extend the Qlik Analytics Platform with Dev Hub
Optimize Qlik Sense for sales, human resources, and demographic data discovery
P U B L I S H I N GP U B L I S H I N G
professional expert ise dist i l led
P U B L I S H I N GP U B L I S H I N G
professional expert ise dist i l led
Visit www.PacktPub.com for books, eBooks, code, downloads, and PacktLib.
Free Sample
In this package, you will find: The authors biography
A preview chapter from the book, Chapter 1 'Qlik Sense® and Data Discovery'
A synopsis of the book’s content
More information on Learning Qlik Sense® The Official Guide
Second Edition
About the Authors
Dr. Christopher Ilacqua is the research director of product validation at Qlik®. He has been working with leading customers and partners in the US for more than 3 years garnering feedback on Qlik Sense. Chris has over 25 years of experience in the fi eld of planning and business intelligence, and he has established himself as a leading expert by advising, designing, and implementing hundreds of planning and business intelligence applications. He has a doctorate in business administration, a master's degree in business administration in accounting, and a bachelor's degree in marketing. His research interests focus on big data, data governance, mobile BI, SaaS, business collaboration, and cloud-based solutions. Additionally, Chris serves as an adjunct professor at New England College of Business, where he teaches graduate students strategic leadership, marketing, operations management, and MIS.
Dr. Henric Cronström is vice president product and technical product advocate at Qlik®, where he has worked for most of the time since the company was founded. At Qlik, Henric has had several different roles. For the fi rst few years in Qlik's history, he was the product manager for QlikView, and then he moved into solution implementation and training. After many years in the fi eld, including a role as a manager for the technical staff in QlikTech, Germany, he returned to Sweden as deputy manager for the development organization. In his current role, his main task is the communication of technical products on blogs, in the press, and directly with large accounts.
Henric has a doctorate in elementary particle physics from Lund University.

James Richardson is business analytics strategist at Qlik®. Prior to joining Qlik, James spent 6 years as a Gartner analyst covering business intelligence and analytics. During his tenure, along with advising hundreds of organizations on BI topics, James was the lead author of the Magic Quadrant for BI Platforms report and was the chairperson and keynote speaker for Gartner's European BI summit. Before Gartner, James spent 13 years at BI and performance management software vendor IMRS/Arbor/Hyperion in various roles. Prior to that, James worked for Sema Group developing software for industrial control systems (SCADA), and as an advertising copywriter. In 2015, he was named one of the UK's top 50 data leaders by Information Age magazine.

PrefaceWelcome! The purpose of this book is to help you learn about Qlik Sense®, Qlik's self-service visualization platform. Our aim is to help you get more from your data by applying Qlik Sense and its unique capabilities to your analytic needs. At the beginning of the book, we'll cover why Qlik chose to develop Qlik Sense, what data discovery is and can do, and the strategy and vision behind the product. In the subsequent chapters, we'll address practical considerations, including the Qlik Sense application's life cycle, how to meet the needs of different types of users, how to develop and administer engaging Qlik Sense applications, data modeling and getting the most out of the QIX engine. The book concludes by outlining a series of example applications built using Qlik Sense, to address analysis needs in sales management, HR, T&E management, and demographics.
What this book coversChapter 1, Qlik Sense® and Data Discovery, covers why Qlik chose to develop Qlik Sense, what data discovery is and can do, and the strategy and vision behind the product. This will include:
• Qlik's history in business intelligence and the evolution of data discovery• The Qlik philosophy and approach to data discovery• The difference between traditional BI and data discovery
Chapter 2, Overview of a Qlik Sense® Application's Life Cycle, covers the Qlik Sense application's life cycle overview as a backdrop to highlighting key features and benefi ts of Qlik Sense in meeting these requirements. There are thousands of features in this initial release and this chapter will serve as a guide to the major components, features, and benefi ts to start your exploration of Qlik Sense. This will include:
• Overview of the hub• Starting application authoring
Preface
• Components of a Qlik Sense application• Sharing an application
Chapter 3, Empowering Next Generation Data Discovery Consumers, highlights the key features in the context of specifi c user requirements that Qlik has identifi ed as a consumer. This will include:
• Data discovery consumption requirements• The hub• Navigating and leveraging the associative experience
Chapter 4, Contributing to Data Discovery, highlights the key features in the context of specifi c user requirements that Qlik has identifi ed as a contributor or someone who seeks to share key fi ndings from their analysis. This will include:
• Data discovery contributor requirements• Bookmarks• Private sheets• Private stories• Publishing to an existing application
Chapter 5, Authoring Engaging Applications, highlights an approach to building engaging applications to meet your business problems. This will include:
• Data• KPIs and measures• Dimensions• Security
Chapter 6, Building Qlik Sense® Data Models, highlights the techniques and principles behind building a data model. This will include:
• Tables, fi elds, and records• Joins and concatenations• How to link tables and how not to link tables• Normalization and de-normalization• Synthetic keys and circular references
Preface
Chapter 7, Qlik Sense® Apps in the Cloud, briefs us on using Qlik Sense Cloud. This will include:
• Sharing Qlik Sense Desktop apps in the cloud• Creating Qlik Sense apps directly in the cloud• Maintaining Qlik Sense Cloud apps• Adding external data to apps using Qlik DataMarket
Chapter 8, Extending the Qlik® Analytic Platform, gives an overview of the key APIs and how to use them to extend Qlik Sense solutions. This will include:
• API overview• Dev Hub• Single confi gurator• Web mashup editor• Extension editor• Engine API explorer• Qlik Branch overview
Chapter 9, Administering Qlik Sense®, highlights the administration of Qlik Sense applications within an organization. This will include:
• Architecture• Clustering and nodes• Licenses and tokens• Streams and security concepts
Chapter 10, Sales Discovery, applies Qlik Sense to the challenges of analyzing sales performance within your organization. This will include:
• Common sales analysis problems• The unique way Qlik Sense addresses these problems• How the application was built
[ 1 ]
Qlik Sense® and Data Discovery
In this chapter, we'll start getting to grips with what Qlik Sense offers by getting a better understanding of Qlik's background and how Qlik Sense was developed. In addition, we will examine the discovery-based approach to business intelligence that Qlik invented.
We will cover the following topics:
• Qlik's history in business intelligence and the evolution of data discovery• The QlikView.Next project• The Qlik philosophy and approach to data discovery• The importance of the empowered user• How a user really interacts with data• The difference between traditional BI and data discovery
Continuing disruptionIn the world of technology, there's a lot of talk about creating new products that disrupt existing markets, but very few organizations can say they've done it for real. Qlik is one of them.
In 2007, the business intelligence (BI) software market changed forever. Oracle bought Hyperion, SAP bought Business Objects, and IBM bought Cognos. The conventional wisdom was that BI would effectively cease to exist as a standalone market, subsumed into larger stacks of technology.
Qlik Sense® and Data Discovery
[ 2 ]
However, this wasn't the case. In fact, by 2007, a revolution was already well underway. The BI world was being fundamentally disrupted, challenged by the new approach pioneered by Qlik (then called QlikTech). The disruptive technology Qlik developed was called QlikView. To differentiate QlikView from the established BI products, Qlik began to call the new disruptive approach Business Discovery, later adopting data discovery as this term gained industry-wide adoption.
Surprisingly though, when it was launched in 1994, what became QlikView was not consciously targeted at the BI software market. Rather, its initial task was to help its customer understand which of a number of individual parts and manufacturing materials were used across the range of the complex machines it manufactured, and which parts were not associated with particular items (a critical point we'll explore later in this chapter and revisit throughout this book). The goal was to visualize the logical relations between the parts, materials, machines, and products. This origin led to an approach completely different from BI at the time, one in which all the associated data points are linked automatically, enabling discoveries to be made through free exploration of data.
As it became more widely used and deployed, it was evident that what QlikView was being used for was a new type of BI. QlikView's speed, usability, and relevance challenged the standard approach that was dominated by IT-deployed data reporting products, which are slow performing, hard to use, and built around models that struggle to keep up with the pace of modern business needs.
QlikView's intuitive visual user interface, patented associative data handling—running entirely in memory—and its capability to draw data together from disparate sources changed the landscape. Discovery-led BI is about giving people the power to interact with and explore data in a much more valuable way than the older, reporting-led BI incumbency could. This is massively compelling to people who need to quickly ask and answer questions based on data in order to learn and make decisions, and proved very compelling to people jaded with the way things had been done before. QlikView became very successful, dominating the market it pioneered.
So what did Qlik do then? Sit back and relax, proud of its disruptive chops, safe in the knowledge that it had recast an established market in its image? No. Far from it. Instead, Qlik took the decision to transform the BI market again with a new product.
Chapter 1
[ 3 ]
Qlik Sense® and the QlikView.Next projectQlik decided to design and develop a next generation data discovery platform. Developed under the project name QlikView.Next and launched as Qlik Sense, the product was anchored to fi ve themes:
• Gorgeous and genius: Within this theme, Qlik focused on three product scenarios, with an overall emphasis on ad hoc analysis. The scenarios were that the product should be visually beautiful, support associative, comparative, and anticipatory analysis, and a seamless experience across all devices.
• Mobility with agility: This theme was about all users having access and the ability to answer new analytical questions as they arise in new situations and contexts when using a mobile device, with no difference between static and mobile experiences.
• Compulsive collaboration: Business intelligence and collaboration are inseparable; decision-making is, by nature, a collaborative activity. The intent was to build a product that could reside at the forefront of users' shared decision-making and give them the chance to communicate their insights through collaboration and storytelling.
• The premier platform: This theme was about enabling Qlik customers and partners to quickly and easily deliver apps and solutions that are perfectly relevant to their constituents. Within this theme, Qlik focused on four scenarios: data access, the development experience, expanding its ecosystem through broadened APIs, and offering a unified platform interface.
• Enabling new enterprise: With this theme, Qlik was focused on making capabilities such as security, reliability, and scalability available to all customers, not just the largest ones, and giving administrators and authors the same kind of gorgeous and genius experience other users get.
Making sense of modern businessYou may say, "Well, that's all good, but it doesn't really tell me why this matters or why Qlik Sense is important."
To answer this, we have to think about what the focus of technology in our organizations has been in the recent past. For 25 years, most of our investment in IT has been on effectively improving reliability, using ERP or transactional applications to streamline processes, drive out ineffi ciencies, and deliver our products or services effectively. However, if most organizations, and particularly groups of competitors, are now operating at similar levels of procedural effectiveness, a key question arises, "What do we do differently to win?"

Qlik Sense® and Data Discovery
[ 4 ]
The answer lies in out-thinking our competitors through the use of data and analysis. This requires a shift of focus in both how we run our businesses and the IT world needed to do so. So far, analytics has too often been a poor cousin, something that happens afterwards on the edges, a tactical rather than strategic activity. That's no longer good enough. Businesses using data-driven decision-making perform measurably better than those that don't. When we can see (and measure) new things, we are driven to seek answers and thus, new ways of thinking and operating. Organizations that do not have analytics as a central part of their business activities will not thrive, or even survive, in the new reality.
Qlik Sense is about doing exactly that—freeing up the analytical skills of individuals in organizations, whatever their role. This book shows you how to make the most of that and alter how your organization uses information.
What is data discovery?So we've already mentioned the new style of BI that Qlik pioneered, data discovery, a few times. In this section, we'll look at that in more detail.
Over the years, there have been many names of the different business intelligence methods and tools, such as:
• Executive Information Systems (EIS)• Management Information Systems (MIS)• Online Analytical Processing (OLAP)• Decision Support Systems (DSS)• Management reporting• Ad hoc query and reporting
Do we really need an additional label for something that in principle is the same thing? The answer is yes.
There is a fundamental difference between older technologies and data discovery, and it is in the approach. Most of the preceding tools are oriented towards technology, but data discovery is not. Instead, data discovery is oriented towards people—towards the users who need the information in their daily work.
Most of the preceding tools were developed for a small, select number of decision-makers, but again, data discovery is not. Data discovery is for everyone.
Chapter 1
[ 5 ]
Decisions are made at all levels in a company. Obviously, managers are decision-makers, but we sometimes forget that machine operators and receptionists are also decision-makers, albeit at a more local level. They also need information to make better decisions.
We, at Qlik, believe that information can change the world and that every user can contribute to this transformation. Everyone should easily be able to view data, navigate in data, and analyze data. Everyone should be able to experience that "a-ha" moment of discovery.
Data discovery is not just business intelligence. It is user-centric, dynamic, and empowering. And it is fun!
The empowered userSince its founding in 1994, Qlik has believed that a business could improve its processes and product quality by empowering employees and encouraging them to engage in lifelong learning. And Qlik meant all employees—we saw everyone as a decision-maker, not just managers.
Although some things have changed since then, much remains the same. Users are still often in a situation where they are unable to analyze their data—data that they have the right to see, or should have the right to see, in order to do a good job. Rigid systems, technical limitations, and poor user interfaces are usually the culprits.
However, people's expectations of software have changed dramatically during the last decade. Applications from Google and Apple invite users to interact with simple, friendly interfaces. Search bars, Like buttons, and touchscreens have transformed the way people explore, consume, and share information. Today, people want the same ease of use from their business tools as they get from their consumer tools at home.
The current trends such as the consumerization of software, performance improvements of hardware, usability improvements of software, mobile devices, social networks, and so on just accelerate this change. All these trends are reshaping user behavior. Yesterday, a user was a passive end user, but the user of tomorrow will be both able and demanding. They will demand tools that are fast, fl exible, and dynamic. They will demand tools that they can use themselves. The empowered user is here to stay.
Interaction with dataThe classic picture of business intelligence is that the user has one or several questions, and that the data holds the answers. So the problem boils down to creating a tool where the user can enter their questions, and the tool can return the answers.
Qlik Sense® and Data Discovery
[ 6 ]
However, this picture is incorrect. The truth is that the user does not always know the question initially. Or rather, if the user knows the question, they often already know the answer. So, the fi rst thing the tool should do is help the user fi nd the questions.
Finding the questions is a process that involves exploring the data. It involves testing what you suspect but don't know for sure. It also involves discovering new facts. Further, it involves playing with data, turning it around, scrutinizing the facts, and formulating a possible question. You use your gut feeling as a source of ideas and use the data to refi ne the ideas into knowledge; or to discard the ideas, if facts show that the ideas are wrong. You need to be able to play with the data, to turn facts around and look at them from different angles before you can say that you understand the data, and you need to understand the data before you can talk smartly about it.
When you have found a relevant question, you also need to be able to conduct an analysis to get a well-founded answer to the question.
Finally, the process involves presenting the answer to the question to other people as a basis for a decision or an action. The tool must support the entire process of going from ignorance to insight.
Hence, one major difference between data discovery and the more old-fashioned tools is that data discovery software supports the entire process—the process of coming from a blank mind, not knowing what you are looking for, all the way to attaining knowledge and taking action.
This is what data discovery is all about—helping you to prepare before you speak, act, or make a decision. It is the process of going from the darkness to the light, from the unknown to the known, from ignorance to insight. It is the process of going all the way from a blank mind to a substantiated argument.
Traditional business intelligence architectureIt is quite clear that users representing the business want the ability to ask and answer questions on their own so that they can make better decisions, but traditional business intelligence solutions aren't well suited for user demands. Instead, it is common that the systems are created in a report-centric manner, where governance and system demands set the goals, rather than user demands. The solutions often have preconfigured dashboards, fixed drill-down paths, predefined queries, predefi ned views, and very little fl exibility.
Chapter 1
[ 7 ]
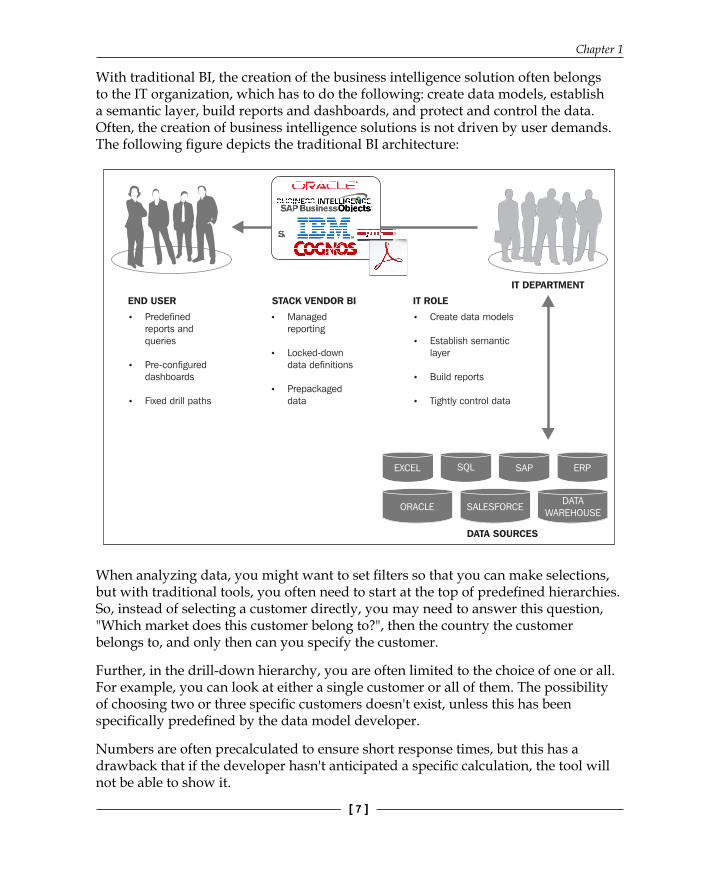
With traditional BI, the creation of the business intelligence solution often belongs to the IT organization, which has to do the following: create data models, establish a semantic layer, build reports and dashboards, and protect and control the data. Often, the creation of business intelligence solutions is not driven by user demands. The following fi gure depicts the traditional BI architecture:
EXCEL
ORACLE SALESFORCEDATA
WAREHOUSE
DATA SOURCES
ERPSAPSQL
END USER
� Predefinedreports andqueries
� Pre-configureddashboards
� Fixed drill paths
STACK VENDOR BI
� Managedreporting
� Locked-downdata definitions
� Prepackageddata
IT ROLE
� Create data models
� Establish semanticlayer
� Build reports
� Tightly control data
IT DEPARTMENT
When analyzing data, you might want to set fi lters so that you can make selections, but with traditional tools, you often need to start at the top of predefi ned hierarchies. So, instead of selecting a customer directly, you may need to answer this question, "Which market does this customer belong to?", then the country the customer belongs to, and only then can you specify the customer.
Further, in the drill-down hierarchy, you are often limited to the choice of one or all. For example, you can look at either a single customer or all of them. The possibility of choosing two or three specifi c customers doesn't exist, unless this has been specifi cally predefi ned by the data model developer.
Numbers are often precalculated to ensure short response times, but this has a drawback that if the developer hasn't anticipated a specifi c calculation, the tool will not be able to show it.
Qlik Sense® and Data Discovery
[ 8 ]
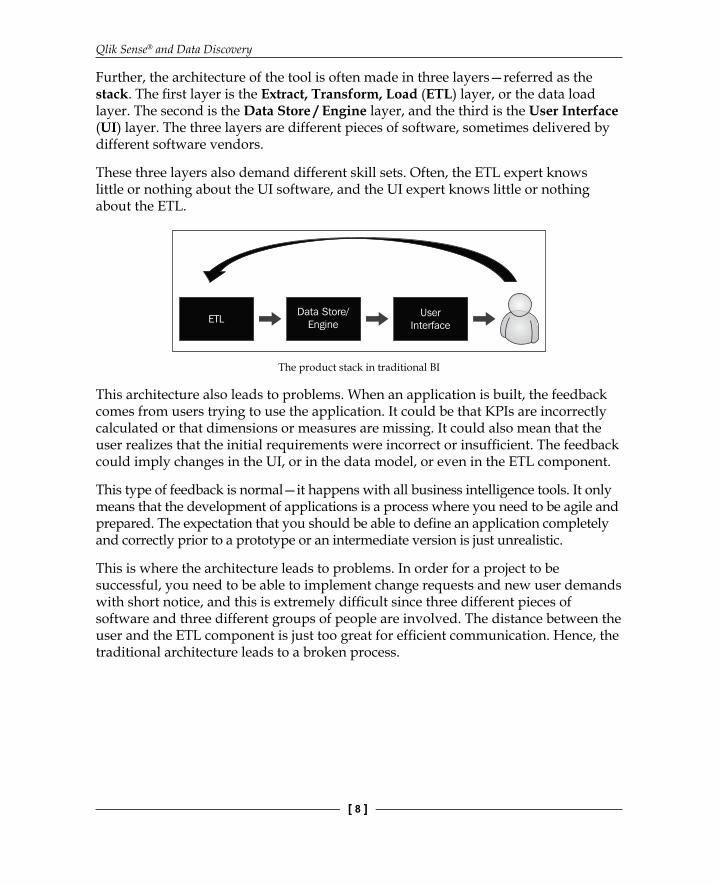
Further, the architecture of the tool is often made in three layers—referred as the stack. The fi rst layer is the Extract, Transform, Load (ETL) layer, or the data load layer. The second is the Data Store / Engine layer, and the third is the User Interface (UI) layer. The three layers are different pieces of software, sometimes delivered by different software vendors.
These three layers also demand different skill sets. Often, the ETL expert knows little or nothing about the UI software, and the UI expert knows little or nothing about the ETL.
ETLData Store/
EngineUser
Interface
The product stack in traditional BI
This architecture also leads to problems. When an application is built, the feedback comes from users trying to use the application. It could be that KPIs are incorrectly calculated or that dimensions or measures are missing. It could also mean that the user realizes that the initial requirements were incorrect or insuffi cient. The feedback could imply changes in the UI, or in the data model, or even in the ETL component.
This type of feedback is normal—it happens with all business intelligence tools. It only means that the development of applications is a process where you need to be agile and prepared. The expectation that you should be able to defi ne an application completely and correctly prior to a prototype or an intermediate version is just unrealistic.
This is where the architecture leads to problems. In order for a project to be successful, you need to be able to implement change requests and new user demands with short notice, and this is extremely diffi cult since three different pieces of software and three different groups of people are involved. The distance between the user and the ETL component is just too great for effi cient communication. Hence, the traditional architecture leads to a broken process.

Chapter 1
[ 9 ]
The Qlik® wayQlik has tried to solve all the drawbacks discussed in the preceding section by doing things differently.
First of all, you click and view. You don't need to formulate your question or tell the system more specifi cally what you want to look at. You just click, and by that, you say, "Tell me more about that…". Then you look at the calculation, KPI, or the fi eld that might be interesting.
Color codingThe color coding defi nes the answer. Some things are associated with what you clicked on, and they remain white. Others that are not associated become gray. The color coding is for simplicity. The user quickly gets an overview and understands how things work.
Showing the excluded reveals the unexpected, creates insight, and creates new questions. Hence, the gray color is an important part of making the Qlik experience an associative one—a data dialog and an information interaction—rather than just a database query. Showing you that something is excluded when you didn't expect it means answering questions you didn't ask. This surprise creates new knowledge in a way that only a true data discovery platform can.
Freedom of data navigationVia the associative experience, a user has total freedom to navigate through data and make any combination of selections. Any number of values can be selected. No drill-down paths need to be predefi ned. This allows the user to follow their own train of thought instead of someone else's. Start anywhere and just follow your intuition.
This total freedom when exploring data is really the core attribute of data discovery.
Calculation on demandFurther, no numbers need to be precalculated. Via the QIX engine, QlikView and Qlik Sense calculate everything on demand, usually in a fraction of a second. The short response time allows the user to have a conversation with the data, where one answer leads to the next question, which in turn leads to next, and so on. Only this way can you interact with data so that you learn from it.
Qlik Sense® and Data Discovery
[ 10 ]
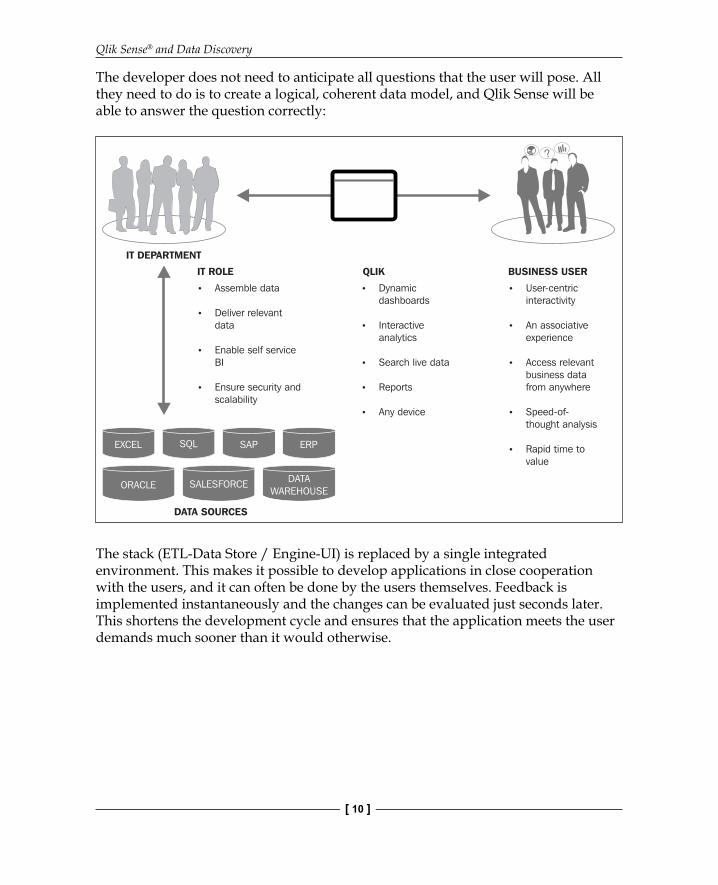
The developer does not need to anticipate all questions that the user will pose. All they need to do is to create a logical, coherent data model, and Qlik Sense will be able to answer the question correctly:
EXCEL
ORACLE SALESFORCE DATAWAREHOUSE
DATA SOURCES
ERPSAPSQL
BUSINESS USER
� User-centricinteractivity
� An associativeexperience
� Access relevantbusiness datafrom anywhere
� Speed-of-thought analysis
� Rapid time tovalue
QLIK
� Dynamicdashboards
� Interactiveanalytics
� Search live data
� Reports
� Any device
IT ROLE
� Assemble data
� Deliver relevantdata
� Enable self serviceBI
� Ensure security andscalability
IT DEPARTMENT
?
The stack (ETL-Data Store / Engine-UI) is replaced by a single integrated environment. This makes it possible to develop applications in close cooperation with the users, and it can often be done by the users themselves. Feedback is implemented instantaneously and the changes can be evaluated just seconds later. This shortens the development cycle and ensures that the application meets the user demands much sooner than it would otherwise.
Chapter 1
[ 11 ]
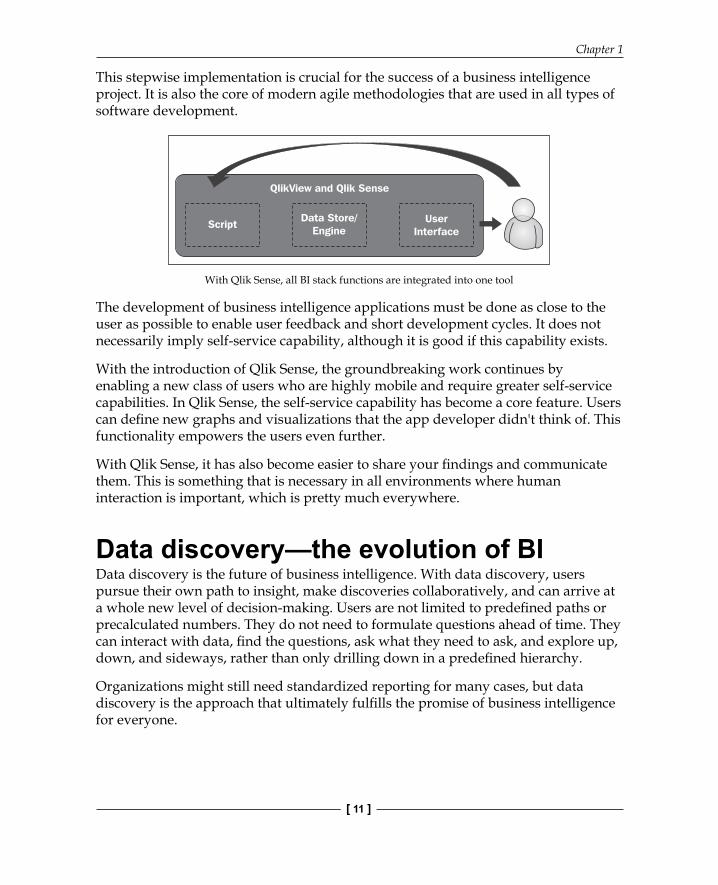
This stepwise implementation is crucial for the success of a business intelligence project. It is also the core of modern agile methodologies that are used in all types of software development.
ScriptData Store/
EngineUser
Interface
QlikView and Qlik Sense
With Qlik Sense, all BI stack functions are integrated into one tool
The development of business intelligence applications must be done as close to the user as possible to enable user feedback and short development cycles. It does not necessarily imply self-service capability, although it is good if this capability exists.
With the introduction of Qlik Sense, the groundbreaking work continues by enabling a new class of users who are highly mobile and require greater self-service capabilities. In Qlik Sense, the self-service capability has become a core feature. Users can defi ne new graphs and visualizations that the app developer didn't think of. This functionality empowers the users even further.
With Qlik Sense, it has also become easier to share your fi ndings and communicate them. This is something that is necessary in all environments where human interaction is important, which is pretty much everywhere.
Data discovery—the evolution of BIData discovery is the future of business intelligence. With data discovery, users pursue their own path to insight, make discoveries collaboratively, and can arrive at a whole new level of decision-making. Users are not limited to predefined paths or precalculated numbers. They do not need to formulate questions ahead of time. They can interact with data, fi nd the questions, ask what they need to ask, and explore up, down, and sideways, rather than only drilling down in a predefi ned hierarchy.
Organizations might still need standardized reporting for many cases, but data discovery is the approach that ultimately fulfills the promise of business intelligence for everyone.
Qlik Sense® and Data Discovery
[ 12 ]
Data discovery is the inevitable consequence of demands from active users who want information from the ever-increasing amount of data. From the very beginning, the core of the Qlik philosophy was the empowered user. It affects both the view of how BI solutions should be developed and how the user interface of the tool should be designed.
In summary, data discovery is user-centric; it is BI for the empowered user. It means total freedom in how data is explored. It should be simple and have as few limitations as possible. Data discovery means a user-centric development process so that user feedback can be implemented instantaneously.
SummaryIn this chapter, we looked at why Qlik developed Qlik Sense and at the ethos and value of data discovery in contrast to older forms of BI.
In the next chapter, we will look in detail at Qlik Sense itself and how its features help in meeting these requirements, beginning with the application life cycle.
Where to buy this book You can buy Learning Qlik Sense® The Official Guide Second Edition from the
Packt Publishing website.
Alternatively, you can buy the book from Amazon, BN.com, Computer Manuals and most internet
book retailers.
Click here for ordering and shipping details.
www.PacktPub.com
Stay Connected:
Get more information Learning Qlik Sense® The Official Guide Second Edition