learning to lead: a quasi-experimental test of the
TRANSCRIPT
LEARNING TO LEAD: A QUASI-EXPERIMENTAL TEST OF THE INTERPLAY
BETWEEN EXPERIENCE AND TRAINING
A DISSERTATION SUBMITTED TO THE FACULTY OF THE
UNIVERSITY OF MINNESOTA BY
STEPHEN L. JONES
IN PARTIAL FULFILLMENT OF THE REQUIREMENTS FOR THE DEGREE OF
DOCTOR OF PHILOSOPHY
ANDREW H. VAN DE VEN, ADVISOR
JULY 2015

© Stephen Jones 2015

i
Acknowledgements
I express my deepest gratitude to my dissertation committee: Andy Van de Ven, Pri Shah, Gurneeta
Singh, Harry Sapienza, and Bryan Dowd. I read Andy’s book, Engaged Scholarship, in the first
year of my Ph.D. program. It rang true to me. I wanted to be an engaged scholar able to impact
both theory and practice. Over the next four years Andy mentored me and showed me by example
what it means to be engaged. He invited me on multiple company visits. I discovered the important
difference between being an engaged scholar and a consultant. I also discovered that Andy’s
success in engaged scholarship is inextricably tied, I believe, to his graciousness and good nature.
His guidance was invaluable as I developed the relationship with my research site.
Pri played a critical role as I designed my study. Her counsel on survey design and
measurement was prescient: it aided in capturing some of the most insightful findings in this study.
She also provided valuable suggestions for framing the study and for making a contribution to the
field. Moreover, her belief in me buoyed me up through difficult days, which are so common in the
process of writing a dissertation.
Gurneeta’s insightful criticism always motivated me to create my best work. She helped
me see the blind spots in my arguments and provided helpful guidance.
Harry also provided insightful criticism and provided guidance for thinking with precision
about constructs, hypotheses, and underlying mechanisms. I will always fondly remember our
discussions that seemingly generated a hundred research ideas with every conversation.
I am grateful for Bryan’s instruction in statistical methods which has impacted this study
and the analysis of nearly every paper I have written.
I also wish to thank Martin Ganco who provided valuable advice early on in the design of
this study, Michael Cummings who was an ad hoc reviewer of my work, and Amie Norden who
provided insights into training methods. I also wish to thank my partners within the Learning and
Development team at the research site who provided access and support from within.

ii
Dedication
To Claire, whose unfailing support, encouragement, and faith in my capacity have sustained me
through my Ph.D. program.
iii
Abstract
Two dominant ways that employees learn leadership skills are formal training and on-the-job
experience. Both types of learning are ubiquitous in organizations, but their interplay is rarely
considered. In this study, I adopt learning theories from educational and cognitive psychology to
explain why experience may help or hinder the effectiveness of leadership training, and I test my
hypotheses using a quasi-experiment in a public accounting firm. I also examine the impact of other
individual differences—cognitive ability, motivation to lead, learning goal orientation, and pre-
training self-efficacy—on training effectiveness.
From the perspective of the leader, prior leadership experience significantly improved the
effectiveness of leadership training. Leaders who had led more projects and had been exposed to a
broader range or leadership situations were those who benefit the most from leadership training.
The results support the theory that cognitive constraints impede learning during training for novice
leaders and are alleviated when leaders possess more experience. However, the same support was
not found from the manager and subordinate perspectives.
Regarding individual differences, there was clear evidence for the benefit of a learning goal
orientation, mixed evidence for the benefit of motivation to lead, very limited evidence for self-
efficacy, and no evidence for cognitive ability. The implications of these findings for theory and
practice are discussed.

iv
Table of Contents
List of Tables ............................................................................................................................... v
List of Figures ............................................................................................................................. vi
1. Introduction .................................................................................................................................. 1
2. Theory and Hypotheses ................................................................................................................ 5
Experience and Training as Modes of Learning .......................................................................... 5
Leadership Training ..................................................................................................................... 5
Moderating Impact of Experience ............................................................................................... 7
Moderating Impact of Other Individual Characteristics ............................................................ 11
3. Methodology .............................................................................................................................. 17
Research Setting ........................................................................................................................ 17
Training Manipulation ............................................................................................................... 17
Research Design ........................................................................................................................ 18
Variables .................................................................................................................................... 20
Sample ....................................................................................................................................... 24
Analytic Approach ..................................................................................................................... 32
4. Results ........................................................................................................................................ 37
Descriptive Statistics .................................................................................................................. 37
Leader Perspective ..................................................................................................................... 40
Subordinate Perspective ............................................................................................................. 54
Manager Perspective .................................................................................................................. 59
5. Discussion .................................................................................................................................. 64
The Interplay between Experience and Training ....................................................................... 64
Other Important Individual Characteristics................................................................................ 66
Implications for Theory ............................................................................................................. 67
Implications for Practice ............................................................................................................ 69
Limitations ................................................................................................................................. 69
6. Bibliography .............................................................................................................................. 71
7. Appendix A: Survey Items ......................................................................................................... 81
8. Appendix B: Large Tables ......................................................................................................... 90
v
List of Tables
Table 1. Leader, subordinate, and manager samples. .................................................................... 25
Table 2. Nonresponse comparisons. .............................................................................................. 29
Table 3. Nonrandom group comparisons. ...................................................................................... 31
Table 4. Selected descriptive statistics. .......................................................................................... 38
Table 5. Selected bivariate correlations: leadership behaviors. ..................................................... 39
Table 6. Selected bivariate correlations: leader characteristics. .................................................... 40
Table 7. Relationship between moderators and base (week 0) leadership behaviors. ................... 40
Table 8. Main effect of training: leader perspective. ..................................................................... 42
Table 9. Moderating effects entered individually: leader perspective. .......................................... 43
Table 10. All moderating effects: leader perspective. ................................................................... 44
Table 11. Three-way interaction with opportunity to lead: leader perspective. ............................. 47
Table 12. Alternative lagged DV models: leader perspective. ....................................................... 52
Table 13. Main effect of training: subordinate perspective. .......................................................... 55
Table 14. Moderating effects entered individually: subordinate perspective. ............................... 56
Table 15. Main effect of training: manager perspective. ............................................................... 61
Table 16. Moderating effects entered individually: manager perspective. .................................... 62
Table 17. All moderating effects: manager perspective................................................................. 63
Table 18. Summary of findings. .................................................................................................... 65
Table 19. CFA for time-varying constructs (measured at multiple time periods). ........................ 90
Table 20. CFA for time-invariant constructs (measured only once). ............................................. 91
Table 21. Means and standard deviations. ..................................................................................... 93
Table 22. Bivariate correlations. .................................................................................................... 95
vi
List of Figures
Figure 1. Constraint on learning in training from underdeveloped schemata. ................................. 8
Figure 2. Ceiling constraint on learning in training. ........................................................................ 9
Figure 3. Learning in training. ....................................................................................................... 10
Figure 4. Research design. ............................................................................................................. 19
Figure 5. Number of project leaders rated, by perspective. ........................................................... 27
Figure 6. Project leader audit vs. tax. ............................................................................................. 28
Figure 7. Number of projects led. .................................................................................................. 32
Figure 8. Leadership behaviors over time: leader perspective. ...................................................... 41
Figure 9. Predicted effect of training and experience (projects led). ............................................. 46
Figure 10. Predicted effect of training, experience (breadth), and opportunity to lead. ................ 48
Figure 11. Predicted effect of training and learning goal orientation. ........................................... 50
Figure 12. Leadership behaviors over time: subordinate perspective. ........................................... 54
Figure 13. Retrospective change in leadership behaviors: manager rating. ................................... 60

1. INTRODUCTION
Informal, on-the-job experience and formal training are two ubiquitous modes of learning in
organizations. Both are integral for managerial and employee development, and they may interact
in important ways. However, we know surprisingly little about the interplay between experiential
learning and formal training. Both are concerned with the development of knowledge and skill, yet
they are usually treated separately in both research and practice. The organizational learning
literature primarily focuses on various forms of experiential learning—such as trial-and-error
learning, improvisation, and indirect experience (Darr, Argote, & Epple, 1995; Levitt & March,
1988; Miner, Bassoff, & Moorman, 2001)—with little regard to training. On the other hand, the
training and development literature builds on educational models with formalized learning
objectives and instructional methods (Craig, 1996) but pays little attention to employee experience.
In practical terms, training is often offered to employees whether or not their individual experiences
have prepared them for learning (Taylor, 1998). Over two decades ago, Adler and Clark (1991)
suggested that experience and training interact to impact training, but few researchers have taken
up the topic since (exceptions are Bapna, Langer, & Mehra, 2013; Jentsch, Bowers, & Salas, 2001).
Yet, there are reasons to believe that this interaction matters for learning in organizations.
Educational and cognitive psychologists have argued that prior knowledge and experience
fundamentally alter the way learners’ encounter instruction (Bandura, 1986; Sweller, 2011; van
Gog & Rummel, 2010). Their work suggests a crucial role for experience when learning through
training.
To explore this interplay, I focus on learning to lead. Leadership is fundamental to
organizational functioning, and it is an apposite knowledge domain for the question at hand.
Leadership abilities include explicit behaviors and interaction patterns that can be molded through
training (Collins & Holton, 2004) as well as deeper, nuanced capacities that are less structured and
more tacit in nature (Janson & McQueen, 2007). The blended nature of leadership affords
development through both experience and training. With leadership as the knowledge context, I
ask: How does prior leadership experience impact the effectiveness of leadership training?

Introduction 2
Research that examines training effectiveness has focused on many trainee characteristics
other than experience. Evidence suggests that cognitive ability (Kanfer & Ackerman, 1989; Ree &
Earles, 1991), motivation (Chiaburu & Marinova, 2005; Colquitt & Simmering, 1998; Klein, Noe,
& Wang, 2006), learning goal orientation (Ford, Smith, Weissbein, Gully, & Salas, 1998; Klein et
al., 2006), and self-efficacy (Gist, Stevens, & Bavetta, 1991; Tracey, Hinkin, Tannenbaum, &
Mathieu, 2001) impact training outcomes (Blume, Ford, Baldwin, & Huang, 2010; L. A. Burke &
Hutchins, 2007; Colquitt, LePine, & Noe, 2000). Yet, these individual characteristics have only
been studied in contexts where training is assumed to be necessary for learning. Those who receive
training have not been compared to those who learn through on-the-job experience only. The
concern is that the same characteristics that help individuals excel during training may also help
them excel through their normal work experiences. Thus, the impact of individual characteristics
on training outcomes may be overstated because the results have not been compared to a non-
trained, experiential learning group. As part of this study, I also ask: How does cognitive ability,
motivation to lead, learning goal orientation, and self-efficacy impact the effectiveness of
leadership training when trainees are compared to similar others who are not trained?
To explore these questions, I conducted a quasi-experiment with employees in a U.S.
accounting firm, which I call Partners in Public Accounting (PPA). PPA assigns employees to lead
tax and audit projects when they reach about two years of experience in the company. Project
leaders manage and mentor less-experienced coworkers. The treatment group was comprised of
project leaders with virtually none to a few years of project leadership experience; they received a
newly-developed leadership training module. The treated group attended a newly-developed
leadership training session, and the control group was not trained during the study period. Learning
was captured by measuring leadership behaviors both before and after training from the perspective
of the leaders, their subordinates on the projects, and their managers. To gain a deeper
understanding of experience, I conceptualized and measured it both as an accumulation over time
and as a breadth and depth of exposure to leadership situations. Because the treatment was not
randomized (the organization would not allow for randomization), I account for systematic causes
of employees being in different groups.
I draw from the educational psychology, training, and organizational learning literatures to
propose that greater experience will increase the benefit of training. That is, the training treatment
will have greater impact on more-experienced trainees than on less-experienced trainees when
compared to similarly experienced peers that are not trained. The benefit of experience for training,
however, may subside at increasingly higher levels of experience. The premise is that experience
Introduction 3
generates a corpus of prior knowledge and skill that allows trainees to better comprehend and
integrate the training that is offered (van Gog & Rummel, 2010). Novice trainees are prone to miss
important elements from training due to their lack of familiarity (Jentsch et al., 2001; Tuovinen &
Sweller, 1999). Greater experience is beneficial only up to a point when other effects begin to
operate that suppress its benefits. I also argue that training will be more useful to employees with
greater cognitive ability, motivation to lead, learning goal orientation, and self-efficacy. That is,
they will learn more than employees who are lower in these characteristics when compared to
similar non-trained employees. Employees with these characteristics are apt to exploit the learning
opportunities training affords—opportunities not present in their proximate work environment.
This study contributes to our understanding of when training is most effective, which is an
important theoretical point. Existing theory does not address the appropriate timing of training in
view of learners’ experience levels. The study disentangles contrasting arguments for why
experience may help or hinder training effectiveness, and it reveals the importance of accounting
for prior experience. It also advances our understanding of four individual characteristics—
cognitive ability, motivation to lead, learning goal orientation, and self-efficacy—thought to be
important for training effectiveness. It take these individual characteristics, which have been
primarily tested in laboratory settings, and considers whether they’re influence is found in a field
setting compared to a non-trained control group.
This study also provides important insights for training practices in organizations. It is
estimated that U.S. organizations spend over $150 billion on learning and development (ASTD,
2012); the U.S. training industry is comparable in size to the U.S. logging or fishing industries
(IBISWorld, 2014). Yet, training dollars are often spent with no accountability or indication of their
effectiveness (Awoniyi, Griego, & Morgan, 2002; Collins & Holton, 2004; Stern, 2011). Further,
organizations often do not know which employees will benefit from training, which has prompted
persistent calls for more organizations to conduct “needs analysis” (Aguinis & Kraiger, 2009; Salas
& Cannon-bowers, 2001). The study builds upon this call to action by revealing that neglecting to
account for experience can lead to training insufficiently experienced employees and managers
who are apt to realize little benefit from the training. Many training dollars likely provide no return
because individuals are ill-prepared in terms of their experience.
This study serves as a first step in understanding the interplay between experience and
training, and it constitutes an initial effort to create a coherent picture of an individual’s
development through both informal, on-the-job experiences and formal training. It also serves to
better integrate experiential learning and training literatures, which have developed separately in

Introduction 4
the past. Moreover, the study will help further our understanding of important individual
characteristics that impact training in an authentic leadership setting.
2. THEORY AND HYPOTHESES
Experience and Training as Modes of Learning
There are multiple modes through which individuals and organizations learn (Aguinis & Kraiger,
2009; Argote, 2013; Dragoni, Tesluk, Russell, & Oh, 2009; Huber, 1991; Kram & Isabella, 1985;
Lave & Wenger, 1991). I focus on on-the-job experience and formal training because, while they
are ubiquitous in organizations, they are not jointly understood. Formal training includes
classroom-based, online, or self-paced formal instruction (Aguinis & Kraiger, 2009; DeRouin,
Fritzsche, & Salas, 2004). Formal training’s defining distinction is that individuals set aside work
activities for preprogrammed instruction created by experts in the knowledge domain. Formal
training aims to develop attitudes, cognitive understanding, or procedural skills that can be utilized
at work (Kraiger, Ford, & Salas, 1993). Thus, transfer of training to the work context is a primary
concern (Blume et al., 2010).
On-the-job experience, on the other hand, is not concerned with transfer because it is, ipso
facto, applied to the work setting. Learning through on-the-job experience is a process of reflecting
on the results of past actions and adjusting future behaviors to improve future results (Cyert &
March, 1963; Gavetti & Levinthal, 2000; Kolb, 2014). With learning born of personal experience,
the quality of experiences and nature of reflection become paramount (Dragoni et al., 2009; Kolb,
2014). On-the-job experiences may be guided by quasi-formal training through apprenticeships or
mentoring as well (Chao, 1997; Lave & Wenger, 1991); however, apprenticeship and mentoring
learning modes are beyond the scope of this study.
Leadership Training
In this project I adopt a skills-based view of leadership, which is apropos for this topic and context.
Following the tradition of the classic Ohio State leadership studies, I view leadership as a set of
behaviors practiced by leaders that relate to tasks and relationships (Halpin & Winer, 1957; Yukl,
Gordon, & Taber, 2002). Leadership learning is theorized as a change in leadership behavior from
one time point to the next. Conceptualizing learning as a behavioral change is common for studies
Theory & Hypotheses 6
of learning in organizational settings (Argote, 2013). Leadership training can lead to changes in
leadership behaviors as it has the potential to change the attitudes, knowledge, and skills of leaders,
which result in on-the-job differences.
Classroom-based job training began with the industrial revolution, but its ascendance as a
learning method came with the rise of scientific management and the exigencies of World War I &
II (Sleight, 1993). Since that time, leadership training has been broadly implemented by
organizations. The systematic investigation of leadership training began in the 1960s. In 1968,
Hand and Slocum (1972) provided a training course to a randomized group of managers at a
Pennsylvania steel mill. Eighteen months later, the trained managers demonstrated significantly
better leadership behaviors than the non-trained managers. Since that time, many studies have
shown positive effects of management training in manufacturing (Burnaska, 1976; Earley, 1987;
Latham & Saari, 1979; Sorcher & Spence, 1982), health care (Wexley & Nemeroff, 1975), retail
banking (Barling, Weber, & Kelloway, 1996; Mathieu & Leonard, 1987), insurance sales (Frayne
& Geringer, 2000), pharmaceutical (Morrow, Jarrett, & Rupinski, 1997), military (Dvir, Eden,
Avolio, & Shamir, 2002), and restaurant (Tews & Tracey, 2008) contexts. The degree of positive
findings led Aguinis and Kraiger (2009, p. 452) to proclaim in their review that “training in work
organizations produces clear benefits for individuals…teams, [and] organizations.”
Many leadership trainings use behavioral modeling techniques, which are rooted in
Bandura’s social learning theory (Bandura, 1977, 1986). Bandura theorized that individuals act
based on their symbolic framing of environmental influences, which allows them to learn through
observation. Thus, individuals do not only learn through their own experiences, but they also learn
vicariously through the experiences of others (Bandura, 1986). Behavioral modeling provides
examples of effective and ineffective behavior and shows the good and bad consequences of the
behaviors (Taylor, Russ-Eft, & Chan, 2005).
Social learning theory is frequently cited as the reason for a training’s impact (Latham &
Saari, 1979; Sorcher & Spence, 1982), but social learning theory alone does not sufficiently explain
why training may improve learning beyond that gained through on-the-job experience. On-the-job
experience includes learning not only from one’s own work experiences but also vicariously by
observing proximate superiors, peers, and subordinates. Experiential learning does not occur in a
vacuum; behavioral modeling naturally occurs in work settings too. So why would it not lead to
the same learning outcomes as training? To help explain why, I adopt ideas from organizational
theory.

Theory & Hypotheses 7
It is helpful to view individuals’ leadership responsibilities as a suite of problems that
require solutions (Nickerson & Zenger, 2004). Individuals search for solutions to problems when
current solutions are missing or lead to inferior performance (Cyert & March, 1963). Searching for
solutions is often a task of observing others who model superior behaviors. With the demands of
everyday responsibilities, individuals are limited in the scope of their search for solutions to
proximate coworkers. An individual’s on-the-job learning constitutes a local search for behavioral
models (Gavetti & Levinthal, 2000). Training provides an opportunity for individuals to observe
behavioral solutions that are not likely visible in the local search space. In this way, training
improves learning by providing access to superior models that might not have been found
otherwise. Social learning theory, then, can explain the effectiveness of leadership training
inasmuch as the behavioral models shown in training are superior and not readily accessible outside
of training. In the case of training project leaders, the training will likely expose employees to
leadership solutions they have not observed in their proximate work context. Project leaders will
gain new insights that they can apply directly to their work, which should be visible to both them,
their subordinates, and their managers.
Hypothesis 1 (H1): Trained project leaders will improve in their leadership
behaviors more than non-trained project leaders, as judged by (a) themselves, (b)
their subordinates, and (c) their managers.
Moderating Impact of Experience
There are two contrasting arguments for why greater experience may help or hinder learning from
training. On the one hand, experience may increase learning because it serves as a base of
understanding on which training can build. On the other hand, experience may also decrease
learning because experienced trainees have less to learn. These two explanations can be reconciled
by viewing them as constraints on learning that are manifest at different places on the experience
continuum from novice to expert.
Cognitive load theory from educational psychology supports the first argument (Paas,
Renkl, & Sweller, 2003; Schnotz & Kürschner, 2007; Sweller, 1988, 2011; Van Merriënboer &
Sweller, 2005). It proposes that human cognitive architecture is divided into working memory and
long-term memory. While working memory is severely limited in its capacity to process
information, long-term memory has near unlimited capacity. In long-term memory, complex
information is stored in mental schemata that serve as organizing frames and processing rules that
can be utilized without conscious processing (Sweller, 2011). Mental schemata, which are

Theory & Hypotheses 8
developed with experience, overcome the learning constraints imposed by working memory and
demarcate experts from novices (Chi, Feltovich, & Glaser, 1981). Novices, then, are much more
prone to experience cognitive overload, which hinders learning.
The insights from cognitive load theory are also found in social learning theory (van Gog
& Rummel, 2010). Both theories explicate learning from others, with cognitive load theory focused
on direct instruction and social learning theory focused on observation (Bandura, 1986; cf. Van
Merriënboer & Sweller, 2005). Social learning theory explains that individuals are better able to
capture the important elements of behavioral models when they have had some exposure to those
elements in the past. Prior knowledge provides a frame for deciphering subtle cues. When prior
knowledge is lacking, learning is more likely to be fragmentary or even misguided. Modeled
behavior is a complex form of instruction, and novices have difficulty discerning meaningful
elements of behavior from behavioral elements that are merely distractions. They are also less likely
to detect errors, which can lead to adopting faulty behaviors (Bandura, 1986; van Gog & Rummel,
2010).
The importance of prior knowledge for assimilating new knowledge is also foundational
to the organizational concept of absorptive capacity (Cohen & Levinthal, 1990). Absorptive
capacity builds on cognitive research at the individual level that recognizes the importance of
mental categorization and association to develop understanding as well as the necessity of building
a corpus of knowledge to give conceptual meaning to language (Bower & Hilgard, 1981; Lindsay
& Norman, 1977).
Experience
Learning
Schema constraint
Figure 1. Constraint on learning in training from underdeveloped schemata.
Theory & Hypotheses 9
These theories suggest that trainees with greater prior knowledge will be better able to learn
from training. Those lacking experience will learn less because of inadequate mental schemata.
Thus, a schema constraint acts as the essential limitation. It is likely that this constraint is most
pressing for very inexperienced learners (Jentsch et al., 2001). The constraint may quickly lessen
as learners construct rudimentary mental schemata, and it may continue to subside with greater
experience. The schema constraint is depicted in Figure 1.
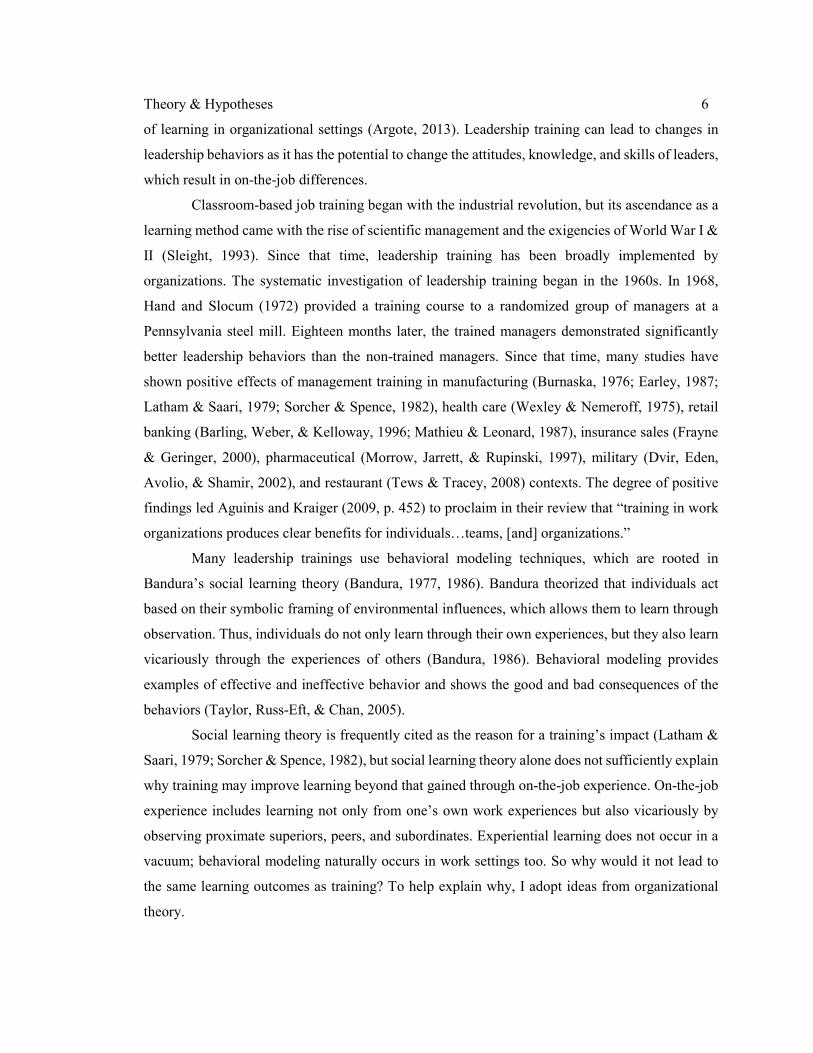
The second argument is supported by the simple notion that those with greater knowledge
have less to learn from training. In essence, the learning objectives and topics covered in training
act as a ceiling such that it is difficult to learn more than is taught. The amount of learning possible
is a function of what is currently known by an individual and what the training teaches. As the
distance between these two variables decreases, so does the amount of potential learning. Training
may include much wasted time if learning objectives are too easy. This view is expressed by
Schnotz & Kürschner (2007) who attribute non-learning among more-experience subjects in some
laboratory experiments to educational manipulations that were too easy. The training ceiling may
not be strictly rigid—trainees may create new ideas that inform behavior by associating or
combining instruction and past experience in novel ways (Dyer, Gregersen, & Christensen, 2011)—
but it would be difficult for any trainee to advance much beyond the given training level. Moreover,
even if training is not objectively too easy, experienced trainees may perceive there is little to learn
and engage less (Knowles, 1996). Inertial influences may create an unwillingness to change
leadership behaviors. Based on this logic, Figure 2 displays a ceiling constraint that decreases
learning as experience increases.
Experience
Learning
Ceiling constraint
Figure 2. Ceiling constraint on learning in training.

Theory & Hypotheses 10
The ceiling and schema constraints are always present, but one is more likely to be the
limiting factor than the other at different locations on the experience continuum. Learning by
novices is more likely to be limited by the schema constraint, whereas learning by experts is more
likely to be constrained by the ceiling constraint, as shown in Figure 3. Learning is constrained to
the area below the bold, dashed line. Given specific training objectives, experience increases
learning potential up to a point after which learning potential declines.
For my research question, it is also important to consider learning rates among experience-
only learners. For employees who are developing leadership behaviors solely based on on-the-job
experiences, their development will likely follow a traditional learning curve. Psychologists and
organization scholars have documented that learning improvements by individuals and
organizations follow a power law (Argote, 2013). That is, performance in a specific domain
improves at a decreasing rate with the accumulation of experience. The implication from learning
curves is that while more experienced individuals systematically have higher performance, the rate
of their learning is lower than those with less experience.
In sum, novice leaders may gain little additional learning from leadership training
compared to non-trained novices. Only small gains are likely because novice leaders have much to
gain simply through on-the-job practice and because they lack background experience that would
help them learn in training. In contrast, training is likely to have a larger impact as employees gain
more experience leading. The rate of learning through experience decreases as employees gain
more experience, and, at the same time, they become better able to master behaviors taught in
Schema constraint
Experience
Learning Ceiling constraint
Figure 3. Learning in training.
Theory & Hypotheses 11
training. The benefit of training will likely increase as experience increases up to the point at which
the ceiling constraint for training takes effect. At that point the benefits of training for increased
experience will no longer grow.
Because most project leaders in the sample had little leadership experience, the schema
constraint is likely to play a larger role. If the sample included more seasoned leaders, then the
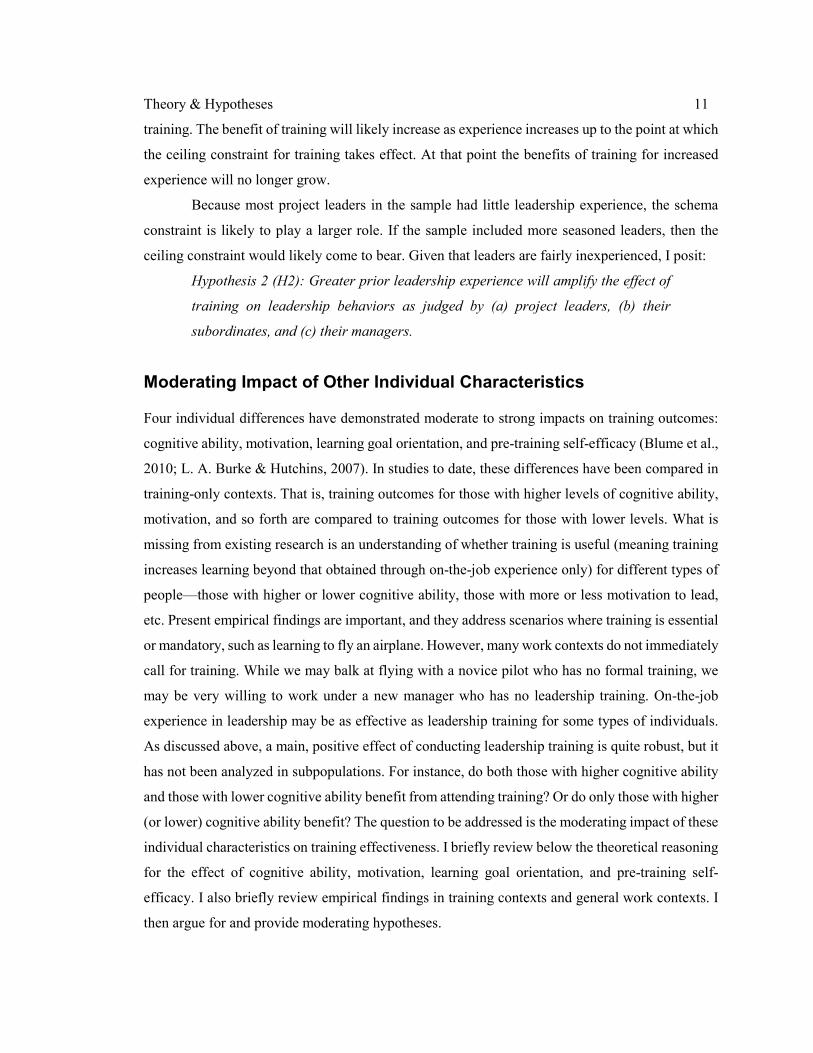
ceiling constraint would likely come to bear. Given that leaders are fairly inexperienced, I posit:
Hypothesis 2 (H2): Greater prior leadership experience will amplify the effect of
training on leadership behaviors as judged by (a) project leaders, (b) their
subordinates, and (c) their managers.
Moderating Impact of Other Individual Characteristics
Four individual differences have demonstrated moderate to strong impacts on training outcomes:
cognitive ability, motivation, learning goal orientation, and pre-training self-efficacy (Blume et al.,
2010; L. A. Burke & Hutchins, 2007). In studies to date, these differences have been compared in
training-only contexts. That is, training outcomes for those with higher levels of cognitive ability,
motivation, and so forth are compared to training outcomes for those with lower levels. What is
missing from existing research is an understanding of whether training is useful (meaning training
increases learning beyond that obtained through on-the-job experience only) for different types of
people—those with higher or lower cognitive ability, those with more or less motivation to lead,
etc. Present empirical findings are important, and they address scenarios where training is essential
or mandatory, such as learning to fly an airplane. However, many work contexts do not immediately
call for training. While we may balk at flying with a novice pilot who has no formal training, we
may be very willing to work under a new manager who has no leadership training. On-the-job
experience in leadership may be as effective as leadership training for some types of individuals.
As discussed above, a main, positive effect of conducting leadership training is quite robust, but it
has not been analyzed in subpopulations. For instance, do both those with higher cognitive ability
and those with lower cognitive ability benefit from attending training? Or do only those with higher
(or lower) cognitive ability benefit? The question to be addressed is the moderating impact of these
individual characteristics on training effectiveness. I briefly review below the theoretical reasoning
for the effect of cognitive ability, motivation, learning goal orientation, and pre-training self-
efficacy. I also briefly review empirical findings in training contexts and general work contexts. I
then argue for and provide moderating hypotheses.
Theory & Hypotheses 12
Cognitive Ability
Cognitive ability, general mental ability, or simply g, is regarded as a person’s information
processing or attentional capacity (Ackerman, 1988; Kanfer & Ackerman, 1989). It is theorized as
the limit of one’s working memory, and it can differ from one person to the next (Ackerman, 1988;
Just & Carpenter, 1992; Kyllonen & Woltz, 1989). It is also considered a measure of one’s ability
to learn (Hunter, 1986), particularly for tasks that are beyond simple motor skills (Ackerman,
1988).
Cognitive ability has been associated with better training outcomes in many studies
(Colquitt et al., 2000; Ree & Earles, 1991; Salas & Cannon-bowers, 2001). Training for new
knowledge or skills places high demands on working memory; thus, those with greater cognitive
capacity are apt to learn more from training (Colquitt et al., 2000). Cognitive ability is similarly
predictive of job performance for the same theoretical reasons (Hunter, 1986). It is also predictive
of leadership ability (Kickul & Neuman, 2000), though meta-analytic results show only a modest
correlation (Judge, Colbert, & Ilies, 2004).
Motivation to Lead
Motivation research is concerned with why individuals select and regulate behaviors. Kanfer and
Ackerman (1989) explain that motivation has a self-regulatory function when learning new things.
It monitors and channels cognitive resources toward the task at hand. While cognitive ability
defines the limits of attentional capacity, motivation determines the portion of that capacity that
will be allocated to a learning task.
Motivation itself may be derived from the discovery of intrinsically rewarding activities or
the cognitive choice to engage in an activity to pursue a valued outcome. Deci and Ryan’s (1985,
1991; Ryan & Deci, 2000) self-determination theory has a strong emphasis on intrinsic motivation.
It proposes that humans have innate capacities and preferences (i.e., the rudiments of mature
personality) and intrinsic psychological needs for competence, autonomy, and affiliation. From
young and throughout life, individuals interact with their environment and discover activities that
afford them the opportunity to support these basic needs. These activities, which provide positive
hedonic valence—meaning feelings of excitement, enjoyment, or delight—generate interest in the
activity and become intrinsically motivating. Individual interests vary among people because of
differences in their capacities and preferences as well as different social and environmental
experiences (Deci, 1992). Interest creates a psychological state of “focused attention, increased
cognitive functioning, persistence, and affective involvement” (Hidi, 2000, p. 311). Thus, interest

Theory & Hypotheses 13
or intrinsic motivation can play an instrumental role in learning because of its self-regulatory
function.
Other theories of motivation propose that individuals engage in behavior due to the value
placed on the expected outcomes instead of the value of the behaviors themselves. In expectancy-
value theories—Vroom’s (1964) expectancy theory being the best known in organizational
research—the choice to exert effort toward an activity is instrumental (Kanfer, 1990). If individuals
estimate that their efforts will lead to certain performance outcomes (i.e., expectancy), and those
outcomes hold personal value (i.e., valence), then they will decide to engage in the behavior
(Colquitt & Simmering, 1998). Differences in effort among individuals can be due to differences
in the value placed on likely outcomes or differences in the subjective perception that their efforts
will lead to those outcomes. Although expectancy theory provides an alternate origin for motivation
than self-determination theory, the importance of motivation as a self-regulatory function is
comparable.
Existing research demonstrates a strong association between motivation and training
outcomes (Colquitt et al., 2000). Tracey and colleagues (2001) found that motivation predicted
learning outcomes in a sample of new managers trained in management skills. Importantly for this
context, Chan and Drasgow (2001) also found a link between motivation to lead before training
and leadership potential at the end of training for military recruits. Motivation and leadership
behaviors have also been linked in non-training settings. Nursing managers in a U.S. hospital with
higher motivation to achieve also demonstrated greater leadership behaviors (McNeese-Smith,
1999).
Learning Goal Orientation
Learning goal orientation and its companion, performance goal orientation, are concerned with
achievement motivations. Goal orientation belongs to the field of motivation research (Kanfer,
1990), but it is considered separately from motivation to lead above because it focuses on specific
dispositions that relate to the development of competence. Dweck (1986) introduced the two goal
orientations through her research with school children. She found some children held learning goals
to increase their competence and master new skills while others held performance goals to obtain
positive evaluations of their competence and avoid negative evaluations. The important insight
from her research is that individuals who hold learning goals (sometimes called a mastery
orientation) seek challenge and enjoy exerting effort. However, those who hold performance goals
will only exert effort if they expect that they can perform at a high level; if they believe they lack
Theory & Hypotheses 14
ability, they will restrict their effort to avoid negative judgments. Students learn best when they are
stretched beyond their current abilities, so those with performance goal orientations are more likely
to under-engage in stretching tasks and to develop more slowly. An individual’s goal orientation is
a fairly stable (but malleable) disposition (Dweck & Leggett, 1988), so it can impact individual
development over time.
Learning goal orientation has been associated with improved learning in training and
regular work settings. Multiple studies in laboratory (Bell & Kozlowski, 2002; Ford et al., 1998)
and classroom (Brett & VandeWalle, 1999; Brown, 2001; Klein et al., 2006; Schmidt & Ford, 2003)
contexts have shown that a learning goal orientation improves training outcomes, though none
directly looked at leadership. In regular work settings, learning goal orientation is related to
learning in sales forces (VandeWalle, Brown, Cron, & Slocum, 1999) and, of more direct interest
here, in leader-member exchanges (Janssen & Van Yperen, 2004). In a review of the goal
orientation literature, Payne, Youngcourt, and Beaubien (2007) found that learning goal orientation
was associated with self-regulatory and learning outcomes as well as job performance.
Self-Efficacy
Self-efficacy is a belief held about one’s capabilities in a specific domain. It is derived from prior
success, from observing successful role models, from the encouragement of others, and from
affective states (Bandura, 1986). It too is an important concept in motivation, particularly for self-
regulation (Kanfer, 1990), as it mediates a person’s skill level and their actual behaviors. When
individuals have low efficacy beliefs, they are much less likely to engage in an action. Self-efficacy
is similar to expectancy in expectancy-value models of motivation. However, self-efficacy is a
judgment of one’s ability to perform a task (e.g., teach a class) whereas expectancy is a judgment
of one’s ability to achieve an outcome (e.g., get a high rating) from the performance of the task. As
self-efficacy can change over time, I focus on self-efficacy held before training that may impact
the effectiveness of training.
Like the other individual differences, self-efficacy is also tied to positive training
outcomes. Self-efficacy has been shown to improve training motivation and has impact in a variety
of settings (Bell & Kozlowski, 2002; Chiaburu & Marinova, 2005; Gist et al., 1991; Hughes et al.,
2013; Tracey et al., 2001), though, again, most evidence does not consider leadership training
directly. In the broader context of work, two meta-analytic reviews of self-efficacy and job
performance have demonstrated mixed results. Stajkovic and Luthans (1998) found that self-
efficacy is strongly associated to work outcomes for simpler tasks, but more difficult tasks have a

Theory & Hypotheses 15
weaker association. Judge and colleagues (2007) found that self-efficacy and work performance
had very little association when controlling for cognitive ability, Big 5 personality traits, and
experience. While there are robust theoretical arguments for self-efficacy, its impact outside of
training settings is ambiguous.
Moderation Hypotheses
The theoretical reasons for improved leadership ability described above apply equally well in
training and on-the-job work settings, and empirical work generally supports them in both contexts.
More motivated employees, for instance, can develop leadership capabilities faster than less
motivated employees in training and through work experience. So will more motivated or less
motivated employees benefit from leadership training? For employees with higher levels of
cognitive ability, motivation to lead, learning goal orientation, and self-efficacy, I posit the answer
is yes. As argued in Hypothesis 1, individuals have a limited scope of behavioral models available
to them in their daily work. That leaves only their personal leadership experiences and the few
examples near them to learn from. In any work position there may be plateau points at which little
in the proximate environment offers no new examples from which to learn. Ericsson, Krampe, and
Tesch-Römer (1993) explain that the quest for expert performance in nearly any area is filled with
plateaus that are not overcome until new teachers or new feedback sources enter. When employees
with higher levels of cognitive ability, motivation, etc., attend training, they are exposed to novel
“best-practice” models of leadership that they can adopt. Training provides access to learning
otherwise not available.
However, to benefit from training, employees must have sufficient ability and motivation
to do so (Noe & Schmitt, 1986). Employees with lower levels of cognitive ability, motivation to
lead, learning goal orientation, or self-efficacy are apt to face difficulties during leadership training.
They are more likely to struggle to direct sufficient cognitive attention to learn the leadership
behaviors. Thus, their growth in leadership skills may not be much greater than the growth of
employees with similar low levels who receive no training. Using this logic, I posit the following:
Hypothesis 3 (H3): Greater cognitive ability will amplify the effect of training on
improved leadership behaviors as judged by (a) project leaders, (b) subordinates,
and (c) managers.
Hypothesis 4 (H4): Greater motivation to lead will amplify the effect of training
on improved leadership behaviors as judged by (a) project leaders, (b)
subordinates, and (c) managers.

Theory & Hypotheses 16
Hypothesis 5 (H5): A stronger learning goal orientation will amplify the effect of
training on improved leadership behaviors as judged by (a) project leaders, (b)
subordinates, and (c) managers.
Hypothesis 6 (H6): Greater pre-training self-efficacy will amplify the effect of
training on improved leadership behaviors as judged by (a) project leaders, (b)
subordinates, and (c) managers.
3. METHODOLOGY
Research Setting
Partners in Public Accounting (a pseudonym) is a large public accounting firm headquartered in
the United States. It has offices in over thirty states and over three thousand employees. PPA offers
both tax and audit consulting services to government, non-profit and for-profit organizations in
multiple industries. Accountants who have been with PPA four or less years attend a week-long
(40-hour) training conference annually. Topics include tax regulations and rule changes, audit
procedures, productivity software, and business skills. Employees physically meet at one location.
To better understand PPA’s training program, I attended three different training
conferences from October to December 2013. I observed sessions on individual, partnership, and
non-profit taxation; auditing and audit software; and business writing. For a subset of classes I
logged the time spent lecturing, asking and discussing questions, and working on case studies. I
reviewed the materials for the sessions and spoke with teachers and participants during lunches and
breaks. I also had multiple meetings with members of the Learning and Development team that
organizes the training conferences.
To better understand the role of a project leader, I conducted nine interviews with six
different individuals who were project leaders or managers with tax or audit experience. Interviews
were semi-structured and were 45 to 60 minutes long. They included conversations concerning the
role of training in skill development and the leadership behaviors needed to lead projects.
Training Manipulation
In the summer of 2014, PPA introduced a new leadership development session in its third-year
training conference. The conference was held twice during summer: once in June with 125
participants (Trained Group 1) and once in July with 29 participants (Trained Group 2). The June
conference was larger because a third conference was planned for later in 2014, but it was cancelled.
All participants from the cancelled conference were moved to the June conference. Accountants
that attended the third-year conference were at a career stage where they began to lead projects and
assume responsibility to mentor less-experienced accountants. The purpose of the leadership
Methodology 18
training was to improve the accountants’ effectiveness in their new leadership role. The training
was 3.5 hours long and occurred on the second day of the conference. I observed both the June and
July sessions. The June conference was held at a hotel to accommodate the larger group and the
July conference was held at PPA headquarters. The sessions occurred in one room with participants
sitting at tables with 5-8 people per table. The training covered three topics: (1) how to effectively
teach project staff on the job, (2) how to appropriately give feedback, and (3) how to mentor and
provide effective work assignments. The June and July sessions were team-taught by the same two
internal experts. Both sessions were taught using the same materials, in the same order, and
following the same pedagogy. The instructors used behavioral modeling, discussions, lectures, and
practice during the session. Instructors used PowerPoint during lecture portions and large flipcharts
during discussion portions. For practice, participants received pre-populated Excel sheets on their
laptops that simulated tax or audit project scenarios. The participants paired with partners to
practice teaching and giving and receiving feedback. Participants were given handouts with a
summary of the learning points.
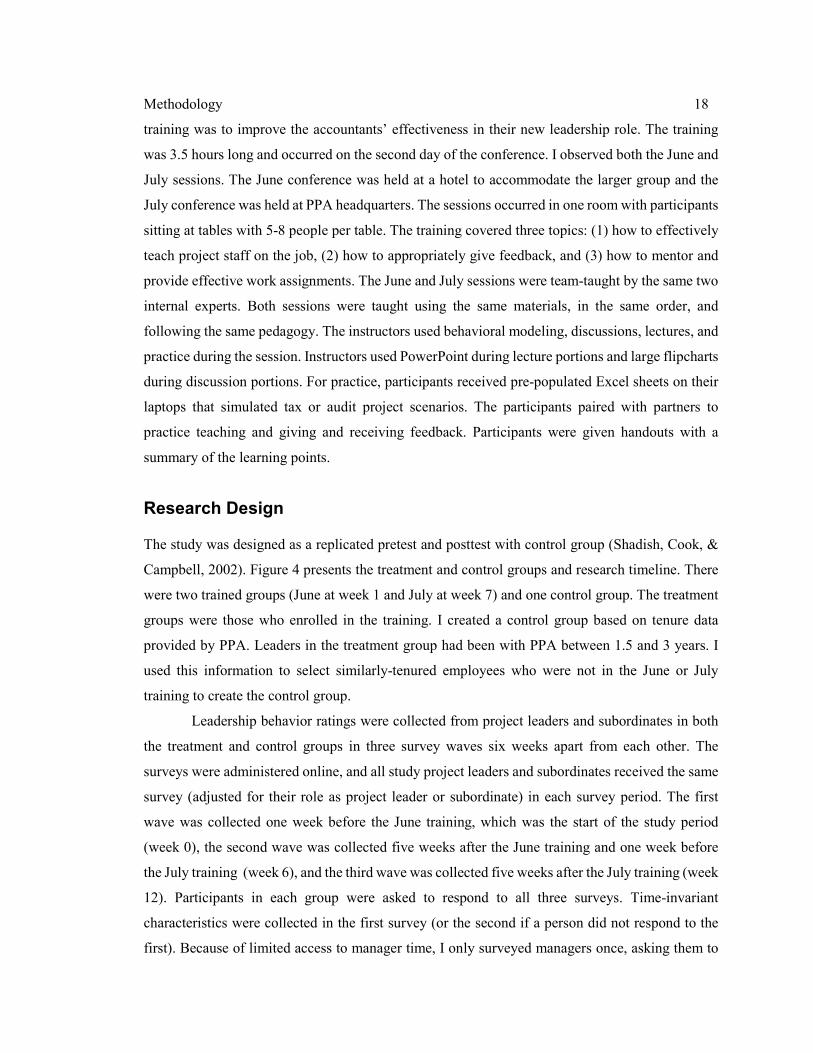
Research Design
The study was designed as a replicated pretest and posttest with control group (Shadish, Cook, &
Campbell, 2002). Figure 4 presents the treatment and control groups and research timeline. There
were two trained groups (June at week 1 and July at week 7) and one control group. The treatment
groups were those who enrolled in the training. I created a control group based on tenure data
provided by PPA. Leaders in the treatment group had been with PPA between 1.5 and 3 years. I
used this information to select similarly-tenured employees who were not in the June or July
training to create the control group.
Leadership behavior ratings were collected from project leaders and subordinates in both
the treatment and control groups in three survey waves six weeks apart from each other. The
surveys were administered online, and all study project leaders and subordinates received the same
survey (adjusted for their role as project leader or subordinate) in each survey period. The first
wave was collected one week before the June training, which was the start of the study period
(week 0), the second wave was collected five weeks after the June training and one week before
the July training (week 6), and the third wave was collected five weeks after the July training (week
12). Participants in each group were asked to respond to all three surveys. Time-invariant
characteristics were collected in the first survey (or the second if a person did not respond to the
first). Because of limited access to manager time, I only surveyed managers once, asking them to

Methodology 19
retrospectively consider the change in a project leader’s leadership behaviors over the prior three
months.
Treatment and control groups could not be randomized because of constraints within PPA.
Yet, causal inferences can still be made if plausible threats to internal validity are identified and
accounted for (Shadish et al., 2002). By using replicated treatments, pretests, and a control group,
a broad swath of threats relating to natural growth and individual differences are dealt with.
However, threats related to how an individual selects into a treatment or control group still remain.
One benefit of this context is that all accountants are scheduled for training, not just those who
appear to be promising leaders. Thus, concerns about selection due to higher skill or leadership
potential are muted. The primary concern in this context is that individuals may choose when they
train (e.g. during the summer or some earlier or later time), and that choice may make the treatment
and control groups systematically different. I spoke with PPA managers to understand what factors
impact selection into the treatment or control groups. Three factors emerged: hire quarter, industry
assignment, and senior associate job level. The month an individual is hired can set the seasonal
timing for their training—whether they train in the winter or summer. The industry assignment
Figure 4. Research design.
Methodology 20
affects timing because different industries have different peak periods, and training is normally
selected during off-peak periods. Advancing from an associate to senior associate can also prompt
training. I include these variables in the analysis to control for non-random assignment.
Variables
Data was collected using three surveys and organizational records. A summary of the variable
definitions are presented in Table 21 of Appendix B. A detailed explanation of the survey items
appear in Appendix A. The psychometric properties of the multi-item constructs are presented in
Table 19 and Table 20 of Appendix B.
Dependent Variables
Leadership behaviors were judged by the project leaders (self-rating), their project staff
(subordinate rating), and their managers (manager rating). They were measured using dimensions
from Yukl, Gordon, and Taber’s (2002) leadership behaviors taxonomy. The authors identified
twelve leadership behaviors that are categorized into three meta-behaviors: task behaviors,
relationship behaviors, and change behaviors. The task behaviors are clarifying roles, monitoring
operations, and short-term planning. The relationship behaviors are consulting, supporting,
empowering, recognizing, and developing. The effective teaching portion of the training mapped
to clarifying roles and developing behaviors, the mentoring portion to developing behaviors, and
giving effective feedback to recognizing behaviors. I also created a behavioral measure for
correcting to capture another important aspect of the training on providing feedback. I did not
capture the four change behaviors and dropped the consulting behavior because they were less
applicable to project leaders in this context, as determined in the interviews. I created four items
rated on a 5-point Likert scale (1 = Not at all; 5 = A great extent) for each of the eight behavioral
dimensions. Respondents could also answer “Don’t know”.
To keep the manager survey short, I asked managers one question (instead of four) for each
of the eight leadership behaviors. Each question was a combination of aspects from the four-item
construct. Managers were asked to rate the leadership behaviors of a project leader three months
ago, which corresponds to the beginning of the study period. They provided responses on the same
5-point scale as project leaders and subordinates. They were also asked to rate the change in the
eight leadership behaviors over the prior three months on a 7-point scale (1 = declined greatly,
4 = about the same, 7 = improved greatly).

Methodology 21
Because clarifying roles, developing, recognizing, and correcting applied directly to
training, these behaviors were the dependent variables. The other leadership behaviors acted as
within-person comparisons to test for the impact of training. For instance, short-term planning was
unlikely to be impacted by training because it had no overlap with the training material. Differences
in growth between short-term planning and developing among trained participants offered
additional evidence of the training effect.
I reviewed the leadership behaviors with PPA to ensure that they were indicative of the
behaviors required by project leaders. I also pretested the leadership behavior measures with a
separate sample selected using Amazon Mechanical Turk (Mturk). I sampled 100 individuals with
management experience and analyzed the psychometric properties of the items. Based on the
results, I made adjustments to two scale items.
During the two training sessions, I recorded the amount of time spent on each behavior by
mapping the lecture, practice or discussion time to the measure items that most closely matched.
Approximately 70 minutes were spent on developing and clarifying behaviors in part one of the
training, 60 minutes on recognizing and correcting behaviors in part two, and 80 minutes on
developing in part three. There were some brief portions of the training that touched upon
supporting, empowering, and short-term planning behaviors, but they were fleeting.
The confirmatory factor analysis for time-varying constructs (those measured at multiple
points over time) are presented in Table 19. The CFA included the eight leadership behaviors and
self-efficacy. The CFA was based on project leader responses; a very similar CFA was generated
for subordinate responses, but is not shown. The fit statistics all indicated adequate fit (CFI = 0.94,
NNFI = 0.93, RMSEA = 0.051). The coefficient alpha statistics were all above 0.85. The construct
correlations in Table 19 indicate that the leadership behaviors correlated strongly with one another.
I tested an alternative model in which leadership behaviors were forced to a single construct, but
the fit of the model declined. I also tested a model in which developing and clarifying roles
behaviors were merged (they had the highest correlation), but the model fit again declined. Overall,
the CFA suggested the constructs possessed good convergent and discriminant validity.
Independent Variable
The independent variable is whether an individual was trained or not. The treatment exists for
Trained Group 1 (June) in weeks 6 and 12, and Trained Group 2 (July) in week 12.

Methodology 22
Moderators
There are five moderators: experience, cognitive ability, motivation to lead, learning goal
orientation, and self-efficacy.
Experience was measured in two ways with four measures. First, it was measured as a
duration: project leaders were asked how many tax and audit projects they had led and the number
of months of experience they had leading tax and audit projects. They were also asked how many
months of experience they had leading in other organizations prior to PPA. Because both duration
measures were right skewed, I used the natural log (plus one) of the total projects led and the total
months leading in the analysis. Second, experience was measured as an exposure: both the breadth
and the depth of leadership experiences. To measure exposure, I created a 10-item index for
situations that project leaders might have faced and asked them to check off the situations they had
encountered. Project leaders were then asked the extent of experience with each checked-off item
on a 5-point scale (1 = very little; 5 = very great). After pre-testing the measures with the Mturk
sample, one item was dropped so that a 9-item index was used in the actual study (see Appendix
A). Breadth was measured as the number of items checked off. Depth was measured as the average
of the responses on the extent scale for the subset of items experienced. If an individual had not
experienced any of the nine items (thus having no extent values to average), then their depth score
was set to 1. Because the measures were indices and not latent constructs, they were not included
in the CFA analysis. The coefficient alpha statistics for the breadth and depth measures were 0.72
and 0.78, respectively.
Cognitive ability was measured using the project leader’s SAT or ACT score. The SAT
and ACT are considered good measures of general mental ability (Coyle & Pillow, 2008; Koenig,
Frey, & Detterman, 2008), and nearly all participants had taken one of the two tests within the last
10 years. Also, using SAT and ACT scores reduced the size of the survey instrument, which
reduced the risk of respondent fatigue and dropout. SAT scores were converted to ACT scores
using a conversion table.
Motivation to lead was measured using Chan and Drasgow’s (2001) affective and
calculative motivation to lead (MTL) construct. Motivation to lead is considered a fairly stable
individual difference drawn from one’s interests, abilities, and personal history. I adopted the
affective and calculative dimensions of MTL. I used a subset of 13 items from the original scales,
which capture the intrinsic and instrumental motivations of employees. After pretesting the measure
using the Mturk study, I removed three items, leaving five items for the affective dimension
(coefficient α = 0.73) and five for the calculative dimension. One additional item was dropped from
Methodology 23
the calculative dimension when constructing the CFA due to poor loading, which left a four item
construct (coefficient α = 0.77).
Learning goal orientation was captured using an 8-item measure from Button, Mathieu,
and Zajac (1996). It was measured using a 7-point scale (1 = strongly disagree; 7 = strong agree).
The measure captured a leader’s orientation toward mastering new and challenging tasks
(coefficient α = 0.90).
Self-efficacy was measured using a new scale that was specific to the study context. I
followed Bandura’s (2006) guide for developing self-efficacy scales (coefficient α = 0.93). It was
a 10-item scale on which respondents rated how certain they were that they could do each leadership
task (0 = cannot do at all; 10 = highly certain can do; see Appendix A). Self-efficacy was included
in the time-varying CFA in Table 19. For the analysis, only the self-efficacy prior to training (at
week 0) was used because the hypothesis is concerned with pre-training self-efficacy.
Control Variables
The primary control variables used in the analysis were industry assignment, job level, hire quarter,
and opportunity to lead. The first three variables were used to account for systematic reasons that
individuals might select into the trained or control group. Opportunity to lead accounted for
heterogeneous improvement in leadership behaviors due to opportunity to gain new experience
leading. It controls for differences in improvement in weeks 6 and 12. It was measured as a two-
item summation of the percent of time leaders (1) directly instructed/taught staff and (2) performed
other leadership activities.
Other covariates were collected as well. These included whether or not project leaders’
were CPAs and their tenure in the company, collected from organizational data. Using the survey,
I also captured project leaders’ conscientiousness (coefficient α = 0.84), extraversion (coefficient
α = 0.83), and openness to experience (coefficient α = 0.73); the extent of supervisory support
(coefficient α = 0.93); and average weekly hours worked and in the prior five weeks. The Big 5
personality traits were measured using scales from the International Personality Item Pool
(Goldberg, 2014). The supervisory six-item support scale came from Yarnall (1998). These
additional covariates were not included in the primary analysis, but were included in supplemental
analysis to observe their effect.
For subordinate responses, I included controls for subordinates’ agreeableness (coefficient
α = 0.79) and length of relationship with the project leader. For manager responses, I included the
managers’ observation extent of the project leader (single item: 1 = None, 5 = Very great extent).
Methodology 24
The CFA for time-invariant moderators and controls (constructs only measured once) is
presented in Table 20 of Appendix B. The fit statistics indicate there is appropriate convergent and
discriminant validity (CFI = 0.92, NNFI = 0.91, RMSEA = 0.045). The construct correlations in
Table 20 indicate a strong positive relationship between affective motivation to lead and
extraversion (� = 0.48), between affective motivation to lead and learning goal orientation
(� = 0.39), and between learning goal orientation and openness to experience (� = 0.40).
Sample
Rater Perspectives
There were three related samples that I analyzed: the project leader self-report sample, the
subordinate report sample, and the manager report sample. Each sample provided a different view
of the leaders’ development. Ideally, there would be strong agreement between perspectives such
that the training effect would be clear and unambiguous. However, there is little reason this should
be expected, and agreement among perspectives was elusive in these samples. First, it is difficult
to argue there is one objective reality of a person’s leadership ability. The value placed on
leadership behaviors can differ based on multiple factors (House, Hanges, Javidan, Dorfman, &
Gupta, 2004). That is not to say that leadership cannot be measured. The important point is that
differences among perspectives may not only be due to measurement error or bias—it can also
indicate important differences in how individuals value leadership behaviors from their viewpoint.
Second, perspectives may differ based on how individuals interact with the leader. For instance,
leaders who rate their own behaviors have access to all their thoughts, motives, attitudes, and
intentions as well as behaviors. Small changes in behavior or attempts to improve would be
recognized by the individual but likely missed by subordinates or managers. Subordinates, who in
this context worked closely with the leaders, also have a unique perspective on how the actions of
their leaders benefit them. Moreover, certain leadership behaviors that are valued by managers may
not be valued by subordinates, and thus rated differently. Managers at PPA were not necessarily at
project sites, so their first-hand observations of leader-subordinate interactions were somewhat
limited. Managers often gathered information from second-hand sources to supplement when first-
hand observations of leader behaviors were lacking. Managers were primarily concerned with client
relationships, a perspective not necessarily shared by subordinates. Thus, their perspectives on
leadership behaviors differ as well.
Methodology 25
Sample Sizes
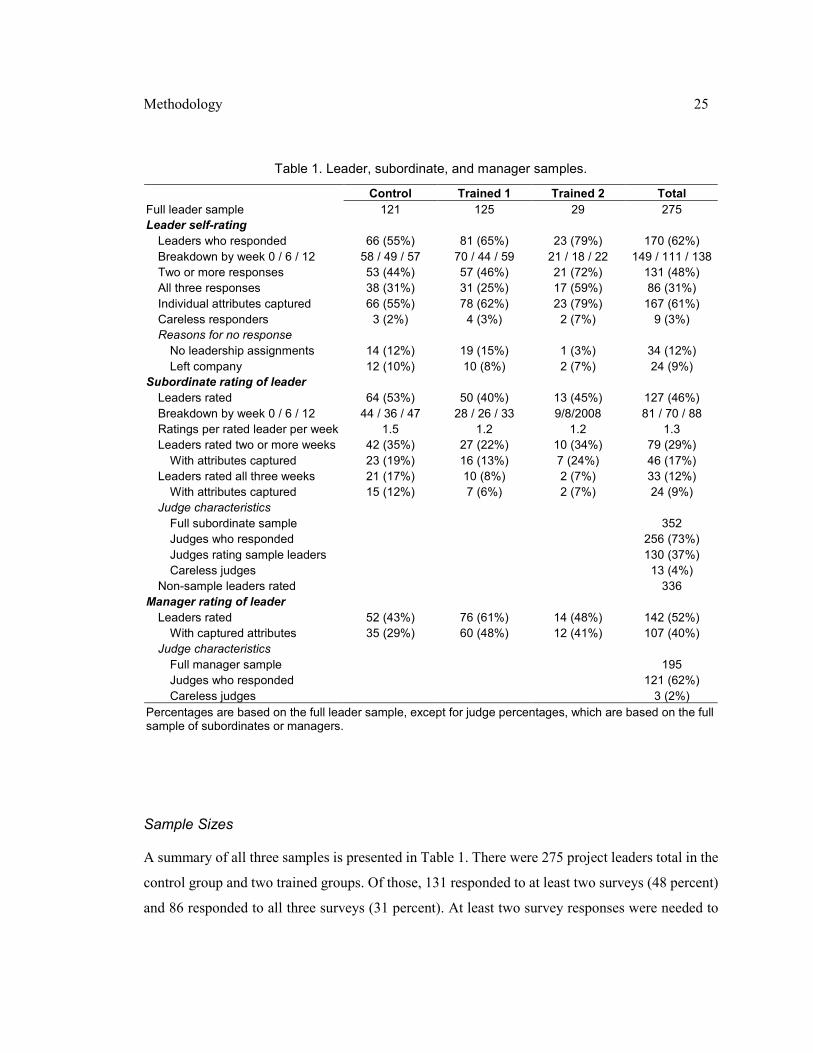
A summary of all three samples is presented in Table 1. There were 275 project leaders total in the
control group and two trained groups. Of those, 131 responded to at least two surveys (48 percent)
and 86 responded to all three surveys (31 percent). At least two survey responses were needed to
Table 1. Leader, subordinate, and manager samples.
Control Trained 1 Trained 2 Total
Full leader sample 121 125 29 275
Leader self-rating
Leaders who responded 66 (55%) 81 (65%) 23 (79%) 170 (62%)
Breakdown by week 0 / 6 / 12 58 / 49 / 57 70 / 44 / 59 21 / 18 / 22 149 / 111 / 138
Two or more responses 53 (44%) 57 (46%) 21 (72%) 131 (48%)
All three responses 38 (31%) 31 (25%) 17 (59%) 86 (31%)
Individual attributes captured 66 (55%) 78 (62%) 23 (79%) 167 (61%)
Careless responders 3 (2%) 4 (3%) 2 (7%) 9 (3%)
Reasons for no response
No leadership assignments 14 (12%) 19 (15%) 1 (3%) 34 (12%)
Left company 12 (10%) 10 (8%) 2 (7%) 24 (9%)
Subordinate rating of leader
Leaders rated 64 (53%) 50 (40%) 13 (45%) 127 (46%)
Breakdown by week 0 / 6 / 12 44 / 36 / 47 28 / 26 / 33 9/8/2008 81 / 70 / 88
Ratings per rated leader per week 1.5 1.2 1.2 1.3
Leaders rated two or more weeks 42 (35%) 27 (22%) 10 (34%) 79 (29%)
With attributes captured 23 (19%) 16 (13%) 7 (24%) 46 (17%)
Leaders rated all three weeks 21 (17%) 10 (8%) 2 (7%) 33 (12%)
With attributes captured 15 (12%) 7 (6%) 2 (7%) 24 (9%)
Judge characteristics
Full subordinate sample 352
Judges who responded 256 (73%)
Judges rating sample leaders 130 (37%)
Careless judges 13 (4%)
Non-sample leaders rated 336
Manager rating of leader
Leaders rated 52 (43%) 76 (61%) 14 (48%) 142 (52%)
With captured attributes 35 (29%) 60 (48%) 12 (41%) 107 (40%)
Judge characteristics
Full manager sample 195
Judges who responded 121 (62%)
Careless judges 3 (2%)
Percentages are based on the full leader sample, except for judge percentages, which are based on the full sample of subordinates or managers.
Methodology 26
use the leadership self-ratings. Of the 131 project leaders, 53 were from the control group and 78
were from the trained groups.
Among the subordinates, 73 percent rated leaders, but many of the responses were for
project leaders who were not in the sample. PPA was unable to provide a project leader-subordinate
matching prior to surveying subordinates. Thus, I surveyed all project staff in the company and
asked them to rate one of the 275 leaders in the sample. However, many of the subordinates had
not worked with any of the 275 leaders, so only 37 percent rated project leaders in the sample.
Seventy-nine project leaders were rated at least twice by subordinates, but only 46 of those had
matching attribute data. (Leader attribute data was acquired from the project leader survey, so the
project leader must have responded at least once for the matched subordinate data to be used.) Of
the 46 project leaders, 23 were from the control group and 23 were from the trained groups. Thus,
the subordinate sample is much smaller than desired. Because the subordinate sample represents
only 17 percent of the project leaders, some caution must be shown in interpreting the results
derived from it.
Sixty-two percent of managers provided one or more ratings of project managers. Unlike
the subordinate matching, PPA was able to provide data on the project leader-manager match, so
all responses are for project leaders in the sample. Of the 142 project leaders rated by their
managers, 107 of them (40 percent) had accompanying attribute data. Of the 107 project leaders,
35 were from the control group and 72 were from the trained groups.
The leader data were organized into a leader-week-behavior panel. If there were no missing
data, then a leader would have up to twelve observations: four leader behaviors (clarifying roles,
developing, recognizing, and correcting) for three different weeks (0, 6 and 12). However, the week
0 observations were used as a baseline measure, so they did not count as separate observations. The
final leader sample included 831 observations for 131 project leaders. The sample that was used to
compare trained leader behaviors to non-trained behaviors (using all eight behaviors and only the
trained leaders) included 1554 observations for 78 trained leaders.
The subordinate data was organized into a leader-subordinate-week-leader behavior panel.
Leaders had an average of 1.3 subordinates rate them. Like the leader panel, the subordinate panel
included observations for week 0, week 6 and week 12 for the four leader behaviors included in the
training. The subordinate panel included 432 observations provided by 73 subordinates for 46
leaders. The sample for the trained vs. non-trained behaviors included 564 observations provided
by 38 subordinates for 23 leaders.

Methodology 27
The manager data was organized into a leader-behavior panel. Leaders were only rated by
one manager at one time (see Figure 4). The manager panel included 398 observations provided by
94 managers concerning 107 project leaders. The sample for the trained vs. non-trained behaviors
included 541 observations for 72 leaders. Figure 5 presents the overlap between samples. The figure
shows that nearly all leaders in the subordinate and manager samples are also included in the project
leader sample.
Figure 6 presents the breakdown of leaders between tax and audit. It indicates that the
majority of project leaders (69 percent) in our sample primarily led audit projects. Only 14 percent
balanced audit and tax project leadership and 17 percent primarily lead tax projects.
Nonresponse Bias Tests
One concern is that project leaders not included in the final sample might have been different from
those included in the sample in a way that biased the results. I tested for nonresponse bias by
comparing the observable characteristics of leaders in the sample with those who were not. Some
characteristics—including job level, CPA, and tenure—were available from company data, which
allowed me to compare all leaders within and without the final sample. For other observable
characteristics taken from the surveys, I compared leaders with two or more survey responses to
Figure 5. Number of project leaders rated, by perspective.
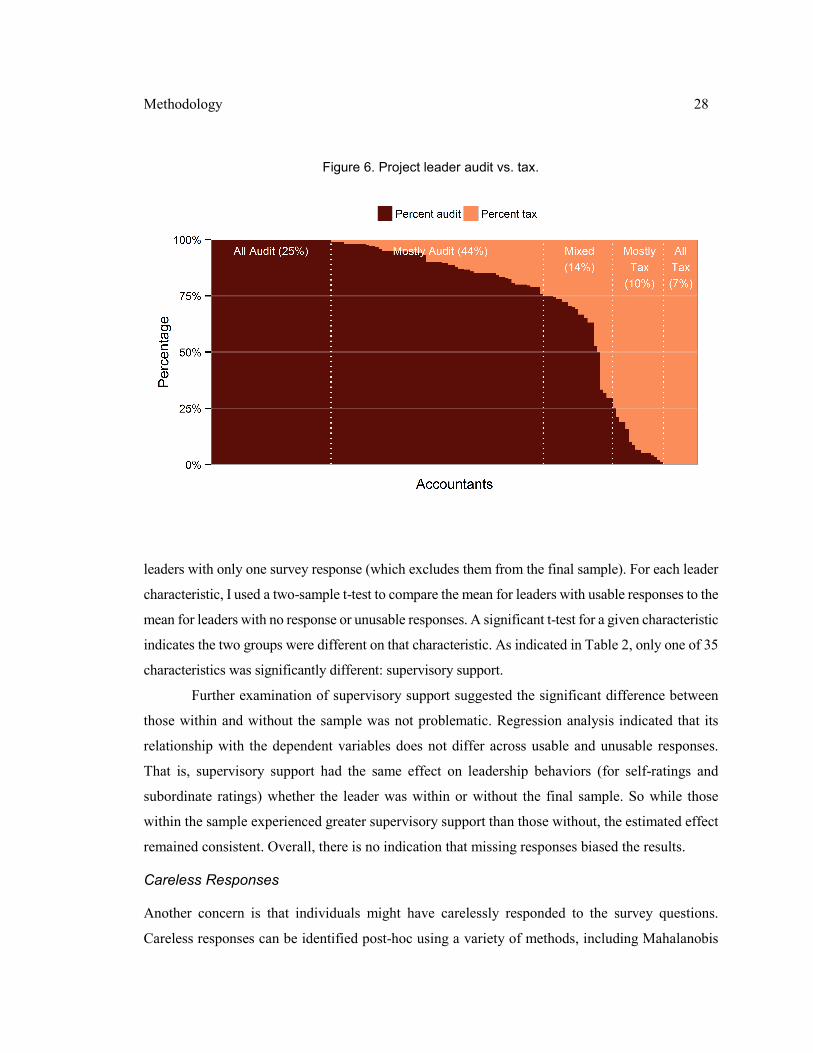
Methodology 28
leaders with only one survey response (which excludes them from the final sample). For each leader
characteristic, I used a two-sample t-test to compare the mean for leaders with usable responses to the
mean for leaders with no response or unusable responses. A significant t-test for a given characteristic
indicates the two groups were different on that characteristic. As indicated in Table 2, only one of 35
characteristics was significantly different: supervisory support.
Further examination of supervisory support suggested the significant difference between
those within and without the sample was not problematic. Regression analysis indicated that its
relationship with the dependent variables does not differ across usable and unusable responses.
That is, supervisory support had the same effect on leadership behaviors (for self-ratings and
subordinate ratings) whether the leader was within or without the final sample. So while those
within the sample experienced greater supervisory support than those without, the estimated effect
remained consistent. Overall, there is no indication that missing responses biased the results.
Careless Responses
Another concern is that individuals might have carelessly responded to the survey questions.
Careless responses can be identified post-hoc using a variety of methods, including Mahalanobis
Figure 6. Project leader audit vs. tax.

Methodology 29
distance, time taken to complete the survey, and long strings of the same response (Johnson, 2005;
Meade & Craig, 2012). Mahalanobis distance identifies observations that are significant outliers in
a multidimensional space. Survey responses were flagged as careless if the distance was significant
at the .001 level, which is a common cutoff. Also, if individuals provided the same item value
repeatedly (e.g. a long string of fives on a five-point scale), it was flagged as careless. Finally, those
who took the survey very quickly were flagged as careless. As indicated in Table 1, between two
and four percent of responses from leaders, subordinates, and managers were flagged. I still used
these responses in the analysis because the post-hoc tests include some uncertainty as to whether
they are capturing truly careless responses, but I included robustness tests that exclude them to
make sure that they did not impact the results.
Table 2. Nonresponse comparisons.
No / unusable response
Usable response
No / unusable response
Usable response
Leader self-rating Leader characteristics
Clarifying roles 3.3 3.4 Percent audit vs. tax 60 74
Developing 3.0 3.1 Conscientiousness 4.0 4.2
Recognizing 3.2 3.3 Extraversion 3.4 3.3
Correcting 3.5 3.5 Openness to experience 3.3 3.5
Supporting 3.8 3.9 Supervisory support 4.4 5.5**
Empowering 3.1 3.4 Job level (1 = senior) 0.34 0.40
Monitoring operations 2.9 3.1 CPA (1 = yes) 0.43 0.55
Short-term planning 2.5 2.9 Tenure (years) 1.99 2.07
Subordinate rating of leader Weekly hours worked 44 44
Clarifying roles 4.1 3.9 Opportunity to lead 57 59
Developing 4.0 3.9 Number of projects led 19 14
Recognizing 3.9 3.6 Total months leading 27 24
Correcting 4.1 3.7 Experience breadth 5.2 4.4
Supporting 4.2 3.7 Experience depth 3.1 2.9
Empowering 4.1 3.7 Cognitive ability 27 26
Monitoring operations 4.0 3.5 Affective motivation to lead 5.1 5.3
Short-term planning 3.9 3.7 Calculative motiv. to lead 2.5 2.4
Learning goal orientation 6.2 6.0
Self-efficacy 6.1 6.7
* p < .05, ** p < .01

Methodology 30
Appropriateness of Nonrandom Groups
When I constructed the control group, I attempted to include project leaders who most closely
resembled those that were trained so that they would provide an appropriate counterfactual.
(Randomization, of course, does this best.) If the suitability of the control group using nonrandom
assignment approaches what can be achieved via random assignment, then simple OLS regression
will provide consistent estimates. However, this is difficult to achieve in practice. To test how well
the control group matched the trained groups, I compared the mean leadership behaviors at week 0
and leader characteristics across groups. If the groups were fully randomized, then no significant
differences would be found beyond chance. Table 3 indicates that there were a number of
significant differences. Leader and manager ratings of developing behaviors at week 0 were
significantly lower than the control group, and manager ratings of clarifying roles, correcting,
monitoring operations, and short-term planning were also significantly lower. Trained Group 1 had
systematically lower ratings across perspectives. The trained groups also had less senior associates
compared to the control group and they had less tenure in the company. They had also led fewer
projects.
The differences in leadership behaviors were greatly reduced by the inclusion of selection
controls (industry assignment, hire quarter, and job level) and opportunity to lead. In other words,
conditional on the controls, the groups moved closer toward the ideal that would be achieved
through random assignment. For leader self-reported behaviors, Trained Group 1 was 0.22 lower
than the control group across all eight leadership behaviors at week 0, which was marginally lower
(p < .10). Trained Group 2 was slightly higher (d = 0.16 higher; p = n.s.). However, after accounting
for the controls, Trained Group 1 was only 0.01 lower than the control group (p = n.s.). For
subordinate reports, Trained Group 1 was 0.27 lower than the control group at week 0, which was
also marginally lower (p < .10). Trained Group 2 was about the same (d = 0.06 lower; p = n.s.).
After accounting for the controls, Trained Group 1 was only 0.16 lower than the control group
(p = n.s.). For manager reports, Trained Group 1 (d = 0.45 lower) and Trained Group 2 (d = 0.61
lower) had significantly lower base leadership behaviors than the control group (p < .01 for both).
After including the controls, the differences between the control group and Trained Group 1 (d =
0.26 lower) and between the control group and Trained Group 2 (d = 0.30 lower), though still
present, were no longer significant.
Additionally, Table 3 indicates that the number of projects led by Trained Group 1 was
significantly lower than the control group. However, the difference was accounted for by the
controls and by recognizing that the range of projects led by control group leaders was beyond that
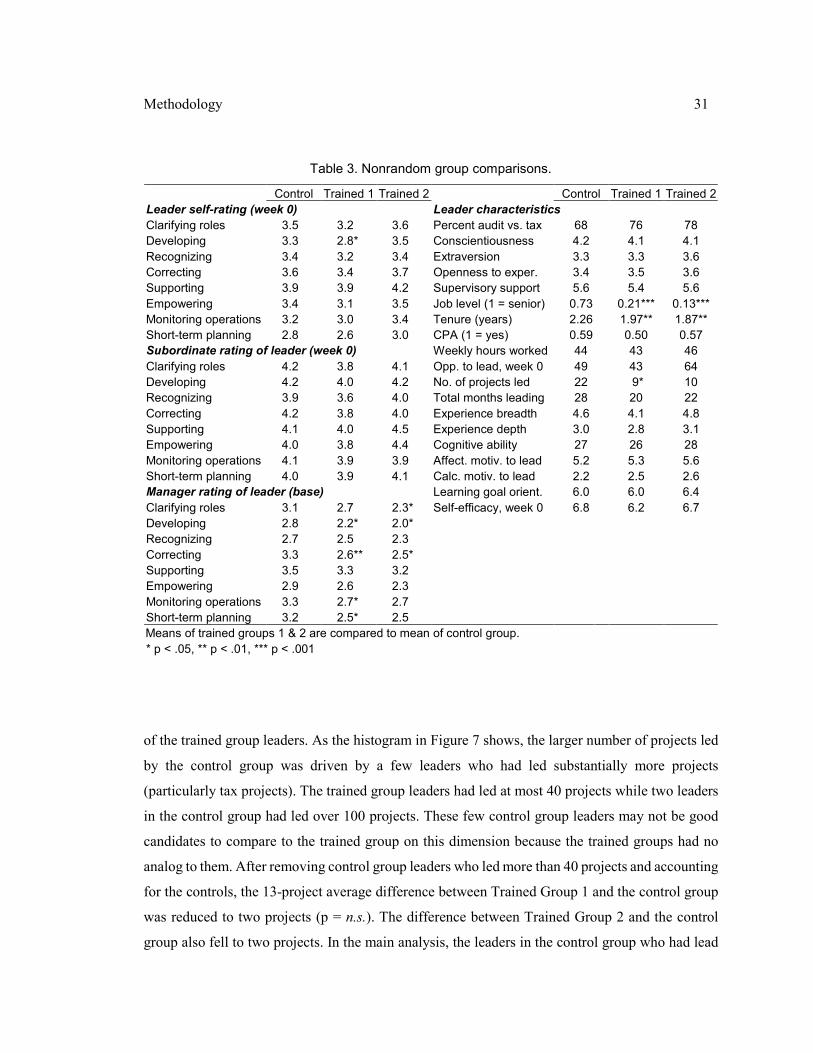
Methodology 31
of the trained group leaders. As the histogram in Figure 7 shows, the larger number of projects led
by the control group was driven by a few leaders who had led substantially more projects
(particularly tax projects). The trained group leaders had led at most 40 projects while two leaders
in the control group had led over 100 projects. These few control group leaders may not be good
candidates to compare to the trained group on this dimension because the trained groups had no
analog to them. After removing control group leaders who led more than 40 projects and accounting
for the controls, the 13-project average difference between Trained Group 1 and the control group
was reduced to two projects (p = n.s.). The difference between Trained Group 2 and the control
group also fell to two projects. In the main analysis, the leaders in the control group who had lead
Table 3. Nonrandom group comparisons.
Control Trained 1 Trained 2 Control Trained 1 Trained 2
Leader self-rating (week 0) Leader characteristics
Clarifying roles 3.5 3.2 3.6 Percent audit vs. tax 68 76 78
Developing 3.3 2.8* 3.5 Conscientiousness 4.2 4.1 4.1
Recognizing 3.4 3.2 3.4 Extraversion 3.3 3.3 3.6
Correcting 3.6 3.4 3.7 Openness to exper. 3.4 3.5 3.6
Supporting 3.9 3.9 4.2 Supervisory support 5.6 5.4 5.6
Empowering 3.4 3.1 3.5 Job level (1 = senior) 0.73 0.21*** 0.13***
Monitoring operations 3.2 3.0 3.4 Tenure (years) 2.26 1.97** 1.87**
Short-term planning 2.8 2.6 3.0 CPA (1 = yes) 0.59 0.50 0.57
Subordinate rating of leader (week 0) Weekly hours worked 44 43 46
Clarifying roles 4.2 3.8 4.1 Opp. to lead, week 0 49 43 64
Developing 4.2 4.0 4.2 No. of projects led 22 9* 10
Recognizing 3.9 3.6 4.0 Total months leading 28 20 22
Correcting 4.2 3.8 4.0 Experience breadth 4.6 4.1 4.8
Supporting 4.1 4.0 4.5 Experience depth 3.0 2.8 3.1
Empowering 4.0 3.8 4.4 Cognitive ability 27 26 28
Monitoring operations 4.1 3.9 3.9 Affect. motiv. to lead 5.2 5.3 5.6
Short-term planning 4.0 3.9 4.1 Calc. motiv. to lead 2.2 2.5 2.6
Manager rating of leader (base) Learning goal orient. 6.0 6.0 6.4
Clarifying roles 3.1 2.7 2.3* Self-efficacy, week 0 6.8 6.2 6.7
Developing 2.8 2.2* 2.0*
Recognizing 2.7 2.5 2.3
Correcting 3.3 2.6** 2.5*
Supporting 3.5 3.3 3.2
Empowering 2.9 2.6 2.3
Monitoring operations 3.3 2.7* 2.7
Short-term planning 3.2 2.5* 2.5
Means of trained groups 1 & 2 are compared to mean of control group.
* p < .05, ** p < .01, *** p < .001

Methodology 32
more than 40 projects were still included because they were similar to the trained groups on other
attributes, but I provide supplementary analysis to examine the results when they are excluded. (It
made little difference whether these control group members were included or excluded.)
Analytic Approach
By using a replicated pre- and post-test design and control group as well as additional controls to
account for selection and post-treatment heterogeneity, many of the threats to internal validity were
dealt with. However, there could still be unobserved attributes or conditions that could bias the
estimates. There were three different ways by which I dealt with these additional threats. I used a
lagged dependent variable specification and first-differencing specification to control for time-
specific and time-invariant unobserved factors, respectively. I also used the non-trained behaviors
as the counterfactual instead of the control group as an alternative test.
Figure 7. Number of projects led.
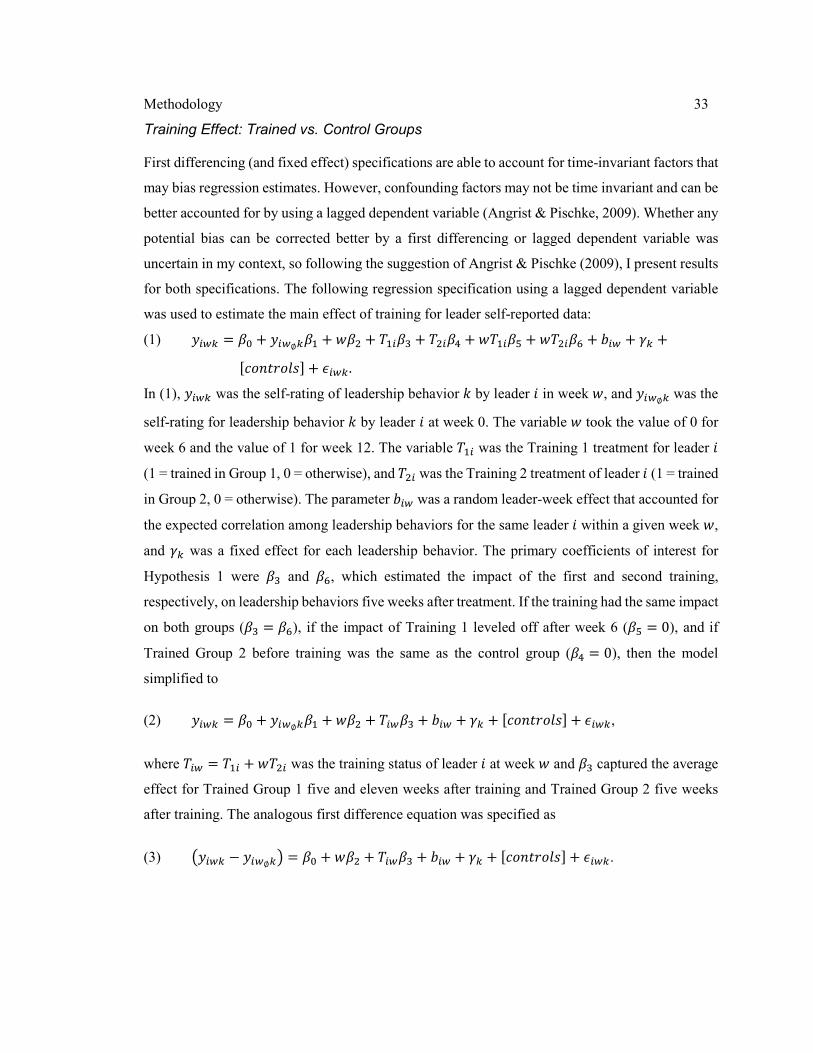
Methodology 33
Training Effect: Trained vs. Control Groups
First differencing (and fixed effect) specifications are able to account for time-invariant factors that
may bias regression estimates. However, confounding factors may not be time invariant and can be
better accounted for by using a lagged dependent variable (Angrist & Pischke, 2009). Whether any
potential bias can be corrected better by a first differencing or lagged dependent variable was
uncertain in my context, so following the suggestion of Angrist & Pischke (2009), I present results
for both specifications. The following regression specification using a lagged dependent variable
was used to estimate the main effect of training for leader self-reported data:
(1) ���� = �� + ���∅��� + �� + ����� + � ��� + ������ + �� ��� + ��� + �� +
���������� + ����.
In (1), ���� was the self-rating of leadership behavior � by leader in week �, and ���∅� was the
self-rating for leadership behavior � by leader at week 0. The variable � took the value of 0 for
week 6 and the value of 1 for week 12. The variable ��� was the Training 1 treatment for leader
(1 = trained in Group 1, 0 = otherwise), and � � was the Training 2 treatment of leader (1 = trained
in Group 2, 0 = otherwise). The parameter ��� was a random leader-week effect that accounted for
the expected correlation among leadership behaviors for the same leader within a given week �,
and �� was a fixed effect for each leadership behavior. The primary coefficients of interest for
Hypothesis 1 were �� and ��, which estimated the impact of the first and second training,
respectively, on leadership behaviors five weeks after treatment. If the training had the same impact
on both groups (�� = ��), if the impact of Training 1 leveled off after week 6 (�� = 0), and if
Trained Group 2 before training was the same as the control group (�� = 0), then the model
simplified to
(2) ���� = �� + ���∅��� + �� + ����� + ��� + �� + ���������� + ����,
where ��� = ��� + �� � was the training status of leader at week � and �� captured the average
effect for Trained Group 1 five and eleven weeks after training and Trained Group 2 five weeks
after training. The analogous first difference equation was specified as
(3) "���� − ���∅�$ = �� + �� + ����� + ��� + �� + ���������� + ����.

Methodology 34
The controls for (3) omitted job level, industry, or hire quarter because these time-invariant controls
dropped out of the model when taking the difference. Also, note that week 12 is subtracted from
week 0 instead of week 6 for the DV so the estimation of �� was comparable with the lagged model.
The moderating effect of experience or the other hypothesized individual characteristics
%� were specified in the lagged model as
(4) ���� = �� + ���∅��� + �� + ����� + %��� + ���%��� + ��� + �� + ���������� +����,
where �� was the main effect of the individual characteristic and �� was the moderating effect. In
hypotheses H2 through H6, �� was the parameter of interest.
For the subordinate sample, the analogous specification to (2) was
(5) ��&�� = �� + ��'̅�∅��� + �� + ����� + )&�� + ��&�� + ��� + �&� + �� +���������� + ��&��.
The difference between (5) and (2) was that ��&�� was the rating of leadership behavior � by
subordinate + for leader at week � and ��'̅�∅� was the average rating of leadership behavior � by
all subordinates , ̅who rated leader at week 0. The average across subordinates was used at week
0 so that ratings of leader by subordinate + in week 6 or 12 could be used even if + did not rate
at week 0 (but other subordinates did). The variables )& and �& were for the agreeableness of
subordinate + and the relationship length of + with leader . The parameter �&� was a random
subordinate-week effect that accounted for the expected correlation among leadership behaviors
for the same subordinate + within a given week �.
For the manager sample, the analogous specification to (2) was
(6) ��� = �� + ���-��� + ��� + ���� + ��� + �� + ���������� + ���,
where ��� was the rating of the change in leadership behavior � for leader and ���.� was the
retrospective baseline value of leadership behavior �. The variable �� = ��� + � � was the indicator
for the trained groups and � was the parameter of interest. The variable �� was the extent to which
the manager has observed project leader . There was no analogous first difference specification
because there were no measurements at multiple points in time. Nor did (6) truly employ a lagged
dependent variable because the baseline response (���-�) was retrospective.

Methodology 35
Training Effect: Trained vs. Non-Trained Behaviors
An alternative method to estimate the effect of training was to compare leadership behaviors that
were trained (i.e. clarifying roles, developing, recognizing, correcting) to behaviors that were not
part of the training (i.e., empowering, supporting, monitoring operations, short-term planning).
This was a conservative test because there were likely spillover effects from the trained behaviors
to the non-trained behaviors and the training did touch upon non-trained behaviors is some brief,
tangential ways. The benefit of this test was that it performed a within-person comparison, which
naturally created an appropriate control group. Because of this, there was not the same concern
about omitted variables as was the case when using the non-trained control group of leaders as the
counterfactual. Since the non-trained behaviors were used as the counterfactual, the leaders who
were not trained were omitted from the analysis. The training effect was estimated as the difference
between trained and non-trained behaviors after training after accounting for the difference
between trained and non-trained behaviors before training (i.e., a difference-in-difference
approach). The specification for the self-report sample was
(7) ���� = �� + /��� + 0�� + ������ + 1� + ��� + ���������� + ����,
where /� was 1 if the leadership behavior was part of training and 0 otherwise, 0� was 1 for Trained
Group 2 and 0 for Trained Group 1, and ���� was 1 if leader was trained in week � for behavior
�. The parameter 1� was the estimated effect of each week, �� was the initial difference between
the training and control behaviors and � was the difference between the two trained groups. The
parameter of interest was ��, which captured the training effect. To estimate the effect of the
moderators, (7) was modified to include %� and its interaction with ����, similar to (4). The
analogous specification to (7) for the subordinate sample was
(8) ��&�� = �� + /��� + 0�� + ������ + )&�� + ��&�� + 1� + ��� + �&� + ���������� +��&��.
The analogous specification to (7) for the manager sample was
(9) ��� = �� + ���-��� + /�� + ����� + ���� + ��� + ���������� + ���.
For models (7) to (9), the only control used was opportunity to lead. The selection controls were
omitted because selection problems were resolved naturally by the within-person comparison.
Methodology 36
In the results that follow, the hypotheses corresponding with the leader self-rated sample
were tested using the lagged dependent variable specification in (2) and the first difference
specification in (3) for the control group comparison as well as the difference-in-difference
specification for the control behavior comparison in (7). The hypotheses corresponding with
subordinate sample were tested with the analogous specifications modified for the subordinate
sample, as in (5). The hypotheses corresponding with the manager sample were tested using the
retrospective base leadership behaviors for both the control group and control behavior
comparisons, as specified in (6) and (9).

4. RESULTS
Descriptive Statistics
The means, standard deviations, minima, and maxima for selected variables are presented in Table
4. The full list of descriptive statistics is presented in Table 21 of Appendix B. When comparing
across raters, Table 4 shows that subordinates rated project leaders the highest (between 3.9 and
4.1 on average for all behaviors), leaders rated themselves lower (between 3.1 and 3.5), and
managers rated the project leaders the lowest (between 2.4 and 2.8 for base values). At the
beginning of the study period, leaders averaged 2.3 log projects (9 projects on original scale) and
2.7 log months leading (14 months on original scale), which included leadership prior to PPA. Their
average exposure to the nine leadership situations was 4.4 situations, and for those situations they
had exposure to, their average depth of exposure was moderate (2.9 out of 5). Project leaders had
an average ACT of 26 and had much stronger affective motivation (5.3 out of 7) than calculative
motivation (2.3 out of 7) to lead. They also had a strong learning goal orientation on average (6.0
out of 7), and moderate confidence (self-efficacy) in their leadership abilities (6.5 out of 10).
Selected bivariate correlations for the leadership behaviors are presented in Table 5. The
full matrix of bivariate correlations are presented in Table 22 of Appendix B. Table 5 shows that
the correlations across behaviors and within each perspective were quite high, ranging from .44 to
.79. These high correlations are not surprising since leaders are expected to concurrently develop
different dimensions of their leadership ability. (The model specifications account for correlations
across behaviors with the random effect parameters.) However, the correlations are low across
perspectives for each corresponding leader behavior (i.e., between self-ratings and subordinate
ratings, self-ratings and manager (base) ratings, and subordinate ratings and manager base ratings).
The correlations between the ratings of leaders and subordinates range from -0.10 to 0.11 across
the eight leadership dimensions (�̅ = 0.04). The average correlations between managers (their base
ratings) and leaders and managers and subordinates were 0.13. These low correlations suggest that
the perspectives on leader behaviors vary quite markedly.
Table 6 presents selected correlations among leader characteristics. The correlation
between the (log) number of projects led and (log) total months leading was 0.55, suggesting the
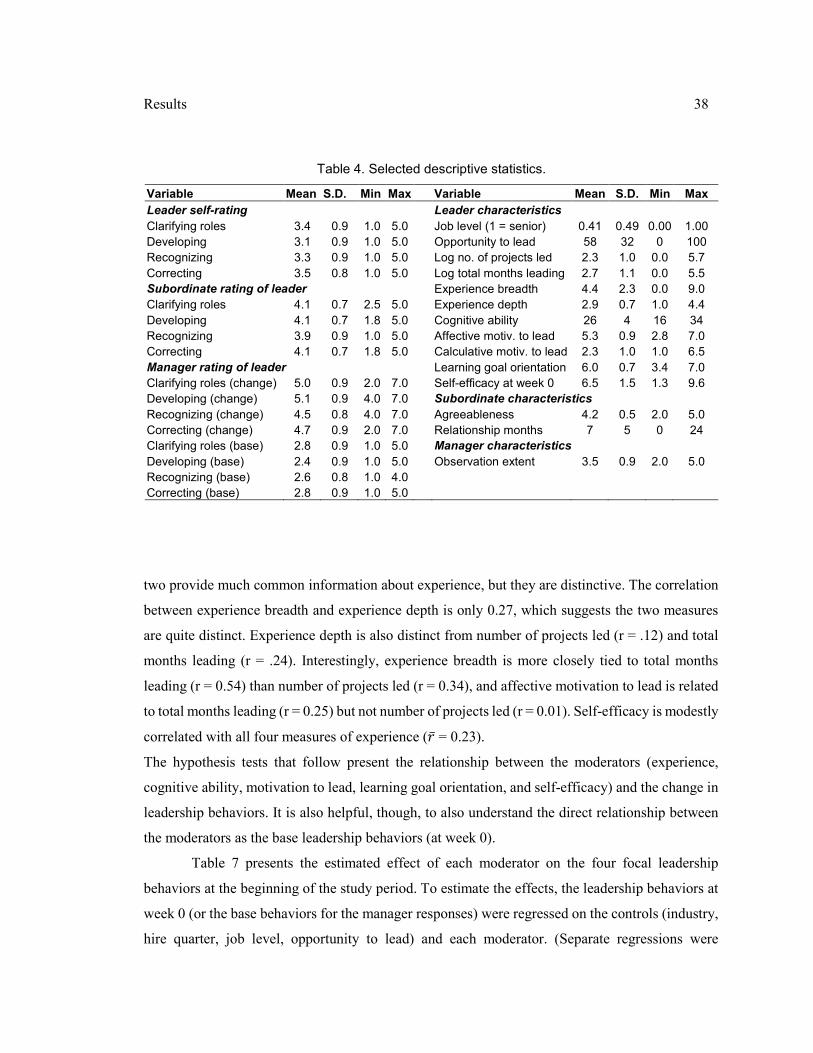
Results 38
two provide much common information about experience, but they are distinctive. The correlation
between experience breadth and experience depth is only 0.27, which suggests the two measures
are quite distinct. Experience depth is also distinct from number of projects led (r = .12) and total
months leading (r = .24). Interestingly, experience breadth is more closely tied to total months
leading (r = 0.54) than number of projects led (r = 0.34), and affective motivation to lead is related
to total months leading (r = 0.25) but not number of projects led (r = 0.01). Self-efficacy is modestly
correlated with all four measures of experience (�̅ = 0.23).
The hypothesis tests that follow present the relationship between the moderators (experience,
cognitive ability, motivation to lead, learning goal orientation, and self-efficacy) and the change in
leadership behaviors. It is also helpful, though, to also understand the direct relationship between
the moderators as the base leadership behaviors (at week 0).
Table 7 presents the estimated effect of each moderator on the four focal leadership
behaviors at the beginning of the study period. To estimate the effects, the leadership behaviors at
week 0 (or the base behaviors for the manager responses) were regressed on the controls (industry,
hire quarter, job level, opportunity to lead) and each moderator. (Separate regressions were
Table 4. Selected descriptive statistics.
Variable Mean S.D. Min Max Variable Mean S.D. Min Max
Leader self-rating Leader characteristics
Clarifying roles 3.4 0.9 1.0 5.0 Job level (1 = senior) 0.41 0.49 0.00 1.00
Developing 3.1 0.9 1.0 5.0 Opportunity to lead 58 32 0 100
Recognizing 3.3 0.9 1.0 5.0 Log no. of projects led 2.3 1.0 0.0 5.7
Correcting 3.5 0.8 1.0 5.0 Log total months leading 2.7 1.1 0.0 5.5
Subordinate rating of leader Experience breadth 4.4 2.3 0.0 9.0
Clarifying roles 4.1 0.7 2.5 5.0 Experience depth 2.9 0.7 1.0 4.4
Developing 4.1 0.7 1.8 5.0 Cognitive ability 26 4 16 34
Recognizing 3.9 0.9 1.0 5.0 Affective motiv. to lead 5.3 0.9 2.8 7.0
Correcting 4.1 0.7 1.8 5.0 Calculative motiv. to lead 2.3 1.0 1.0 6.5
Manager rating of leader Learning goal orientation 6.0 0.7 3.4 7.0
Clarifying roles (change) 5.0 0.9 2.0 7.0 Self-efficacy at week 0 6.5 1.5 1.3 9.6
Developing (change) 5.1 0.9 4.0 7.0 Subordinate characteristics
Recognizing (change) 4.5 0.8 4.0 7.0 Agreeableness 4.2 0.5 2.0 5.0
Correcting (change) 4.7 0.9 2.0 7.0 Relationship months 7 5 0 24
Clarifying roles (base) 2.8 0.9 1.0 5.0 Manager characteristics
Developing (base) 2.4 0.9 1.0 5.0 Observation extent 3.5 0.9 2.0 5.0
Recognizing (base) 2.6 0.8 1.0 4.0
Correcting (base) 2.8 0.9 1.0 5.0

Results 39
estimated for each moderator.) The estimates suggests strong positive relationships between the
project leaders’ self-ratings and the four experience measures, cognitive ability, affective
motivation to lead, learning goal orientation, and self-efficacy. However, subordinates rated leaders
lower at week 0 who had led more projects, but the relationship is not significant. Managers also
rated leaders lower who had greater depth of experience, though it is also not significant. Like the
leaders themselves, managers and subordinates rated leaders higher when they had higher self-
efficacy, but the higher rating was not significant. Together these descriptive regression coefficients
indicate some disagreement between perspectives, but it is important to also recognize that the size
of leader samples are quite different across perspectives.
Table 5. Selected bivariate correlations: leadership behaviors.
Leader self-rating (1) (2) (3)
(1) Clarify. roles
(2) Developing 0.79
(3) Recognizing 0.51 0.58
(4) Correcting 0.56 0.56 0.63
Subordinate rating (9) (10) (11)
(9) Clarify. roles
(10) Developing 0.65
(11) Recognizing 0.52 0.68
(12) Correcting 0.64 0.74 0.76
Manager rating (chg.) (17) (18) (19)
(17) Clarify. roles (chg.)
(18) Developing (chg.) 0.44
(19) Recognizing (chg.) 0.46 0.53
(20) Correcting (chg.) 0.49 0.55 0.58
Cross Perspective (1)...(4)‡ (9)…(12) ‡
Subordinate rating
(9) Clarify. roles -0.10
(10) Developing 0.08
(11) Recognizing 0.11
(12) Correcting 0.05
Manager rating (base)
(25) Clarify. roles (base) 0.12 0.06
(26) Developing (base) 0.19 0.11
(27) Recognizing (base) 0.15 0.10
(28) Correcting (base) 0.16 0.06 ‡ Bivariate correlation with corresponding leadership behavior rated by leader (1 to 4) or subordinate (9 to 12).
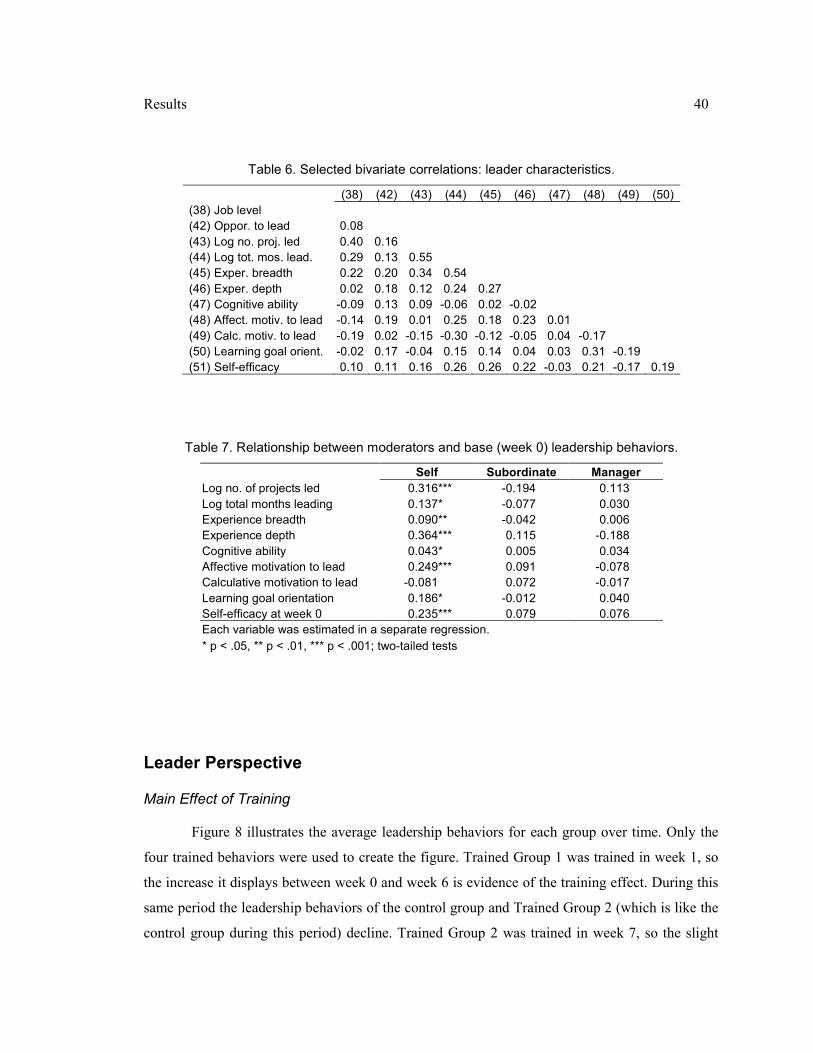
Results 40
Leader Perspective
Main Effect of Training
Figure 8 illustrates the average leadership behaviors for each group over time. Only the
four trained behaviors were used to create the figure. Trained Group 1 was trained in week 1, so
the increase it displays between week 0 and week 6 is evidence of the training effect. During this
same period the leadership behaviors of the control group and Trained Group 2 (which is like the
control group during this period) decline. Trained Group 2 was trained in week 7, so the slight
Table 6. Selected bivariate correlations: leader characteristics.
(38) (42) (43) (44) (45) (46) (47) (48) (49) (50)
(38) Job level
(42) Oppor. to lead 0.08
(43) Log no. proj. led 0.40 0.16
(44) Log tot. mos. lead. 0.29 0.13 0.55
(45) Exper. breadth 0.22 0.20 0.34 0.54
(46) Exper. depth 0.02 0.18 0.12 0.24 0.27
(47) Cognitive ability -0.09 0.13 0.09 -0.06 0.02 -0.02
(48) Affect. motiv. to lead -0.14 0.19 0.01 0.25 0.18 0.23 0.01
(49) Calc. motiv. to lead -0.19 0.02 -0.15 -0.30 -0.12 -0.05 0.04 -0.17
(50) Learning goal orient. -0.02 0.17 -0.04 0.15 0.14 0.04 0.03 0.31 -0.19
(51) Self-efficacy 0.10 0.11 0.16 0.26 0.26 0.22 -0.03 0.21 -0.17 0.19
Table 7. Relationship between moderators and base (week 0) leadership behaviors.
Self Subordinate Manager
Log no. of projects led 0.316*** -0.194 0.113
Log total months leading 0.137* -0.077 0.030
Experience breadth 0.090** -0.042 0.006
Experience depth 0.364*** 0.115 -0.188
Cognitive ability 0.043* 0.005 0.034
Affective motivation to lead 0.249*** 0.091 -0.078
Calculative motivation to lead -0.081 0.072 -0.017
Learning goal orientation 0.186* -0.012 0.040
Self-efficacy at week 0 0.235*** 0.079 0.076
Each variable was estimated in a separate regression.
* p < .05, ** p < .01, *** p < .001; two-tailed tests
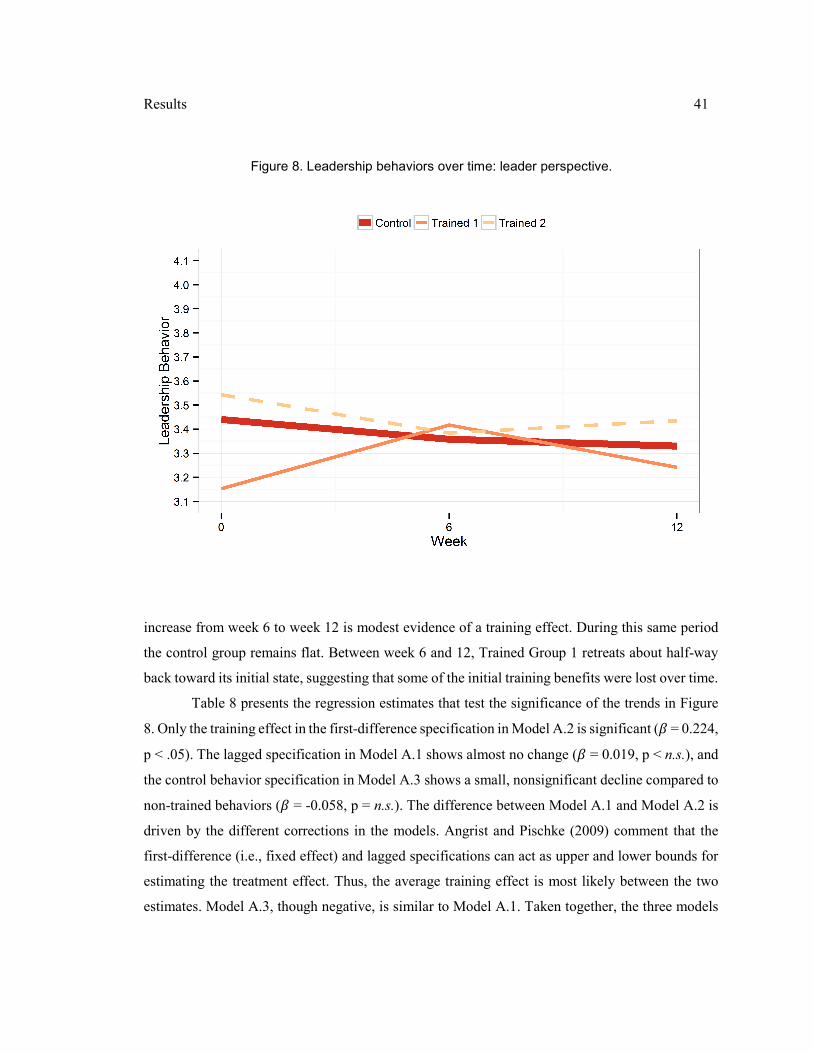
Results 41
increase from week 6 to week 12 is modest evidence of a training effect. During this same period
the control group remains flat. Between week 6 and 12, Trained Group 1 retreats about half-way
back toward its initial state, suggesting that some of the initial training benefits were lost over time.
Table 8 presents the regression estimates that test the significance of the trends in Figure
8. Only the training effect in the first-difference specification in Model A.2 is significant (� = 0.224,
p < .05). The lagged specification in Model A.1 shows almost no change (� = 0.019, p < n.s.), and
the control behavior specification in Model A.3 shows a small, nonsignificant decline compared to
non-trained behaviors (� = -0.058, p = n.s.). The difference between Model A.1 and Model A.2 is
driven by the different corrections in the models. Angrist and Pischke (2009) comment that the
first-difference (i.e., fixed effect) and lagged specifications can act as upper and lower bounds for
estimating the treatment effect. Thus, the average training effect is most likely between the two
estimates. Model A.3, though negative, is similar to Model A.1. Taken together, the three models
Figure 8. Leadership behaviors over time: leader perspective.
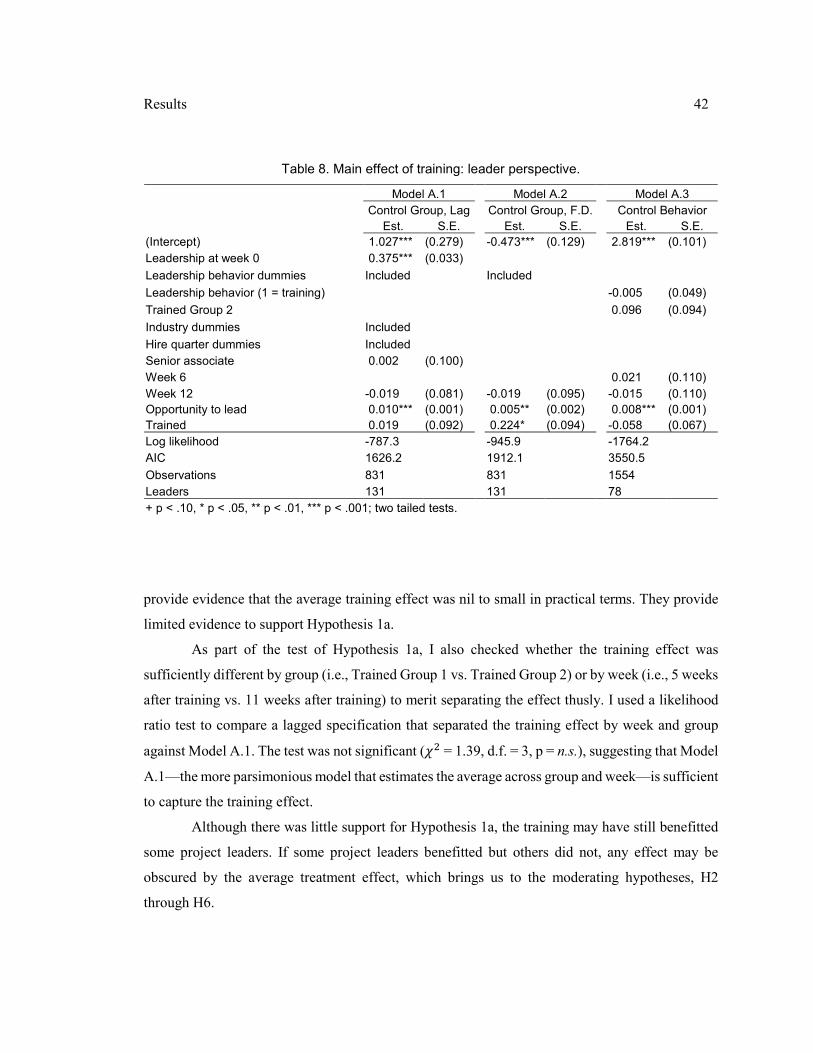
Results 42
provide evidence that the average training effect was nil to small in practical terms. They provide
limited evidence to support Hypothesis 1a.
As part of the test of Hypothesis 1a, I also checked whether the training effect was
sufficiently different by group (i.e., Trained Group 1 vs. Trained Group 2) or by week (i.e., 5 weeks
after training vs. 11 weeks after training) to merit separating the effect thusly. I used a likelihood
ratio test to compare a lagged specification that separated the training effect by week and group
against Model A.1. The test was not significant (2 = 1.39, d.f. = 3, p = n.s.), suggesting that Model
A.1—the more parsimonious model that estimates the average across group and week—is sufficient
to capture the training effect.
Although there was little support for Hypothesis 1a, the training may have still benefitted
some project leaders. If some project leaders benefitted but others did not, any effect may be
obscured by the average treatment effect, which brings us to the moderating hypotheses, H2
through H6.
Table 8. Main effect of training: leader perspective.
Model A.1 Model A.2 Model A.3
Control Group, Lag Control Group, F.D. Control Behavior
Est. S.E. Est. S.E. Est. S.E.
(Intercept) 1.027*** (0.279) -0.473*** (0.129) 2.819*** (0.101)
Leadership at week 0 0.375*** (0.033)
Leadership behavior dummies Included Included
Leadership behavior (1 = training) -0.005 (0.049)
Trained Group 2 0.096 (0.094)
Industry dummies Included
Hire quarter dummies Included
Senior associate 0.002 (0.100)
Week 6 0.021 (0.110)
Week 12 -0.019 (0.081) -0.019 (0.095) -0.015 (0.110)
Opportunity to lead 0.010*** (0.001) 0.005** (0.002) 0.008*** (0.001)
Trained 0.019 (0.092) 0.224* (0.094) -0.058 (0.067)
Log likelihood -787.3 -945.9 -1764.2
AIC 1626.2 1912.1 3550.5
Observations 831 831 1554
Leaders 131 131 78
+ p < .10, * p < .05, ** p < .01, *** p < .001; two tailed tests.
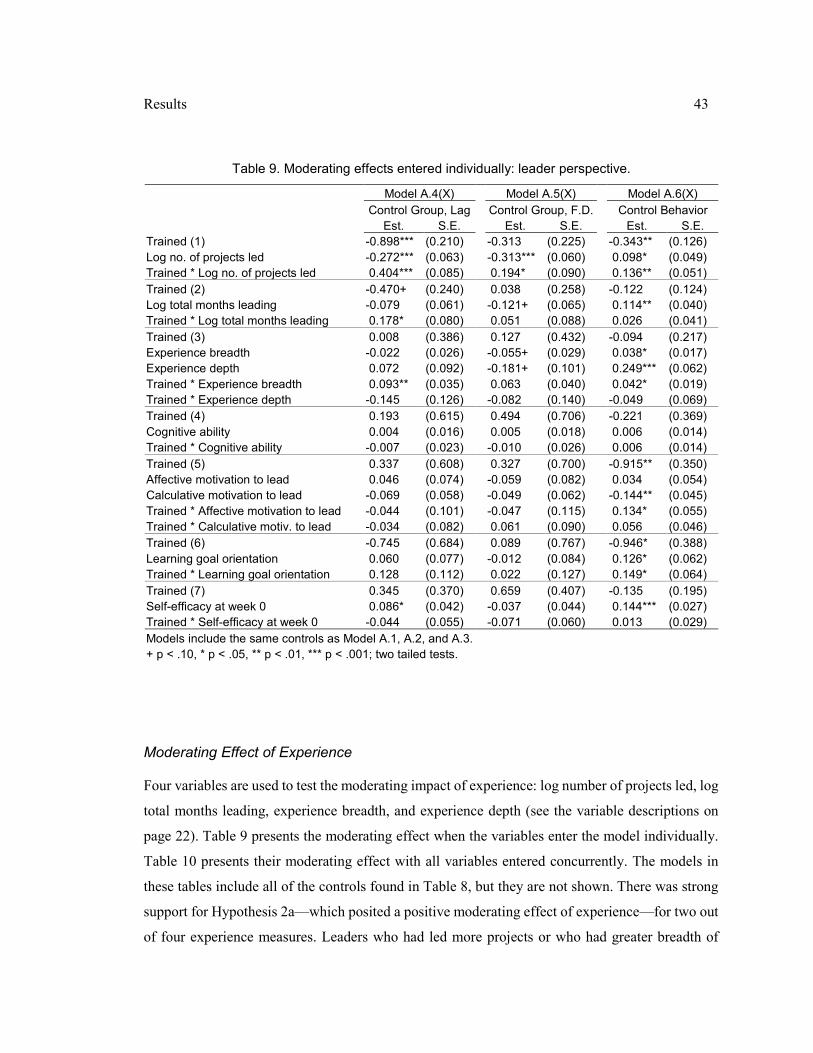
Results 43
Moderating Effect of Experience
Four variables are used to test the moderating impact of experience: log number of projects led, log
total months leading, experience breadth, and experience depth (see the variable descriptions on
page 22). Table 9 presents the moderating effect when the variables enter the model individually.
Table 10 presents their moderating effect with all variables entered concurrently. The models in
these tables include all of the controls found in Table 8, but they are not shown. There was strong
support for Hypothesis 2a—which posited a positive moderating effect of experience—for two out
of four experience measures. Leaders who had led more projects or who had greater breadth of
Table 9. Moderating effects entered individually: leader perspective.
Model A.4(X) Model A.5(X) Model A.6(X)
Control Group, Lag Control Group, F.D. Control Behavior
Est. S.E. Est. S.E. Est. S.E.
Trained (1) -0.898*** (0.210) -0.313 (0.225) -0.343** (0.126)
Log no. of projects led -0.272*** (0.063) -0.313*** (0.060) 0.098* (0.049)
Trained * Log no. of projects led 0.404*** (0.085) 0.194* (0.090) 0.136** (0.051)
Trained (2) -0.470+ (0.240) 0.038 (0.258) -0.122 (0.124)
Log total months leading -0.079 (0.061) -0.121+ (0.065) 0.114** (0.040)
Trained * Log total months leading 0.178* (0.080) 0.051 (0.088) 0.026 (0.041)
Trained (3) 0.008 (0.386) 0.127 (0.432) -0.094 (0.217)
Experience breadth -0.022 (0.026) -0.055+ (0.029) 0.038* (0.017)
Experience depth 0.072 (0.092) -0.181+ (0.101) 0.249*** (0.062)
Trained * Experience breadth 0.093** (0.035) 0.063 (0.040) 0.042* (0.019)
Trained * Experience depth -0.145 (0.126) -0.082 (0.140) -0.049 (0.069)
Trained (4) 0.193 (0.615) 0.494 (0.706) -0.221 (0.369)
Cognitive ability 0.004 (0.016) 0.005 (0.018) 0.006 (0.014)
Trained * Cognitive ability -0.007 (0.023) -0.010 (0.026) 0.006 (0.014)
Trained (5) 0.337 (0.608) 0.327 (0.700) -0.915** (0.350)
Affective motivation to lead 0.046 (0.074) -0.059 (0.082) 0.034 (0.054)
Calculative motivation to lead -0.069 (0.058) -0.049 (0.062) -0.144** (0.045)
Trained * Affective motivation to lead -0.044 (0.101) -0.047 (0.115) 0.134* (0.055)
Trained * Calculative motiv. to lead -0.034 (0.082) 0.061 (0.090) 0.056 (0.046)
Trained (6) -0.745 (0.684) 0.089 (0.767) -0.946* (0.388)
Learning goal orientation 0.060 (0.077) -0.012 (0.084) 0.126* (0.062)
Trained * Learning goal orientation 0.128 (0.112) 0.022 (0.127) 0.149* (0.064)
Trained (7) 0.345 (0.370) 0.659 (0.407) -0.135 (0.195)
Self-efficacy at week 0 0.086* (0.042) -0.037 (0.044) 0.144*** (0.027)
Trained * Self-efficacy at week 0 -0.044 (0.055) -0.071 (0.060) 0.013 (0.029)
Models include the same controls as Model A.1, A.2, and A.3.
+ p < .10, * p < .05, ** p < .01, *** p < .001; two tailed tests.

Results 44
experience benefitted more from training, but leaders who had more months of experience leading
or greater leadership depth did not.
In Table 9 the strongest support was found for the number of projects led: Models A.4(1)
(lagged DV), A.5(1) (first difference), and A.6(1) (control behavior) were all significant (� = 0.404,
p < .001; � = 0.194, p < .05; � = 0.136, p < .01). Since all three models agreed and were significant,
they provide clear evidence that the training was beneficial for those who had led more projects.
When the other moderating variables were also included in the model (as shown in Table 10), the
moderating effect of projects led remained strong (� = 0.427, p < .001; � = 0.271, p < .05;
Table 10. All moderating effects: leader perspective.
Model A.7 Model A.8 Model A.9
Control Group, Lag Control Group, F.D. Control Behavior
Est. S.E. Est. S.E. Est. S.E.
Same controls as… Model A.1 Model A.2 Model A.3
Trained -0.715 (1.132) -1.108 (1.223) -1.557* (0.625)
Effect on control group / behavior
Log no. of projects led -0.229** (0.082) -0.343*** (0.076) 0.101 (0.062)
Log total months leading -0.048 (0.093) 0.089 (0.095) -0.074 (0.060)
Experience breadth -0.032 (0.030) -0.063+ (0.033) 0.019 (0.021)
Experience depth 0.007 (0.099) -0.256* (0.108) 0.193** (0.064)
Cognitive ability 0.001 (0.017) 0.014 (0.018) 0.012 (0.012)
Affective motivation to lead -0.010 (0.078) -0.126 (0.088) 0.063 (0.057)
Calculative motivation to lead -0.063 (0.063) -0.082 (0.064) -0.075 (0.046)
Learning goal orientation 0.074 (0.077) -0.073 (0.083) -0.008 (0.064)
Self-efficacy at week 0 0.086+ (0.046) 0.015 (0.048) 0.109*** (0.027)
Moderating effect: Difference between trained and control
Trained * Log no. of projects led 0.427*** (0.116) 0.271* (0.123) 0.245*** (0.071)
Trained * Log total months leading -0.054 (0.124) -0.073 (0.129) -0.164* (0.064)
Trained * Experience breadth 0.091* (0.041) 0.064 (0.045) 0.049* (0.023)
Trained * Experience depth -0.087 (0.135) 0.076 (0.146) -0.091 (0.076)
Trained * Cognitive ability -0.019 (0.023) -0.034 (0.026) -0.010 (0.014)
Trained * Affective motivation to lead -0.023 (0.110) 0.021 (0.123) 0.113+ (0.064)
Trained * Calculative motiv. to lead 0.061 (0.088) 0.084 (0.093) 0.118* (0.052)
Trained * Learning goal orientation 0.126 (0.118) 0.257* (0.130) 0.147* (0.075)
Trained * Self-efficacy at week 0 -0.079 (0.059) -0.104 (0.064) -0.009 (0.032)
Log likelihood -709.6 -853.4 -1610.4
AIC 1510.3 1765.0 3280.0
Observations 781 781 1454
Leaders 122 122 73
+ p < .10, * p < .05, ** p < .01, *** p < .001; two tailed tests.

Results 45
� = 0.245, p < .001). Figure 9 illustrates the predicted effect of training at different levels of
experience based on projects led. The three lines represent the three models used to estimate the
effect. The predictions were based on the models in Table 10. The results were transformed to the
original scale. As depicted, training had no benefit for individuals who had led less than five to ten
projects. The benefit of training became practically important (generally a 0.2 increase or more)
after leading about 15 to 20 projects. Below five projects, trained leaders actually improved less
than non-trained leaders with similar leadership experience.
The support found for number of projects led was not found for number of months leading.
In Table 9, there was a significant positive moderating effect for Model A.4(2) (� = 0.178, p < .05);
however, in Model A.7 in Table 10, the effect turned negative when the number of projects led was
also included (� = -0.054, p = n.s.). For Models A.5(2) (first difference) and A.6(2) (control
behavior), number of months leading was positive but not significant. In Models A.8, when the
number of projects led was also included, the effect turned negative as well (� = -0.073, p = n.s.);
In Model A.9, the effect turned negative and was significant (� = -0.164, p < .05). Together, the
models provide evidence that number of months leading was beneficial only to the extent that it
was correlated with number of projects led. Recall that the correlation between the two experience
measures was 0.55. After accounting for the number of projects led, the results provide some
evidence that number of months leading actually lessens the benefit of leadership training.
There was strong support for Hypothesis 2a based on breadth of experience, but not for
depth of experience. Breadth and depth were entered together in Table 9 as they are closely related
concepts that are best understood as a pair and they demonstrated a low bivariate correlation
(r = 0.27). Models A.4(3) and Models A.6(3) in Table 9 show that training had significantly greater
benefit for leaders with greater breadth of experience (� = 0.093, p < .01; � = 0.042, p < .05), and
the effect remained significant in Models A.7 and A.9 when other moderators were also included
in the model (� = 0.091, p < .05; � = 0.049, p < .05). In Model A.5(3), the moderating effect of
experience breadth was positive but not significant (� = 0.063, p = n.s.). Note, though, that the
coefficient in Model A.5(3) (� = 0.063) was larger than the same coefficient in Model A.6(3)
(� = 0.049). The former was not significant because it had a larger standard error than the latter.
Thus, although the estimate in Model A.5(3) is not significant, it is within the range of the same
coefficient in the other two models.
While experience breadth improved the benefit of leadership training, experience depth did
not; on the contrary, it may have lowered the benefit of training, though no estimates were
significant. The estimated moderating effect of experience depth in Models A.4(3) to A.6(3) were

Results 46
negative (� = -0.145, p = n.s.; � = -0.082, p = n.s.; � = -0.049, p = n.s.) and remained negative in
two out of three models in Table 10 when other moderators were added.
Additional analysis revealed that experience breadth was also moderated by the
combination of experience breadth and opportunity to lead. While not explicitly hypothesized, the
three-way interaction fits within the existing framework for the hypotheses. One underlying
premise in the hypotheses is that leaders will have the opportunity to apply what they learn so that
the training is remembered and behaviors are solidified (Ford, Quiñones, Sego, & Sorra, 1992; D.
H. Lim & Johnson, 2002). Thus, the combination of the opportunity to lead after training and
experience prior to training could potentially be required for training to be beneficial. Table 11
extends the models in Table 10 to include a three-way interaction with training, experience, and
opportunity to lead. The three-way interaction was positive and significant in Model A.10
(� = 0.003, p < .01) and Model A.11 (� = 0.002, p < .10), but not A.12 (� = 0.000, p = n.s.). The
positive effect provides evidence that leaders need both a breadth of experience and the opportunity
to lead after training to benefit from it. Notice also that the two-way interaction between opportunity
to lead and training was negative and significant in Models A.10 and A.11 in Table 11 (� = -0.014,
p < .05; � = -0.013, p < .10), which suggests that the three-way interaction is driven partly by the
Figure 9. Predicted effect of training and experience (projects led).

Results 47
fact that those who were trained and had an opportunity to lead but had no breadth of experience
improved less than similar leaders who were not trained. Model A.12, which only included trained
leaders, did not use the same counterfactual (i.e., it used control behaviors instead of a control
group) and did not provide evidence of a three-way interaction. Thus, the three-way interaction was
specific to using the control group for comparison.
Figure 10 illustrates the predicted impact of experience breadth based on Models A.10,
A.11, and A.12. The figure is read by comparing the height of the darker bar (low breadth of
experience) to the height of the adjacent lighter bar (high breadth of experience). I focus on the left-
hand high-opportunity plot as it is the most pertinent for understanding the training effect. For each
model, those who only had experience with two of the nine leadership situations improved less than
the control, whereas those who had experienced seven of the nine situations improved more than
the control. The difference is starkest for the lagged model wherein those with low experience
improved less than the control group by 0.40 points on the leadership scale, whereas those with
high experience improved 0.45 more than the control group. The predicted difference for the
control behavior model is smaller but follows the same pattern as the other two models.
Taken together, there was ample evidence that leadership training was beneficial for those
who had broader leadership experience, and there was additional evidence that the benefits were
Table 11. Three-way interaction with opportunity to lead: leader perspective.
Model A.10 Model A.11 Model A.12
Control Group, Lag Control Group, F.D. Control Behavior
Est. S.E. Est. S.E. Est. S.E.
Same parameters as… Model A.7 Model A.8 Model A.9
Opportunity to lead 0.015*** (0.004) 0.015** (0.005) 0.007** (0.003)
Trained -0.446 (1.132) -0.973 (1.259) -1.237+ (0.640)
Experience breadth 0.055 (0.063) 0.019 (0.072) 0.064+ (0.039)
Trained * Experience breadth -0.161+ (0.097) -0.107 (0.105) 0.009 (0.056)
Opportunity to lead * Trained -0.014* (0.006) -0.013+ (0.007) 0.002 (0.004)
Opportunity to lead * Exper. breadth -0.001 (0.001) -0.001 (0.001) -0.001 (0.001)
Opportun. * Trained * Exper. breadth 0.003** (0.001) 0.002+ (0.001) 0.000 (0.001)
Log likelihood -704.5 -851.4 -1606.2
AIC 1506.9 1767.4 3277.8
Observations 781 781 1454
Leaders 122 122 73
+ p < .10, * p < .05, ** p < .01, *** p < .001; two tailed tests.
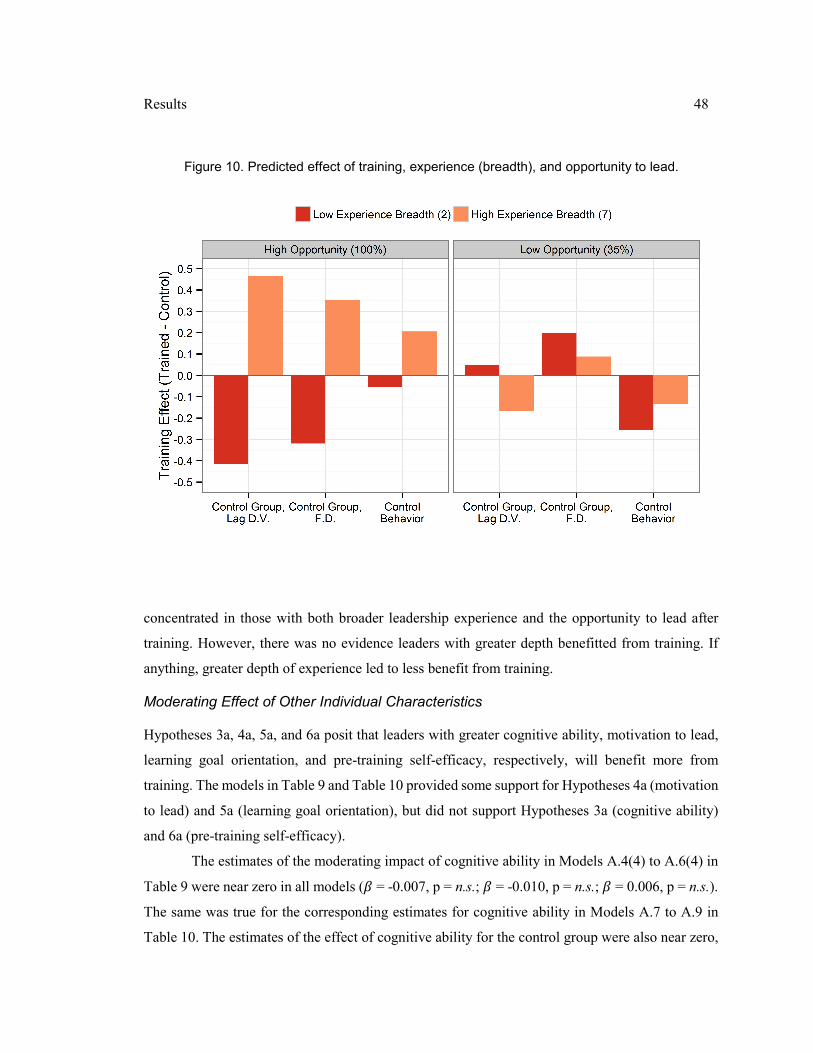
Results 48
concentrated in those with both broader leadership experience and the opportunity to lead after
training. However, there was no evidence leaders with greater depth benefitted from training. If
anything, greater depth of experience led to less benefit from training.
Moderating Effect of Other Individual Characteristics
Hypotheses 3a, 4a, 5a, and 6a posit that leaders with greater cognitive ability, motivation to lead,
learning goal orientation, and pre-training self-efficacy, respectively, will benefit more from
training. The models in Table 9 and Table 10 provided some support for Hypotheses 4a (motivation
to lead) and 5a (learning goal orientation), but did not support Hypotheses 3a (cognitive ability)
and 6a (pre-training self-efficacy).
The estimates of the moderating impact of cognitive ability in Models A.4(4) to A.6(4) in
Table 9 were near zero in all models (� = -0.007, p = n.s.; � = -0.010, p = n.s.; � = 0.006, p = n.s.).
The same was true for the corresponding estimates for cognitive ability in Models A.7 to A.9 in
Table 10. The estimates of the effect of cognitive ability for the control group were also near zero,
Figure 10. Predicted effect of training, experience (breadth), and opportunity to lead.
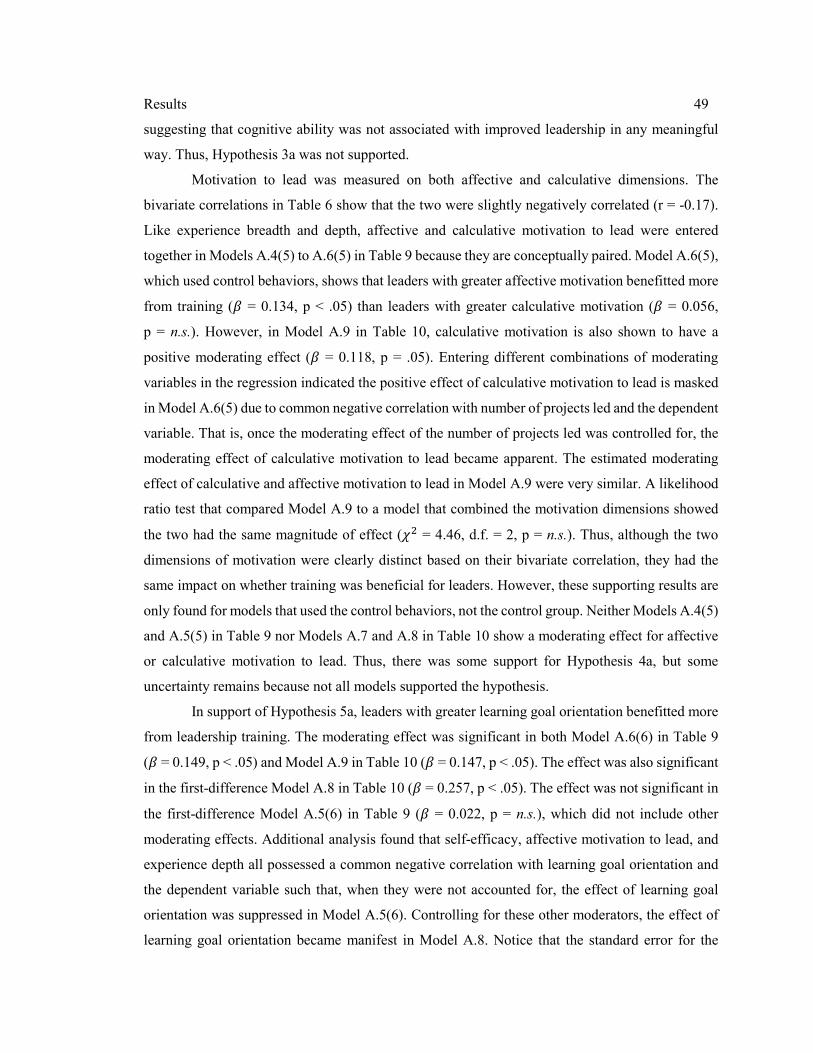
Results 49
suggesting that cognitive ability was not associated with improved leadership in any meaningful
way. Thus, Hypothesis 3a was not supported.
Motivation to lead was measured on both affective and calculative dimensions. The
bivariate correlations in Table 6 show that the two were slightly negatively correlated (r = -0.17).
Like experience breadth and depth, affective and calculative motivation to lead were entered
together in Models A.4(5) to A.6(5) in Table 9 because they are conceptually paired. Model A.6(5),
which used control behaviors, shows that leaders with greater affective motivation benefitted more
from training (� = 0.134, p < .05) than leaders with greater calculative motivation (� = 0.056,
p = n.s.). However, in Model A.9 in Table 10, calculative motivation is also shown to have a
positive moderating effect (� = 0.118, p = .05). Entering different combinations of moderating
variables in the regression indicated the positive effect of calculative motivation to lead is masked
in Model A.6(5) due to common negative correlation with number of projects led and the dependent
variable. That is, once the moderating effect of the number of projects led was controlled for, the
moderating effect of calculative motivation to lead became apparent. The estimated moderating
effect of calculative and affective motivation to lead in Model A.9 were very similar. A likelihood
ratio test that compared Model A.9 to a model that combined the motivation dimensions showed
the two had the same magnitude of effect (2 = 4.46, d.f. = 2, p = n.s.). Thus, although the two
dimensions of motivation were clearly distinct based on their bivariate correlation, they had the
same impact on whether training was beneficial for leaders. However, these supporting results are
only found for models that used the control behaviors, not the control group. Neither Models A.4(5)
and A.5(5) in Table 9 nor Models A.7 and A.8 in Table 10 show a moderating effect for affective
or calculative motivation to lead. Thus, there was some support for Hypothesis 4a, but some
uncertainty remains because not all models supported the hypothesis.
In support of Hypothesis 5a, leaders with greater learning goal orientation benefitted more
from leadership training. The moderating effect was significant in both Model A.6(6) in Table 9
(� = 0.149, p < .05) and Model A.9 in Table 10 (� = 0.147, p < .05). The effect was also significant
in the first-difference Model A.8 in Table 10 (� = 0.257, p < .05). The effect was not significant in
the first-difference Model A.5(6) in Table 9 (� = 0.022, p = n.s.), which did not include other
moderating effects. Additional analysis found that self-efficacy, affective motivation to lead, and
experience depth all possessed a common negative correlation with learning goal orientation and
the dependent variable such that, when they were not accounted for, the effect of learning goal
orientation was suppressed in Model A.5(6). Controlling for these other moderators, the effect of
learning goal orientation became manifest in Model A.8. Notice that the standard error for the
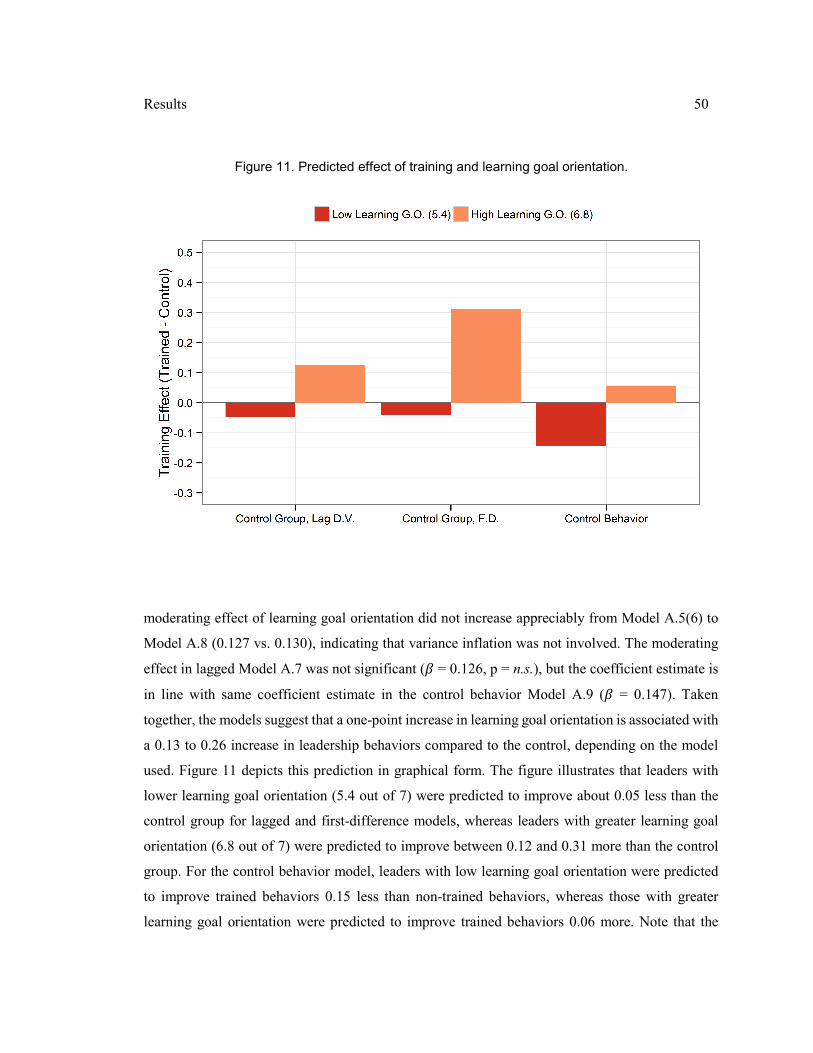
Results 50
moderating effect of learning goal orientation did not increase appreciably from Model A.5(6) to
Model A.8 (0.127 vs. 0.130), indicating that variance inflation was not involved. The moderating
effect in lagged Model A.7 was not significant (� = 0.126, p = n.s.), but the coefficient estimate is
in line with same coefficient estimate in the control behavior Model A.9 (� = 0.147). Taken
together, the models suggest that a one-point increase in learning goal orientation is associated with
a 0.13 to 0.26 increase in leadership behaviors compared to the control, depending on the model
used. Figure 11 depicts this prediction in graphical form. The figure illustrates that leaders with
lower learning goal orientation (5.4 out of 7) were predicted to improve about 0.05 less than the
control group for lagged and first-difference models, whereas leaders with greater learning goal
orientation (6.8 out of 7) were predicted to improve between 0.12 and 0.31 more than the control
group. For the control behavior model, leaders with low learning goal orientation were predicted
to improve trained behaviors 0.15 less than non-trained behaviors, whereas those with greater
learning goal orientation were predicted to improve trained behaviors 0.06 more. Note that the
Figure 11. Predicted effect of training and learning goal orientation.
Results 51
control behavior model predicted lower effects because the main effect of training in Model A.3
was slightly negative.
No support was found for Hypothesis 6a, which posited a positive moderating effect of
pre-training self-efficacy. Models A.4(7) to A.6(7) in Table 9 and Models A.7 to A.9 in Table 10
show that the moderating effect of self-efficacy was not significant.
Supplementary Analysis
Table 12 presents alternative models to Model A.7 that provide evidence that the choices made
while setting up the sample and specifications did not significantly impact the estimates. Model
A.13 includes all controls available, Model A.14 drops leaders from the sample who were flagged
as potentially careless responders, and Model A.15 drops leaders in the control group who led more
than 40 projects. As shown in the table, the estimates change very little compared to Model A.7.
Although not shown, I also estimated these supplementary models for the first-difference
specification and control behavior specification, and they returned results very similar to Models
A.8 and A.9. Thus, the supplementary analysis supports the existing findings.
One concern that may be raised about the self-report sample is that the dependent variables
and the independent variables were collected from the same person, raising the potential for
common method bias (Podsakoff, MacKenzie, Lee, & Podsakoff, 2003). However, it is improbable
that this was a problem. First, the independent variables were collected in the first time period, and
the dependent variables were collected over time, leaving a six- or twelve-week gap between
measurements of IVs and DVs. Second, the specifications account for autocorrelation and
unobserved attributes of responders that would generate common method bias effects. Third, H2a
through H6a are moderating hypotheses, which are not susceptible to common methods bias
(Evans, 1985; Siemsen, Roth, & Oliveira, 2010).
Another concern is that since the treatments were not blind, trained leaders may have
inflated their scores due to a self-enhancement bias (Taylor, Russ-Eft, & Taylor, 2009). However,
there is little evidence of such bias. First, there was a five-week lag between training and post-
training measures, providing some time for the salience and immediacy of the training to wane,
reducing the likelihood of self-enhancement bias. Second, the regression results in Table 8 provide
very modest evidence of a training effect, which is where the self-enhancement bias would appear.
Third, the control behavior specification, which only looks at trained leaders, would account for
this concern (Taylor et al., 2009). Fourth, this is a concern for the main effect of training (H1a), but
would not affect the estimation of the moderating hypotheses.
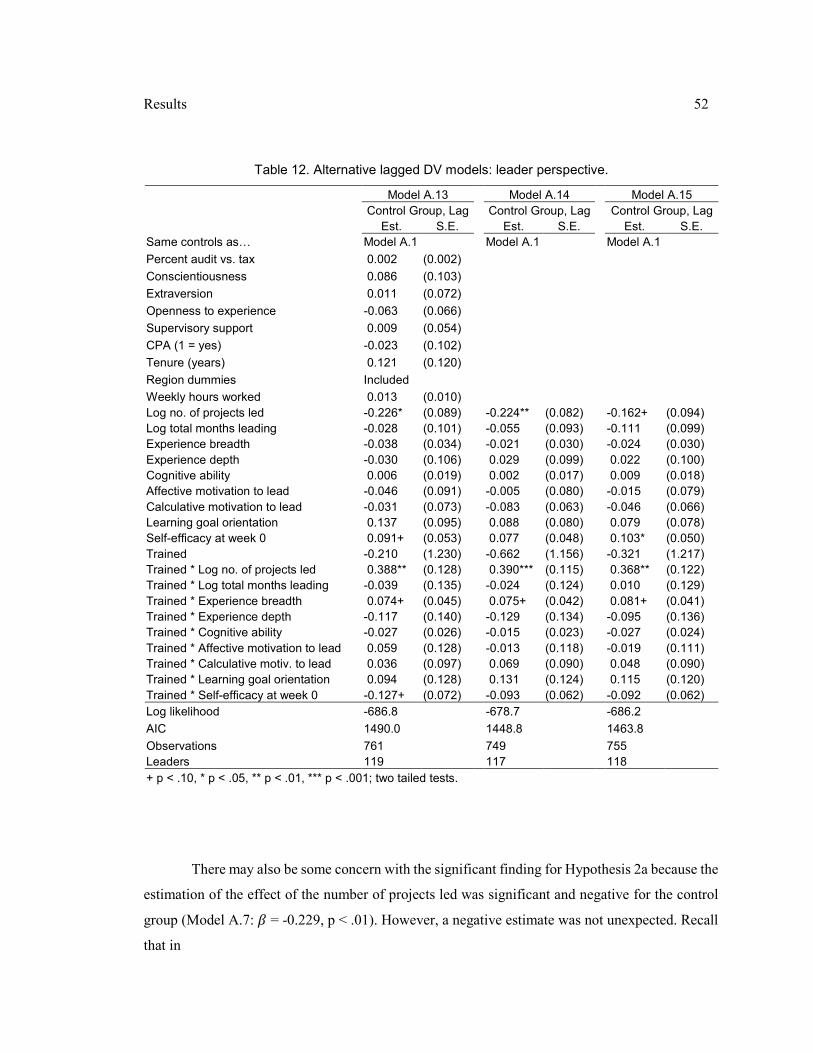
Results 52
There may also be some concern with the significant finding for Hypothesis 2a because the
estimation of the effect of the number of projects led was significant and negative for the control
group (Model A.7: � = -0.229, p < .01). However, a negative estimate was not unexpected. Recall
that in
Table 12. Alternative lagged DV models: leader perspective.
Model A.13 Model A.14 Model A.15
Control Group, Lag Control Group, Lag Control Group, Lag
Est. S.E. Est. S.E. Est. S.E.
Same controls as… Model A.1 Model A.1 Model A.1
Percent audit vs. tax 0.002 (0.002)
Conscientiousness 0.086 (0.103)
Extraversion 0.011 (0.072)
Openness to experience -0.063 (0.066)
Supervisory support 0.009 (0.054)
CPA (1 = yes) -0.023 (0.102)
Tenure (years) 0.121 (0.120)
Region dummies Included
Weekly hours worked 0.013 (0.010)
Log no. of projects led -0.226* (0.089) -0.224** (0.082) -0.162+ (0.094)
Log total months leading -0.028 (0.101) -0.055 (0.093) -0.111 (0.099)
Experience breadth -0.038 (0.034) -0.021 (0.030) -0.024 (0.030)
Experience depth -0.030 (0.106) 0.029 (0.099) 0.022 (0.100)
Cognitive ability 0.006 (0.019) 0.002 (0.017) 0.009 (0.018)
Affective motivation to lead -0.046 (0.091) -0.005 (0.080) -0.015 (0.079)
Calculative motivation to lead -0.031 (0.073) -0.083 (0.063) -0.046 (0.066)
Learning goal orientation 0.137 (0.095) 0.088 (0.080) 0.079 (0.078)
Self-efficacy at week 0 0.091+ (0.053) 0.077 (0.048) 0.103* (0.050)
Trained -0.210 (1.230) -0.662 (1.156) -0.321 (1.217)
Trained * Log no. of projects led 0.388** (0.128) 0.390*** (0.115) 0.368** (0.122)
Trained * Log total months leading -0.039 (0.135) -0.024 (0.124) 0.010 (0.129)
Trained * Experience breadth 0.074+ (0.045) 0.075+ (0.042) 0.081+ (0.041)
Trained * Experience depth -0.117 (0.140) -0.129 (0.134) -0.095 (0.136)
Trained * Cognitive ability -0.027 (0.026) -0.015 (0.023) -0.027 (0.024)
Trained * Affective motivation to lead 0.059 (0.128) -0.013 (0.118) -0.019 (0.111)
Trained * Calculative motiv. to lead 0.036 (0.097) 0.069 (0.090) 0.048 (0.090)
Trained * Learning goal orientation 0.094 (0.128) 0.131 (0.124) 0.115 (0.120)
Trained * Self-efficacy at week 0 -0.127+ (0.072) -0.093 (0.062) -0.092 (0.062)
Log likelihood -686.8 -678.7 -686.2
AIC 1490.0 1448.8 1463.8
Observations 761 749 755
Leaders 119 117 118
+ p < .10, * p < .05, ** p < .01, *** p < .001; two tailed tests.
Results 53
Table 7 the relationship between number of projects led and leadership behaviors was positive and
significant (� = 0.316, p < .001). These results suggest that experience and leadership behaviors
were following the expected learning curve. Leaders with more accumulated experience had greater
leadership ability, which was captured in Table 7, but their increase in leadership behaviors was
slower than those with less experience. That is why the negative estimate for the control group in
Model A.7 and A.8 is not surprising.
Finally, there may be some concern that the leadership training did not lead to the
significant findings, but it was the broader four-day training in which the leadership module was
embedded. There are three reasons that this is improbable. First, the remaining training modules
that leaders received taught specific tax and audit principles. The classes were technical in nature
and did not deal with the leadership principles taught in the leadership module. Second, the results
found using the control group were also replicated when comparing to control behaviors. If the
broader four-day training conference impacted leadership behaviors generally, I would not expect
to find the distinction between the trained and non-trained behaviors that appeared in Model A.9.
Third, fourteen leaders in the control group also received a four-day technical training during the
summer either at the level below or level above, but the other levels did not include the leadership
training. I assigned the fourteen leaders to the trained group instead of the control group and
reestimated Model A.7. The AIC was higher when the fourteen leaders were considered trained
(AIC = 1520.7) than the AIC for Model A.7 (AIC = 1510.3), indicating that the fourteen leaders
that also received technical training (but no leadership training) did not fit well with the group of
leaders trained in leadership specifically. This suggests that the training module drove the
significant results, not the broader training conference.
Summary of Leader Perspective
Results from the leader sample provided limited support for a main effect of training (H1a). The
estimated training effect ranged from -0.06 to +0.22 depending on the model specification and
control. In practical terms, the overall training effect was nil to small. However, there was robust
evidence that some leaders benefitted much more from training than others. Leaders who had led
more projects or who had greater exposure to a breadth of leadership situations benefitted more
from training than those with less experience. At the same time, those who had led more months or
had greater depth of experience did not benefit more from training, and, controlling for projects led
and breadth of experience, may have actually improved less than the control group—an intimation
that would need to be investigated further to settle.

Results 54
The results also provided fairly strong evidence that leaders with a stronger learning goal
orientation benefitted more from training. Modest evidence also suggested that leaders with greater
motivation to lead gained more from training. However, no support was found for the moderating
effect of cognitive ability and pre-training self-efficacy.
Subordinate Perspective
Estimating the effect of leader training using the perspective of leaders’ subordinates offers the
advantage of having outside observers who are directly impacted by the leaders’ behaviors rate the
leader. However, this sample has serious limitations. Because of the difficulty encountered
matching subordinate responses with sample leaders, many of the subordinate surveys were not
usable. In the end, responses for only 46 leaders were usable—23 for the control group and 23 for
the trained group. For 11 of the 46 leaders, the same subordinate was not rating the leader across
Figure 12. Leadership behaviors over time: subordinate perspective.

Results 55
all time periods. I continue with the analysis as planned but add a caution that the results are tenuous
given the small sample size.
Main Effect of Training
Figure 12 depicts the leadership behaviors of leaders based on the subordinate perspective. The
control group behaviors remained flat over time. The leader behaviors of Trained Group 1 increased
somewhat from week 0 to week 6, which is the period in which they were trained. The leadership
behaviors of Trained Group 1 remained flat in the next period. The leadership behaviors of Trained
Group 2 were flat like the control group from week 0 to week 6 (at which point they had not yet
been trained), but their leadership behaviors remained flat as well from week 6 to week 12, the
period during which they were trained.
Table 13 presents the estimates for the main effect of training. The lagged specification in
Model B.1 (� = -0.146, p = n.s.), the first-difference specification in Model B.2 (� = -0.023,
Table 13. Main effect of training: subordinate perspective.
Model B.1 Model B.2 Model B.3
Control Group, Lag Control Group, F.D. Control Behavior
Est. S.E. Est. S.E. Est. S.E.
(Intercept) 2.396*** (0.618) 0.199 (0.503) 3.821*** (0.474)
Leadership at week 0 0.292*** (0.051)
Leadership behavior dummies Included Included
Leadership behavior (1 = training) -0.085 (0.062)
Trained Group 2 0.167 (0.145)
Industry dummies Included
Hire quarter dummies Included
Senior associate 0.171 (0.155)
Week 6 0.006 (0.184)
Week 12 0.034 (0.133) 0.040 (0.130) 0.015 (0.194)
Agreeableness (subordinate) 0.151 (0.124) 0.013 (0.103) 0.057 (0.100)
Relationship months (subordinate) 0.019* (0.010) 0.015+ (0.009) 0.005 (0.016)
Opportunity to lead -0.009** (0.003) -0.004 (0.003) -0.003 (0.003)
Trained -0.146 (0.173) -0.023 (0.137) 0.036 (0.088)
Log likelihood -332.0 -415.1 -510.8
AIC 719.4 857.0 1050.4
Observations 432 432 564
Leaders 46 46 23
+ p < .10, * p < .05, ** p < .01, *** p < .001; two tailed tests.

Results 56
p = n.s.), and the control behavior comparison in Model B.3 (� = 0.036, p = n.s.) all show no effect
of training. Models B.2 and B.3 show an almost zero effect while Model B.1 shows a slight negative
main effect of training. Overall, the subordinate perspective does not support Hypothesis 1b.
Moderating Effect of Experience
Table 14 presents the effect of the moderating variables. Because the sample size is small, I added
the moderating impact of the moderating variables individually for the leader perspective and did
not add all of the moderators at once. I attempted to do so with the subordinate data, but the standard
errors became substantially inflated, so I was doubtful of the credibility of the estimated results.
Table 14. Moderating effects entered individually: subordinate perspective.
Model B.4(X) Model B.5(X) Model B.6(X)
Control Group, Lag Control Group, F.D. Control Behavior
Est. S.E. Est. S.E. Est. S.E.
Trained (1) 0.824+ (0.445) 0.733+ (0.419) 0.047 (0.200)
Log no. of projects led 0.210+ (0.125) 0.090 (0.082) -0.218* (0.092)
Trained * Log no. of projects led -0.433* (0.179) -0.300+ (0.156) -0.005 (0.072)
Trained (2) 0.527 (0.717) 0.844 (0.625) 0.392 (0.307)
Log total months leading 0.175 (0.138) 0.161+ (0.097) 0.158 (0.129)
Trained * Log total months leading -0.252 (0.260) -0.307 (0.216) -0.129 (0.106)
Trained (3) -0.366 (0.689) 0.444 (0.622) 0.277 (0.309)
Experience breadth -0.022 (0.040) 0.022 (0.035) 0.017 (0.039)
Experience depth -0.050 (0.140) -0.046 (0.107) 0.062 (0.114)
Trained * Experience breadth -0.046 (0.076) -0.006 (0.069) -0.036 (0.033)
Trained * Experience depth 0.153 (0.216) -0.161 (0.191) -0.021 (0.094)
Trained (4) 1.260 (1.261) 1.160 (1.051) 0.132 (0.536)
Cognitive ability 0.011 (0.024) -0.002 (0.017) 0.009 (0.023)
Trained * Cognitive ability -0.051 (0.046) -0.043 (0.040) -0.005 (0.020)
Trained (5) -1.981* (0.881) -0.045 (0.938) -0.624 (0.456)
Affective motivation to lead -0.073 (0.095) -0.056 (0.091) 0.050 (0.073)
Calculative motivation to lead 0.171+ (0.093) 0.067 (0.077) 0.115+ (0.067)
Trained * Affective motivation to lead 0.292* (0.134) -0.020 (0.141) 0.070 (0.068)
Trained * Calculative motiv. to lead 0.103 (0.152) 0.053 (0.154) 0.122+ (0.074)
Trained (6) -2.772* (1.354) -0.002 (1.196) -2.113*** (0.627)
Learning goal orientation 0.074 (0.121) 0.164+ (0.095) 0.125 (0.154)
Trained * Learning goal orientation 0.468* (0.239) 0.002 (0.206) 0.377*** (0.109)
Trained (7) -2.051* (0.933) -1.151 (0.813) -1.001* (0.417)
Self-efficacy at week 0 -0.050 (0.069) -0.032 (0.055) 0.054 (0.081)
Trained * Self-efficacy at week 0 0.296* (0.141) 0.174 (0.126) 0.166* (0.066)
Models include the same controls as Model B.1, B.2, and B.3.
+ p < .10, * p < .05, ** p < .01, *** p < .001; two tailed tests.

Results 57
Thus, I report the moderating results recognizing that the effect of one moderator includes the
shared variance of the often-related other moderators.
For Hypothesis 2b, the results provide some evidence opposite to the posited effect for
number of projects led. In Models B.4(1) and B.5(1), the leadership behaviors of leaders who had
led more projects improved less than the control group leaders with similar experience (� = -0.433,
p < .05; � = -0.300, p < .10). For Model B.6(1), which used control behaviors for comparison, no
moderating effect was found for number of projects led. For the other measures of experience, there
was no evidence of a moderating effect. Models B.4(2) to B.6(2) tested the moderating effect of
number of months leading, and Models B.4(3) to B.6(3) tested the moderating effect experience
breadth and depth. None of the estimates in these models were significant. Thus, Hypothesis 2b
was not supported.
Because the moderating effect of the number of projects led was significant and positive
from the leader perspective but significant and negative from the subordinate perspective, it is
important to try to reconcile the two. I did so in two ways. First, I used the subset of 40 leaders that
were common to both samples to see if the regression estimates were similar. If the estimates of
the moderating effect converged for the common subsample, then the original divergent findings
would be best explained by the differences in the samples. However, if the estimates remained
divergent for the common subsample, then the differences would be best explained by differences
in perspective between the leaders and subordinates. I reestimated Model A.4(1) and B.4(1) using
the 40 common leaders. The moderating effect of the number of projects led for the Model A.4(1)
subsample was 0.261 (t-value = 1.38). The corresponding effect for the Model B.4(1) subsample
was -0.548 (t-value = -2.45), a difference of 0.809. In the original models with full samples, the
difference in the estimates of the moderating effect was 0.837. Thus, the difference in the estimates
was reduced a little by using the common subsample, but the perspectives still remained divergent.
Second, I looked for outliers that might impact the small subordinate sample. I found that two
leaders drove the negative moderating result. One leader led one project and another led two
projects; the other 44 leaders in the subordinate sample led more than two projects. When those
two leaders were omitted from the sample, the moderating effect increased from -0.433 in Model
B.4(1) to +0.010 (p = n.s.). The same two leaders appeared in the subsample of 40 common leaders.
When they were omitted, then the estimate of the moderating effect for the 38 common leaders was
+0.149 (t-value = 0.42) for the subordinate-rated sample and +0.602 (t-value = 2.46) for the self-
rated sample—a difference of only 0.453. In all, the additional analysis demonstrated that the
negative moderating effect was dependent on two leaders in the subordinate-rated sample, which
Results 58
makes the finding highly tenuous. Without the two leaders, the negative moderating effect
disappeared and a substantial portion of the divergence in perspective was eliminated. Yet, the
distance was not fully traversed: the leader self-rated sample still predicted that leaders benefit
more from training when they have led more projects while the subordinate perspective predicted
no benefit.
Moderating Effect of Other Individual Characteristics
No evidence was found that leaders with greater cognitive ability benefitted more from training.
The estimates of the moderating effect of cognitive ability in Models B.4(5) to B.6(5) were not
significant. Thus, Hypothesis 3b was not supported.
Like the leader perspective, there was mixed evidence that leaders with greater motivation
to lead benefitted more from training. The estimate of the moderating effect of affective motivation
to lead in Model B.4(5) was positive and significant (� = 0.292, p < .05). However, the moderating
effect was not significant in Models B.5(5) (� = -0.020, p = n.s.) nor B.6(5) (� = 0.070, p = n.s.).
For calculative motivation to lead, the moderating effect was marginally significant in Model
B.6(5) (� = 0.122, p < .10) but was not significant in Models B.4(5) (� = 0.103, p = n.s.) nor B.5(5)
(� = 0.053, p = n.s.). Thus, there is limited support for Hypothesis 4b.
There is stronger evidence that leaders with greater learning goal orientation benefitted
more from training. The estimates of the moderating effect of learning goal orientation in Models
B.4(6) (� = 0.468, p < .05) and B.6(6) (� = 0.377, p < .001) were significant. However, the first-
difference estimate in Model B.5(6) was not significant (� = 0.002, p < n.s.). Taken together, the
models provide mixed support for Hypothesis 5b, but when combined with the findings from the
leader perspective (H5a), they provide quite robust evidence that leaders with a stronger learning
goal orientation benefit more from leadership training.
The subordinate perspective also provides evidence that leaders with greater pre-training
self-efficacy benefit more from training, which supports Hypothesis 6b. The estimates of the
moderating effect of self-efficacy in Models B.4(7) and B.6(7) were positive and significant
(� = 0.296, p < .05; � = 0.166, p < .05). The estimate for Model B.5(7) was not significant
(� = 0.174, p = n.s.), but it falls between the estimates of the lagged model and control behaviors
model. Although Hypothesis 6b is supported, some caution should be taken because of the sample
size.

Results 59
Summary of Subordinate Perspective
From the subordinate perspective, trained leaders did not improve in their leadership more than
non-trained leaders, so Hypothesis 1b was not supported. Contrary to expectations, some evidence
suggested that leaders who had led more projects benefitted less from training compared to the
control group. However, the negative finding is wholly dependent on two leaders, making the
negative finding tenuous. Nonetheless, Hypothesis 2b was not supported. There was also no support
for Hypothesis 3b regarding cognitive ability.
Some limited support was found for motivation to lead (H4b). Leaders with greater
affective and calculative motivation to lead benefitted more training in some models, but not others.
Mixed support was found for the moderating impact of learning goal orientation (H5b) and strong
support was found for Hypothesis 6b, that pre-training self-efficacy amplifies the benefit of
training.
Manager Perspective
I was only able to survey managers once, so I asked them to retrospectively provide the change in
leadership behaviors they have observed in the project leaders they manage. Because they provided
change values, unstandardized estimates were not directly comparable to the subordinate ratings
and leader self-ratings, but the hypothesis tests can still be performed. Also, because the data is
cross-sectional, I cannot use the same specifications as those used with the panel data. However,
the control behavior specification for the manager sample provided the same benefits of a within-
person comparison as found in the leader and subordinate samples.
Main Effect of Training
Figure 13 illustrates the retrospective rating of change in leadership behaviors. The y-axis is the
leadership behavior of the leaders at the beginning of the study period (rated retrospectively), and
the axes within the figure is the rating of change, zero being no change. As illustrated, Trained
Group 1 changed slightly more than the control group (0.85 vs. 0.80, but Trained Group 2 changed
slightly less (0.75 vs. 0.80).
Table 15 presents the main effect of training. In both the control group and control behavior
models, the training effect was positive but not significant (� = 0.066, p = n.s.; � = 0.040, p = n.s.).
Thus, Hypothesis 1c was not supported.

Results 60
Moderating Effect of Experience
Table 16 presents the estimates of the moderating effects entered individually into the model. Table
17 presents the estimates of the moderating effects entered together. There is some mixed evidence
that leaders who had led more months benefitted more from training. The estimated moderating
effect in Model C.3(2) was positive and significant (� = 0.443, p < .05), and it remained significant
in Model C.5 when the other moderators were added to the model (� = 0.666, p < .05). However
the corresponding estimates in Model C.4(2) (control behavior) in Table 16 and Model C.6 in Table
17 were not significant (� = 0.024, p = n.s.; � = -0.051, p = n.s.). No other experience measures
(i.e., number of projects led, experience breadth, experience depth) were significant. Thus, there
was some limited support for Hypothesis 2c.
Figure 13. Retrospective change in leadership behaviors: manager rating.
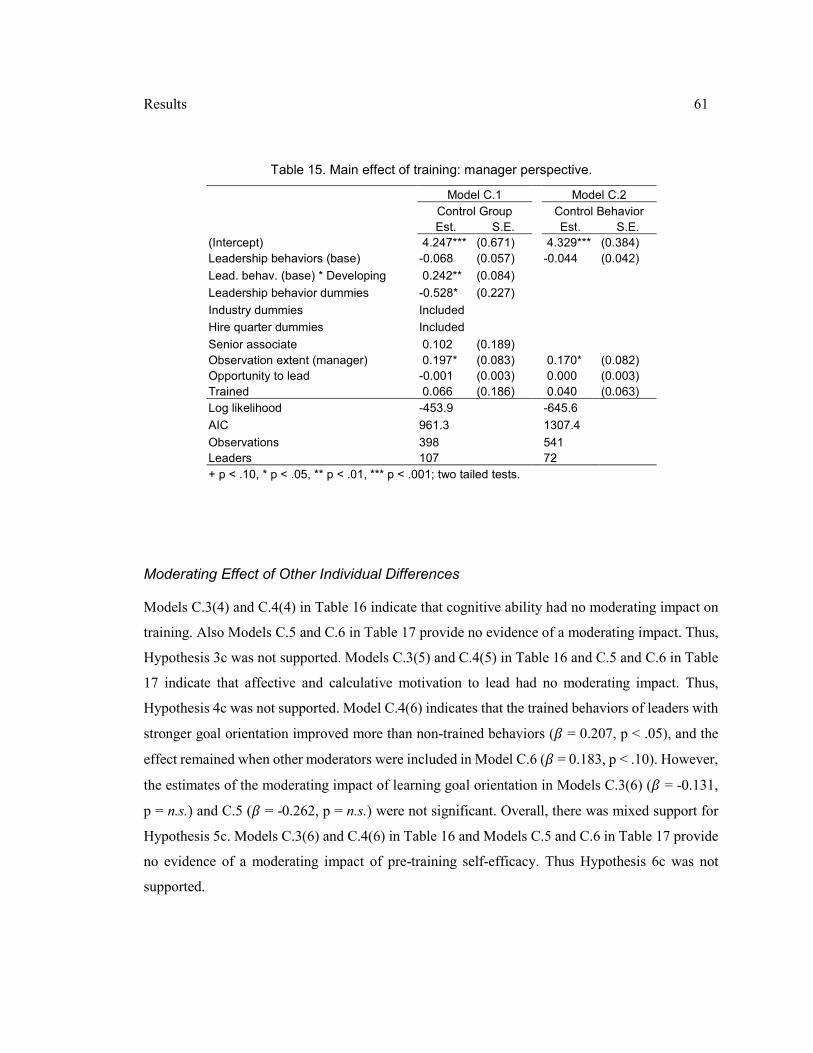
Results 61
Moderating Effect of Other Individual Differences
Models C.3(4) and C.4(4) in Table 16 indicate that cognitive ability had no moderating impact on
training. Also Models C.5 and C.6 in Table 17 provide no evidence of a moderating impact. Thus,
Hypothesis 3c was not supported. Models C.3(5) and C.4(5) in Table 16 and C.5 and C.6 in Table
17 indicate that affective and calculative motivation to lead had no moderating impact. Thus,
Hypothesis 4c was not supported. Model C.4(6) indicates that the trained behaviors of leaders with
stronger goal orientation improved more than non-trained behaviors (� = 0.207, p < .05), and the
effect remained when other moderators were included in Model C.6 (� = 0.183, p < .10). However,
the estimates of the moderating impact of learning goal orientation in Models C.3(6) (� = -0.131,
p = n.s.) and C.5 (� = -0.262, p = n.s.) were not significant. Overall, there was mixed support for
Hypothesis 5c. Models C.3(6) and C.4(6) in Table 16 and Models C.5 and C.6 in Table 17 provide
no evidence of a moderating impact of pre-training self-efficacy. Thus Hypothesis 6c was not
supported.
Table 15. Main effect of training: manager perspective.
Model C.1 Model C.2
Control Group Control Behavior
Est. S.E. Est. S.E.
(Intercept) 4.247*** (0.671) 4.329*** (0.384)
Leadership behaviors (base) -0.068 (0.057) -0.044 (0.042)
Lead. behav. (base) * Developing 0.242** (0.084)
Leadership behavior dummies -0.528* (0.227)
Industry dummies Included
Hire quarter dummies Included
Senior associate 0.102 (0.189)
Observation extent (manager) 0.197* (0.083) 0.170* (0.082)
Opportunity to lead -0.001 (0.003) 0.000 (0.003)
Trained 0.066 (0.186) 0.040 (0.063)
Log likelihood -453.9 -645.6
AIC 961.3 1307.4
Observations 398 541
Leaders 107 72
+ p < .10, * p < .05, ** p < .01, *** p < .001; two tailed tests.

Results 62
Summary of Manager Perspective
The manager perspective provides little evidence of any main or moderated effect of training. There
was limited support for Hypothesis 2c that leaders who have led for more months benefitted more
from training, but the effect was not consistent across models. There was also mixed support for
Hypothesis 5c—that leaders with a stronger learning goal orientation benefitted more from training.
However, H1c, H3c, H4c, and H6c were not supported.
Table 16. Moderating effects entered individually: manager perspective.
Model C.3(X) Model C.4(X)
Control Group Control Behav.
Est. S.E. Est. S.E.
Trained (1) 0.077 (0.559) -0.200 (0.166)
Log no. of projects led -0.039 (0.188) -0.169 (0.105)
Trained * Log no. of projects led 0.016 (0.225) 0.106 (0.078)
Trained (2) -1.217* (0.562) -0.051 (0.155)
Log total months leading -0.490** (0.174) -0.074 (0.069)
Trained * Log total months leading 0.443* (0.183) 0.024 (0.057)
Trained (3) 0.032 (0.692) -0.107 (0.280)
Experience breadth -0.085 (0.056) -0.070+ (0.038)
Experience depth -0.084 (0.192) -0.045 (0.127)
Trained * Experience breadth 0.033 (0.068) 0.030 (0.027)
Trained * Experience depth -0.006 (0.247) -0.006 (0.094)
Trained (4) 0.843 (1.316) -0.573 (0.490)
Cognitive ability 0.032 (0.041) -0.015 (0.025)
Trained * Cognitive ability -0.026 (0.048) 0.022 (0.019)
Trained (5) -0.223 (1.077) -0.417 (0.461)
Affective motivation to lead 0.065 (0.138) -0.087 (0.099)
Calculative motivation to lead -0.069 (0.175) 0.119 (0.088)
Trained * Affective motivation to lead 0.050 (0.167) 0.112 (0.076)
Trained * Calculative motiv. to lead 0.047 (0.197) -0.075 (0.065)
Trained (6) 0.925 (1.279) -1.250* (0.546)
Learning goal orientation 0.057 (0.163) -0.280* (0.117)
Trained * Learning goal orientation -0.131 (0.208) 0.207* (0.089)
Trained (7) 0.300 (0.707) -0.146 (0.313)
Self-efficacy at week 0 -0.046 (0.095) -0.134* (0.059)
Trained * Self-efficacy at week 0 -0.023 (0.109) 0.024 (0.048)
Models include the same controls as Model C.1, C.2, and C.3.
+ p < .10, * p < .05, ** p < .01, *** p < .001; two tailed tests.
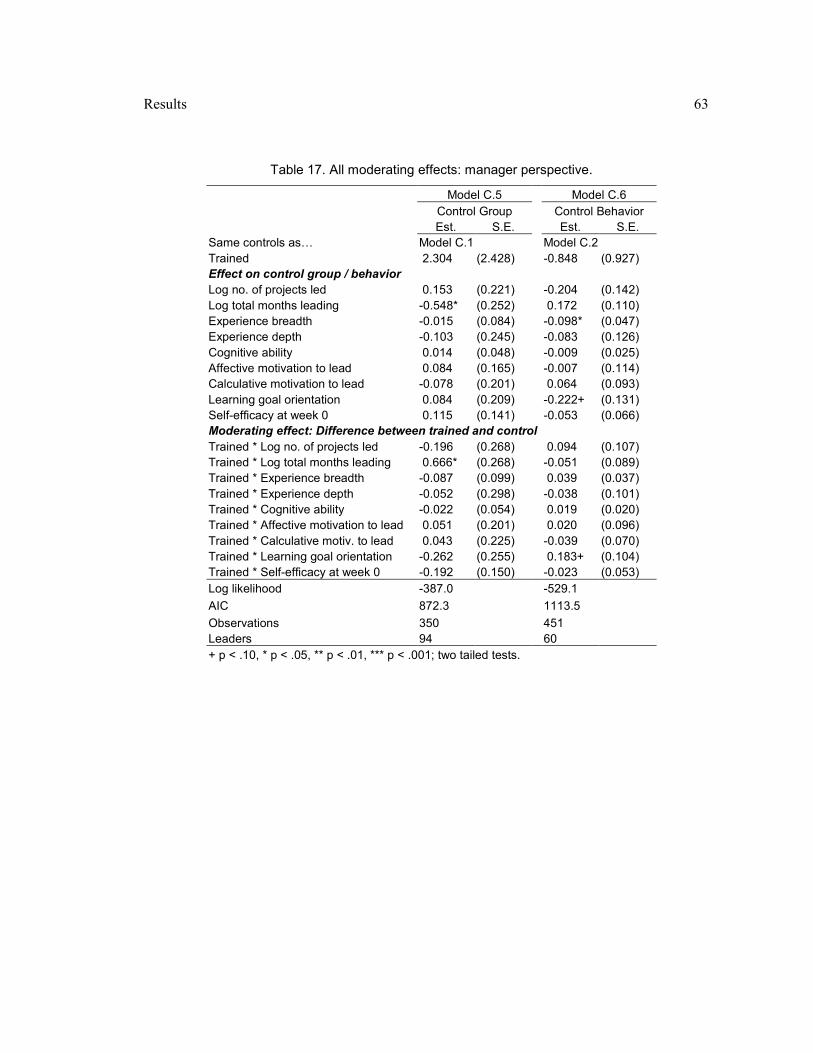
Results 63
Table 17. All moderating effects: manager perspective.
Model C.5 Model C.6
Control Group Control Behavior
Est. S.E. Est. S.E.
Same controls as… Model C.1 Model C.2
Trained 2.304 (2.428) -0.848 (0.927)
Effect on control group / behavior
Log no. of projects led 0.153 (0.221) -0.204 (0.142)
Log total months leading -0.548* (0.252) 0.172 (0.110)
Experience breadth -0.015 (0.084) -0.098* (0.047)
Experience depth -0.103 (0.245) -0.083 (0.126)
Cognitive ability 0.014 (0.048) -0.009 (0.025)
Affective motivation to lead 0.084 (0.165) -0.007 (0.114)
Calculative motivation to lead -0.078 (0.201) 0.064 (0.093)
Learning goal orientation 0.084 (0.209) -0.222+ (0.131)
Self-efficacy at week 0 0.115 (0.141) -0.053 (0.066)
Moderating effect: Difference between trained and control
Trained * Log no. of projects led -0.196 (0.268) 0.094 (0.107)
Trained * Log total months leading 0.666* (0.268) -0.051 (0.089)
Trained * Experience breadth -0.087 (0.099) 0.039 (0.037)
Trained * Experience depth -0.052 (0.298) -0.038 (0.101)
Trained * Cognitive ability -0.022 (0.054) 0.019 (0.020)
Trained * Affective motivation to lead 0.051 (0.201) 0.020 (0.096)
Trained * Calculative motiv. to lead 0.043 (0.225) -0.039 (0.070)
Trained * Learning goal orientation -0.262 (0.255) 0.183+ (0.104)
Trained * Self-efficacy at week 0 -0.192 (0.150) -0.023 (0.053)
Log likelihood -387.0 -529.1
AIC 872.3 1113.5
Observations 350 451
Leaders 94 60
+ p < .10, * p < .05, ** p < .01, *** p < .001; two tailed tests.

5. DISCUSSION
The aim of this study was to understand how leaders’ prior leadership experience as well as their
cognitive ability, motivation to lead, learning goal orientation, and self-efficacy impact the
effectiveness of leadership training. The study used a quasi-experimental test to compare trained
leaders to similar non-trained leaders and also compare leadership behaviors that were specifically
trained to behaviors that were not trained. I measured leadership behaviors from the leader,
subordinate, and manager perspective. Table 18 summarizes the findings.
The Interplay between Experience and Training
From the leaders’ own perspective, prior leadership experience was vital to their ability to benefit
from leadership training. Novice leaders obtained no observable benefit from training and actually
improved less than novice leaders who were not trained. The positive effect of experience remains
even after controlling for the effect of cognitive ability, motivation to lead, learning goal
orientation, and self-efficacy. In other words, after accounting for the fact that experienced leaders
often had a learning orientation, were motivated to lead, and had greater confidence in their
leadership, experience still impacted the effectiveness of training. This result supports the theory
that schema constraints restrict the ability of novice leaders to glean insights from behavioral
training while experienced leaders are able to utilize the training to improve their leadership skill.
The important measures of experience were the number of projects led, which represents
an accumulation of experience over time, and experience breadth, which represents an exposure to
diverse leadership situations. Interestingly, the number of months leading and experience depth did
not moderate the effectiveness of training. In fact, they were trending negative (though not
significant) when controlling for number of projects led and experience breadth. This finding might
be signaling the presence of the ceiling effect. That is, leading more projects helps leaders develop
the mental schema necessary to benefit from training, but leading for greater lengths of time
simultaneously drive the inertial effects that make leaders unwilling to learn from training.
Similarly, exposure to a broad array of leadership situations helps leaders develop a readiness to
learn from training, but greater depth of experience simultaneously creates a rigidness that limits
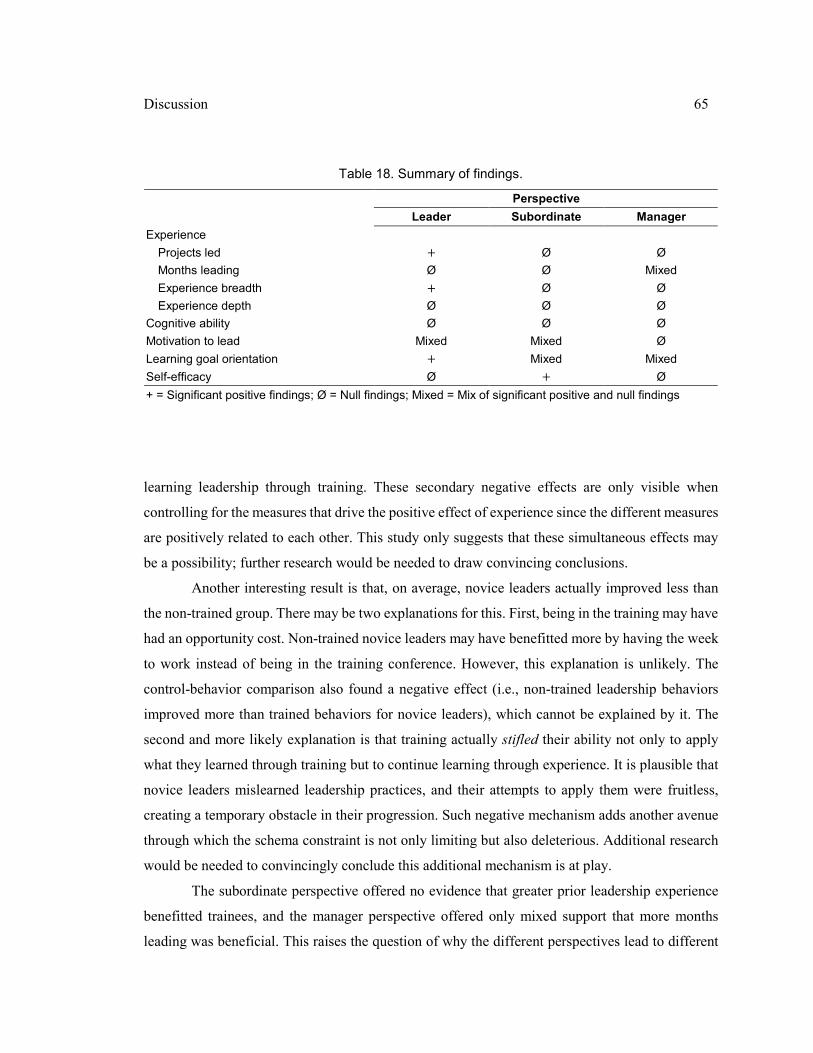
Discussion 65
learning leadership through training. These secondary negative effects are only visible when
controlling for the measures that drive the positive effect of experience since the different measures
are positively related to each other. This study only suggests that these simultaneous effects may
be a possibility; further research would be needed to draw convincing conclusions.
Another interesting result is that, on average, novice leaders actually improved less than
the non-trained group. There may be two explanations for this. First, being in the training may have
had an opportunity cost. Non-trained novice leaders may have benefitted more by having the week
to work instead of being in the training conference. However, this explanation is unlikely. The
control-behavior comparison also found a negative effect (i.e., non-trained leadership behaviors
improved more than trained behaviors for novice leaders), which cannot be explained by it. The
second and more likely explanation is that training actually stifled their ability not only to apply
what they learned through training but to continue learning through experience. It is plausible that
novice leaders mislearned leadership practices, and their attempts to apply them were fruitless,
creating a temporary obstacle in their progression. Such negative mechanism adds another avenue
through which the schema constraint is not only limiting but also deleterious. Additional research
would be needed to convincingly conclude this additional mechanism is at play.
The subordinate perspective offered no evidence that greater prior leadership experience
benefitted trainees, and the manager perspective offered only mixed support that more months
leading was beneficial. This raises the question of why the different perspectives lead to different
Table 18. Summary of findings.
Perspective
Leader Subordinate Manager
Experience
Projects led + Ø Ø
Months leading Ø Ø Mixed
Experience breadth + Ø Ø
Experience depth Ø Ø Ø
Cognitive ability Ø Ø Ø
Motivation to lead Mixed Mixed Ø
Learning goal orientation + Mixed Mixed
Self-efficacy Ø + Ø
+ = Significant positive findings; Ø = Null findings; Mixed = Mix of significant positive and null findings
Discussion 66
results. One immediate response may be that the leader self-reports were biased—leaders who were
trained simply responded positively after training as a type of self-enhancement bias. However, this
rejoinder is too simplistic and does not fit the results. Both the control behavior model and the fact
that the experiential effects are moderating effects make it implausible (see the detailed explanation
on page 51). Another response may be that the differences are simply driven by the differences in
which leaders appeared in the sample and the retrospective design of the manager survey. While
the differences in design cannot be ruled out, the differences in which leaders appeared in the
sample is an unlikely reason—at least as a full explanation. As described on page 57, even when
comparing the leaders common to both the self-rated and subordinate-rated samples, the
subordinate sample did not exhibit a positive moderating effect of experience as the leader sample
did. Substantial perspective differences appeared even after harmonizing the samples. The most
probable explanation for the differences is access to information. Leaders, who are aware of all
their attempts to improve their leadership abilities, can provide a more nuanced response to their
leadership behaviors. Subordinates work closely with leaders, but often for only brief periods.
Many projects only last two to five days before subordinates move on to new projects with new
leaders. In that time subordinates may only get a glimpse of the changes a leader makes over a five-
week window. Managers often do not work directly on projects with leaders, so their access to
information may be limited or filtered through others. The leadership training was brief, so large,
conspicuous changes were unlikely. Yet it could readily produce smaller changes more perceptible
to the leader or careful observers but beyond the purview of many subordinates and managers.
Other Important Individual Characteristics
Among the four individual characteristics tested—cognitive ability, motivation to lead, learning
goal orientation, and self-efficacy—only learning goal orientation provided fairly consistent
evidence of a moderating effect. The effect also appeared for all three perspectives, suggesting it is
one of the most robust and prominent individual factors to impact the effectiveness of training.
Because of their mastery orientation leaders with this characteristic fully engage in training and
apply what they learn in their project leadership. That trained leaders are able to improve faster
than non-trained leaders supports the notion that training is providing leaders with expert
knowledge or best-practices that are not available to them in their local domain in which on-the-
job learning occurs. This result strengthens existing goal orientation research, which has not
compared trainees to learners who only learn through on-the-job experience (e.g., Bell &
Kozlowski, 2002; Ford et al., 1998).

Discussion 67
There was mixed support for the hypothesis that leaders with greater motivation to lead
benefitted more from training. Interestingly, both leaders who led for instrumental reasons (i.e.,
calculative motivation) and those who enjoyed leading (i.e., affective motivation) benefitted from
training, even as leaders who were more instrumental were less likely to enjoy leading. Either
motivational path was beneficial, though, again, there was mixed support for both.
Contrary to expectations, leaders’ self-efficacy and cognitive ability did not impact the
effectiveness of training. Self-efficacy was significant as expected in the subordinate sample, but
the sample was too small to be too confident in the result. From the leader perspective pre-training
self-efficacy benefitted both the trained and non-trained leaders. This result has important
implications for prior findings on self-efficacy and training (e.g., Bell & Kozlowski, 2002;
Chiaburu & Marinova, 2005; Gist et al., 1991; Hughes et al., 2013; Tracey et al., 2001). While self-
efficacy may very well improve training outcomes, it is also beneficial for those learning through
on-the-job experience. Thus, there is little evidence that a trainee’s self-efficacy will impact the
usefulness of offering training to new leaders.
For cognitive ability, there was no evidence of any link to leaders who were trained or
leaders who were not trained. The lack of findings suggests a potential boundary condition on the
benefit of cognitive ability and training. While cognitive ability can be useful for training in
declarative or procedural knowledge domains (Colquitt et al., 2000; Ree & Earles, 1991), it appears
to have little impact on interpersonal knowledge domains.
Implications for Theory
This work advances our current understanding of organizational learning and training by
explicating the impact of prior experience on training effectiveness. By drawing on diverse
literatures in educational and cognitive psychology, training, and organizational theory, I reconcile
contrasting arguments for whether prior experience helps or hinders training outcomes. This is
accomplished by introducing two separate constraints—the schema constraint and the ceiling
constraint—that are always present but that are more or less likely to be the limiting factor for
different trainees depending on their incoming level of experience. The introduction of these
constraints into this framework is important because theoretical explanations for the timing of
training have been absent from the literature. The framework helps us understand when training
may be most beneficial given individuals’ levels of experience. It also creates new opportunities
for additional empirical work, such as testing the curvature and slope of the constraints and the
optimal levels of experience in different knowledge domains.

Discussion 68
The training literature has focused on a number individual characteristics, but experience
has not been a focus and rarely has it been conceptualized beyond tenure. This study adds prior
experience as an important individual characteristic to consider to understand training outcomes,
and it raises the importance of considering different conceptualizations of experience—both
measures of accumulated time and measures of breadth and depth of exposure—that can impact
training outcomes differently. Experience also proved more important than other individual
characteristics, including motivation to lead, cognitive ability, and self-efficacy. It is a fundamental
factor to training effectiveness that has been overlooked or taken for granted. This research suggests
much more care should be given to trainees’ experience when planning the timing of training.
The importance of experience as breadth of exposure highlights new connections with the
learning literature. I have argued that insufficient cognitive schema limits the learning novices can
acquire from training and found that broader exposure prior to training removes this limitation.
This finding aligns with work by Paas and Van Merriënboer (1994) and Schilling and colleagues
(2003) who found in their experiments that exposure to a variety of related situations helps develop
cognitive schema and improves learning. This work affirms the importance of related variety and
newly demonstrates that it is a valuable prerequisite for capitalizing on training outcomes. The
importance of the number of projects led highlights the importance of moving down the experience
curve somewhat before training. Moving down the experience curve is not just about gaining a
breadth of exposure, however, as both exposure breadth and projects led were influential when
controlling for the other. Leading projects may provide opportunities to fail or experience problems
that leaders do not have solutions for currently. Such leadership experience sets the foundation for
truly seeing solutions presented in training. Novice leaders with little project experience may not
have problems yet to be solved, and thus miss the solutions provided in training.
Also, there was some evidence that the opportunity to lead immediately following training
is vital. Opportunity has been recognized as an important variable in past research (Ford et al.,
1992; D. H. Lim & Johnson, 2002), but it has only been viewed as a direct antecedent for training
outcomes. In this study I found opportunity also moderates the impact of breadth of experience.
This heightens the importance of opportunity because a lack of it can override other characteristics
of the individual that would normally lead to a positive outcome. Moreover, it further highlights
the importance of inserting training strategically in a leader’s learning curve trajectory. The greatest
advances along the leadership learning curve occur when training occurs after some experience has
been acquired and followed up by ample opportunity to lead.

Discussion 69
Finally, the importance of learning goal orientation I find here adds to the groundswell of
interest in a growth mindset (a revised nomenclature for learning goal orientation) occurring in
education and business. Dweck’s work has entered the popular press (Dweck, 2007) and much
more emphasis is being placed on interventions to move people toward a learning goal orientation
(Heslin & VandeWalle, 2008). This study affirms the importance of a learning goal orientation.
The ability to instill such orientation could benefit organizations.
Implications for Practice
There are many situations in which organizations want to provide a single training to employees or
managers (e.g., new manager training), but training research has been silent as to when to provide
such training. This study indicates that training before any on-the-job experience is gained is apt to
be ineffective. Waiting until trainees have garnered some exposure through on-the-job experience
is beneficial.
This study supports the existing idea that needs analysis can help identify who would
benefit from training, but it also reveals an aspect of needs analysis that has not been emphasized
in the past. An important part of readiness for training is identifying the extent to which employees
have been exposed to situations that correspond to the training topic. In the case of leadership
training, a needs analysis could be improved by using the experience index in this study or one that
similarly measures breadth of leadership exposure. In project settings, training leaders could simply
ask about the number of projects led. Training leaders could also see how many months a person
has been leading, though such a measure likely less accurate concerning training readiness. HR
professionals could use this information to identify employees to invite to training.
Further, it is important that trainees be given the opportunity to use their training
immediately afterward. Human resource professionals are called to look beyond the training course
to ensure that trainees are poised to use their training. If insufficient opportunity exists, it is likely
better to delay training or to put forth effort to create opportunities for the trainees. Optimizing
training schedules to align with work assignments is ideal.
Limitations
This study was conducted over a 12-week period and focused on leadership skills developed
through classroom training in the context of a public accounting firm. Important boundary
conditions for the generalization of these findings include the knowledge domain, organizational

Discussion 70
context, training context, and time horizon. Leadership behaviors fall within the broader domain of
interpersonal skills, and the findings are most relevant within this domain. The theoretical
arguments can easily apply to other knowledge domains as well, but care should be taken when
making inferences to domains that are primarily declarative or procedural, which were not tested
here. The organizational context falls within the general category of professional services; it would
be useful to replicate this study in other contexts, such as manufacturing or research and
development. Also, the findings do not easily map onto organizational contexts where safety is the
primary concern (M. J. Burke et al., 2011), such as for pilots and doctors. In such cases, training is
deeply integrated with experiential learning, and the theory would need to be modified and
extended for such contexts.
This study focused on classroom-based training. Classroom training continues to be a
dominant form of training, but newer models of online, self-paced, and in-situ training exist. Future
tests could suggest the extent to which the experience-training interaction holds for these other
training contexts. The study also focused on short-term training effects of only several weeks. An
important extension to this study would be to map training effects over a longer period of time.
Existing meta-analyses have been unable to detect a significant increase or decrease in job
behaviors over time (Taylor et al., 2005). What is still unknown is whether training places a person
on a new trajectory or learning compared to those not trained or if untrained individuals eventually
catch up to trained individuals. Understanding how training impacts a person’s longer learning
curve is a rich area for future research.
The organizational setting did not allow me to randomize accountants into treatment and
control groups. However, I did work closely with PPA to identify the most likely causes that an
accountant would belong to a trained or untrained group and account for them in my analysis. Yet,
there is a possibility that other factors were present that I did not identify. Also, treated individuals
were not blind to receiving the treatment, which could inflate the findings. However, the inflation
would likely apply to all trained individuals, and my findings are based on the moderating effect of
prior experience and other individual characteristics. These design limitations are countered by the
richness of conducting the study in an organizational context. Still replicating these findings in a
full experimental setting would be beneficial.
Finally, I was not able to test the full extent of my theoretical argument because the sample
was truncated. I did not have a sufficient number of highly experienced individuals to identify the
negative effect of the proposed ceiling constraint. A future study that includes a broader range of
experience would be beneficial.
6. BIBLIOGRAPHY
Ackerman, P. L. (1988). Determinants of individual differences during skill acquisition: Cognitive abilities and information processing. Journal of Experimental Psychology:
General, 117(3), 288–318. doi:10.1037/0096-3445.117.3.288
Adler, P. S., & Clark, K. B. (1991). Behind the learning curve: A sketch of the learning process. Management Science, 37(3), 267–281. doi:10.1287/mnsc.37.3.267
Aguinis, H., & Kraiger, K. (2009). Benefits of training and development for individuals and teams, organizations, and society. Annual Review of Psychology, 60, 451–74. doi:10.1146/annurev.psych.60.110707.163505
Angrist, J. D., & Pischke, J.-S. (2009). Mostly Harmless Econometrics: An empiricist’s
companion. Princeton University Press.
Argote, L. (2013). Organizational Learning: Creating, Retaining and Transferring Knowledge (2nd ed.). New York: Springer. doi:10.1007/978-1-4614-5251-5
Bandura, A. (1977). Social Learning Theory. Englewood Cliffs, NJ: Prentice-Hall.
Bandura, A. (1986). Social Foundations of Thought and Action: A Social Cognitive Theory. Upper Saddle River, NJ: Prentice-Hall.
Bandura, A. (2006). Guide for constructing self-efficacy scales. In F. Pajares & T. Urdan (Eds.), Self-Efficacy Beliefs of Adolescents (pp. 307–337). Information Age Publishing.
Bapna, R., Langer, N., & Mehra, A. (2013). Human Capital Investments and Employee Performance: An Analysis of IT Services Industry. Management Science, 59(3), 641–658.
Barling, J., Weber, T., & Kelloway, E. K. (1996). Effects of transformational leadership training on attitudinal and financial outcomes: A field experiment. Journal of Applied Psychology, 81(6), 827–832. doi:10.1037//0021-9010.81.6.827
Bell, B. S., & Kozlowski, S. W. J. (2002). Adaptive Guidance: Enhancing Self-Regulation, Knowledge, and Performance in Technology-Based Training. Personnel Psychology, 55(2), 267–306.
Blume, B. D., Ford, J. K., Baldwin, T. T., & Huang, J. L. (2010). Transfer of Training: A Meta-Analytic Review. Journal of Management, 36(4), 1065–1105. doi:10.1177/0149206309352880
72
Bower, G. H., & Hilgard, E. R. (1981). Theories of Learning. Englewood Cliffs, NJ: Prentice-Hall.
Brett, J. F., & VandeWalle, D. (1999). Goal orientation and goal content as predictors of performance in a training program. Journal of Applied Psychology, 6, 863–873. doi:10.1037/0021-9010.84.6.863
Brown, K. G. (2001). Using computers to deliver training: Which employees learn and why? Personnel Psychology, 54(2), 271–296.
Burke, L. A., & Hutchins, H. M. (2007). Training Transfer: An Integrative Literature Review. Human Resource Development Review, 6(3), 263–296. doi:10.1177/1534484307303035
Burke, M. J., Salvador, R. O., Smith-Crowe, K., Chan-Serafin, S., Smith, A., & Sonesh, S. (2011). The dread factor: how hazards and safety training influence learning and performance. The Journal of Applied Psychology, 96(1), 46–70. doi:10.1037/a0021838
Burnaska, R. (1976). The effects of behavior modeling training upon managers’ behaviors and employees' perceptions. Personnel Psychology, 29, 329–335. doi:10.1111/j.1744-6570.1976.tb00416.x
Button, S., Mathieu, J., & Zajac, D. (1996). Goal orientation in organizational research: A conceptual and empirical foundation. Organizational Behavior and Human Decision
Processes, 67(1), 26–48. doi:10.1006/obhd.1996.0063
Chan, K.-Y., & Drasgow, F. (2001). Toward a theory of individual differences and leadership: understanding the motivation to lead. Journal of Applied Psychology, 86(3), 481–498. doi:10.1037/0021-9010.86.3.481
Chao, G. T. (1997). Mentoring phases and outcomes. Journal of Vocational Behavior, 51(1), 15–28. doi:10.1006/jvbe.1997.1591
Chi, M. T. H., Feltovich, P. J., & Glaser, R. (1981). Categorization and representation of physics problems by experts and novices. Cognitive Science, 5, 121–152. doi:10.1207/s15516709cog0502_2
Chiaburu, D. S., & Marinova, S. V. (2005). What predicts skill transfer? An exploratory study of goal orientation, training self-efficacy and organizational supports. International Journal of
Training and Development, 9(2), 110–123. doi:10.1111/j.1468-2419.2005.00225.x
Cohen, W. M., & Levinthal, D. A. (1990). Absorptive Capacity: A New Perspective on Learning and Innovation. Administrative Science Quarterly, 35(1), 128–152.
Collins, D., & Holton, E. (2004). The effectiveness of managerial leadership development programs: A meta‐analysis of studies from 1982 to 2001. Human Resource Development
Quarterly, 15(2), 217–248. doi:10.1002/hrdq.1099
73
Colquitt, J. A., LePine, J. A., & Noe, R. A. (2000). Toward an integrative theory of training motivation: A meta-analytic path analysis of 20 years of research. Journal of Applied
Psychology, 85(5), 678–707.
Colquitt, J. A., & Simmering, M. J. (1998). Conscientiousness, goal orientation, and motivation to learn during the learning process: A longitudinal study. Journal of Applied Psychology, 83(4), 654–665.
Coyle, T. R., & Pillow, D. R. (2008). SAT and ACT predict college GPA after removing g. Intelligence, 36(6), 719–729. doi:10.1016/j.intell.2008.05.001
Craig, R. L. (Ed.). (1996). The ASTD training and development handbook: A guide to human
resource development. New York: McGraw-Hill.
Cyert, R. M., & March, J. G. (1963). A Behavioral Theory of the Firm. Prentice-Hall.
Darr, E., Argote, L., & Epple, D. (1995). The acquisition, transfer, and depreciation of knowledge in service organizations: Productivity in franchises. Management Science, 41(11), 1750–1762. doi:10.1287/mnsc.41.11.1750
Deci, E. L. (1992). The relation of interest to the motivation of behavior: A self-determination thoery perspective. In K. A. Renninger, S. Hidi, & A. Krapp (Eds.), The Role of Interest in
Learning and Development (pp. 43–70). Hillsdale, NJ: Lawrence Earlbaum Associates.
Deci, E. L., & Ryan, R. M. (1985). Intrinsic Motivation and Self-Determination in Human
Behavior. New York: Plenum.
Deci, E. L., & Ryan, R. M. (1991). A motivational approach to self: Integration in personality. In Perspectives on Motivation: Nebraska Symposium on Motivation, 1990 (Vol. 38, pp. 237–288). Lincoln, NB: University of Nebraska Press.
DeRouin, R. E., Fritzsche, B. a., & Salas, E. (2004). Optimizing e-learning: Research-based guidelines for learner-controlled training. Human Resource Management, 43(2-3), 147–162. doi:10.1002/hrm.20012
Dragoni, L., Tesluk, P. E., Russell, J. E. A., & Oh, I.-S. (2009). Understanding managerial development: Integrating developmental assignments, learning orientation, and access to developmental opportunities in predicting. Academy of Management Journal, 52(4), 731–743. doi:10.5465/AMJ.2009.43669936
Dvir, T., Eden, D., Avolio, B., & Shamir, B. (2002). Impact of transformational leadership on follower development and performance: A field experiment. Academy of Management
Journal, 45(4), 735–744. doi:10.2307/3069307
Dweck, C. S. (1986). Motivational processes affecting learning. American Psychologist, 41(10), 1040–1048.
Dweck, C. S. (2007). Mindset: The new psychology of success. New York: Random House.
74
Dweck, C. S., & Leggett, E. L. (1988). A social-cognitive approach to motivation and personality. Psychological Review, 95(2), 256–273. doi:10.1037//0033-295X.95.2.256
Dyer, J., Gregersen, H., & Christensen, C. M. (2011). The Innovator’s DNA. Harvard Business Review Press.
Earley, P. C. (1987). Intercultural training for managers: A comparison of documentary and interpersonal methods. Academy of Management Journal, 30(4), 685–698. doi:10.2307/256155
Ericsson, K. A., Krampe, R. T., & Tesch-Römer, C. (1993). The role of deliberate practice in the acquisition of expert performance. Psychological Review, 100(3), 363–406. doi:10.1037/0033-295X.100.3.363
Evans, M. G. (1985). A Monte Carlo study of the effects of correlated method variance in moderated multiple regression analysis. Organizational Behavior and Human Decision
Processes, 36(3), 305–323. doi:10.1016/0749-5978(85)90002-0
Ford, J. K., Quiñones, M. A., Sego, D. J., & Sorra, J. S. (1992). Factors affecting the opportunity to perform trained tasks on the job. Personnel Psychology, 45, 511–528. Retrieved from http://onlinelibrary.wiley.com/doi/10.1111/j.1744-6570.1992.tb00858.x/full
Ford, J. K., Smith, E. M., Weissbein, D. a., Gully, S. M., & Salas, E. (1998). Relationships of goal orientation, metacognitive activity, and practice strategies with learning outcomes and transfer. Journal of Applied Psychology, 83(2), 218–233. doi:10.1037//0021-9010.83.2.218
Frayne, C. A., & Geringer, J. M. (2000). Self-management training for improving job performance: A field experiment involving salespeople. Journal of Applied Psychology, 85(3), 361–372. doi:10.1037//0021-9010.85.3.361
Gavetti, G., & Levinthal, D. A. (2000). Looking forward and looking backward: Cognitive and experiential search. Administrative Science Quarterly, 45(1), 113–137. doi:10.2307/2666981
Gist, M., Stevens, C., & Bavetta, A. (1991). Effects of self-efficacy and post-training intervention on the acquisition and maintenance of complex interpersonal skills. Personnel Psychology, 44, 837–861. doi:10.1111/j.1744-6570.1991.tb00701.x
Goldberg, L. R. (2014). International Personality Item Pool: A scientific collaboratory for the development of advanced measures of personality traits and other individual differences. Retrieved from www.ipip.org
Halpin, A. W., & Winer, B. J. (1957). A factorial study of the leader behavior descriptions. In M. Stogdill & A. E. Coons (Eds.), Leader behavior: Its description and measurement (pp. 39–51). Columbus, OH: The Ohio State University, Bureau of Business Research.
75
Hand, H. H., & Slocum, J. W. (1972). A longitudinal study of the effects of a human relations training program on managerial effectiveness. Journal of Applied Psychology, 56(5), 412–417. doi:10.1037/h0033592
Heslin, P. a., & VandeWalle, D. (2008). Managers’ implicit assumptions about personnel. Current Directions in Psychological Science, 17(3), 219–223. doi:10.1111/j.1467-8721.2008.00578.x
Hidi, S. (2000). An interest researcher’s perspective: The effects of extrinsic and intrinsic factors on motivation. In C. Sansone & J. Harackiewicz (Eds.), Intrinsic and Extrinsic Motivation:
The Search for Optimal Motivation and Performance (pp. 311–342). San Diego, CA: Academic Press.
House, R. J., Hanges, P. J., Javidan, M., Dorfman, P. W., & Gupta, V. (2004). Culture,
leadership, and organizations. Thousand Oaks, CA: Sage Publications.
Huber, G. P. (1991). Organizational Learning: The Contributing Processes and the Literatures. Organization Science, 2(1), 88–115. doi:10.1287/orsc.2.1.88
Hughes, M. G., Day, E. A., Wang, X., Schuelke, M. J., Arsenault, M. L., Harkrider, L. N., & Cooper, O. D. (2013). Learner-controlled practice difficulty in the training of a complex task: cognitive and motivational mechanisms. The Journal of Applied Psychology, 98(1), 80–98. doi:10.1037/a0029821
Hunter, J. E. (1986). Cognitive ability, cognitive aptitudes, job knowledge, and job performance. Journal of Vocational Behavior, 362, 340–362. doi:10.1016/0001-8791(86)90013-8
Janson, A., & McQueen, R. J. (2007). Capturing leadership tacit knowledge in conversations with leaders. Leadership & Organization Development Journal, 28(7), 646–663. doi:10.1108/01437730710823897
Janssen, O., & Van Yperen, N. W. (2004). Employees’ Goal Orientations, the Quality of Leader-Member Exchange, and the Outcomes of Job Performance and Job Satisfaction. Academy of
Management Journal, 47(3), 368–384. doi:10.2307/20159587
Jentsch, F., Bowers, C., & Salas, E. (2001). What Determines Whether Observers Recognize Targeted Behaviors in Modeling Displays? Human Factors, 43(3), 496–507. doi:10.1518/001872001775898278
Johnson, J. A. (2005). Ascertaining the validity of individual protocols from Web-based personality inventories. Journal of Research in Personality, 39(February), 103–129. doi:10.1016/j.jrp.2004.09.009
Judge, T. A., Colbert, A. E., & Ilies, R. (2004). Intelligence and leadership: A quantitative review and test of theoretical propositions. Journal of Applied Psychology, 89(3), 542–52. doi:10.1037/0021-9010.89.3.542

76
Judge, T. A., Jackson, C. L., Shaw, J. C., Scott, B. A., & Rich, B. L. (2007). Self-efficacy and work-related performance: the integral role of individual differences. Journal of Applied
Psychology, 92(1), 107–27. doi:10.1037/0021-9010.92.1.107
Just, M., & Carpenter, P. (1992). A capacity theory of comprehension: Individual differences in working memory. Psychological Review, 99(1), 122–149. doi:10.1037/0033-295X.99.1.122
Kanfer, R. (1990). Motivation Theory and Industrial and Organizational Psychology. In M. D. Dunnette & L. M. Hough (Eds.), Handbook of industrial and organizational psychology (Vol. 1, pp. 75–170). Palo Alto, CA: Consulting Psychologists Press.
Kanfer, R., & Ackerman, P. L. (1989). Motivation and cognitive abilities: An integrative/aptitude-treatment interaction approach to skill acquisition. Journal of Applied
Psychology, 74(4), 657–690. doi:10.1037//0021-9010.74.4.657
Kickul, J., & Neuman, G. (2000). Emergent leadership behaviors: The function of personality and cognitive ability in determining teamwork performance and KSAs. Journal of Business and
Psychology, 15(1), 27–51. doi:10.1023/A:1007714801558
Klein, H. J., Noe, R. a., & Wang, C. (2006). Motivation To Learn and Course Outcomes: the Impact of Delivery Mode, Learning Goal Orientation, and Perceived Barriers and Enablers. Personnel Psychology, 59(3), 665–702. doi:10.1111/j.1744-6570.2006.00050.x
Knowles, M. S. (1996). Adult learning. In R. L. Craig (Ed.), The ASTD training and development
handbook: A guide to human resource development (pp. 253–265). New York: McGraw-Hill.
Koenig, K. A., Frey, M. C., & Detterman, D. K. (2008). ACT and general cognitive ability. Intelligence, 36(2), 153–160. doi:10.1016/j.intell.2007.03.005
Kolb, D. A. (2014). Experiential learning: Experience as the source of learning and development (2nd ed.). FT Press.
Kraiger, K., Ford, J., & Salas, E. (1993). Application of cognitive, skill-based, and affective theories of learning outcomes to new methods of training evaluation. Journal of Applied
Psychology, 78(2), 311–328. doi:10.1037//0021-9010.78.2.311
Kram, K. E., & Isabella, L. A. (1985). Mentoring Alternatives: the Role of Peer Relationships in Career Development. Academy of Management Journal, 28(1), 110–132. doi:10.2307/256064
Kyllonen, P., & Woltz, D. (1989). Role of cognitive factors in the acquisition of cognitive skill. In R. Kanfer, P. L. Ackerman, & R. Cudeck (Eds.), Abilities, Motivation, and Methodology:
The Minnesota Symposium on Learning and Individual Differences. Hillsdale, NJ: Lawrence Earlbaum Associates.

77
Latham, G. P., & Saari, L. M. (1979). Application of social-learning theory to training supervisors through behavioral modeling. Journal of Applied Psychology, 64(3), 239–246. doi:10.1037//0021-9010.64.3.239
Lave, J., & Wenger, E. (1991). Situated Learning: Legitimate Peripheral Participation. New York: Cambridge University Press.
Levitt, B., & March, J. G. (1988). Organizational learning. Annual Review of Sociology, 14, 319–340. doi:10.1146/annurev.so.14.080188.001535
Lim, B.-C. (2006). Assessing the convergent and discriminant validity of Goldberg’s International Personality Item Pool: A multitrait-multimethod examination. Organizational
Research Methods, 9(1), 29–54. doi:10.1177/1094428105283193
Lim, D. H., & Johnson, S. D. (2002). Trainee perceptions of factors that influence learning transfer. International Journal of Training and Development, 6(1), 36–48. doi:10.1111/1468-2419.00148
Lindsay, P. H., & Norman, D. A. (1977). Human Information Processing. Orlando, FL: Academic Press.
Mathieu, J., & Leonard, R. (1987). Applying utility concepts to a training program in supervisory skills: A time-based approach. Academy of Management Journal, 30(2), 316–335. doi:10.2307/256277
McNeese-Smith, D. K. (1999). The relationship between managerial motivation, leadership, nurse outcomes and patient satisfaction. Journal of Organizational Behavior, 20(2), 243–259. doi:10.1002/(SICI)1099-1379(199903)20:2<243::AID-JOB888>3.0.CO;2-2
Meade, A. W., & Craig, S. B. (2012). Identifying careless responses in survey data. Psychological Methods, 17, 437–455. doi:10.1037/a0028085
Miner, A. S., Bassoff, P., & Moorman, C. (2001). Organizational and Improvisation Learning : A Field Study. Administrative Science Quarterly, 46(2), 304–337. doi:10.2307/2667089
Morrow, C., Jarrett, M., & Rupinski, M. (1997). An investigation of the effect and economic utility of corporate-wide training. Personnel Psychology, 50, 91–119. doi:10.1111/j.1744-6570.1997.tb00902.x
Nickerson, J., & Zenger, T. (2004). A knowledge-based theory of the firm—The problem-solving perspective. Organization Science, 15(6), 617–632. doi:10.1287/orsc.1040.0093
Noe, R. A., & Schmitt, N. (1986). The Influence of Trainee Attitudes on Training Effectiveness: Test of a Model. Personnel Psychology, 39(3), 497–523. doi:10.1111/j.1744-6570.1986.tb00950.x

78
Paas, F., Renkl, A., & Sweller, J. (2003). Cognitive Load Theory and Instructional Design: Recent Developments. Educational Psychologist, 38(1), 1–4. doi:10.1207/S15326985EP3801_1
Paas, F., & Van Merriënboer, J. J. G. (1994). Variability of worked examples and transfer of geometrical problem-solving skills: A cognitive-load approach. Journal of Educational
Psychology, 86(1), 122–133. doi:10.1037/0022-0663.86.1.122
Payne, S. C., Youngcourt, S. S., & Beaubien, J. M. (2007). A meta-analytic examination of the goal orientation nomological net. The Journal of Applied Psychology, 92(1), 128–50. doi:10.1037/0021-9010.92.1.128
Podsakoff, P. M., MacKenzie, S. B., Lee, J.-Y., & Podsakoff, N. P. (2003). Common method biases in behavioral research: a critical review of the literature and recommended remedies. Journal of Applied Psychology, 88(5), 879–903. doi:10.1037/0021-9010.88.5.879
Ree, M., & Earles, J. (1991). Predicting training success: Not much more than g. Personnel
Psychology, 44, 321–332. doi:10.1111/j.1744-6570.1991.tb00961.x
Ryan, R. M., & Deci, E. L. (2000). Self-determination theory and the facilitation of intrinsic motivation, social development, and well-being. The American Psychologist, 55(1), 68–78. doi:10.1037/0003-066X.55.1.68
Salas, E., & Cannon-bowers, J. A. (2001). The science of training: A decade of progress. Annual
Review of Psychology, 60, 451–474. doi:10.1146/annurev.psych.52.1.471
Schilling, M. A., Vidal, P., Ployhart, R. E., & Marangoni, A. (2003). Learning by doing something else: Variation, relatedness, and the learning curve. Management Science, 49(1), 39–56. doi:10.1287/mnsc.49.1.39.12750
Schmidt, A. M., & Ford, J. K. (2003). Learning within a learner control training environment: The interactive effects of goal orientation and metacognitive instruction on learning outcomes. Personnel Psychology, 56(2), 405–429. doi:10.1111/j.1744-6570.2003.tb00156.x
Schnotz, W., & Kürschner, C. (2007). A Reconsideration of Cognitive Load Theory. Educational
Psychology Review, 19(4), 469–508. doi:10.1007/s10648-007-9053-4
Shadish, W. R., Cook, T. D., & Campbell, D. T. (2002). Experimental and Quasi-Experimental
Designs for Generalized Causal Inference. Belmont, CA: Wadsworth Cengage Learning.
Siemsen, E., Roth, A., & Oliveira, P. (2010). Common Method Bias in Regression Models With Linear, Quadratic, and Interaction Effects. Organizational Research Methods, 13(3), 456–476. doi:10.1177/1094428109351241
Sleight, D. A. (1993). A Developmental History of Training in the United States and Europe. Retrieved from https://www.msu.edu/~sleightd/trainhst.html
79
Sorcher, M., & Spence, R. (1982). The Interface Project: Behavior Modeling As Social Technology in South Africa. Personnel Psychology, 35(3), 557–581. doi:10.1111/j.1744-6570.1982.tb02210.x
Stajkovic, A. D., & Luthans, F. (1998). Self-efficacy and work-related performance: A meta-analysis. Psychological Bulletin, 124(2), 240–261. doi:10.1037//0033-2909.124.2.240
Sweller, J. (1988). Cognitive load during problem solving: Effects on learning. Cognitive Science, 12(2), 257–285. doi:10.1016/0364-0213(88)90023-7
Sweller, J. (2011). Cognitive Load Theory. In J. P. Mestre & B. H. Ross (Eds.), The Psychology
of learning and Motivation: Cognition in Education (Vol. 55). Academic Press.
Taylor, P. J. (1998). A new integrated framework for training needs analysis. Human Resource
Management Journal, 8(2), 29–50. doi:10.1111/j.1748-8583.1998.tb00165.x
Taylor, P. J., Russ-Eft, D. F., & Chan, D. W. L. (2005). A meta-analytic review of behavior modeling training. The Journal of Applied Psychology, 90(4), 692–709. doi:10.1037/0021-9010.90.4.692
Taylor, P. J., Russ-Eft, D. F., & Taylor, H. (2009). Transfer of management training from alternative perspectives. The Journal of Applied Psychology, 94(1), 104–21. doi:10.1037/a0013006
Tews, M., & Tracey, J. (2008). An empirical examination of posttraining on-the-job supplements for enhancing the effectiveness of interpersonal skills training. Personnel Psychology, 61, 375–401. doi:10.1111/j.1744-6570.2008.00117.x
Tracey, J. B., Hinkin, T. R., Tannenbaum, S., & Mathieu, J. E. (2001). The influence of individual characteristics and the work environment on varying levels of training outcomes. Human Resource Development Quarterly, 12(1), 5–23. doi:10.1002/1532-1096(200101/02)12:1<5::AID-HRDQ2>3.0.CO;2-J
Tuovinen, J. E., & Sweller, J. (1999). A comparison of cognitive load associated with discovery learning and worked examples. Journal of Educational Psychology, 91(2), 334–341. doi:10.1037//0022-0663.91.2.334
Van Gog, T., & Rummel, N. (2010). Example-Based Learning: Integrating Cognitive and Social-Cognitive Research Perspectives. Educational Psychology Review, 22(2), 155–174. doi:10.1007/s10648-010-9134-7
Van Merriënboer, J. J. G., & Sweller, J. (2005). Cognitive Load Theory and Complex Learning:
Recent Developments and Future Directions. Educational Psychology Review (Vol. 17). doi:10.1007/s10648-005-3951-0
VandeWalle, D., Brown, S. P., Cron, W. L., & Slocum, J. W. . J. (1999). The influence of goal orientation and self-regulation tactics on sales performance: A longitudinal field test. Journal of Applied Psychology, 84(2), 249–259. doi:10.1037//0021-9010.84.2.249

80
Vroom, V. H. (1964). Work and Motivation. New York: Wiley.
Wexley, K. N., & Nemeroff, W. F. (1975). Effectiveness of positive reinforcement and goal setting as methods of management development. Journal of Applied Psychology, 60(4), 446–450. doi:10.1037/h0076912
Yarnall, J. (1998). Line managers as career developers: rhetoric or reality? Personnel Review, 27(5), 378–395. doi:10.1108/00483489810230325
Yukl, G., Gordon, A., & Taber, T. (2002). A hierarchical taxonomy of leadership behavior: Integrating a half century of behavior research. Journal of Leadership & Organizational
Studies, 9(1), 15–32.

81
7. APPENDIX A: SURVEY ITEMS
Items may belong to one of three different surveys: (1) senior associate survey, (2) subordinate survey, or (3) manager survey. Senior associates are the primary subjects under investigation. Subordinates and managers provide information about the senior associates. Some items will only be asked in the Time 1 survey. Others will be asked in the Time 1, 2, & 3 surveys. Some items are crossed out because pretesting showed that they do not load well with the other items.
Big Five: Agreeableness (AGREE)
International Personality Item Pool 10-item measure for agreeableness (Goldberg, 2014). The IPIP appears to replicate NEO-FFI well (B.-C. Lim, 2006). Survey: Subordinate, Time 1 Prompt: Describe yourself as you generally are now, not as you wish to be in the future. Describe yourself as you honestly see yourself. Indicate the accuracy of each of the following statements. Scale: 1 = Very inaccurate, 2 = Moderately inaccurate, 3 = Neither accurate nor inaccurate, 4 = Moderately accurate, or 5 = Very accurate. AGREE.01 Am interested in people. AGREE.02 Am not really interested in others. (R) AGREE.03 Sympathize with others' feelings. AGREE.04 Am not interested in other people's problems. (R) AGREE.05 Take time out for others. AGREE.06 Feel little concern for others. (R) AGREE.07 Feel others' emotions. AGREE.08 Make people feel at ease.
Big Five: Conscientiousness (CONSC)
International Personality Item Pool 10-item measure for conscientiousness (Goldberg, 2014). CONSC.09 is substituted in from the 20-item measure. Survey: Senior Associate, Time 1 Prompt: See Big Five: Agreeableness Scale: See Big Five: Agreeableness CONSC.01 Am always prepared. CONSC.04 Pay attention to details. CONSC.07 Waste my time. (R) CONSC.09 Finish what I start. [Replaces “Get chores done right away”] CONSC.10 Shirk my duties. (R)
82
CONSC.13 Carry out my plans. CONSC.15 Find it difficult to get down to work. (R) CONSC.18 Do just enough work to get by. (R) CONSC.21 Make plans and stick to them. CONSC.24 Don't see things through. (R)
Big Five: Extraversion (EXTRA)
International Personality Item Pool 10-item measure that mimics the NEO extraversion domain (Goldberg, 2014). Survey: Senior Associate, Time 1 Prompt: See Big Five: Agreeableness. Scale: See Big Five: Agreeableness. EXTRA.03 Feel comfortable around people. EXTRA.06 Have little to say. (R) EXTRA.12 Don't like to draw attention to myself. (R) EXTRA.14 Am skilled in handling social situations. EXTRA.17 Keep in the background. (R) EXTRA.20 Am the life of the party. EXTRA.23 Don't talk a lot. (R) EXTRA.26 Know how to captivate people.
Big Five: Openness to Experience (OPNEX)
International Personality Item Pool 10-item measure that mimics the NEO openness to experience domain (Goldberg, 2014). Survey: Senior Associate, Time 1 Prompt: See Big Five: Agreeableness. Scale: See Big Five: Agreeableness. OPNEX.02 Believe in the importance of art. OPNEX.05 Avoid philosophical discussions. (R) OPNEX.08 Am not interested in abstract ideas. (R) OPNEX.11 Have a vivid imagination. OPNEX.16 Carry the conversation to a higher level. OPNEX.19 Enjoy hearing new ideas. OPNEX.22 Do not like art. (R) OPNEX.25 Am not interested in theoretical discussions. (R)
Experience 1 (EXPR1)
Tax, audit, and leadership experience. New measure.
83
Survey: Senior Associate, Time 1 Prompt: Please share information about your tax and audit experience. Scale: Numeric EXPR1A.01 Since joining CLA, what percentage of your work has been audit/assurance
work? EXPR1A.02 Since joining CLA, what percentage of your work has been tax work? EXPR1A.03 Since joining CLA, what percentage of your work has been work in other areas? EXPR1B.01 Over the last year, how many audit projects have you led as the in charge? EXPR1B.02 Over the last year, how many tax projects have you led as the in charge? EXPR1C.01 How many months of experience do you have leading audit projects? EXPR1C.02 How many months experience do you have leading tax projects? EXPR1D.01 How many months of experience do you have leading others in organizations
other than CLA? EXPR1D.02 About how many people do/did you manage in the other organization?
Experience 2 (EXPR2)
Incidents of leadership exposure; both breadth and depth. New measure. Survey: Senior Associate, Time 1 Prompt: Below are some situations leaders may face as they manage the staff on their teams. Please mark all the situations you have experienced as a leader, either as a project leader in CLA or as a leader outside of CLA. Scale: Checkbox: Experienced within CLA; Experienced outside of CLA EXPR2A.01 Dealt with staff lacking interpersonal skills. EXPR2A.02 Managed staff lacking requisite job skills. EXPR2A.03 Managed unmotivated staff . EXPR2A.04 Managed conflict between staff . EXPR2A.05 Dealt with a staff member’s major mistake. EXPR2A.06 Provided feedback to staff with poor performance. EXPR2A.07 Worked on a development plan with a staff member. EXPR2A.08 Helped a staff member gain an important new experience. EXPR2A.09 Taught a staff member a new skill. Prompt: You marked that you have experienced each of the following scenarios. What amount of experience do you have with each? Scale: 1 = Very little, 2 = Little, 3 = Moderate, 4 = Great, 5 = Very great EXPR2B.01 Dealt with staff lacking interpersonal skills. EXPR2B.02 Managed staff lacking requisite job skills. EXPR2B.03 Managed unmotivated staff . EXPR2B.04 Managed conflict between staff . EXPR2B.05 Dealt with a staff member’s major mistake. EXPR2B.06 Provided feedback to staff with poor performance. EXPR2B.07 Worked on a development plan with a staff member. EXPR2B.08 Helped a staff member gain an important new experience. EXPR2B.09 Taught a staff member a new skill.
84
Cognitive Ability (COGAB)
General cognitive ability, as measured by SAT or ACT score. Survey: Senior Associate, Time 1 Prompt: What was your SAT or ACT score? If you do not remember, please make your best estimate. Scale: Numeric COGAB.SAT SAT score (out of 2400). COGAB.ACT ACT score (out of 36).
Learning Goal Orientation (GOLRN)
Measures of performance goal orientation and learning goal orientation are taken directly from Button, Mathieu, and Zajac (1996). Survey: Senior Associate, Time 1 Prompt: Please indicate the how much you agree that the following statements describe you. Scale: 1 = Strongly disagree, 4 = Neither agree nor disagree, 7 = Strongly Agree. GOLRN.01 The opportunity to do challenging work is important to me. GOLRN.02 When I fail to complete a difficult task, I plan to try harder the next time I work on
it. GOLRN.03 I prefer to work on tasks that force me to learn new things. GOLRN.04 The opportunity to learn new things is important to me. GOLRN.05 I do my best when I’m working on a fairly difficult task. GOLRN.06 I try hard to improve on my past performance. GOLRN.07 The opportunity to extend the range of my abilities is important to me. GOLRN.08 When I have difficulty solving a problem, I enjoy trying different approaches to
see which one will work.
Leadership Behaviors: Manager Rating
Measure the leadership performance based on supervisor perception. Survey: Manager (Coach) Prompt: Think about the leadership demonstrated by [project lead] over the last three months (over the summer). First, think back before the summer: to what extent did [project lead] do the following things? Second, to what extent has [project lead] improved or declined in these areas since before the summer? Scale 1: 1 = None, 2 = Small extent, 3 = Moderate extent, 4 = Great extent, 5 = Very great extent, 6 = Don’t know [PST scale] Scale 2: 1 = Declined greatly, 2 = Declined moderately, 3 = Declined slightly, 4 = About the same, 5 = Improved slightly, 6 = Improved moderately, 7 = Improved greatly, 8 = Don’t know [CHG scale]

85
[PST/CHG]COB Clarifying roles: Assign specific tasks, explain job responsibilities, and clearly communicate objectives, deadlines and performance expectations.
[PST/CHG]MOP Monitoring operations: Request updates and thoroughly review tasks, monitor progress toward deadlines, and evaluate performance of project staff.
[PST/CHG]STP Short-term planning: Create detailed schedules, plans, and contingencies to use people and resources efficiently.
[PST/CHG]SUP Supporting: Act considerately, show sympathy and support, and provide encouragement to project staff.
[PST/CHG]EPW Empowering: Allow staff discretion in their work, trust staff to solve problems on their own, and allow others to make decisions without prior approval.
[PST/CHG]RCG Recognizing: Provide praise for good performance and recognize staff for special contributions or significant achievements.
[PST/CHG]DVL Developing: Provide coaching and new opportunities or challenging assignments to help project staff develop.
[PST/CHG]CRC Correcting: Provide helpful directions and constructive feedback for correcting mistakes; use an appropriate tone when giving feedback.
Coach Confidence
Measure of coach’s confidence in responses. Survey: Manager (Coach) Prompt: To what extent have you observed (directly or indirectly) the performance of [project lead]? Scale 1: 1 = None, 2 = Small extent, 3 = Moderate extent, 4 = Great extent, 5 = Very great extent Prompt: How confident are you in your evaluation of [project lead]? Scale 1: 1 = Not confident at all, 2, 3 = Somewhat confident, 4, 5 = Very confident
Leadership Behaviors: Self-Rating
New scale items based on eight leadership behavior categories developed by Yukl, Gordon, and Taber (2002). Survey: Senior Associate Survey, Time 1, 2, & 3 Prompt: The following actions relate to leading tax and audit projects. Think about your actions in your leadership roles over the last five weeks. To what extent did you do following things? Scale: 1 = None, 2 = Little, 3 = Some, 4 = A lot, 5 = Great extent, 6 = Not applicable See Leadership Behaviors: Subordinate Rating for items.
Leadership Behaviors: Subordinate Rating
Survey: Subordinate Survey, Time 1, 2, & 3. Prompt: The following actions relate to leading tax and audit projects. Think about the actions of [project lead] over the last five weeks. Based on your observations, to what extent does [project lead] do the following things?

86
Scale: 1 = None, 2 = Small extent, 3 = Moderate extent, 4 = Great extent, 5 = Very great extent, 6 = Not applicable Clarifying Roles
LBCOB.01 Assign specific tasks to specific individuals. LBCOB.02 Explain job responsibilities LBCOB.03 Communicate a clear understanding of objectives. LBCOB.04 Clearly communicate deadlines and performance expectations. Monitoring Operations
LBMOP.01 Request updates on the status of tasks LBMOP.02 Thoroughly review the quality of completed tasks LBMOP.03 Monitor progress toward hitting deadlines LBMOP.04 Evaluate the performance of team members Short-term Planning LBSTP.01 Identify the right people needed for projects LBSTP.02 Create a detailed schedule for project tasks LBSTP.03 Create plans to use people and resources efficiently LBSTP.04 Plan contingencies ahead of time for possible problems Supporting
LBSUP.01 Act considerately toward others LBSUP.02 Show sympathy or support when someone is upset or anxious LBSUP.03 Provide encouragement in difficult or stressful tasks LBSUP.04 Show patience towards others Empowering
LBEPW.01 Allow others discretion in their work activities LBEPW.02 Trust people to solve problems on their own LBEPW.03 Allow others to make decisions without asking for approval LBEPW.04 Give others substantial responsibility over their work Recognizing
LBRCG.01 Provide praise for good performance LBRCG.02 Recognize others for significant achievements LBRCG.03 Show gratitude for special contributions LBRCG.04 Point out performance improvements Developing
LBDVL.01 Provide coaching on difficult or new tasks LBDVL.02 Provide opportunities and work assignments to develop skills LBDVL.03 Instruct staff to help them learn to improve their skills LBDVL.04 Give new or more challenging assignments to help staff grow Correcting
LBCRC.01 Provide helpful directions for correcting mistakes LBCRC.02 Avoid blaming when staff make errors LBCRC.03 Offer constructive feedback for improvement
87
LBCRC.04 Use a positive tone when giving correction
Learning (LEARN)
Main take-aways of training participant. Survey: Post training feedback Scale: Free text. LEARN.01 What are the main points that you learned from the training? LEARN.02 What do you expect to do differently when you return to work?
Motivation to Lead
Subset of 13 items from Chan and Drasgo’s (2001) motivation to lead scale. I do not use the social-normative motivation to lead dimension. Changed instances of “group” to “team.” Added “career” MTLCA.02. Changed MTLCA.04 from “rewards” to “recognition.” Changed MTLCA.06 from “more privileges” to “career rewards.” Survey: Senior Associate, Time 1 Prompt: Please indicate how much you agree or disagree with the following statements. Scale: 1=Strongly disagree, 4=Neither agree or disagree, 7=Strongly agree. Affective Motivation to Lead (MTLAF)
MTLAF.01 Most of the time, I prefer being a leader rather than a follower when working in a team.
MTLAF.03 I am the type of person who is not interested in leading others. (R) MTLAF.05 I am definitely not a leader by nature. (R) MTLAF.07 I am the type of person who likes to be in charge of others. MTLAF.09 I usually want to be the leader in the teams that I work in. Calculative Motivation to Lead (MTLCA)
MTLCA.02 I will never agree to lead if I cannot see any career benefits from accepting that role.
MTLCA.04 I am interested in leading a team if there are clear advantages for me. MTLCA.06 I would only agree to be a team leader if I know I can benefit from that role. MTLCA.08 I would agree to lead others even if there is no special recognition with that role.
(R) MTLCA.10 I would want to know “what’s in it for me” if I am going to agree to lead a team.
Opportunity to Lead (LDOPP)
Opportunity to use leadership behaviors. New measure.
Survey: Senior Associate Survey, Time 1, 2, & 3 Prompt: In the past 5 weeks, what percentage of your work... Scale: Numeric

88
LDOPPA.01 Has been spent directly training others or providing feedback on their work? LDOPPA.02 Has required you to assume other leadership responsibilities? Survey: Senior Associate Survey, Time 1 Prompt: Over the next three months, what percentage of your work will... Scale: Numeric LDOPPB.01 Be spent directly training others or providing feedback on their work? LDOPPB.02 Require you to assume other leadership responsibilities?
Self-Efficacy (EFFIC)
New measure specific to project leads for tax and audit projects. Developed following Bandura’s (2006) guide for constructing context-specific self-efficacy measures. Self-efficacy is specific helping others develop their skills. Survey: Project lead survey, 1, 2, & 3; Post training feedback Prompt: The following questions are designed to help us gain a better understanding of the kinds of things that that make it difficult to mentor project staff. Please rate how certain you are that you can do the things mentioned below. Rate your degree of confidence by entering a number from 0 to 10. Scale: 0 = Cannot do at all, 5 = Moderately can do, 10 = Highly certain can do. EFFIC.01 Help newly hired staff quickly become productive. EFFIC.02 Recognize when staff need additional mentoring. EFFIC.03 Create the right environment for staff to learn in. EFFIC.04 Provide feedback that motivates improvement. EFFIC.05 Match staff to the right tasks for their development. EFFIC.06 Balance the need to train staff on the job and to meet deadlines. EFFIC.07 Provide the correct level of detail in feedback. EFFIC.08 Teach staff who make mistakes. EFFIC.09 Recognize the best times to provide advice. EFFIC.10 Provide meaningful praise and positive reinforcement.
Relationship Length (RELLN)
Length of relationship with senior associate. Survey: Subordinate, Time 1 (and potentially 2 & 3) Prompt: About how many months have you worked with [project lead]? Scale: Numeric
Supervisory Support (SUSUP)
Five items measuring management support for development by Yarnall (1998). Item 6 and 7 are new items added to the scale.

89
Survey: Senior Associate, Time 1 Prompt: For each of the following statements concerning your manager, please indicate your level of agreement or disagreement. Scale: 1=Strong disagree, 4=Neither agree or disagree, 7=Strongly agree. SUSUP.01 My manager shows me how to improve my performance SUSUP.02 My manager utilizes a variety of methods to assist me with my development SUSUP.03 My manager has the skills to coach me effectively in my development SUSUP.04 My manager views developing associates as an important aspect of his/her job SUSUP.05 My manager helps me select training best suited for my development SUSUP.06 My manager encourages me to apply training I receive
Weekly Work Hours (WKHRS)
Average number of hours worked per week over the last four weeks. Survey: Senior Associate, Time 1-3; Subordinate, Time 1-3 Prompt: Think back over your last four weeks of work. On average, how many hours have you worked per week? Scale: Numeric
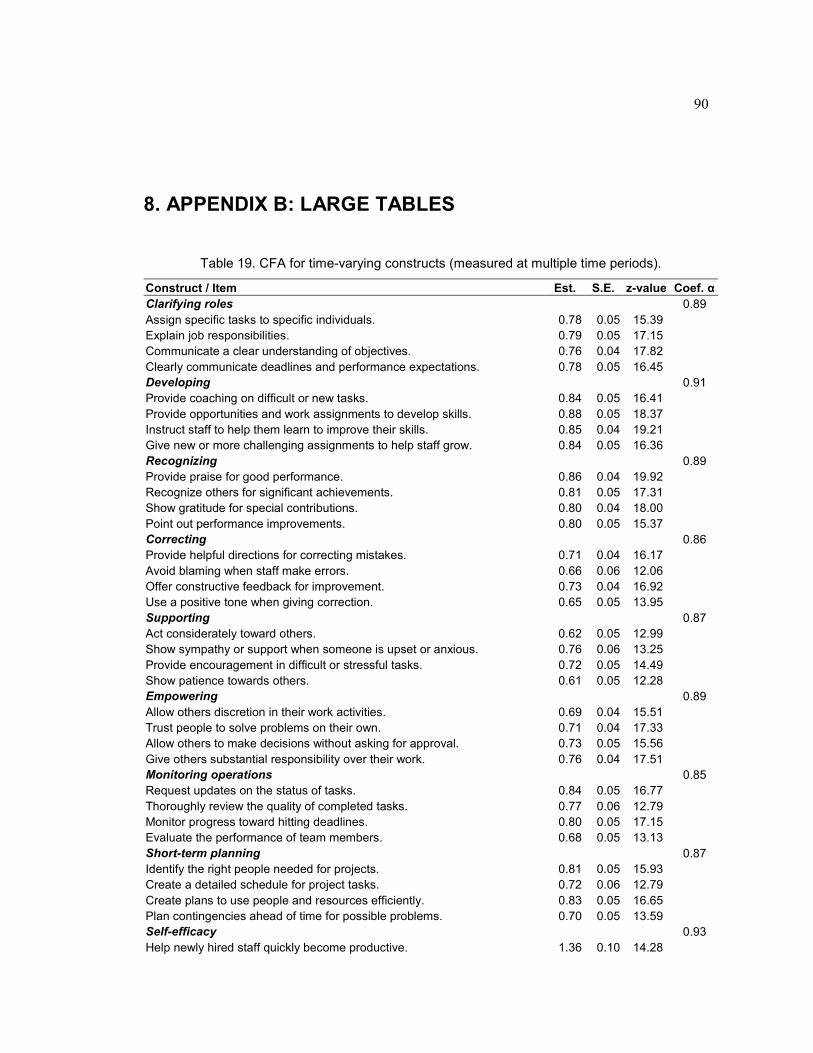
90
8. APPENDIX B: LARGE TABLES
Table 19. CFA for time-varying constructs (measured at multiple time periods).
Construct / Item Est. S.E. z-value Coef. α
Clarifying roles 0.89
Assign specific tasks to specific individuals. 0.78 0.05 15.39
Explain job responsibilities. 0.79 0.05 17.15
Communicate a clear understanding of objectives. 0.76 0.04 17.82
Clearly communicate deadlines and performance expectations. 0.78 0.05 16.45
Developing 0.91
Provide coaching on difficult or new tasks. 0.84 0.05 16.41
Provide opportunities and work assignments to develop skills. 0.88 0.05 18.37
Instruct staff to help them learn to improve their skills. 0.85 0.04 19.21
Give new or more challenging assignments to help staff grow. 0.84 0.05 16.36
Recognizing 0.89
Provide praise for good performance. 0.86 0.04 19.92
Recognize others for significant achievements. 0.81 0.05 17.31
Show gratitude for special contributions. 0.80 0.04 18.00
Point out performance improvements. 0.80 0.05 15.37
Correcting 0.86
Provide helpful directions for correcting mistakes. 0.71 0.04 16.17
Avoid blaming when staff make errors. 0.66 0.06 12.06
Offer constructive feedback for improvement. 0.73 0.04 16.92
Use a positive tone when giving correction. 0.65 0.05 13.95
Supporting 0.87
Act considerately toward others. 0.62 0.05 12.99
Show sympathy or support when someone is upset or anxious. 0.76 0.06 13.25
Provide encouragement in difficult or stressful tasks. 0.72 0.05 14.49
Show patience towards others. 0.61 0.05 12.28
Empowering 0.89
Allow others discretion in their work activities. 0.69 0.04 15.51
Trust people to solve problems on their own. 0.71 0.04 17.33
Allow others to make decisions without asking for approval. 0.73 0.05 15.56
Give others substantial responsibility over their work. 0.76 0.04 17.51
Monitoring operations 0.85
Request updates on the status of tasks. 0.84 0.05 16.77
Thoroughly review the quality of completed tasks. 0.77 0.06 12.79
Monitor progress toward hitting deadlines. 0.80 0.05 17.15
Evaluate the performance of team members. 0.68 0.05 13.13
Short-term planning 0.87
Identify the right people needed for projects. 0.81 0.05 15.93
Create a detailed schedule for project tasks. 0.72 0.06 12.79
Create plans to use people and resources efficiently. 0.83 0.05 16.65
Plan contingencies ahead of time for possible problems. 0.70 0.05 13.59
Self-efficacy 0.93
Help newly hired staff quickly become productive. 1.36 0.10 14.28

91
Construct / Item Est. S.E. z-value Coef. α
Recognize when staff need additional mentoring. 1.27 0.08 15.15
Create the right environment for staff to learn in. 1.21 0.09 13.19
Provide feedback that motivates improvement. 1.33 0.09 15.14
Match staff to the right tasks for their development. 1.35 0.10 14.20
Balance the need to train staff on the job and to meet deadlines. 1.32 0.10 13.01
Provide the correct level of detail in feedback. 1.35 0.10 14.20
Teach staff who make mistakes. 1.34 0.08 15.78
Recognize the best times to provide advice. 1.34 0.10 13.77
Provide meaningful praise and positive reinforcement. 1.40 0.10 14.20
Observations = 285; χ2 = 1323.2, d.f. = 765, p-value < .001
CFI = 0.94, NNFI = 0.93, RMSEA = 0.051 (0.046 - 0.055)
Construct Correlations (1) (2) (3) (4) (5) (6) (7) (8)
(1) Clarifying roles
(2) Developing 0.87
(3) Recognizing 0.57 0.58
(4) Correcting 0.62 0.64 0.78
(5) Supporting 0.40 0.42 0.53 0.63
(6) Empowering 0.59 0.54 0.51 0.63 0.44
(7) Monitoring operations 0.75 0.70 0.73 0.78 0.45 0.59
(8) Short-term planning 0.66 0.70 0.61 0.64 0.40 0.68 0.73
(9) Self-efficacy 0.27 0.30 0.34 0.44 0.38 0.27 0.38 0.40
Table 20. CFA for time-invariant constructs (measured only once).
Construct / Item Est. S.E. z-value Coef. α
Conscientiousness 0.84
Am always prepared. 0.45 0.06 7.83
Pay attention to details. 0.45 0.07 6.71
Waste my time. (R) 0.49 0.08 6.26
Finish what I start. 0.48 0.05 9.69
Carry out my plans. 0.46 0.05 9.72
Make plans and stick to them. 0.55 0.05 10.21
Don't see things through. (R) 0.48 0.05 9.17
Extraversion 0.83
Feel comfortable around people. 0.39 0.06 6.12
Have little to say. (R) 0.55 0.08 7.24
Don't like to draw attention to myself. (R) 0.68 0.08 8.39
Am skilled in handling social situations. 0.55 0.07 8.23
Keep in the background. (R) 0.71 0.07 10.02
Am the life of the party. 0.65 0.08 8.43
Don't talk a lot. (R) 0.75 0.08 9.51
Openness to experience 0.73
Believe in the importance of art. 0.72 0.11 6.86
Am not interested in abstract ideas. (R) 0.61 0.08 7.77
Have a vivid imagination. 0.59 0.09 6.40
Do not like art. (R) 0.60 0.10 5.70
Am not interested in theoretical discussions. (R) 0.48 0.09 5.46
Supervisory support 0.93

92
Construct / Item Est. S.E. z-value Coef. α
My manager shows me how to improve my performance 1.26 0.08 14.96
My manager utilizes a variety of methods to assist my development 1.34 0.09 14.64
My manager has the skills to coach me effectively in my development 1.03 0.09 11.67
My manager views developing staff as an important aspect of his/her job 1.01 0.09 10.80
My manager helps me select training best suited for my development 1.22 0.11 11.28
My manager encourages me to apply training I receive 0.95 0.10 9.56
Affective motivation to lead 0.73
Most of the time, I prefer being a leader rather than a follower when working in a team.
0.74 0.09 8.13
I am the type of person who is not interested in leading others. (R) 0.54 0.11 4.95
I am definitely not a leader by nature. (R) 0.90 0.10 8.55
I am the type of person who likes to be in charge of others. 0.63 0.11 5.72
I usually want to be the leader in the teams that I work in. 0.71 0.09 7.69
Calculative motivation to lead 0.77
I will never agree to lead if I cannot see any career benefits from accepting that role.
0.77 0.11 6.88
I would only agree to be a team leader if I know I can benefit from that role. 1.35 0.11 12.27
I would agree to lead others even if there is no special recognition. (R) 0.53 0.08 6.21
I would want to know “what’s in it for me” if I am going to lead a team. 0.83 0.12 7.17
Learning goal orientation 0.90
The opportunity to do challenging work is important to me. 0.75 0.06 12.52
When I fail to complete a difficult task, I plan to try harder the next time I work on it.
0.61 0.06 10.26
I prefer to work on tasks that force me to learn new things. 0.75 0.07 10.84
The opportunity to learn new things is important to me. 0.70 0.05 12.94
I do my best when I’m working on a fairly difficult task. 0.80 0.09 8.84
I try hard to improve on my past performance. 0.54 0.07 7.99
The opportunity to extend the range of my abilities is important to me. 0.58 0.05 11.22
When I have difficulty solving a problem, I enjoy trying different approaches to see which one will work.
0.78 0.08 9.69
(R) = Reversed item
Observations = 164; χ2 = 1037.2, d.f. = 781, p-value < .001
CFI = 0.92, NNFI = 0.91, RMSEA = 0.045 (0.037 - 0.052)
Construct correlations (1) (2) (3) (4) (5) (6)
(1) Conscientiousness
(2) Extraversion 0.21
(3) Openness to experience -0.07 0.26
(4) Supervisory support 0.39 0.13 0.00
(5) Affective motivation to lead 0.21 0.48 0.19 0.06
(6) Calculative motivation to lead -0.07 -0.03 0.11 -0.24 -0.31
(7) Learning goal orientation 0.18 0.21 0.40 0.19 0.39 -0.18
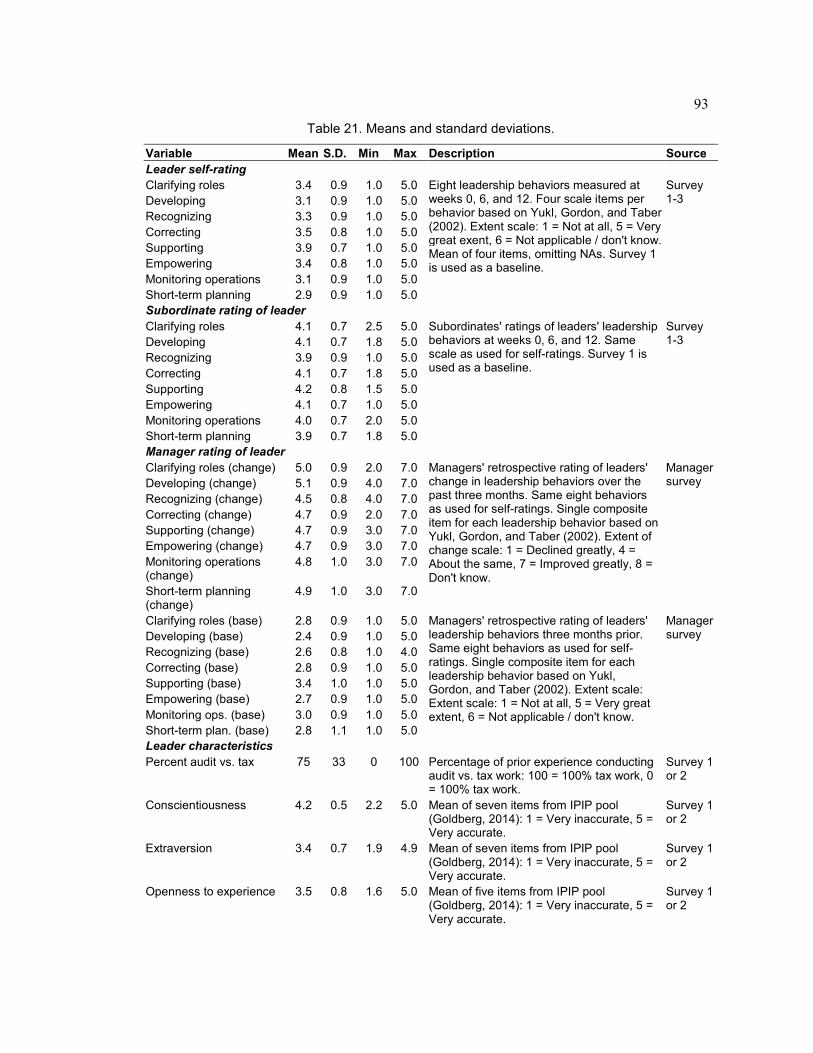
93
Table 21. Means and standard deviations.
Variable Mean S.D. Min Max Description Source
Leader self-rating
Clarifying roles 3.4 0.9 1.0 5.0 Eight leadership behaviors measured at weeks 0, 6, and 12. Four scale items per behavior based on Yukl, Gordon, and Taber (2002). Extent scale: 1 = Not at all, 5 = Very great exent, 6 = Not applicable / don't know. Mean of four items, omitting NAs. Survey 1 is used as a baseline.
Survey 1-3 Developing 3.1 0.9 1.0 5.0
Recognizing 3.3 0.9 1.0 5.0
Correcting 3.5 0.8 1.0 5.0
Supporting 3.9 0.7 1.0 5.0
Empowering 3.4 0.8 1.0 5.0
Monitoring operations 3.1 0.9 1.0 5.0
Short-term planning 2.9 0.9 1.0 5.0
Subordinate rating of leader
Clarifying roles 4.1 0.7 2.5 5.0 Subordinates' ratings of leaders' leadership behaviors at weeks 0, 6, and 12. Same scale as used for self-ratings. Survey 1 is used as a baseline.
Survey 1-3 Developing 4.1 0.7 1.8 5.0
Recognizing 3.9 0.9 1.0 5.0
Correcting 4.1 0.7 1.8 5.0
Supporting 4.2 0.8 1.5 5.0
Empowering 4.1 0.7 1.0 5.0
Monitoring operations 4.0 0.7 2.0 5.0
Short-term planning 3.9 0.7 1.8 5.0
Manager rating of leader
Clarifying roles (change) 5.0 0.9 2.0 7.0 Managers' retrospective rating of leaders' change in leadership behaviors over the past three months. Same eight behaviors as used for self-ratings. Single composite item for each leadership behavior based on Yukl, Gordon, and Taber (2002). Extent of change scale: 1 = Declined greatly, 4 = About the same, 7 = Improved greatly, 8 = Don't know.
Manager survey Developing (change) 5.1 0.9 4.0 7.0
Recognizing (change) 4.5 0.8 4.0 7.0
Correcting (change) 4.7 0.9 2.0 7.0
Supporting (change) 4.7 0.9 3.0 7.0
Empowering (change) 4.7 0.9 3.0 7.0
Monitoring operations (change)
4.8 1.0 3.0 7.0
Short-term planning (change)
4.9 1.0 3.0 7.0
Clarifying roles (base) 2.8 0.9 1.0 5.0 Managers' retrospective rating of leaders' leadership behaviors three months prior. Same eight behaviors as used for self-ratings. Single composite item for each leadership behavior based on Yukl, Gordon, and Taber (2002). Extent scale: Extent scale: 1 = Not at all, 5 = Very great extent, 6 = Not applicable / don't know.
Manager survey Developing (base) 2.4 0.9 1.0 5.0
Recognizing (base) 2.6 0.8 1.0 4.0
Correcting (base) 2.8 0.9 1.0 5.0
Supporting (base) 3.4 1.0 1.0 5.0
Empowering (base) 2.7 0.9 1.0 5.0
Monitoring ops. (base) 3.0 0.9 1.0 5.0
Short-term plan. (base) 2.8 1.1 1.0 5.0
Leader characteristics
Percent audit vs. tax 75 33 0 100 Percentage of prior experience conducting audit vs. tax work: 100 = 100% tax work, 0 = 100% tax work.
Survey 1 or 2
Conscientiousness 4.2 0.5 2.2 5.0 Mean of seven items from IPIP pool (Goldberg, 2014): 1 = Very inaccurate, 5 = Very accurate.
Survey 1 or 2
Extraversion 3.4 0.7 1.9 4.9 Mean of seven items from IPIP pool (Goldberg, 2014): 1 = Very inaccurate, 5 = Very accurate.
Survey 1 or 2
Openness to experience 3.5 0.8 1.6 5.0 Mean of five items from IPIP pool (Goldberg, 2014): 1 = Very inaccurate, 5 = Very accurate.
Survey 1 or 2

94
Variable Mean S.D. Min Max Description Source
Supervisory support 5.5 1.1 2.5 7.0 Support from supervisors given to leaders. Mean of six items adapted from Yarnall (1998): 1 = Strongly disagree, 7 = Strongly agree.
Survey 1 or 2
Job level (1 = senior) 0.41 0.49 0.00 1.00 Job level: 1 = senior associate, 0 = associate.
Org. data
Tenure (years) 2.07 0.51 0.61 3.60 Tenure in the company in years. Org. data
CPA (1 = yes) 0.56 0.50 0.00 1.00 Certified public accountant. Org. data
Hire quarter Four dummy variables for quarter leaders' were hired.
Org. data
Industry assignment Dummy variables for leaders' primary industry responsibility.
Org. data
Region Dummy variables for the four U.S. regions. Org. data
Weekly hours worked 44 5 20 60 Average hours worked in last five weeks. Survey 1-3
Opportunity to lead 58 32 0 100 Opportunity to lead in prior five weeks. Sum of two items for percentage of time leading.
Survey 1-3
Log no. of projects led 2.3 1.0 0.0 5.7 Log +1 sum of the number of tax and audit projects lead.
Survey 1 or 2
Log total months leading 2.7 1.1 0.0 5.5 Log +1 sum of the months leading tax and audit projects and in other organizations.
Survey 1 or 2
Experience breadth 4.4 2.3 0.0 9.0 Index of nine leadership situations common to project leaders. Count of situations leaders have encountered.
Survey 1 or 2
Experience depth 2.9 0.7 1.0 4.4 Index of extent of leaders' experience with nine leadership situations. Extent scale: 1 = Very little, 5 = Very great. Mean of responses for the subset of situations leaders have experienced.
Survey 1 or 2
Cognitive ability 26 4 16 34 ACT score (range 1 to 36) or SAT score converted to ACT equivalent.
Survey 1 or 2
Affective motivation to lead
5.3 0.9 2.8 7.0 Mean of five items from Chan and Drasgo’s (2001) motivation to lead scale: 1 = Strongly disagree, 7 = Strongly agree.
Survey 1 or 2
Calculative motivation to lead
2.3 1.0 1.0 6.5 Mean of four items from Chan and Drasgo’s (2001) motivation to lead scale: 1 = Strongly disagree, 7 = Strongly agree.
Survey 1 or 2
Learning goal orientation 6.0 0.7 3.4 7.0 Mean of eight items from Button, Mathieu, and Zajac (1996): 1 = Strongly disagree, 7 = Strongly agree.
Survey 1 or 2
Self-efficacy at week 0 6.5 1.5 1.3 9.6 Leaders' confidence in their leadership ability. Content-specific measure based on Bandura’s (2006) guide for constructing self-efficacy scales. Mean of ten items: 0 = Cannot do at all, 10 = Highly certain can do.
Survey 1
Subordinate characteristics
Agreeableness (subordinate)
4.2 0.5 2.0 5.0 Mean of eight items from IPIP pool (Goldberg, 2014): 1 = Very inaccurate, 5 = Very accurate.
Survey 1, 2, or 3
Relationship months (subordinate)
7 5 0 24 Number of months subordinate has worked with leader.
Survey 1, 2, or 3
Manager characteristics
Observation extent (manager)
3.5 0.9 2.0 5.0 Managers' extent of observation of leaders. Single item: 1 = None, 5 = Very great extent.
Manager survey
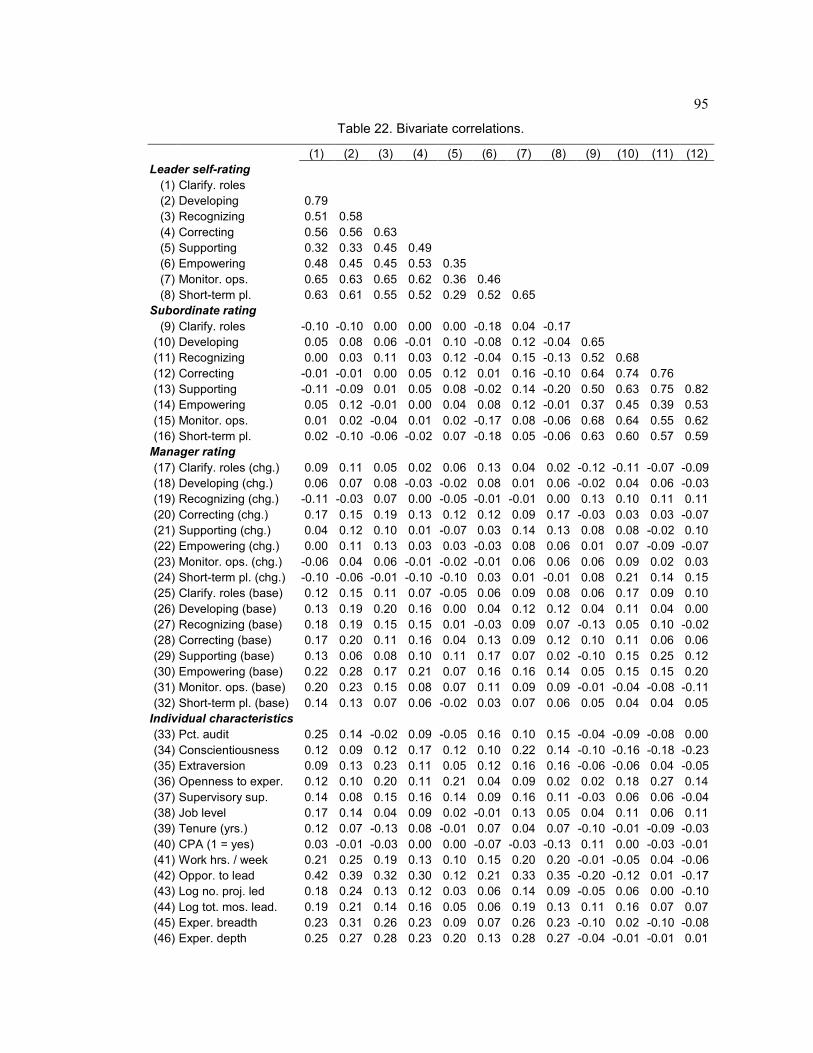
95
Table 22. Bivariate correlations.
(1) (2) (3) (4) (5) (6) (7) (8) (9) (10) (11) (12)
Leader self-rating
(1) Clarify. roles
(2) Developing 0.79
(3) Recognizing 0.51 0.58
(4) Correcting 0.56 0.56 0.63
(5) Supporting 0.32 0.33 0.45 0.49
(6) Empowering 0.48 0.45 0.45 0.53 0.35
(7) Monitor. ops. 0.65 0.63 0.65 0.62 0.36 0.46
(8) Short-term pl. 0.63 0.61 0.55 0.52 0.29 0.52 0.65
Subordinate rating
(9) Clarify. roles -0.10 -0.10 0.00 0.00 0.00 -0.18 0.04 -0.17
(10) Developing 0.05 0.08 0.06 -0.01 0.10 -0.08 0.12 -0.04 0.65
(11) Recognizing 0.00 0.03 0.11 0.03 0.12 -0.04 0.15 -0.13 0.52 0.68
(12) Correcting -0.01 -0.01 0.00 0.05 0.12 0.01 0.16 -0.10 0.64 0.74 0.76
(13) Supporting -0.11 -0.09 0.01 0.05 0.08 -0.02 0.14 -0.20 0.50 0.63 0.75 0.82
(14) Empowering 0.05 0.12 -0.01 0.00 0.04 0.08 0.12 -0.01 0.37 0.45 0.39 0.53
(15) Monitor. ops. 0.01 0.02 -0.04 0.01 0.02 -0.17 0.08 -0.06 0.68 0.64 0.55 0.62
(16) Short-term pl. 0.02 -0.10 -0.06 -0.02 0.07 -0.18 0.05 -0.06 0.63 0.60 0.57 0.59
Manager rating
(17) Clarify. roles (chg.) 0.09 0.11 0.05 0.02 0.06 0.13 0.04 0.02 -0.12 -0.11 -0.07 -0.09
(18) Developing (chg.) 0.06 0.07 0.08 -0.03 -0.02 0.08 0.01 0.06 -0.02 0.04 0.06 -0.03
(19) Recognizing (chg.) -0.11 -0.03 0.07 0.00 -0.05 -0.01 -0.01 0.00 0.13 0.10 0.11 0.11
(20) Correcting (chg.) 0.17 0.15 0.19 0.13 0.12 0.12 0.09 0.17 -0.03 0.03 0.03 -0.07
(21) Supporting (chg.) 0.04 0.12 0.10 0.01 -0.07 0.03 0.14 0.13 0.08 0.08 -0.02 0.10
(22) Empowering (chg.) 0.00 0.11 0.13 0.03 0.03 -0.03 0.08 0.06 0.01 0.07 -0.09 -0.07
(23) Monitor. ops. (chg.) -0.06 0.04 0.06 -0.01 -0.02 -0.01 0.06 0.06 0.06 0.09 0.02 0.03
(24) Short-term pl. (chg.) -0.10 -0.06 -0.01 -0.10 -0.10 0.03 0.01 -0.01 0.08 0.21 0.14 0.15
(25) Clarify. roles (base) 0.12 0.15 0.11 0.07 -0.05 0.06 0.09 0.08 0.06 0.17 0.09 0.10
(26) Developing (base) 0.13 0.19 0.20 0.16 0.00 0.04 0.12 0.12 0.04 0.11 0.04 0.00
(27) Recognizing (base) 0.18 0.19 0.15 0.15 0.01 -0.03 0.09 0.07 -0.13 0.05 0.10 -0.02
(28) Correcting (base) 0.17 0.20 0.11 0.16 0.04 0.13 0.09 0.12 0.10 0.11 0.06 0.06
(29) Supporting (base) 0.13 0.06 0.08 0.10 0.11 0.17 0.07 0.02 -0.10 0.15 0.25 0.12
(30) Empowering (base) 0.22 0.28 0.17 0.21 0.07 0.16 0.16 0.14 0.05 0.15 0.15 0.20
(31) Monitor. ops. (base) 0.20 0.23 0.15 0.08 0.07 0.11 0.09 0.09 -0.01 -0.04 -0.08 -0.11
(32) Short-term pl. (base) 0.14 0.13 0.07 0.06 -0.02 0.03 0.07 0.06 0.05 0.04 0.04 0.05
Individual characteristics
(33) Pct. audit 0.25 0.14 -0.02 0.09 -0.05 0.16 0.10 0.15 -0.04 -0.09 -0.08 0.00
(34) Conscientiousness 0.12 0.09 0.12 0.17 0.12 0.10 0.22 0.14 -0.10 -0.16 -0.18 -0.23
(35) Extraversion 0.09 0.13 0.23 0.11 0.05 0.12 0.16 0.16 -0.06 -0.06 0.04 -0.05
(36) Openness to exper. 0.12 0.10 0.20 0.11 0.21 0.04 0.09 0.02 0.02 0.18 0.27 0.14
(37) Supervisory sup. 0.14 0.08 0.15 0.16 0.14 0.09 0.16 0.11 -0.03 0.06 0.06 -0.04
(38) Job level 0.17 0.14 0.04 0.09 0.02 -0.01 0.13 0.05 0.04 0.11 0.06 0.11
(39) Tenure (yrs.) 0.12 0.07 -0.13 0.08 -0.01 0.07 0.04 0.07 -0.10 -0.01 -0.09 -0.03
(40) CPA (1 = yes) 0.03 -0.01 -0.03 0.00 0.00 -0.07 -0.03 -0.13 0.11 0.00 -0.03 -0.01
(41) Work hrs. / week 0.21 0.25 0.19 0.13 0.10 0.15 0.20 0.20 -0.01 -0.05 0.04 -0.06
(42) Oppor. to lead 0.42 0.39 0.32 0.30 0.12 0.21 0.33 0.35 -0.20 -0.12 0.01 -0.17
(43) Log no. proj. led 0.18 0.24 0.13 0.12 0.03 0.06 0.14 0.09 -0.05 0.06 0.00 -0.10
(44) Log tot. mos. lead. 0.19 0.21 0.14 0.16 0.05 0.06 0.19 0.13 0.11 0.16 0.07 0.07
(45) Exper. breadth 0.23 0.31 0.26 0.23 0.09 0.07 0.26 0.23 -0.10 0.02 -0.10 -0.08
(46) Exper. depth 0.25 0.27 0.28 0.23 0.20 0.13 0.28 0.27 -0.04 -0.01 -0.01 0.01
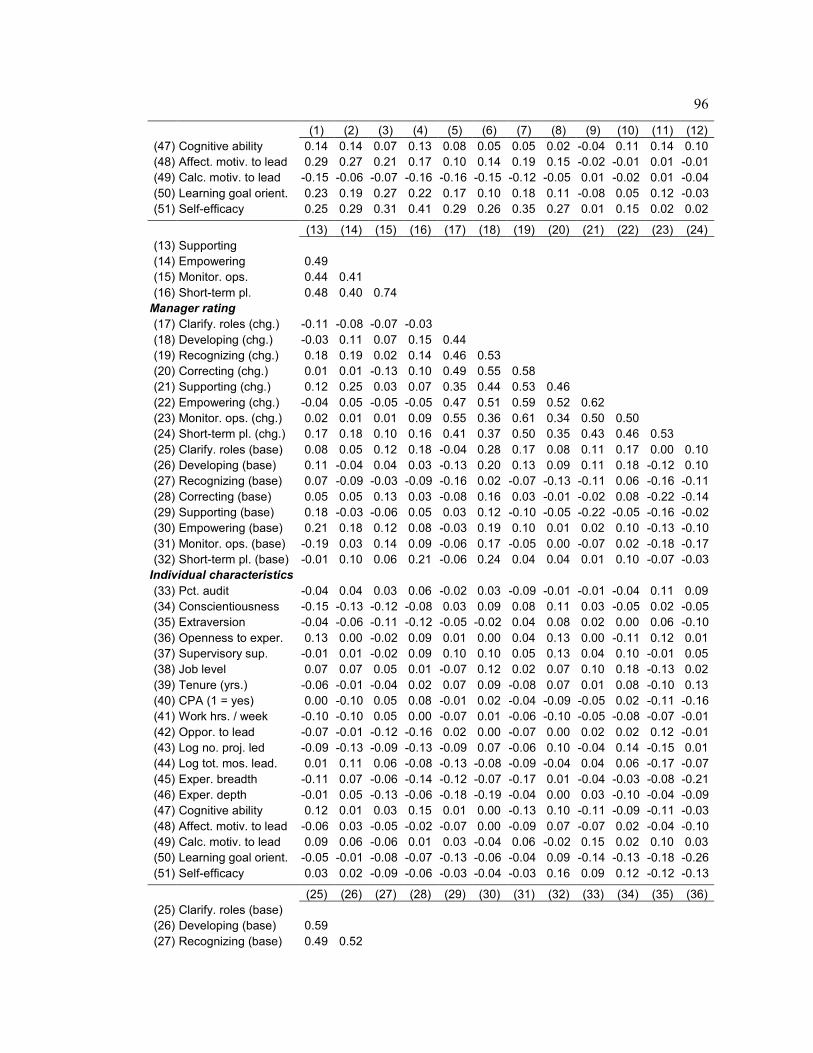
96
(1) (2) (3) (4) (5) (6) (7) (8) (9) (10) (11) (12)
(47) Cognitive ability 0.14 0.14 0.07 0.13 0.08 0.05 0.05 0.02 -0.04 0.11 0.14 0.10
(48) Affect. motiv. to lead 0.29 0.27 0.21 0.17 0.10 0.14 0.19 0.15 -0.02 -0.01 0.01 -0.01
(49) Calc. motiv. to lead -0.15 -0.06 -0.07 -0.16 -0.16 -0.15 -0.12 -0.05 0.01 -0.02 0.01 -0.04
(50) Learning goal orient. 0.23 0.19 0.27 0.22 0.17 0.10 0.18 0.11 -0.08 0.05 0.12 -0.03
(51) Self-efficacy 0.25 0.29 0.31 0.41 0.29 0.26 0.35 0.27 0.01 0.15 0.02 0.02
(13) (14) (15) (16) (17) (18) (19) (20) (21) (22) (23) (24)
(13) Supporting
(14) Empowering 0.49
(15) Monitor. ops. 0.44 0.41
(16) Short-term pl. 0.48 0.40 0.74
Manager rating
(17) Clarify. roles (chg.) -0.11 -0.08 -0.07 -0.03
(18) Developing (chg.) -0.03 0.11 0.07 0.15 0.44
(19) Recognizing (chg.) 0.18 0.19 0.02 0.14 0.46 0.53
(20) Correcting (chg.) 0.01 0.01 -0.13 0.10 0.49 0.55 0.58
(21) Supporting (chg.) 0.12 0.25 0.03 0.07 0.35 0.44 0.53 0.46
(22) Empowering (chg.) -0.04 0.05 -0.05 -0.05 0.47 0.51 0.59 0.52 0.62
(23) Monitor. ops. (chg.) 0.02 0.01 0.01 0.09 0.55 0.36 0.61 0.34 0.50 0.50
(24) Short-term pl. (chg.) 0.17 0.18 0.10 0.16 0.41 0.37 0.50 0.35 0.43 0.46 0.53
(25) Clarify. roles (base) 0.08 0.05 0.12 0.18 -0.04 0.28 0.17 0.08 0.11 0.17 0.00 0.10
(26) Developing (base) 0.11 -0.04 0.04 0.03 -0.13 0.20 0.13 0.09 0.11 0.18 -0.12 0.10
(27) Recognizing (base) 0.07 -0.09 -0.03 -0.09 -0.16 0.02 -0.07 -0.13 -0.11 0.06 -0.16 -0.11
(28) Correcting (base) 0.05 0.05 0.13 0.03 -0.08 0.16 0.03 -0.01 -0.02 0.08 -0.22 -0.14
(29) Supporting (base) 0.18 -0.03 -0.06 0.05 0.03 0.12 -0.10 -0.05 -0.22 -0.05 -0.16 -0.02
(30) Empowering (base) 0.21 0.18 0.12 0.08 -0.03 0.19 0.10 0.01 0.02 0.10 -0.13 -0.10
(31) Monitor. ops. (base) -0.19 0.03 0.14 0.09 -0.06 0.17 -0.05 0.00 -0.07 0.02 -0.18 -0.17
(32) Short-term pl. (base) -0.01 0.10 0.06 0.21 -0.06 0.24 0.04 0.04 0.01 0.10 -0.07 -0.03
Individual characteristics
(33) Pct. audit -0.04 0.04 0.03 0.06 -0.02 0.03 -0.09 -0.01 -0.01 -0.04 0.11 0.09
(34) Conscientiousness -0.15 -0.13 -0.12 -0.08 0.03 0.09 0.08 0.11 0.03 -0.05 0.02 -0.05
(35) Extraversion -0.04 -0.06 -0.11 -0.12 -0.05 -0.02 0.04 0.08 0.02 0.00 0.06 -0.10
(36) Openness to exper. 0.13 0.00 -0.02 0.09 0.01 0.00 0.04 0.13 0.00 -0.11 0.12 0.01
(37) Supervisory sup. -0.01 0.01 -0.02 0.09 0.10 0.10 0.05 0.13 0.04 0.10 -0.01 0.05
(38) Job level 0.07 0.07 0.05 0.01 -0.07 0.12 0.02 0.07 0.10 0.18 -0.13 0.02
(39) Tenure (yrs.) -0.06 -0.01 -0.04 0.02 0.07 0.09 -0.08 0.07 0.01 0.08 -0.10 0.13
(40) CPA (1 = yes) 0.00 -0.10 0.05 0.08 -0.01 0.02 -0.04 -0.09 -0.05 0.02 -0.11 -0.16
(41) Work hrs. / week -0.10 -0.10 0.05 0.00 -0.07 0.01 -0.06 -0.10 -0.05 -0.08 -0.07 -0.01
(42) Oppor. to lead -0.07 -0.01 -0.12 -0.16 0.02 0.00 -0.07 0.00 0.02 0.02 0.12 -0.01
(43) Log no. proj. led -0.09 -0.13 -0.09 -0.13 -0.09 0.07 -0.06 0.10 -0.04 0.14 -0.15 0.01
(44) Log tot. mos. lead. 0.01 0.11 0.06 -0.08 -0.13 -0.08 -0.09 -0.04 0.04 0.06 -0.17 -0.07
(45) Exper. breadth -0.11 0.07 -0.06 -0.14 -0.12 -0.07 -0.17 0.01 -0.04 -0.03 -0.08 -0.21
(46) Exper. depth -0.01 0.05 -0.13 -0.06 -0.18 -0.19 -0.04 0.00 0.03 -0.10 -0.04 -0.09
(47) Cognitive ability 0.12 0.01 0.03 0.15 0.01 0.00 -0.13 0.10 -0.11 -0.09 -0.11 -0.03
(48) Affect. motiv. to lead -0.06 0.03 -0.05 -0.02 -0.07 0.00 -0.09 0.07 -0.07 0.02 -0.04 -0.10
(49) Calc. motiv. to lead 0.09 0.06 -0.06 0.01 0.03 -0.04 0.06 -0.02 0.15 0.02 0.10 0.03
(50) Learning goal orient. -0.05 -0.01 -0.08 -0.07 -0.13 -0.06 -0.04 0.09 -0.14 -0.13 -0.18 -0.26
(51) Self-efficacy 0.03 0.02 -0.09 -0.06 -0.03 -0.04 -0.03 0.16 0.09 0.12 -0.12 -0.13
(25) (26) (27) (28) (29) (30) (31) (32) (33) (34) (35) (36)
(25) Clarify. roles (base)
(26) Developing (base) 0.59
(27) Recognizing (base) 0.49 0.52

97
(25) (26) (27) (28) (29) (30) (31) (32) (33) (34) (35) (36)
(28) Correcting (base) 0.54 0.58 0.60
(29) Supporting (base) 0.40 0.36 0.40 0.38
(30) Empowering (base) 0.68 0.54 0.52 0.62 0.43
(31) Monitor. ops. (base) 0.56 0.51 0.53 0.54 0.39 0.52
(32) Short-term pl. (base) 0.68 0.52 0.48 0.53 0.39 0.55 0.64
Individual characteristics
(33) Pct. audit 0.08 -0.05 -0.09 -0.07 -0.12 0.21 -0.05 0.07
(34) Conscientiousness 0.15 -0.02 0.09 -0.02 0.13 0.09 0.06 0.08 -0.03
(35) Extraversion 0.01 -0.06 -0.04 -0.14 -0.02 -0.11 -0.05 -0.06 0.07 0.21
(36) Openness to exper. 0.04 -0.03 -0.03 -0.07 0.02 -0.03 0.04 0.05 -0.05 0.02 0.18
(37) Supervisory sup. 0.15 0.09 0.17 0.14 0.34 0.11 0.12 0.03 -0.07 0.40 0.10 0.04
(38) Job level 0.27 0.31 0.37 0.41 0.22 0.23 0.31 0.24 -0.08 0.12 -0.04 -0.08
(39) Tenure (yrs.) 0.08 0.00 0.08 0.05 0.04 -0.06 0.14 0.07 0.12 0.09 -0.04 -0.06
(40) CPA (1 = yes) 0.07 0.14 0.06 0.03 0.18 0.03 0.07 0.18 -0.10 0.02 -0.12 -0.05
(41) Work hrs. / week 0.06 0.06 0.08 0.00 0.00 0.03 0.06 0.10 0.15 -0.03 -0.13 0.08
(42) Oppor. to lead 0.03 0.14 0.14 0.07 -0.05 0.08 0.06 0.05 0.20 -0.01 0.06 0.13
(43) Log no. proj. led 0.19 0.13 0.15 0.24 0.10 0.11 0.24 0.18 -0.04 -0.01 -0.09 -0.06
(44) Log tot. mos. lead. -0.01 0.03 0.12 0.17 -0.07 0.02 0.05 0.03 -0.03 0.08 0.06 0.01
(45) Exper. breadth -0.06 0.03 0.14 0.04 -0.04 0.08 0.02 -0.07 0.00 0.02 0.12 -0.05
(46) Exper. depth -0.15 -0.14 -0.24 -0.19 -0.23 -0.06 -0.10 -0.11 0.16 0.01 0.14 0.05
(47) Cognitive ability 0.15 0.06 -0.02 0.03 -0.01 0.06 0.12 0.25 -0.01 -0.08 -0.10 0.20
(48) Affect. motiv. to lead -0.17 -0.17 -0.21 -0.16 -0.20 -0.13 -0.10 -0.06 0.14 0.25 0.30 0.16
(49) Calc. motiv. to lead -0.15 0.07 -0.09 -0.09 -0.05 -0.07 -0.18 -0.05 -0.12 -0.09 -0.07 0.03
(50) Learning goal orient. -0.07 0.01 0.17 -0.02 0.08 -0.05 0.08 0.02 -0.15 0.26 0.19 0.30
(51) Self-efficacy 0.01 0.09 -0.01 0.16 0.05 0.00 -0.07 0.02 -0.08 0.37 0.18 0.05
(37) (38) (39) (40) (41) (42) (43) (44) (45) (46) (47) (48)
(37) Supervisory sup.
(38) Job level 0.14
(39) Tenure (yrs.) 0.15 0.32
(40) CPA (1 = yes) -0.07 0.07 -0.18
(41) Work hrs. / week 0.00 -0.05 0.02 -0.02
(42) Oppor. to lead 0.01 0.08 -0.02 -0.03 0.25
(43) Log no. proj. led -0.06 0.40 0.22 0.04 0.11 0.16
(44) Log tot. mos. lead. 0.04 0.29 0.08 0.00 0.08 0.13 0.55
(45) Exper. breadth -0.07 0.22 -0.01 -0.02 0.11 0.20 0.34 0.54
(46) Exper. depth -0.11 0.02 -0.01 -0.05 0.19 0.18 0.12 0.24 0.27
(47) Cognitive ability -0.06 -0.09 0.16 0.03 0.10 0.13 0.09 -0.06 0.02 -0.02
(48) Affect. motiv. to lead 0.01 -0.14 -0.05 0.01 0.00 0.19 0.01 0.25 0.18 0.23 0.01
(49) Calc. motiv. to lead -0.22 -0.19 -0.13 0.08 -0.02 0.02 -0.15 -0.30 -0.12 -0.05 0.04 -0.17
(50) Learning goal orient. 0.24 -0.02 -0.20 0.11 0.21 0.17 -0.04 0.15 0.14 0.04 0.03 0.31
(51) Self-efficacy 0.30 0.10 0.05 0.09 0.05 0.11 0.16 0.26 0.26 0.22 -0.03 0.21
(49) (50)
(49) Calc. motiv. to lead
(50) Learning goal orient. -0.19
(51) Self-efficacy -0.17 0.19