learning to walk before you run : financial behavior and
TRANSCRIPT
UMR 225 IRD - Paris-Dauphine
UMR DIAL 225
Place du Maréchal de Lattre de Tassigny 75775 • Paris Cedex 16 •Tél. (33) 01 44 05 45 42 • Fax (33) 01 44 05 45 45
• 4, rue d’Enghien • 75010 Paris • Tél. (33) 01 53 24 14 50 • Fax (33) 01 53 24 14 51
E-mail : [email protected] • Site : www.dial.prd.fr
DOCUMENT DE TRAVAIL DT/2013-09
Learning to walk before you run : Financial Behavior and mobile banking in Madagascar
Florence ARESTOFF
Baptiste VENET
2
LEARNING TO WALK BEFORE YOU RUN: FINANCIAL BEHAVIOR AND MOBILE BANKING IN MADAGASCAR1
Florence Arestoff
PSL, Université Paris-Dauphine, LEDa, UMR DIAL, 75016 Paris, France
IRD, UMR DIAL, 75010 Paris
Baptiste Venet
PSL, Université Paris-Dauphine, LEDa, UMR DIAL, 75016 Paris, France
IRD, UMR DIAL, 75010 Paris
Document de travail UMR DIAL Septembre 2013
Abstract
In Madagascar, Orange introduced its mobile banking services in September 2010. Mobile-banking (m-banking) is a system that allows users to conduct a number of financial transactions through a mobile phone. The existing body of literature suggests that the use of m-banking services may have a positive impact on individual savings, affect money transfer behavior and/or encourage financial inclusion. In 2012, we conducted a survey of 598 randomly selected Orange clients in Antananarivo. We use the matching methodology to assess the impacts of m-banking on clients' financial behavior. The results show that the use of m-banking services increases the number of national remittances sent and received. It is in line with the conclusions of the existing literature devoted to M-Pesa in Kenya. Yet we find that using of m-banking services has no significant impact on the sums saved by users or the sums of remittances sent and received, which appears to contradict the users' perceptions. This result may, however, be explained by a learning-by-doing process: users need to first learn to trust the e-money system before making any significant changes to their financial behavior.
Key words: Mobile banking, Financial behavior, Low Income countries, Matching methodology.
Résumé
En septembre 2010, l’opérateur Orange a introduit les services de banque mobile appelés Orange Money à Madagascar. Ils permettent d’effectuer des opérations de dépôt et de retrait d’argent, de transferts nationaux et de paiements de marchandises. Selon la littérature existante, l’utilisation de ces services engendrerait une augmentation de l’épargne individuelle, pourrait modifier les comportements de transferts et/ou favoriser la bancarisation des plus pauvres. Afin d’analyser les conséquences du m-banking sur les comportements financiers des populations concernées à Madagascar, nous procédons à une étude d’impact reposant sur des données originales. En mars 2012, nous avons réalisé une enquête auprès de 196 clients Orange utilisateurs réguliers des services Orange money et 402 clients Orange non utilisateurs de ces services. Afin de comparer rigoureusement les comportements financiers de ces deux groupes, nous apparions les individus sur la base de leurs scores de propension respectifs. Nos résultats montrent alors que l’utilisation des services Orange Money conduit à accroître significativement la fréquence des transferts envoyés et reçus. Ce résultat est corroboré par l’approche subjective puisque 55% des utilisateurs Orange Money déclarent que ce service les a encouragés à effectuer des transferts plus fréquemment. En revanche, nous montrons qu’Orange Money n’a d’impact significatif ni sur les montants épargnés ni sur les montants transférés (à l’envoi comme à la réception), ce qui tend à contredire le sentiment des utilisateurs. La temporalité des effets des services de m-banking apparaît alors. Les modifications de montants transférés et épargnés s’inscrivent probablement davantage dans la durée alors que la fréquence des transferts serait plus rapidement affectée eu égard au moindre coût et à la facilité d’utilisation d’Orange Money.
Mots Clés : Banque mobile, Matching, Comportements financiers, Pays en développement.
JEL Code: G2, G21, O16.
1 We gratefully thank Ariane Szafarz and two discussants at the 47
th Annual Conference of the CEA and at the
3rd
European Research Conference on Microfinance for valuable comments on a previous version of this
paper.
2
I. Introduction
In 2012, Demirguc-Kunt & Klapper (2012) posited that, "Well-functioning financial systems
serve a vital purpose, offering savings, credit, payment, and risk management products to people
with a wide range of needs. Inclusive financial systems -allowing broad access to financial
services, without price or nonprice barriers to their use- are especially likely to benefit poor
people and other disadvantaged groups. Without inclusive financial systems, poor people must
rely on their own limited savings to invest in their education or become entrepreneurs -and small
enterprises must rely on their limited earnings to pursue promising growth opportunities. This can
contribute to persistent income inequality and slower economic growth". Twenty years earlier,
McKinnon (1973), Shaw (1973) and, more generally, the "financial liberalization school" all
claimed that the development of the banking system was at the heart of the economic
development process.
Forty years later, however, Demirguc-Kunt & Klapper (2012) pointed out that, "While account
penetration is nearly universal in high-income economies, with 89 percent of adults reporting that
they have an account at a formal financial institution, it is only 41 percent in developing
economies. Globally, more than 2.5 billion adults do not have a formal account, most of them in
developing economies". Looking specifically at poor people, around 77% of the poor are
unbanked worldwide.
Banking through mobile phones has been common in developed countries for some ten years
now. Mobile-banking (m-banking) is a system that allows users to conduct a number of financial
transactions through a mobile phone. Typical mobile banking services may include deposits (cash
in), withdrawals (cash out), domestic and international fund transfers, bill payments processing,
etc. The CGAP (Consultative Group to Assist Poor) reported an end-2010 figure of 96 branchless
banking services worldwide (now approximately 114). Fifty of these had active customers, but
only 22 had more than one million registered users. These 96 services were located mainly in
Sub-Saharan Africa (51), Latin America and the Caribbean (19), East Asia and the Pacific (15),
and South Asia (10). It could be said then that the real potential of m-banking is to make basic
financial services more accessible to millions of poor people in emerging and developing
countries. By 2010, there were 2.4 times more mobile phones in low-income countries than high-
income countries. There were four billion mobiles worldwide in 2008, but only one billion bank
accounts. As mobile phone usage expands, so could opportunities to bank the unbanked.
Why mobile banking development may be so important for Madagascar? There is a strong need
for financial inclusion in the country. The FinAccess survey reports that Madagascar has only
1.43 bank branches per 100,000 adults, just 624 bank branches and 182 ATMs (1.54 ATMs per
100,000 adults) and that a mere 6% of the population of banking age holds a bank account. In
Madagascar, Orange's m-banking service package (called Orange Money) has been available
since September 2010. Initially, the main Orange Money services were deposits (cash in),
withdrawals (cash out), domestic money transfers and purchases by users in certain shops
(equipped with an Orange E-Payment terminal) using their mobile phone. The fees charged upon
Orange Money services are presented in appendix 1 (Tables A and B).
3
Until recently, very few studies had been able to analyze the impact of m-banking services on
user behavior due to the relatively new nature of mobile banking services in developing countries
and the lack of data available on them. Yet in recent years, growth in the number of m-banking
services worldwide and the excitement generated by these initiatives in the broader context of
financial inclusion have prompted the publication of a number of studies such as those by Jack &
Suri (2011), Mbiti & Weil (2011) and Demombynes & Thegeya (2012). The most recent studies
focus on M-PESA in Kenya, the most famous m-banking experience in the developing world.
Authors generally compare M-PESA users and non-users in terms of savings and remittances. In
these studies, the use of m-banking services would appear to have a positive effect on certain
financial behavior such as the number of money transfers. However, things would seem to be less
clear-cut in terms of impact on savings. Our paper sets out to contribute to this existing body of
literature.
We consequently conducted a survey of 598 randomly selected Orange customers in
Antananarivo, Madagascar's capital city, in March 2012. Among them, 196 were "regular"
Orange Money users (i.e. using at least one Orange Money service per month and using Orange
Money services for at least one year). The other 402 had been Orange clients for at least one year,
but were "non-regular" Orange Money users (i.e. they did not use Orange Money services or they
used them less than once a month).
We use matching to assess the effects of using Orange Money services on users' financial
behavior. This methodology compares outcomes among a set of users and non-users who are
statistically comparable in that they have the same observable probability of using Orange Money
services. Basically, treated individuals are matched with untreated individuals who have the same
observable characteristics. Once individuals have been matched, we can then estimate the
"average effect of the treatment" (i.e. using Orange Money services). We focus our analysis on
five individual financial variables: sums saved, number of remittances sent and received, and
sums of remittances sent and received. All data relating to these five variables were collected
during individual interviews where most other forms of savings and money transfers (formal and
informal) were also put to respondents.
In this study, we find that the use of Orange Money services increases the numbers of domestic
remittances sent and received. This finding is in line with the conclusions of Jack & Suri (2011)
regarding the impact of the use of M-PESA in Kenya. Yet we find no significant impact of
Orange Money on users' savings sums or on remittance sums sent and received. This result could
be due to a "learning-by-doing" process: users need time to learn to trust the m-banking system
before changing their financial behavior.
The rest of the paper is organized as follows. Section 2 briefly reviews the literature on the
expected theoretical impacts of mobile banking services on user behavior and presents the main
results of some recent empirical papers. Section 3 describes the main features of our two sub-
populations of individuals. In section 4, we discuss the econometric methodology and present the
main tests and results. Lastly, we conclude in section 5.
4
II. Mobile banking and financial behaviors: what do we expect and what do
we know?
There are two different kinds of m-banking services. In the additive model, people already have a
bank account and new financial services become available through their mobile phone. These
branchless services are on the rise for bank customers in developed countries. In the converted
model, some people (especially the poor) do not have any access to formal banking services for
many reasons: they have nothing to pledge to lenders to guarantee or secure loans (assets or
property), fixed costs may make them unprofitable for lenders, they live too far from a bank
branch, etc.
The second model is a way of giving the unbanked access to basic banking services: "Many of
the unbanked are poor, and mobile technology offers the possibility of both filling financial gaps
and improving the economic lives of customers" (Kapoor, Murdoch & Ravi, 2007).
On the whole, m-banking may save customers and lenders time and money.
Customers who use m-banking services:
1) No longer need to spend precious time and financial resources traveling to far-off bank (or
microcredit) branches;
2) Have access to a safe money storage and transfer mechanism, potentially encouraging them to
trade and save more;
3) Can quickly and cheaply send and receive remittances over long distances, potentially
facilitating human and physical capital investment and allocation.
4) May help or be helped by support networks to manage negative shocks with quick and easy
transfers of small sums of money.
The advantages for lenders (banks and microfinance institutions -MFI-) are that:
1) They can do business more efficiently (i.e. at a lower cost): m-banking transactions cost far
less to process than ATM or physical bank branch transactions;
2) They can make a profit offering unbanked individuals new services such as transfers and
payments of small sums, which are sometimes impossible in traditional banking;
3) Mobiles can also be used to remind customers of upcoming deadlines (with a text message
sent to the client, for example);
4) MFI credit agents no longer have to transport cash between villages and branches, making for
a more secure service for credit agents and MFIs (less risk of loss or theft of funds).
To sum up, m-finance can increase the reach of lenders (banks or MFIs) by offering more
financial services to (new) clients (thus promoting financial inclusion for the unbanked), reduce
operational costs, secure financial transactions, save time, and facilitate business for both lenders
and customers.
Yet m-banking also has two potential drawbacks. It could make people more dependent on
mobile phones. Where m-banking services raise mobile phone expenditure, they could deepen
5
households' budget problems (especially for the poor), all the more so if m-banking services are
extensive. And m-finance could also undermine the relationship of trust where the financial
relationship becomes mainly "intangible". This could be a real issue for microfinance. Many
experts and researchers consider that the social ties between the MFI, the credit agent and the
customer are one of the keys to the success of microfinance and must be preserved. A
relationship of trust generally improves repayments on time and promotes the honesty of
customers and MFI staff. Kapoor, Murdoch & Ravi (2007) believe that these social ties are a way
for lenders to glean "soft information" on clients and "early signs of trouble". So, "the shift to m-
finance facilitates easy access to "hard information" (history and timing of credit and saving
transactions) but at the expense of these kinds of soft information. One question is whether the
hard information can adequately substitute for the soft information" (Kapoor, Murdoch & Ravi,
2007).
Until recently, only a small number of empirical studies had assessed the effects of m-banking
services on users. However, the growing number of m-payment services in the world (today,
there are 114 live branchless banking deployments worldwide) and excitement over the potential
for financial inclusion generated by these initiatives have prompted the publication of a
significant number of papers in recent years.
Recent studies have been conducted mainly in Africa: South Africa (Ivatury & Pickens, 2006),
Uganda (Ndiwalana et al., 2010) and Kenya (Morawczynski & Pickens (2009), Jack & Suri
(2011), Mbiti & Weil (2011), and Demombynes & Thegeya (2012)). Interest in the African
continent is driven by the fact that it is here where most m-banking services have been launched4.
South Africa, Zambia and Kenya appear to be target countries for the deployment of these
services. Such a phenomenon is not surprising given the huge number of African households
outside the banking system. Demirguc-Kunt & Klapper (2012) report that only 24% of adults
living in Sub-Saharan Africa have a bank account in a formal institution, compared to about 50%
worldwide.
Most recent published studies have focused on M-PESA in Kenya. In 2008, a year after the
official launch of M- PESA, Jack & Suri (2011) conducted a survey (round 1) of randomly
selected households across Kenya. In 2009, they conducted a follow-up survey (round 2),
managing to reach a large number of previously interviewed households. They compare the
characteristics of non-users and users, and also the characteristics of the "early" and "late" users
among M-PESA users. Although only the wealthiest groups initially used M-PESA in 2008, Jack
& Suri find that it is slowly being adopted by a broader base of the interviewed population. Many
of those who became users between 2008 and 2009 were households living in rural areas and
households without bank accounts (unbanked people). Using data from the 2006 and 2009
FinAccess surveys, Mbiti & Weil (2011) find also that people with bank accounts use M-PESA
almost three times as much as those without bank accounts. Urban residents, richer individuals,
the more highly educated, and those in the non-farm sector use M-PESA almost twice as often as
rural residents, poorer individuals, the less well-educated and those employed in the farm sector
respectively which corroborates findings from a survey of WIZZIT's early mobile banking
4This is probably why some experts consider that "Africa is a paradise of M-payment" (PHB Development Report &
Kurt Salmon, 2011, p. 23)
6
customers in South Africa (Ivatury & Pickens, 2006).
Taking the 2009 FinAccess survey, Mbiti & Weil (2011) find that almost 35 percent report that
using M-PESA has increased their frequency of sending transfers, while 31 percent report an
increase in the frequency of transfers received. Morawcyznski and Pickens (2009) observe that
M-Pesa users sent smaller but more frequent remittances. So, like it was found by Jack & Suri
(2011), M-PESA users are much more likely to send and receive remittances than non-users.
However, the total sum sent and received by M-PESA users is not very different from the average
household. Mbiti & Weil (2011) then turn to analyzing some previous qualitative studies on M-
PESA in greater depth, such as the article by Morawczynski & Pickens (2009), who suggest that
M-PESA serves as a partial substitute for the formal banking system. Combining the 2006 and
2009 FinAccess surveys, they create a balanced panel of 190 sub-locations surveyed in both
rounds. They find a positive relationship between M-PESA adoption and frequency of sending
and receiving transfers, although only the estimate of sending transfers is statistically significant.
The estimates also show a strong positive association between M-PESA adoption and bank use
and formal savings5. These results are robust to FE-IV estimations (fixed effects instrumental
variable at sub-location level). With respect to sums saved, Jack & Suri (2011) find that M-PESA
user bank account holders save significantly more than other M-PESA user households. This is
most probably due to financial literacy. The main reasons users give for using M-PESA for
savings is ease of use (about 40 percent) and security (26 percent). Among the reasons
households gave for not using M-PESA for savings ("no reason" was the number one response),
most non-users mentioned having no need for it and lack of access. Mbiti & Weil (2011) do not
have the data required on sums saved to be able to estimate the impact of M-PESA on household
savings. Yet they do have information on the savings methods used, so they assess that M-PESA
has reduced the prevalence of informal savings (ROSCAs, savings with a group of friends, and
savings entrusted to a family or friend for safekeeping) by 15 percentage points and reduced the
proportion of people saving money in secret places by 30 percentage points. Hence the formal
banking system and M-PESA complement each other rather than compete.
Demombynes & Thegeya (2012) investigate the mobile savings phenomenon in Kenya, using
data collected from a survey conducted for 6,083 individuals in 2010. They define an individual
as having "M-PESA savings" if s/he reports saving a portion of income and lists M-PESA as one
of the places for savings. A straightforward comparison of rates found by the survey shows that
65 percent of M-PESA users report having some savings, compared to 31 percent of those who
are not M-PESA users. To explain this difference in terms of extensive and intensive margins, the
two authors implement probit regressions where the dependent variable is the probability of
saving. Results show that controlling for standard variables (gender, marital status, etc.), those
who are registered M-PESA users are 32 percent more likely to report having some savings.
Using an instrumental variables (IV) strategy to correct for bias due to unobservable
characteristics6, they find that M-PESA registration increases the likelihood of having savings by
20 percent (extensive margin). They then assess the possible effects of M-PESA usage on sums
saved, regressing log average monthly savings sums on various explanatory variables and on a
5It has also a positive impact on employment. See the paper for more details.
6Demombynes & Thegeya (2012) use a community effect to instrument individual M-PESA registration, based on
the fraction of respondents in the sub-location who are registered with M-PESA.
7
dummy for M-PESA registration. In the OLS estimation, those who are registered with M-PESA
are found to save significantly more than those who are not registered (intensive margin).
However, in the IV estimation, the estimate is not statistically significant anymore.
In this brief review of literature, the use of m-banking services would appear to have a positive
effect on certain financial behavior such as the number of money transfers. However, impacts on
savings remain unclear.
Our paper sets out to contribute to this existing body of literature. We use quantitative estimates
to assess the impact of Orange's m-banking services on money transfers and savings behavior in
Madagascar. We do so by conducting a survey of 598 randomly selected individuals (users and
non-users), building two groups of individuals (non-users, who form the control group, and users,
who form the treatment group) and applying the matching methodology. This methodology is
relevant because it allows for a comparison between two groups of population considered as quite
similar from a statistical standpoint.
III. Main characteristics of the two subpopulations
In this section, we present the main characteristics of the two sub-populations: Orange customers
who use Orange Money (called "OM users" hereafter) and Orange customers who do not use
these services, i.e. Orange Basic clients (called "OB clients" hereafter7). We take a simple
statistical analysis to bring to light certain differences in savings and money transfer behavior.
III.1. Socioeconomic characteristics
As shown in Table 1, and compared to OB clients, OM users are younger, more likely to be men,
and more likely to be unmarried (27.6 percent against 12.7 percent in the OB client population).
Catholics and Protestants account for around 85 percent of the population overall, but there are
more Catholics in the OM user sub-population (44.4 percent) and more Protestants in the OB
client population (51.7 percent). Similarly, and irrespective of sub-population, both kinds of
customers typically have a good level of education: more than 90 percent of OM users say they
have attended secondary (41.8 percent) or higher education (52.1 percent), while the
corresponding figures for non-users are 45.5 percent and 45.5 percent, respectively.
7 To identify each population, the following question was asked: “Do you regularly use (at least once a month) one or
several Orange Money services?”
8
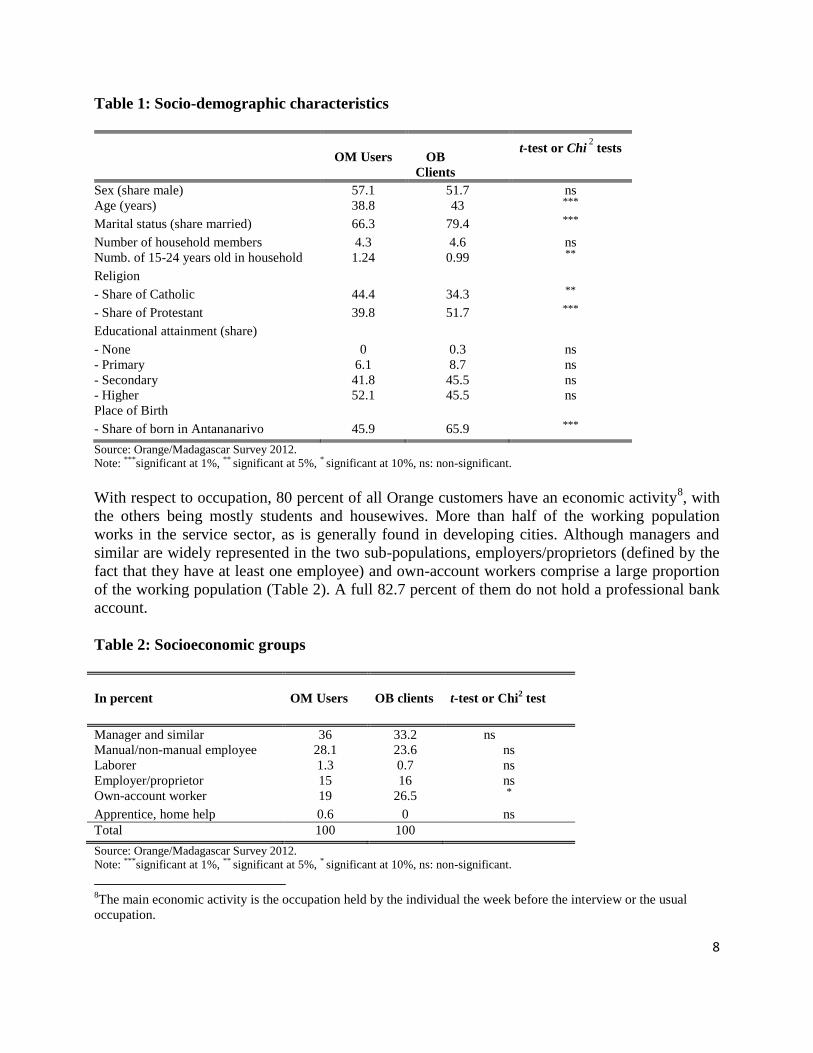
Table 1: Socio-demographic characteristics
OM Users
OB
Clients
t-test or Chi2
tests
Sex (share male) 57.1 51.7 ns Age (years) 38.8 43 ***
Marital status (share married) 66.3 79.4 ***
Number of household members 4.3 4.6 ns Numb. of 15-24 years old in household 1.24 0.99 **
Religion - Share of Catholic 44.4 34.3 **
- Share of Protestant 39.8 51.7 ***
Educational attainment (share) - None 0 0.3 ns - Primary 6.1 8.7 ns - Secondary 41.8 45.5 ns - Higher 52.1 45.5 ns Place of Birth - Share of born in Antananarivo 45.9 65.9 ***
Source: Orange/Madagascar Survey 2012.
Note: ***significant at 1%, ** significant at 5%, * significant at 10%, ns: non-significant.
With respect to occupation, 80 percent of all Orange customers have an economic activity8, with
the others being mostly students and housewives. More than half of the working population
works in the service sector, as is generally found in developing cities. Although managers and
similar are widely represented in the two sub-populations, employers/proprietors (defined by the
fact that they have at least one employee) and own-account workers comprise a large proportion
of the working population (Table 2). A full 82.7 percent of them do not hold a professional bank
account.
Table 2: Socioeconomic groups
In percent
OM Users
OB clients
t-test or Chi2 test
Manager and similar 36 33.2 ns Manual/non-manual employee 28.1 23.6 ns Laborer 1.3 0.7 ns Employer/proprietor 15 16 ns Own-account worker 19 26.5 *
Apprentice, home help 0.6 0 ns
Total 100 100 Source: Orange/Madagascar Survey 2012.
Note: ***significant at 1%, ** significant at 5%, * significant at 10%, ns: non-significant.
8The main economic activity is the occupation held by the individual the week before the interview or the usual
occupation.
9
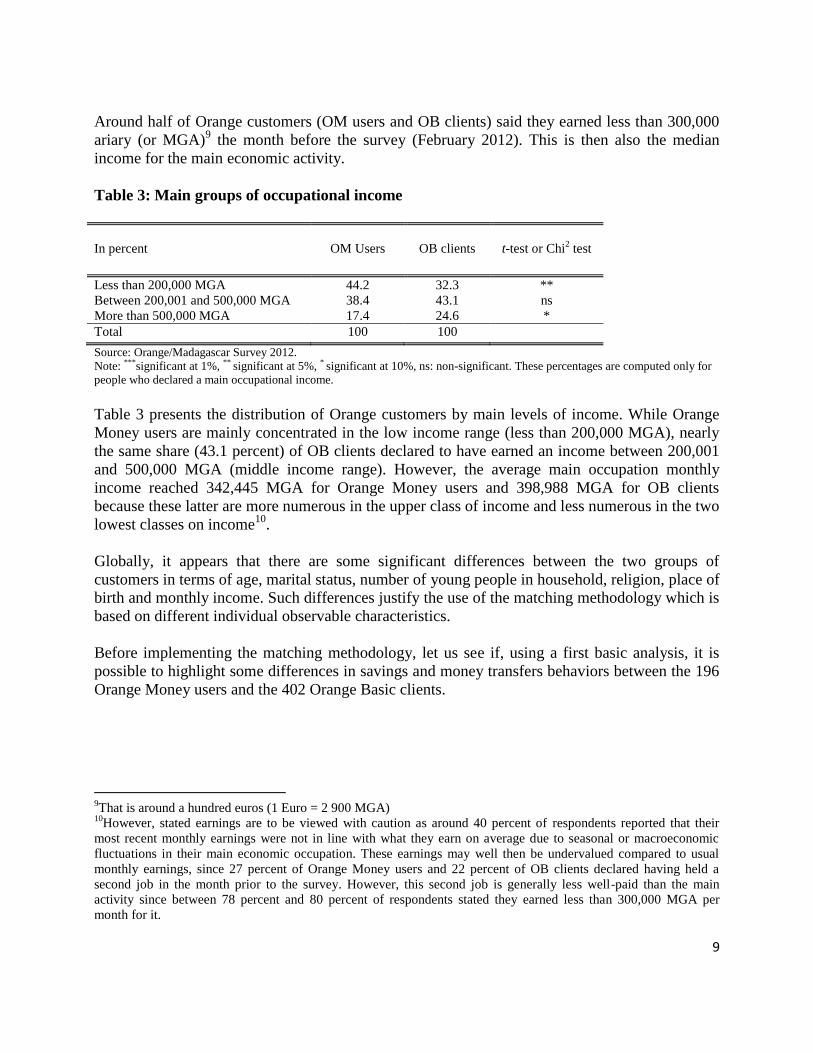
Around half of Orange customers (OM users and OB clients) said they earned less than 300,000
ariary (or MGA)9 the month before the survey (February 2012). This is then also the median
income for the main economic activity.
Table 3: Main groups of occupational income
In percent
OM Users
OB clients
t-test or Chi2 test
Less than 200,000 MGA 44.2 32.3 **
Between 200,001 and 500,000 MGA 38.4 43.1 ns
More than 500,000 MGA 17.4 24.6 *
Total 100 100 Source: Orange/Madagascar Survey 2012.
Note: ***significant at 1%, ** significant at 5%, * significant at 10%, ns: non-significant. These percentages are computed only for
people who declared a main occupational income.
Table 3 presents the distribution of Orange customers by main levels of income. While Orange
Money users are mainly concentrated in the low income range (less than 200,000 MGA), nearly
the same share (43.1 percent) of OB clients declared to have earned an income between 200,001
and 500,000 MGA (middle income range). However, the average main occupation monthly
income reached 342,445 MGA for Orange Money users and 398,988 MGA for OB clients
because these latter are more numerous in the upper class of income and less numerous in the two
lowest classes on income10
.
Globally, it appears that there are some significant differences between the two groups of
customers in terms of age, marital status, number of young people in household, religion, place of
birth and monthly income. Such differences justify the use of the matching methodology which is
based on different individual observable characteristics.
Before implementing the matching methodology, let us see if, using a first basic analysis, it is
possible to highlight some differences in savings and money transfers behaviors between the 196
Orange Money users and the 402 Orange Basic clients.
9That is around a hundred euros (1 Euro = 2 900 MGA)
10However, stated earnings are to be viewed with caution as around 40 percent of respondents reported that their
most recent monthly earnings were not in line with what they earn on average due to seasonal or macroeconomic
fluctuations in their main economic occupation. These earnings may well then be undervalued compared to usual
monthly earnings, since 27 percent of Orange Money users and 22 percent of OB clients declared having held a
second job in the month prior to the survey. However, this second job is generally less well-paid than the main
activity since between 78 percent and 80 percent of respondents stated they earned less than 300,000 MGA per
month for it.
10
III.2. Savings and money transfers: preliminary results
We focus here on formal savings, i.e. savings held with formal financial institutions (banks,
postal networks, MFIs, etc.). More than half of Orange customers (OM users and OB clients),
56.6 percent of Orange Money users and 52.7 percent of OB clients respectively, stated they had
one or more formal savings accounts.
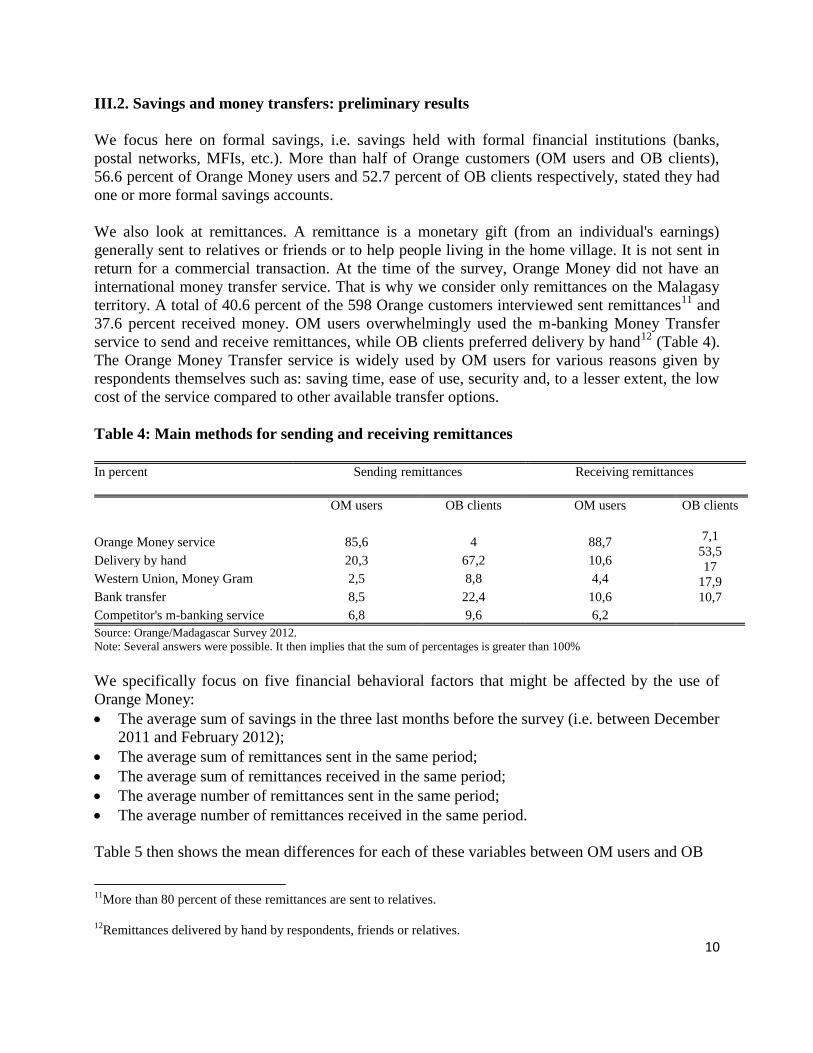
We also look at remittances. A remittance is a monetary gift (from an individual's earnings)
generally sent to relatives or friends or to help people living in the home village. It is not sent in
return for a commercial transaction. At the time of the survey, Orange Money did not have an
international money transfer service. That is why we consider only remittances on the Malagasy
territory. A total of 40.6 percent of the 598 Orange customers interviewed sent remittances11
and
37.6 percent received money. OM users overwhelmingly used the m-banking Money Transfer
service to send and receive remittances, while OB clients preferred delivery by hand12
(Table 4).
The Orange Money Transfer service is widely used by OM users for various reasons given by
respondents themselves such as: saving time, ease of use, security and, to a lesser extent, the low
cost of the service compared to other available transfer options.
Table 4: Main methods for sending and receiving remittances
In percent
Sending remittances Receiving remittances
OM users
OB clients OM users OB clients
7,1 53,5 17
17,9 10,7
Orange Money service 85,6 4 88,7
Delivery by hand 20,3 67,2 10,6
Western Union, Money Gram 2,5 8,8 4,4
Bank transfer 8,5 22,4 10,6
Competitor's m-banking service 6,8 9,6 6,2 Source: Orange/Madagascar Survey 2012.
Note: Several answers were possible. It then implies that the sum of percentages is greater than 100%
We specifically focus on five financial behavioral factors that might be affected by the use of
Orange Money:
The average sum of savings in the three last months before the survey (i.e. between December
2011 and February 2012);
The average sum of remittances sent in the same period;
The average sum of remittances received in the same period;
The average number of remittances sent in the same period;
The average number of remittances received in the same period.
Table 5 then shows the mean differences for each of these variables between OM users and OB
11
More than 80 percent of these remittances are sent to relatives.
12
Remittances delivered by hand by respondents, friends or relatives.
11
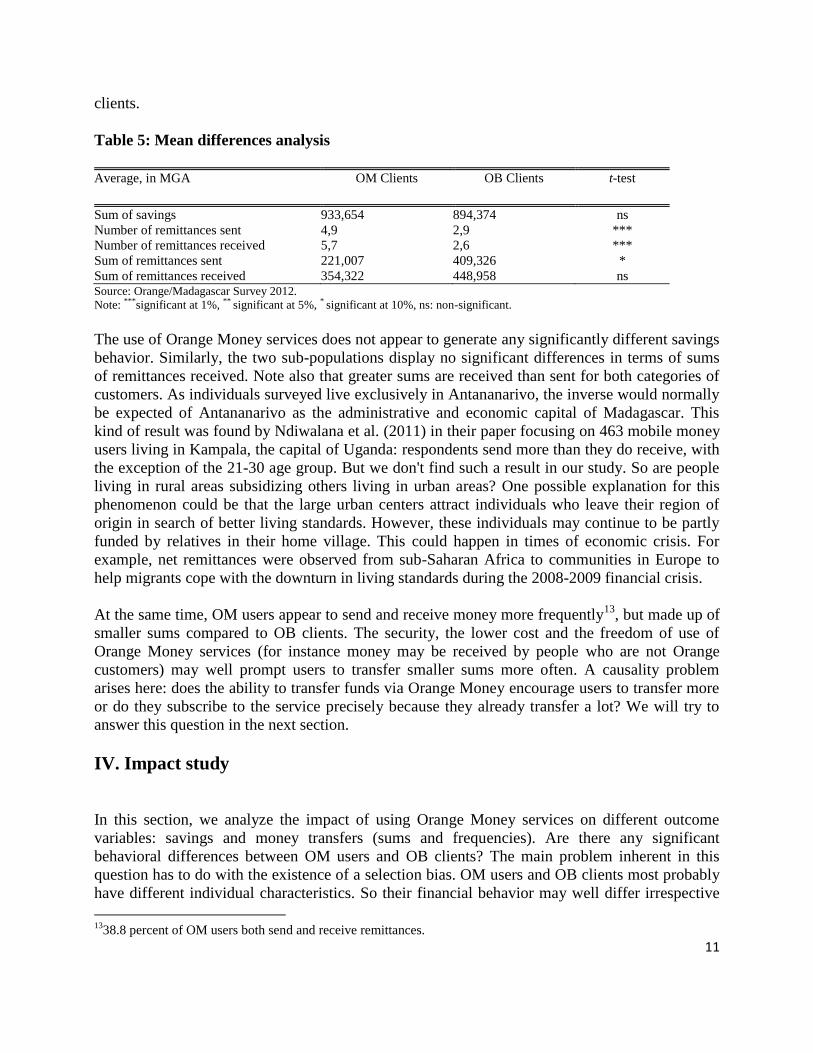
clients.
Table 5: Mean differences analysis
Average, in MGA
OM Clients OB Clients t-test
Sum of savings 933,654 894,374 ns Number of remittances sent 4,9 2,9 ***
Number of remittances received 5,7 2,6 ***
Sum of remittances sent 221,007 409,326 *
Sum of remittances received 354,322 448,958 ns Source: Orange/Madagascar Survey 2012.
Note: ***significant at 1%, ** significant at 5%, * significant at 10%, ns: non-significant.
The use of Orange Money services does not appear to generate any significantly different savings
behavior. Similarly, the two sub-populations display no significant differences in terms of sums
of remittances received. Note also that greater sums are received than sent for both categories of
customers. As individuals surveyed live exclusively in Antananarivo, the inverse would normally
be expected of Antananarivo as the administrative and economic capital of Madagascar. This
kind of result was found by Ndiwalana et al. (2011) in their paper focusing on 463 mobile money
users living in Kampala, the capital of Uganda: respondents send more than they do receive, with
the exception of the 21-30 age group. But we don't find such a result in our study. So are people
living in rural areas subsidizing others living in urban areas? One possible explanation for this
phenomenon could be that the large urban centers attract individuals who leave their region of
origin in search of better living standards. However, these individuals may continue to be partly
funded by relatives in their home village. This could happen in times of economic crisis. For
example, net remittances were observed from sub-Saharan Africa to communities in Europe to
help migrants cope with the downturn in living standards during the 2008-2009 financial crisis.
At the same time, OM users appear to send and receive money more frequently13
, but made up of
smaller sums compared to OB clients. The security, the lower cost and the freedom of use of
Orange Money services (for instance money may be received by people who are not Orange
customers) may well prompt users to transfer smaller sums more often. A causality problem
arises here: does the ability to transfer funds via Orange Money encourage users to transfer more
or do they subscribe to the service precisely because they already transfer a lot? We will try to
answer this question in the next section.
IV. Impact study
In this section, we analyze the impact of using Orange Money services on different outcome
variables: savings and money transfers (sums and frequencies). Are there any significant
behavioral differences between OM users and OB clients? The main problem inherent in this
question has to do with the existence of a selection bias. OM users and OB clients most probably
have different individual characteristics. So their financial behavior may well differ irrespective
13
38.8 percent of OM users both send and receive remittances.
12
of whether they use Orange Money. A suitable way to correct this selection bias is to use the
matching methodology to compare solely statistically identical individuals in both populations.
This is what we do here.
IV.1. The matching methodology
The matching methodology (Rubin, 1977; Rosenbaum & Rubin, 1983; Heckman et al., 1997) is a
statistical technique used to evaluate the effect of a treatment (for example, a program or public
policy) by comparing treated (treatment group) and untreated units (control group). The goal of
matching is to find, for every treated unit (public program recipient, for example), one or more
untreated unit(s) (e.g. people without access to the public program) with similar individual
observable characteristics (Brodaty et al., 2007). Once the matching has been conducted, the
average treatment effect can be calculated for people with access to the program (Average
Treatment Effect on the Treated or ATT). The counterfactual analysis enables evaluators to
attribute cause and effect between interventions and outcomes.
Let iT be a binary variable which takes the value iT 1 for individuals i having access to the
program (Orange Money users in the paper) and iT 0 for non-treated individuals (OB clients in
the paper). Let iY be the potential outcomes of the treatment: the sum of savings, the sum and the
frequency of money transfers. For example, considering that iY is the sum of savings, i1Y is the
amount of savings of an individual i who has access to the program and i0Y is the amount of
savings for an individual i who has no access to the treatment. The average treatment effect on
the treated ( ATT ) is:
i1 i i0 iATT E(Y | T 1) E(Y | T 1)
Because a given individual cannot simultaneously receive and not receive the treatment,
i0 iE(Y | T 1) is not observable. i0 iE(Y | T 0) can be substitute to i0 iE(Y | T 1) because the first
is an observable quantity. Yet doing this assumes that an OM user's savings behavior is identical
to that of an OB client, which holds only if treated units have the same individual characteristics
as untreated ones. To do so, we need the conditional independence assumption. This assumes that
there is a vector of individual characteristics (e.g. age, gender, etc.) that describe the individual
irrespective having access to the treatment or not.
Let X be the vector of individual characteristics, the conditional independence assumption is:
Yi1 ,Yi0 Ti X,X #
or i0 i i0 iE(Y | T 1) E(Y | T 0)
We use then the available information on untreated units to build a counterfactual for each treated
unit. The counterfactual measures how beneficiaries would have been otherwise without the
given intervention (Bonnard, 2011). Thus conditionally to the vector X of individual
characteristics, the non-observable counterfactual i0 iE(Y | T 1) is estimated by i0 iE(Y | T 0)
13
The counterfactual analysis enables evaluators to attribute cause and effect between interventions
and outcomes. This estimation calls for the careful choice of the covariates belonging to vector X.
On the one hand, the more accurate the vector X (i.e. the larger the vector X), the better the
matching process. Yet the larger vector X, the harder it is to find an identical untreated unit (i.e.
with exactly the same set of characteristics) for each treated unit. Rosenbaum and Rubin (1983)
suggest matching units using a propensity score built on the basis of vector X to overcome the
problem of the dimension of vector X.
The propension score P(X) is the probability of an individual belonging to the treatment group
(i.e. having access to the program) given the vector X of individual characteristics. As
Rosenbaum and Rubin (1983) put it, iP(X) P(T 1| X). Thus the property of independence
conditional on vector X is also true for P(X).
This probability is estimated for the whole sample (treated and untreated units) using a
multivariate estimation such as a logit or probit model. In this estimation, the dependent variable
is access or no access to the program and vector X is used as explanatory variable. Estimated
coefficients calculate the propensity score for each individual. In line with the common support
assumption, the matching process requires that each treated unit (i.e. Orange Money user) is
matched with a untreated unit (i.e. an Orange Basic client) whose propensity score is not too far
removed from the OM user's score.
Given the above, the average effect of the treatment on the treated units is:
i i i iATT E[E(Y | T 1,P(X)) E(Y | T 0,P(X))]
IV.2. Matching Orange Money users and Orange Basic clients
First, the matching process calls for an estimation of the individual probability of being an
Orange Money user conditionally on vector X. This vector includes a set of socioeconomic
observable variables supposed to be able to explain why an individual uses Orange Money
services. The estimation is presented in Table 6.
In Model 1, men do not have a significantly different probability to women of using Orange
Money. The same holds true for the level of education, religion and marital status. Age, however,
proves to be significant and decisive. Furthermore, the likelihood of being a regular Orange
Money user is higher for young individuals (negative effect of the "age" variable) and relatively
old people (positive effect of the "age squared" variable). The same goes for people born outside
of Antananarivo (negative effect of the "Antananarivo" variable), which may be explained by the
fact that geographical distance might encourage them to use Orange Money. In addition, the
higher the number of young people aged 15 to 25 within the household, the greater the
probability of being an Orange Money user. Lastly, in keeping with the descriptive analysis
above, which shows that OB clients earn more on average from their main economic activity than
OM users, Model 1 shows that the richer (middle and high income) the Orange customers, the
lower the probability of being an Orange Money user. This last result appears to contradict the
findings of certain previous studies on M-PESA in Kenya (for example, Jack & Suri, 2011)
14
where m-banking users are generally richer than non-users.
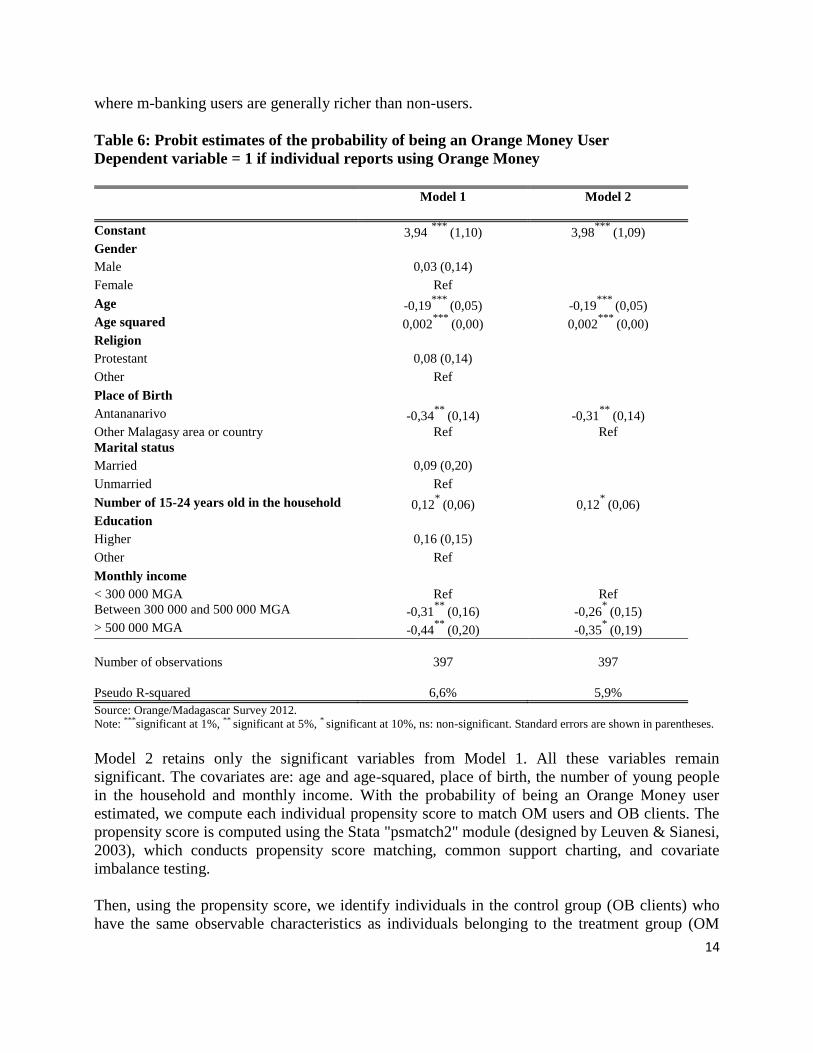
Table 6: Probit estimates of the probability of being an Orange Money User
Dependent variable = 1 if individual reports using Orange Money
Model 1
Model 2
Constant 3,94 ***
(1,10) 3,98***
(1,09) Gender Male 0,03 (0,14) Female Ref Age -0,19
*** (0,05) -0,19
*** (0,05)
Age squared 0,002***
(0,00) 0,002***
(0,00) Religion Protestant 0,08 (0,14) Other Ref Place of Birth Antananarivo -0,34
** (0,14) -0,31
** (0,14)
Other Malagasy area or country Ref Ref Marital status Married 0,09 (0,20) Unmarried Ref Number of 15-24 years old in the household 0,12
* (0,06) 0,12
* (0,06)
Education Higher 0,16 (0,15) Other Ref Monthly income < 300 000 MGA Ref Ref Between 300 000 and 500 000 MGA -0,31
** (0,16) -0,26
* (0,15)
> 500 000 MGA -0,44**
(0,20) -0,35*
(0,19)
Number of observations
397
397
Pseudo R-squared
6,6%
5,9% Source: Orange/Madagascar Survey 2012.
Note: ***significant at 1%, ** significant at 5%, * significant at 10%, ns: non-significant. Standard errors are shown in parentheses.
Model 2 retains only the significant variables from Model 1. All these variables remain
significant. The covariates are: age and age-squared, place of birth, the number of young people
in the household and monthly income. With the probability of being an Orange Money user
estimated, we compute each individual propensity score to match OM users and OB clients. The
propensity score is computed using the Stata "psmatch2" module (designed by Leuven & Sianesi,
2003), which conducts propensity score matching, common support charting, and covariate
imbalance testing.
Then, using the propensity score, we identify individuals in the control group (OB clients) who
have the same observable characteristics as individuals belonging to the treatment group (OM
15
users). Since it is generally impossible to find two individuals (the first belonging to the control
group and the second to the treatment group) with exactly the same propensity score, a broad
consensus has been reached on two different ways to conduct the matching process: "nearest
neighbor" matching and "kernel" matching.
In the nearest neighbor matching process, each treated unit (i.e. each OM user) is matched with
one untreated unit (i.e. an OB client), whose propensity score is the nearest possible to the treated
unit. As usual, we apply this method with replacement, in that a control unit can be a best match
for more than one treated unit. But there may be a problem of poor matching if the propensity
scores are too far one from each other. So, before performing the matching, a common support
region is defined. The common support region excludes treated units (OM users) whose
propensity score is higher than the highest propensity score of the control units (OB clients) and
control units whose propensity scores are lower than the lowest propensity score of the treated
units (Smith & Todd, 2005; Bonnard, 2011). However once the common support region is
established, the nearest available neighbor matching method might fail to find a match for some
of the treated units. This leads us to remove five (i.e. 1.3 percent) of the 397 observations used to
compute the propensity score.
In the kernel matching method (Heckman et al., 1997, 1998), every treated subject (i.e. OM user)
is matched with the weighted average of the control subjects (OB client). The weights are
inversely proportional to the distance between the treated and control group's propensity scores.
In his paper published in 2007, Frölich shows that the kernel method is more accurate than the
nearest neighbor process.
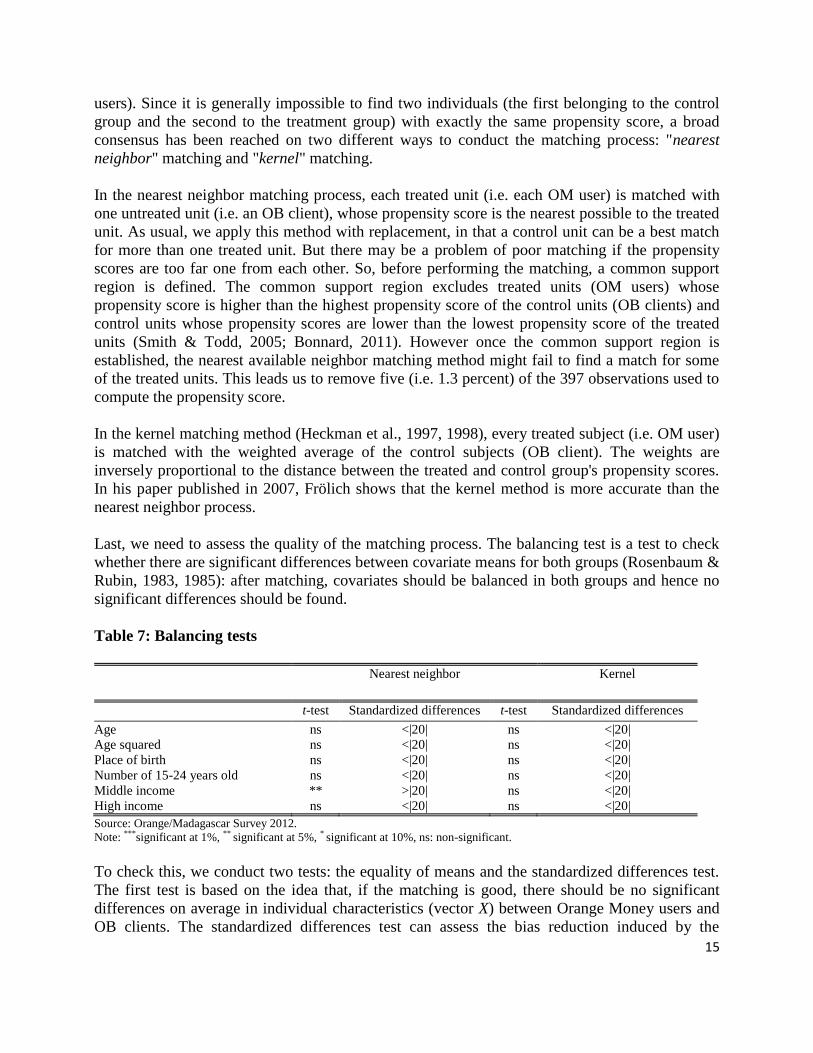
Last, we need to assess the quality of the matching process. The balancing test is a test to check
whether there are significant differences between covariate means for both groups (Rosenbaum &
Rubin, 1983, 1985): after matching, covariates should be balanced in both groups and hence no
significant differences should be found.
Table 7: Balancing tests
Nearest neighbor
Kernel
t-test Standardized differences t-test Standardized differences
Age ns <|20| ns <|20| Age squared ns <|20| ns <|20| Place of birth ns <|20| ns <|20| Number of 15-24 years old ns <|20| ns <|20| Middle income ** >|20| ns <|20| High income ns <|20| ns <|20| Source: Orange/Madagascar Survey 2012.
Note: ***significant at 1%, ** significant at 5%, * significant at 10%, ns: non-significant.
To check this, we conduct two tests: the equality of means and the standardized differences test.
The first test is based on the idea that, if the matching is good, there should be no significant
differences on average in individual characteristics (vector X) between Orange Money users and
OB clients. The standardized differences test can assess the bias reduction induced by the
16
matching process. Rosenbaum & Rubin (1983) consider that a standardized difference above 20
(in absolute value) is too large to judge the matching process efficient. Table 7 presents the
results of balancing tests.
Of all the balancing tests conducted, there seems to be a problem only with the "Middle Income"
covariate when we use the nearest neighbor matching method. Yet when we use the kernel
method, which Rosenbaum & Rubin (1983) deem the best matching process, the balancing
property always holds. The propensity score "balances" the set of covariates that explain the
probability of being an Orange Money user. Consequently, assuming that OM users and OB
clients' unobservable characteristics are the same, differences between the two groups in terms of
savings, money transfers, and so on may be due to the use of Orange Money.
IV.3. Impacts of using Orange Money
We focus on five financial behavioral factors that may be altered by the use of Orange Money:
the sum saved, the number and sum of remittances sent and the number and sum of remittances
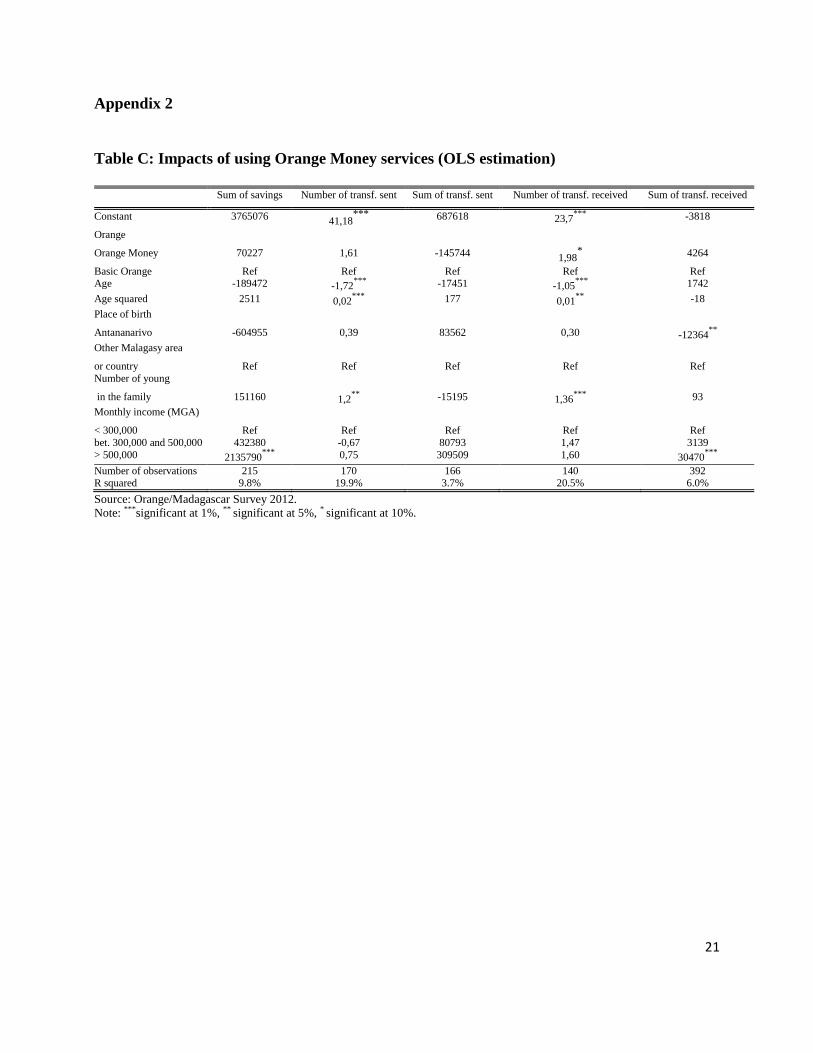
received. Before using the matching method, we conduct a simple OLS estimation of these five
financial behavioral factors taking the Orange customer's status (OM user or OB client) as one of
the covariates14
. This covariate is only ever statistically significant once: being an OM user has a
positive influence on the number of remittances received in the three months before the survey.
However, the OLS estimation is by no means satisfactory. Even if we reason on the basis of all
other things being equal, the OLS estimation in effect compares the behavior of two sub-
populations whose initial differences may affect their likelihood of using Orange Money services
and consequently their savings and money transfer behavior indirectly.
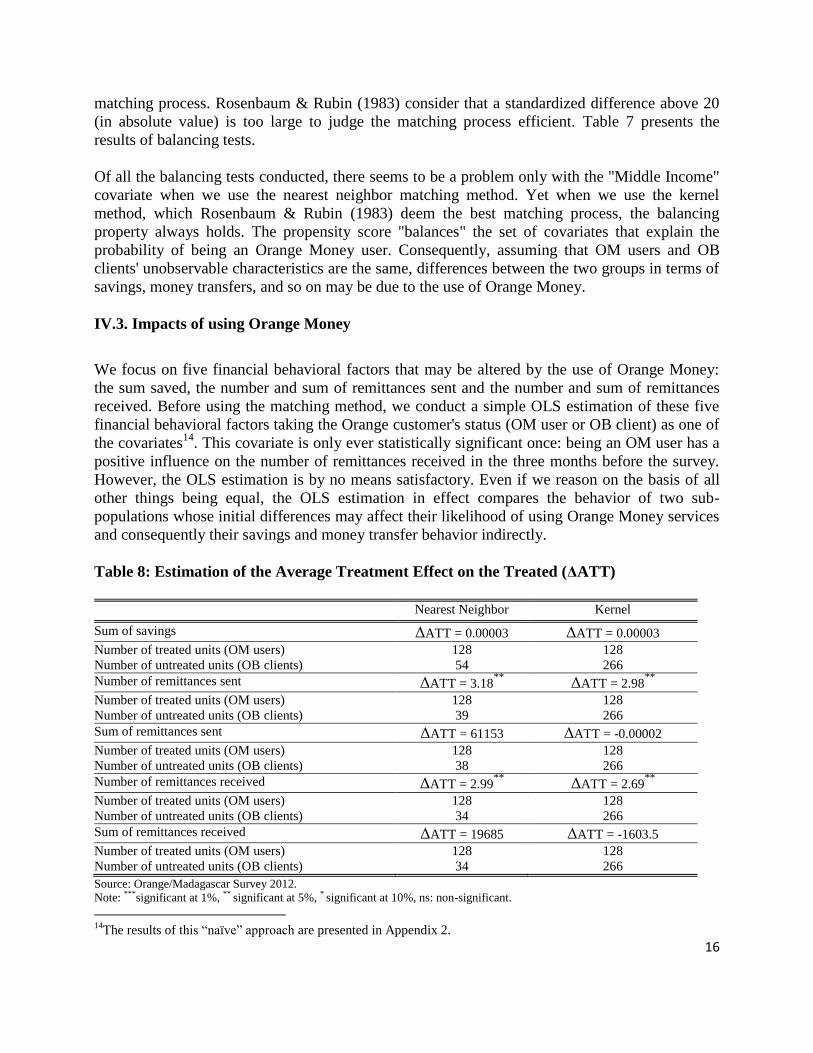
Table 8: Estimation of the Average Treatment Effect on the Treated (ΔATT)
Nearest Neighbor Kernel
Sum of savings ΔATT = 0.00003 ΔATT = 0.00003 Number of treated units (OM users) 128 128 Number of untreated units (OB clients) 54 266 Number of remittances sent ΔATT = 3.18
** ΔATT = 2.98
**
Number of treated units (OM users) 128 128 Number of untreated units (OB clients) 39 266 Sum of remittances sent ΔATT = 61153 ΔATT = -0.00002 Number of treated units (OM users) 128 128 Number of untreated units (OB clients) 38 266 Number of remittances received ΔATT = 2.99
** ΔATT = 2.69
**
Number of treated units (OM users) 128 128 Number of untreated units (OB clients) 34 266 Sum of remittances received ΔATT = 19685 ΔATT = -1603.5 Number of treated units (OM users) 128 128 Number of untreated units (OB clients) 34 266 Source: Orange/Madagascar Survey 2012.
Note: ***significant at 1%, ** significant at 5%, * significant at 10%, ns: non-significant. 14
The results of this “naïve” approach are presented in Appendix 2.
17
We therefore opt for the Average Treatment Effect on the Treated analysis, which is based on the
matching of the two sub-populations. ATT is obtained as follows: each treated individual is
paired with an untreated individual, and then the difference is calculated between the outcomes
(the sum of savings, for example) for treated individuals and untreated individuals. So ΔATT is
merely the average of these differences (Becker & Ichino, 2002). The results are presented in
Table 8 using two different matching methods: nearest neighbor and kernel matching15
.
We first note that the estimated effects using nearest neighbor matching are larger than those
estimated using the kernel method. This is because nearest neighbor matching is less accurate.
The example of sums sent and received illustrates the sensitivity of the results to the kind of
matching method used. However, irrespective of the matching method used, the numbers of sent
and received remittances point up a significant difference between OM users and the OB clients
with whom they are matched. Orange Money users send and receive remittances significantly
more frequently (ΔATT is positive and statistically significant). This positive effect may be
explained by:
The lower cost of the Orange Money transfer service (compared to Western Union, Money
Gram, etc.);
The secure nature of the money transfer;
And the ease of use of this service.
By contrast, there are no significant differences between the sums of remittances sent and
received (in the three months before the survey) by OM users and OB clients. This means that
sums of remittances are statistically equivalent for Orange customers irrespective of the sub-
population, despite the fact that Orange Money users send and receive remittances more
frequently. Similarly, sums saved by Orange Money users and OB clients are not statistically
different (ΔATT is not statistically significant).
As it has already been mentioned, the matching process relies solely on individual observable
characteristics. It means that this methodology does not take into account the unobserved
individual heterogeneity. Some unobservable individual characteristics may have nevertheless an
impact on users' financial behavior but we are unable to control for them because of the matching
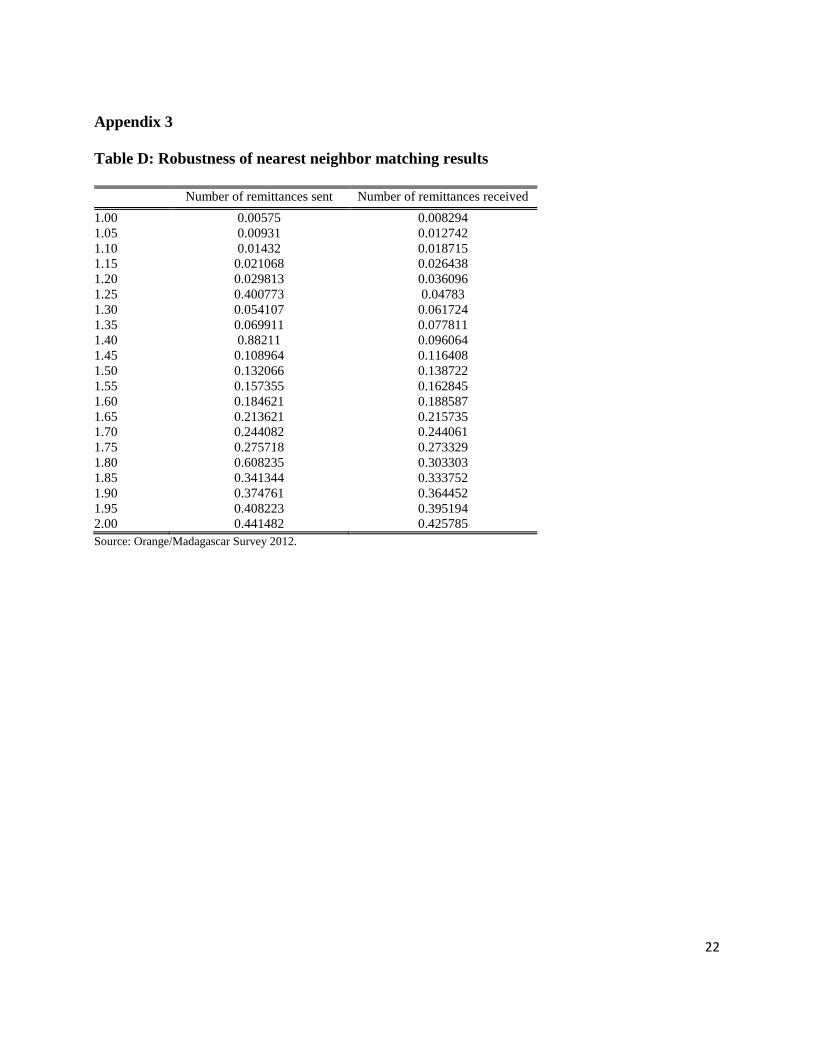
process. However, we implement the sensitivity analysis proposed by Rosembaum (2002) to
assess the robustness of our estimation results. To do so, we perform two Wilcoxon signed-rank
tests16
(see Appendix 3, Table D) on the number of remittances sent and received. Critical
thresholds from which estimation results may be questionable (at the significance level of 10%)
are 1.45 for both variables. In other words, a change of 45 percent in the odds ratio of being an
OM user should create a bias in our estimations because of unobservable individual
characteristics. Considering this threshold, it seems that our estimation results are quite robust.
Our results are in line with the findings of a number of previous studies on M-PESA in Kenya.
15
In the kernel method, we have to compute the standard deviation again using the bootstrap method to overcome the
fact that the propensity score is estimated rather than observed (Abadie & Imbens, 2008) 16
The Wilcoxon test should only be used on the nearest neighbor matching process.
18
Jack & Suri (2011) find that M-PESA users use the service more for savings when they already
have a bank account. Yet they provide no information on the potential impact of the use of M-
PESA on the sum of savings. They also find that M-PESA users transfer money more frequently
than non-users. Lastly, they find that the sums of remittances sent and received by M-PESA users
depend on how long people have been using the M-PESA services: the longer they have been
using M-PESA, the greater the probability that users have altered their remittance sums. So our
findings that using Orange Money has no impact on sums of savings or sums of remittances sent
and received may be explained by the fact that, given the short period since the launch of Orange
Money, users have not yet changed their financial behavior. A learning-by-doing process is
probably at work here: people need to learn to trust the m-banking system first before they start
using the Orange Money services to transfer large sums of money or save more. And it probably
takes time to build a climate of trust and confidence. This is probably why, even though m-
banking may be a way to bank the unbanked, it is not so simple because the process needs time to
encourage people to alter their financial behavior. Lastly, until such time as m-banking services
change individual microeconomic characteristics (income, consumption, employment, etc.),
Orange Money users have no incentives and no ability to change their financial behavior. By
contrast, things are different regarding the number of remittances sent and received. As
mentioned before, the low cost, security and ease of use of transferring money on the m-banking
service encourages Orange Money clients to be quick to use it.
Our results are also to be compared with the perceptions of Orange Money users. A total of 55
percent of Orange Money users who use the Money Transfer service believe they now transfer
money more frequently. This subjective perception is consistent with what we find in our
matching analysis. However, among Orange Money users who deposit money into their Orange
Money accounts, 62.7 percent rate the impact of the deposit service on their savings as positive.
Our analysis is not consistent with that view. Should we then conclude that OM customers have a
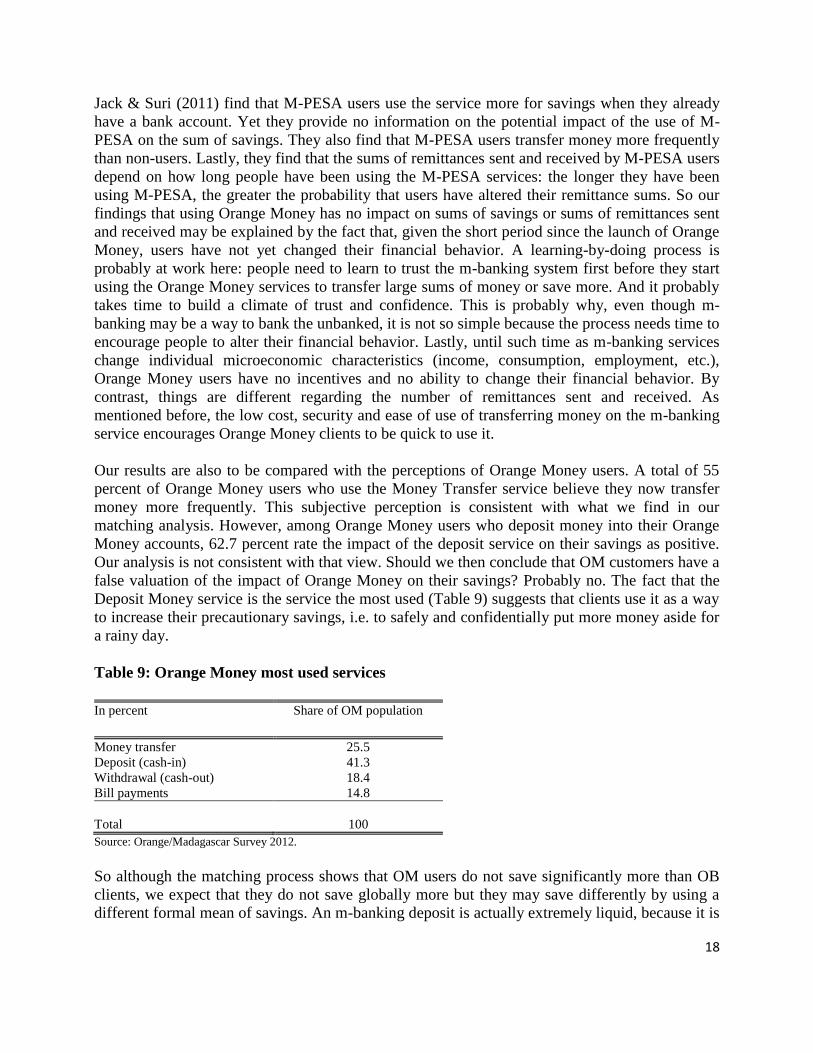
false valuation of the impact of Orange Money on their savings? Probably no. The fact that the
Deposit Money service is the service the most used (Table 9) suggests that clients use it as a way
to increase their precautionary savings, i.e. to safely and confidentially put more money aside for
a rainy day.
Table 9: Orange Money most used services
In percent
Share of OM population
Money transfer 25.5 Deposit (cash-in) 41.3 Withdrawal (cash-out) 18.4 Bill payments 14.8
Total
100 Source: Orange/Madagascar Survey 2012.
So although the matching process shows that OM users do not save significantly more than OB
clients, we expect that they do not save globally more but they may save differently by using a
different formal mean of savings. An m-banking deposit is actually extremely liquid, because it is
19
very easy to convert m-money into cash and vice versa. This liquidity means that users may
choose to save using m-banking rather than other less liquid forms (jewelry, for example) or
other formal savings deposits.
In an economic development perspective, such a savings behavior may improve risk
management. It may then encourage users to invest when a good opportunity arises, and
encourage them to open a bank account and apply for credit. Actually, a high number of OM
users stated they had been encouraged to open a bank account. However, only 38.7 percent
considered that frequent use of the Money Deposit service made it easier to apply for credit. So
m-banking may help familiarize users with formal financial behavior, encouraging them to move
closer to the formal financial institutions. Similarly, the positive impact that using this service has
on savings sends a positive signal to formal lenders about saving users' credit repayment
capacities. This may then, as was mentioned by Jack & Suri (2011), have a positive impact on the
economy.
V. Conclusion
Our article sets out to assess the impact of m-banking services on users' financial behavior.
Orange has been rolling out Orange Money services in Madagascar since September 2010. We
conducted a survey of 196 regular Orange Money users and 402 Basic Orange clients in March
2012 to see if there had been any changes in users' financial behavior. We use the matching
method to improve the quality of our analysis by focusing on comparable individuals, i.e. those
with the same probability of being an Orange Money user. Treated units (OM users) are matched
with untreated individuals (OB clients) based on their propensity score. We find that only the
frequencies of remittances sent and received are positively affected by the use of the Orange
Money services: neither sums of money transfers nor sums saved are on average significantly
different from one sub-population to the other. We explain our results by positing that individuals
may need more time (they may need to learn to trust the m-banking system) to change the sums
they save and transfer using this service, whereas it seems much easier to change money transfer
method because the m-banking service is cheaper and safer.
Yet, like most econometric analyses, the matching method has its limitations. It can correct
observable heterogeneity between individuals. However, it can only account for observed (and
observable) covariates. Factors that affect assignment to treatment, but that cannot be observed
cannot be accounted for by the matching procedure. In this case in point, the probability of being
an Orange Money user is determined by a set of observable covariates, but this study cannot take
into account certain unobservable characteristics such as a taste for technical innovation, a
business spirit, etc. Without any panel data, we were unable to use the IV method to correct the
biases due to unobservable characteristics. This is why we chose the matching methodology in
our paper.

20
Appendices
Appendix 1
Table A: Fees for deposit (cash-in) and bill payments processing for Orange Money clients
Services Orange Money fees
Deposit
free Bill payments free Source: Orange/Madagascar
Table B: Fees for withdrawal (cash-out) and domestic remittances sent for Orange Money
clients
Amounts (in MGA)
Remittances sent Withdrawal
Less than 5 000 20 200 Bet. 5 001 and 10 000 50 400 Bet. 10 001 and 25 000 100 900 Bet 25 001 and 50 000 200 1 900 Bet 50 001 and 100 000 250 2 400 Bet 100 001 and 250 000 500 5 000 Bet 250 001 and 500 000 750 7 500 Bet 500 001 and 1 000 000 1 000 10 000 Bet 1 000 001 and 2 000 000 1 500 15 000 Bet 2 000 001 and 3 000 000 2 000 20 000 Bet 3 000 001 and 4 000 000 2 500 25 000 Bet 4 000 001 and 5 000 000 3 000 30 000 Source: Orange/Madagascar
21
Appendix 2
Table C: Impacts of using Orange Money services (OLS estimation)
Sum of savings Number of transf. sent Sum of transf. sent Number of transf. received Sum of transf. received
Constant 3765076 41,18*** 687618 23,7
*** -3818
Orange Orange Money 70227 1,61 -145744 1,98
* 4264
Basic Orange Ref Ref Ref Ref Ref Age -189472 -1,72
*** -17451 -1,05
*** 1742
Age squared 2511 0,02***
177 0,01**
-18 Place of birth Antananarivo -604955 0,39 83562 0,30 -12364
**
Other Malagasy area or country Ref Ref Ref Ref Ref Number of young in the family 151160 1,2
** -15195 1,36
*** 93
Monthly income (MGA) < 300,000 Ref Ref Ref Ref Ref bet. 300,000 and 500,000 432380 -0,67 80793 1,47 3139 > 500,000 2135790
*** 0,75 309509 1,60 30470
***
Number of observations 215 170 166 140 392 R squared 9.8% 19.9% 3.7% 20.5% 6.0% Source: Orange/Madagascar Survey 2012.
Note: ***significant at 1%, ** significant at 5%, * significant at 10%.
22
Appendix 3
Table D: Robustness of nearest neighbor matching results
Number of remittances sent Number of remittances received
1.00 0.00575 0.008294 1.05 0.00931 0.012742 1.10 0.01432 0.018715 1.15 0.021068 0.026438 1.20 0.029813 0.036096 1.25 0.400773 0.04783 1.30 0.054107 0.061724 1.35 0.069911 0.077811 1.40 0.88211 0.096064 1.45 0.108964 0.116408 1.50 0.132066 0.138722 1.55 0.157355 0.162845 1.60 0.184621 0.188587 1.65 0.213621 0.215735 1.70 0.244082 0.244061 1.75 0.275718 0.273329 1.80 0.608235 0.303303 1.85 0.341344 0.333752 1.90 0.374761 0.364452 1.95 0.408223 0.395194 2.00 0.441482 0.425785 Source: Orange/Madagascar Survey 2012.
23
References
Abadie A. & Imbens G. (2008), “On the failure of the bootstrap for matching estimators”,
Econometrica, 76(6), pp. 1537-1557.
Becker S.O. & Ichino A. (2002), “Estimation of average treatment effects based on propensity
scores”, The Stata Journal, Vol. 2, Number 4, pp. 358—377.
Bonnard C. (2011), « Les incitations à l'innovation dans le secteur privé », 28èmes
Journées de
Microéconomie Appliquées, Sousse, Tunisia.
Brodaty T., Crepon B., & Fougère D. (2007), "Les méthodes micro-économétriques d'évaluation
et leurs applications aux politiques actives de l'emploi", Economie et Prévision, Vol.1, n°177,
pp.93-118.
Demirguc-Kunt, A & Klapper, L. (2012), “Measuring Financial Inclusion, The Global Findex
Database”, Policy Research Working Paper 6025, World Bank
Demombynes, G & Thegeya, A. (2012), Kenya's Mobile Revolution and the Promise of Mobile
Savings, Policy Research Working Paper 5988, World Bank.
Heckman J., Ichimura, H., Smith, J. & Todd, P. (1997), “Matching as an Econometric Evaluation
Estimator: Evidence from Evaluating a Job Training Programme”, Review of Economic Studies,
n° 64, pp.605-654.
Heckman J., Ichimura H. & Todd P. (1998), “Matching as an Econometric Evaluation
Estimator”, Review of Economic Studies, n° 65, pp.261-294.
Ivatury, G., & Pickens, M. (2006). “Mobile phone banking and low-income customers: Evidence
from South Africa”, CGAP and the United Nations Foundation.
Jack, W. & Suri, T (2011), “Mobile Money: The Economics of M-PES”, NBER Working Paper
16721
Kapoor, M., Morduch, J. & Ravi, S. (2007), “From Microfinance to m-Finance”, Innovations:
Technology, Governance, Globalization, Winter/Spring Vol. 2, n°. 1-2: 82-90.
Leuven E.& Sianesi B. (2003), “Psmatch2: Stata module to perform full Mahalanobis and
propensity score matching, common support graphing, and covariate imbalance testing”,
http://ideas.repec.org/c/boc/bocode/s432001.html.
Mbiti, I. & Weil, D. (2011), “Mobile Banking: the Impact of M-PESA in Kenya”, NBER Working
Paper 17129.
Morawczynski, O. & Pickens, M. (2009). “Poor People Using Mobile Financial Services:
24
Observations on Customer Usage and Impact from M-PESA”, CGAP Brief Online.
Ndiwalana, A., Morawczynski, O., & Popov, O. (2011), “Mobile Money Use in Uganda: A
Preliminary Study”. PHB Development report & Kurt Salmon.
Rosembaum P.R (2002), Observational Studies, New York: Springer Verlag.
Rosembaum P.R. & Rubin D.B. (1983), “The Central Role of the Propensity Score in
Observational Studies for Causal Effects", Biometrika, 70(1), pp.41-55.
Rosenbaum, P.R. and Rubin, D.B. (1985). “Constructing a Control Group Using Multivariate
Matched Sampling Methods that Incorporate the Propensity Score”, American Statistician, 3, pp.
33-38.
Rubin D. (1977), “Assignement to Treatment Group on the Basis of a Covariate”, Journal of
educational Statistics, Vol.2 (1).
Smith, J.A. & Todd, P.E. (2005), “Does matching overcome LaLonde's critique of
nonexperimental estimators?”, Journal of Econometrics 125, pp. 305--353.
2
FINANCIAL BEHAVIOR AND MOBILE BANKING IN MADAGASCAR: LEARNING TO WALK BEFORE YOU RUN1
Florence Arestoff
PSL, Université Paris-Dauphine, LEDa, UMR DIAL, 75016 Paris, France
IRD, UMR DIAL, 75010 Paris
Baptiste Venet
PSL, Université Paris-Dauphine, LEDa, UMR DIAL, 75016 Paris, France
IRD, UMR DIAL, 75010 Paris
Document de travail UMR DIAL Septembre 2013
Abstract
In Madagascar, Orange introduced its mobile banking services in September 2010. Mobile-banking (m-banking) is a system that allows users to conduct a number of financial transactions through a mobile phone. The existing body of literature suggests that the use of m-banking services may have a positive impact on individual savings, affect money transfer behavior and/or encourage financial inclusion. In 2012, we conducted a survey of 598 randomly selected Orange clients in Antananarivo. We use the matching methodology to assess the impacts of m-banking on clients' financial behavior. The results show that the use of m-banking services increases the number of national remittances sent and received. It is in line with the conclusions of the existing literature devoted to M-Pesa in Kenya. Yet we find that using of m-banking services has no significant impact on the sums saved by users or the sums of remittances sent and received, which appears to contradict the users' perceptions. This result may, however, be explained by a learning-by-doing process: users need to first learn to trust the e-money system before making any significant changes to their financial behavior.
Key words: Mobile banking, Financial behavior, Low Income countries, Matching methodology.
Résumé
En septembre 2010, l’opérateur Orange a introduit les services de banque mobile appelés Orange Money à Madagascar. Ils permettent d’effectuer des opérations de dépôt et de retrait d’argent, de transferts nationaux et de paiements de marchandises. Selon la littérature existante, l’utilisation de ces services engendrerait une augmentation de l’épargne individuelle, pourrait modifier les comportements de transferts et/ou favoriser la bancarisation des plus pauvres. Afin d’analyser les conséquences du m-banking sur les comportements financiers des populations concernées à Madagascar, nous procédons à une étude d’impact reposant sur des données originales. En mars 2012, nous avons réalisé une enquête auprès de 196 clients Orange utilisateurs réguliers des services Orange money et 402 clients Orange non utilisateurs de ces services. Afin de comparer rigoureusement les comportements financiers de ces deux groupes, nous apparions les individus sur la base de leurs scores de propension respectifs. Nos résultats montrent alors que l’utilisation des services Orange Money conduit à accroître significativement la fréquence des transferts envoyés et reçus. Ce résultat est corroboré par l’approche subjective puisque 55% des utilisateurs Orange Money déclarent que ce service les a encouragés à effectuer des transferts plus fréquemment. En revanche, nous montrons qu’Orange Money n’a d’impact significatif ni sur les montants épargnés ni sur les montants transférés (à l’envoi comme à la réception), ce qui tend à contredire le sentiment des utilisateurs. La temporalité des effets des services de m-banking apparaît alors. Les modifications de montants transférés et épargnés s’inscrivent probablement davantage dans la durée alors que la fréquence des transferts serait plus rapidement affectée eu égard au moindre coût et à la facilité d’utilisation d’Orange Money.
Mots Clés : Banque mobile, Matching, Comportements financiers, Pays en développement.
JEL Code: G2, G21, O16.
1 We gratefully thank Ariane Szafarz and two discussants at the 47
th Annual Conference of the CEA and at the
3rd
European Research Conference on Microfinance for valuable comments on a previous version of this
paper.