lecture 1 : precalculus reviewapilking/math10560/calc1lectures/1. review precalc .pdflecture 1 :...
TRANSCRIPT
Lecture 1 : Precalculus Review
Hyperlinks are shown in blue, download the cdf player from the Wolfram Alpha website to view theWolfram Alpha interactive demonstrations. When you have downloaded the cdf player, click on
this symbol to view the demonstration.
Functions(A more detailed review can be found in Lecture 10 under Algebra/Precalculus Review / Lectures
for Calc. 1 Prep. on our website.)
A function arises when one quantity depends on another. Many everyday relationships between variablescan be expressed as functions.
Example Consider the volume of a cylindrical glass with radius = 1 inch. We have a formula for thevolume; V = πr2h = πh in3, where h is the height of the glass in inches and r = 1 is the radius.
We see that the value of the volume depends on the height, h; V is a function of h. We sometimesindicate that the value of V depends on the value of h, by writing the formula as V (h) = πh in3.
When h = 2, V = V (2) = and when h = 3, V = V (3) =
Example The cost of (short-term) parking at South Bend airport depends on how long you leaveyour car in the short term lot. The parking rates are described in the following table:
First 30 minutes Free31-60 minutes $2
Each additional hour $224 hour maximum rate $13
The Cost of Parking is a function of the amount of time the car spends in the lot. If we are to createa formula for the cost of parking = C, in terms of how long our car stays in the lot = t, we need to givethe formula piece by piece as follows:
C(t) =
$0 0 ≤ t ≤ 0.5 hr.$2 0.5 hr. < t ≤ 1 hr.$4 1 hr. < t ≤ 2 hr.$6 2 hr. < t ≤ 3hr.$8 3 hr. < t ≤ 4 hr.$10 4 hr. < t ≤ 5 hr.$12 5 hr. < t ≤ 6 hr.$13 6 hr. < t ≤ 24 hr.
$13 + cost of towing t > 24 hr.
This is an example of a piecewise defined function.
The formal definition of a function is as follows:
Definition A function f is a rule which assigns to each element x of a set D, exactly one element,f(x), of a set E. The Domain of a function f is the set D, the set of all values of x, for which f(x) isdefined. The Range of the function f is the set of all elements of the target set E which have the formf(x), for some x in D.
1
We can represent functions in four ways, verbally(a description in words), visually(a set theoreticpicture or a graph on the xy-plane), numerically(using a table of values) and algebraically(by anexplicit formula).
Algebraic Representation of Functions
All of the functions that we will consider in this course will have a numerical domain and range. Mostcan be described by giving a a formula for f(x), as in Examples 1 and 2. If we are given a formulafor a function f , unless otherwise specified, we assume that the domain is the set of all real numbersfor which the formula makes sense; domain of f = {x ∈ R|f(x) exists}. The range is the set of allnumbers of the form f(x), range of f = {f(x)|x ∈ Domain of f}.
Example Let f(x) = x2
x−1. What is the domain of f?
What is f(1 + 1100
)?
What is f(1 + h)?
What is f(0+h)−f(0)h
?
Note that f(x) = |x| is really a piecewise defined function with formula:
f(x) =
{−x x ≤ 0x x > 0
.
Example Write h(x) = |x− 1| as a piecewise defined function.
Graphs on the Cartesian Plane(A more detailed review can be found in your online homework under graphing and functions andin Lecture 8 and Lecture 11 under Algebra/Precalculus Review / Lectures for Calc. 1
Prep. on our website.)
When we give a formula, f(x), describing the value of f at any point x in the domain, the values of xvary over all values in the domain. Hence x is a variable, called the independent variable. Witheach function, f , described by such a formula f(x), we can associate an equation y = f(x). Forexample, if f(x) =
√x, then the associated equation is y =
√x. Thus we create a new variable y, whose
2
values vary over the values in the range of the function. Note the value of y depends on the value of x,hence y is called a dependent variable. The graph of a function f , with associated formulaf(x), is the set of all points (x, y) on the xy-plane that satisfy the equation y = f(x). Thisis just a picture of all points of the form (x, f(x)) on the plane.
You should already be very familiar with the graphs shown in the catalogue at the end of the lecture.
For any function, every value in the domain gives one and only one value in the range when we applythe formula, as a result, each vertical line in the xy-plane cuts the graph of a function at most once.In fact, as we will see below, this is the defining characteristic of a graph of a function.
The domain of a function can be identified from the graph as the set of all values of x for which avertical line through x cuts the graph. The range of a function can be identified from the graph as theset of all values of y for which a horizontal line through y cuts through the graph.
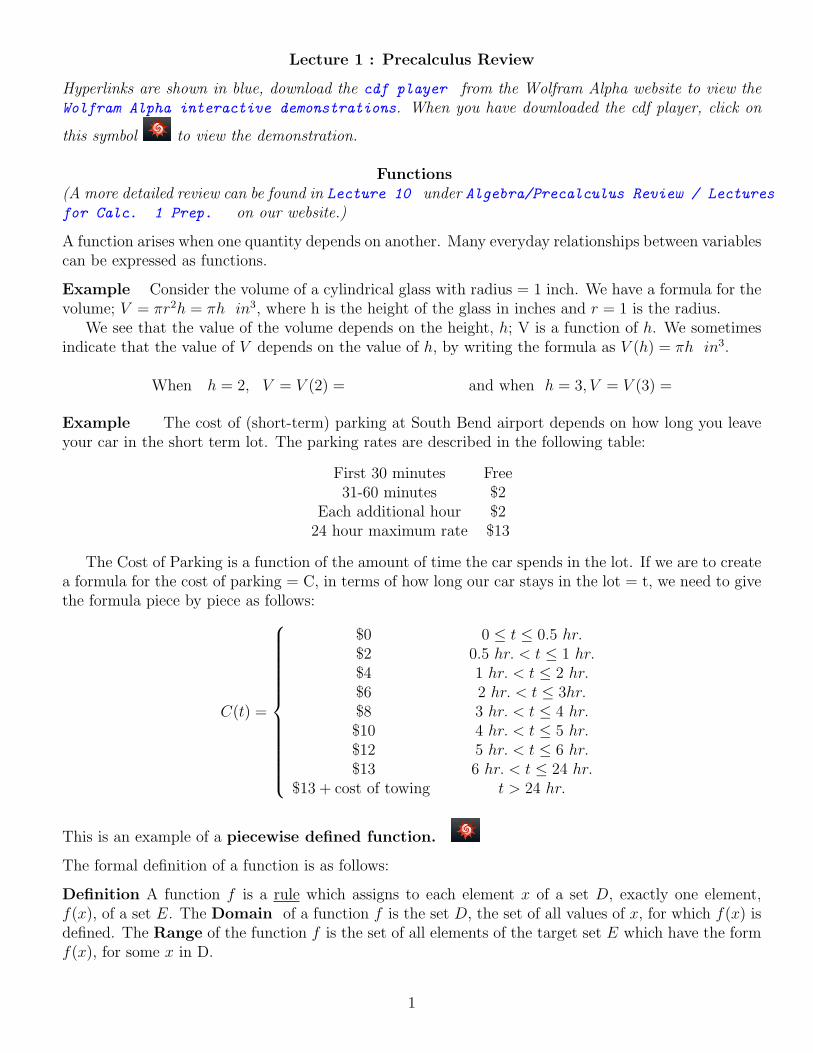
Example If f(x) =√x, use the graph of the function to identify the domain and range of f?
8
6
4
2
–2
–4
–6
5 10
f x( ) = x
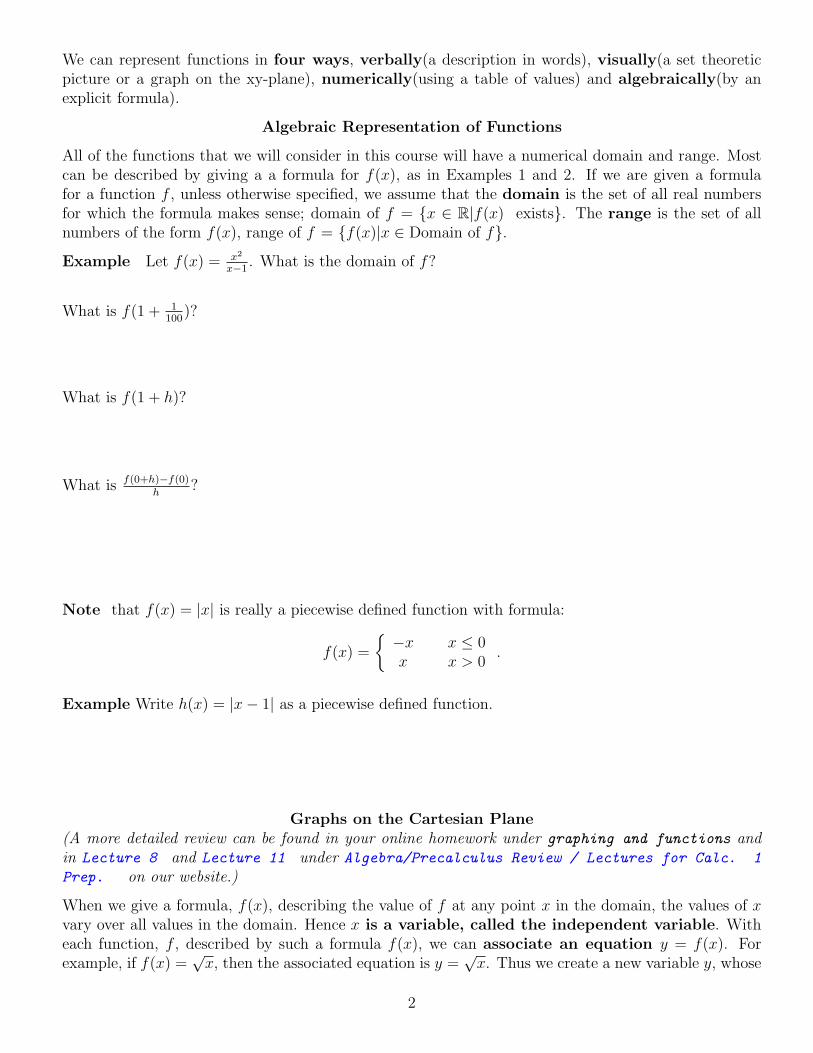
Graphing general equations : We can plot the points on any curve defined by an equation in x andy on the xy-plane. However, we cannot always solve for y uniquely in such equations and the graphmay not be the graph of a function of the form y = f(x).
Example the graph of the equation of a circle of radius 5 with center at (0, 0) is shown on the leftbelow:
6
4
2
–2
–4
–5 5
x2 + y2 = 25
10
8
6
4
2
– 2
– 4
– 6
– 8
– 10
– 10 – 5 5 10 15
x2 + y2 = 25x = 1
3

Vertical Line Test (VLT) The graph of an equation passes the vertical line test if each vertical line
cuts the graph at most once.
If the graph of an equation passes the Vertical Line Test (VLT) then it is the graph of afunction (to each x-value, there corresponds at most one y-value on the graph), if we can solve for yin terms of x, we will get the equation corresponding to the function: y = f(x).
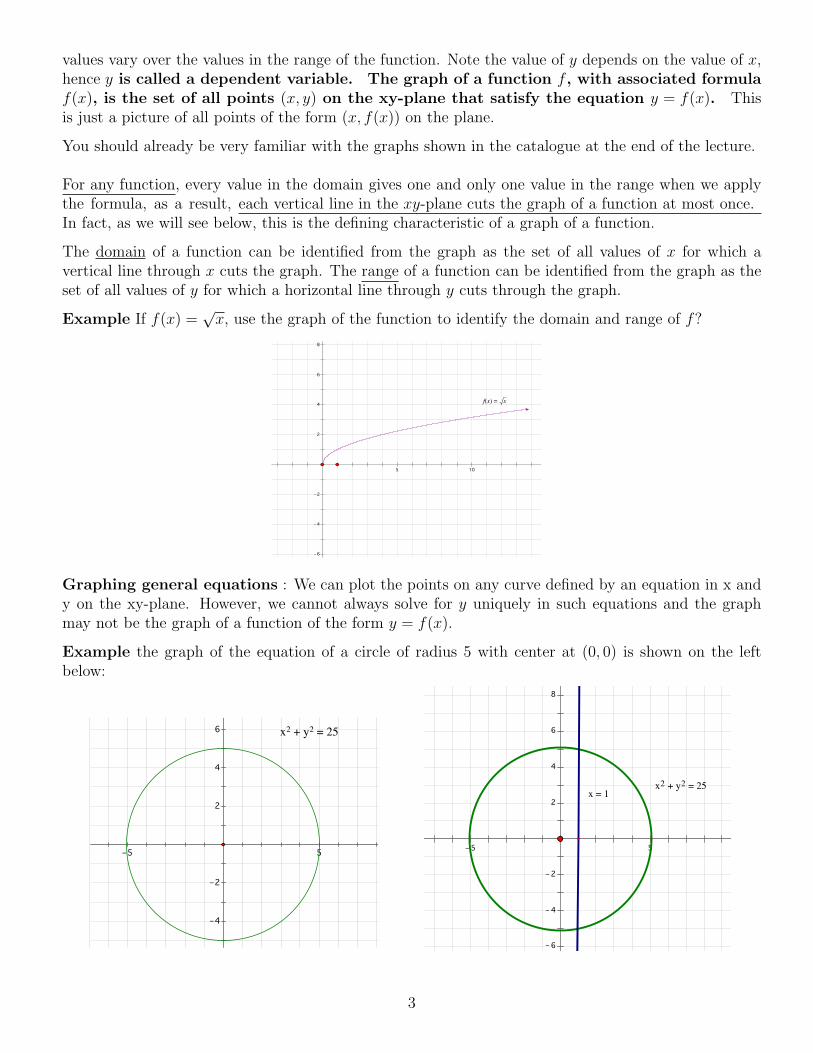
Clearly the graph of the equation x2 + y2 = 25 does not pass the vertical line test (see the vertical linedrawn in the picture on the right above)
On the other hand the upper half of the above circle does pass the VLT and is the graph of the function,f(x) =
√25− x2.
6
4
2
–2
–4
–6
–5 5 10
f x( ) = 25 – x2
Graphing Techniques
(A more detailed review can be found in Lecture 12 under Algebra/Precalculus Review / Lectures
for Calc. 1 Prep. on our website.)
We can use our small catalogue of graphs from the appendix to graph many functions, by taking noteof how graphs change with the transformations listed below:
Vertical and Horizontal Shifts
Example Sketch the graph of the equation y = x2 − 6x+ 14.
We complete the square to transform this equation to
y = (x− 3)2 + 5.
We see that the graph is the graph of y = x2, shifted, first, 3 units to the right and then shifted 5 unitsupwards:
4

16
14
12
10
8
6
4
2
– 2
– 4
– 6
– 10 – 5 5 10 15!
h x( ) = x – 3( )2 + 5
g x( ) = x – 3( )2
f x( ) = x2
We also have a number of transformations which stretch, compress or reflect (in a line) the the graphof a function:
In the Appendix, it is demonstrated how to use these techniques to graph y = 2 sin(4x).
Increasing/Decreasing Functions
Definition We say a function f(x) is increasing on the interval [a, b], if the graph is moving upwardsfrom left to right. Algebraically, this amounts to the statement:A function f is called increasing on the interval [a, b] if f(x1) < f(x2) for any two numbers x1 and x2
with a ≤ x1 < x2 ≤ b.Similarly we say the function f(x) is decreasing on the interval [a, b] if the graph of f is movingdownwards from left to right on that intervalor A function f is decreasing on the interval [a, b] if f(x1) > f(x2) for any two numbers x1 and x2
with a ≤ x1 < x2 ≤ b.
Example Use the graph of y = x2 to find the intervals where f is increasing and decreasing.
Operations on Functions
(A more detailed review can be found in Lecture 13 under Algebra/Precalculus Review / Lectures
for Calc. 1 Prep. on our website.)
As well as being able to add, subtract, multiply and divide functions, we can form the composition oftwo functions f and g.
5

Definition Given two functions f and g, the composite function f ◦ g is defined by
(f ◦ g)(x) = f(g(x)).
The domain of f ◦ g is the set of all x such that
1. x is in the domain of g and
2. g(x) is in the domain of f
It is implicit in the definition of the function, that we first calculate g(x) and then apply f to the result.Hence any x in the domain must satisfy the above two conditions.(When calculating the domain, calculating just the formula for f ◦ g or g ◦ f can be misleading)
Example If f(x) =√x and g(x) = x2 + 1,
then (f ◦ g)(x) = f(g(x)) = f(x2 + 1) =√x2 + 1.
On the other hand, (g ◦ f)(x) = g(f(x)) = g(√x) = (
√x)2 + 1 = x+ 1.
The domain of f is {x ∈ R|x ≥ 0} and the domain of g is the set of all real numbers.
The domain of (f ◦ g)(x) is the set of all x such that
1. x is in the domain of g(x) = x2 + 1 − > x is any real number AND
2. g(x) is in the domain of f − > g(x) = x2 + 1 ≥ 0 − > this is true for any real number x.
Hence the domain of f ◦ g is the set of all real numbers, R.
The domain of (g ◦ f)(x) is the set of all x such that
1. x is in the domain of f − > x ≥ 0 AND
2. f(x) is in the domain of g − >√x is a real number − > this is true for all x ≥ 0.
Hence the domain of g ◦ f(x) is the set of all nonnegative real numbers :{x ∈ R|x ≥ 0} despite the factthat all real numbers make sense in the final formula. When describing such a function with a restricteddomain, we use a piecewise description
(g ◦ f)(x) =
{x+ 1 x ≥ 0
undefined otherwise.
Partial information about Functions and Models of functions
In reality, we may not have a formula for a function that occurs in nature. We may just have a tableof values, showing the empirical data we have collected. Much of what we do in this course can bemodified to get a substantial amount of information about the function from such a table of values.
Sometimes we take the function that best fits a set of data (many software packages can help with this)and use that function to model the relationship between the variables and make predictions about thefuture.
6

Appendix
Catalogue of Graphs
9
8
7
6
5
4
3
2
1
– 1
– 2
– 6 – 4 – 2 2 4 6
g x( ) = x2
15
10
5
–5
–10
–15
–20 –10 10 20
f x( ) = x3
8
6
4
2
–2
–4
–6
5 10
f x( ) = x
4
3
2
1
– 1
– 2
– 3
– 4
– 4! – 3! – 2! – ! ! 2! 3! 4!
f x( ) = sin x( )
7

4
3
2
1
– 1
– 2
– 3
– 4
– 4! – 3! – 2! – ! ! 2! 3! 4!
g x( ) = cos x( )
4
3
2
1
– 1
– 2
– 3
– 4
– 4! – 3! – 2! – ! ! 2! 3! 4!
h x( ) = tan x( )
14
12
10
8
6
4
2
– 2
– 4
– 6
– 8
– 10 – 5 5 10
f x( ) = x
Further example of using graphing techniques
Example Sketch the graph of y = 2 sin(4x). We see that this is a graph similar to that of y = sin(x),except with period 2π/4 = π/2 and twice the amplitude:
8
6
4
2
–2
–4
–6
–8
–10
–!–
!
2
!
2
! 3!
2
2! 5!
2
3!
f x( ) = sin x( )
h x( ) = 2·sin 4·x( )
---------
................
g x( ) = sin 4·x( )
8

Visual representation by Venn DiagramsThis representation of function will not be used very much in this course, since our domain will usuallycontain an entire interval of the Real Number line and we cannot represent all of the points in thedomain by an individual dot.
Example 3 Let f be the function which sends each of the numbers −3,−2,−1, 0, 1, 2, 3 to its square.We have f(−3) = 9, f(−2) = 4, f(−1) = 1, f(0) = 0, f(1) = 1, f(2) = 4, f(3) = 9.
We can represent this graphically in two ways. One is as in the set theoretic diagram below and theother is with a set of dots on the Cartesian plane, as in the diagram below.
RangeDomain
0
2-2
0
4
1
9
1
-1
3-3
8
6
4
2
–2
–4
–5 5
Note that in the Venn Diagram, only one arrow leaves any given point in the domain. This reflectsthe fact that the function f assigns exactly one element to each element of the domain. There is norestriction on the number of arrows that may arrive at a point in the range.
Function Types
The most common types of functions, we shall deal with in this course are:
• Polynomials : functions of the form f(x) = a0 + a1x + a2x2 + . . . anx
n, where, a0, a1, a2, . . . , an
are real numbers. Note that these functions include functions whose graphs are lines: y = ax+ b,quadratics, y = ax2 + bx+ c, etc...
• Rational Functions These are functions of the form f(x) = P (x)Q(x)
where P (x) and Q(x) are
polynomials, e.g f(x) = x2
x−1.
• Algebraic Functions Anything constructed using +,−, ·, ·· ,√, starting with polynomial func-
tions. e.g g(x) =√
x2+1x5+2x+5
. or h(x) =√x+√
1 + x.
• Trigonometric Functions sinx, cosx, tanx, secx, cscx, cotx. Note that the domainsof these functions will always be in radians.
9