lecture 1 – putting safety into perspective · 7/3/2009 · the layer of protection analysis...
TRANSCRIPT
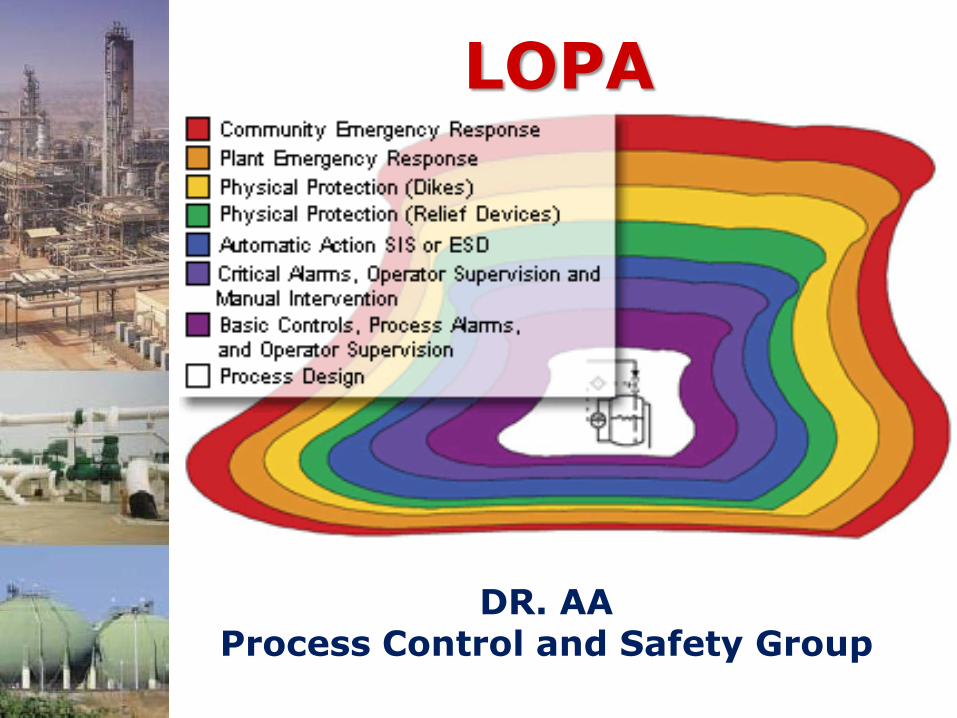
LOPA
DR. AAProcess Control and Safety Group
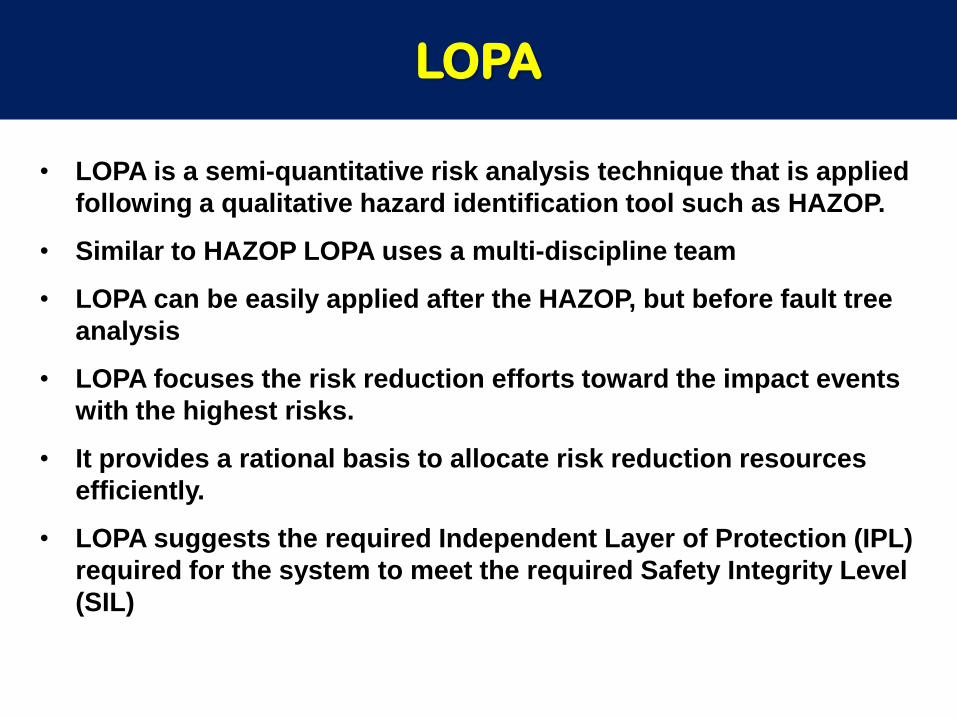
LOPA
• LOPA is a semi-quantitative risk analysis technique that is applied
following a qualitative hazard identification tool such as HAZOP.
• Similar to HAZOP LOPA uses a multi-discipline team
• LOPA can be easily applied after the HAZOP, but before fault tree
analysis
• LOPA focuses the risk reduction efforts toward the impact events
with the highest risks.
• It provides a rational basis to allocate risk reduction resources
efficiently.
• LOPA suggests the required Independent Layer of Protection (IPL)
required for the system to meet the required Safety Integrity Level
(SIL)
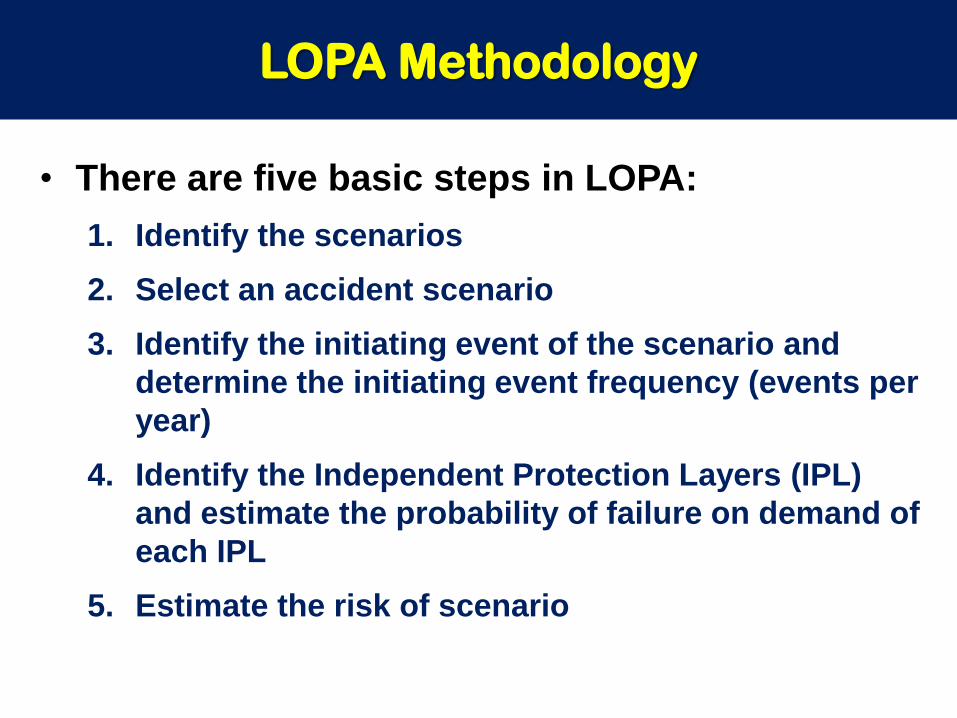
LOPA Methodology
• There are five basic steps in LOPA:
1. Identify the scenarios
2. Select an accident scenario
3. Identify the initiating event of the scenario and
determine the initiating event frequency (events per
year)
4. Identify the Independent Protection Layers (IPL)
and estimate the probability of failure on demand of
each IPL
5. Estimate the risk of scenario

LOPA
LOPA
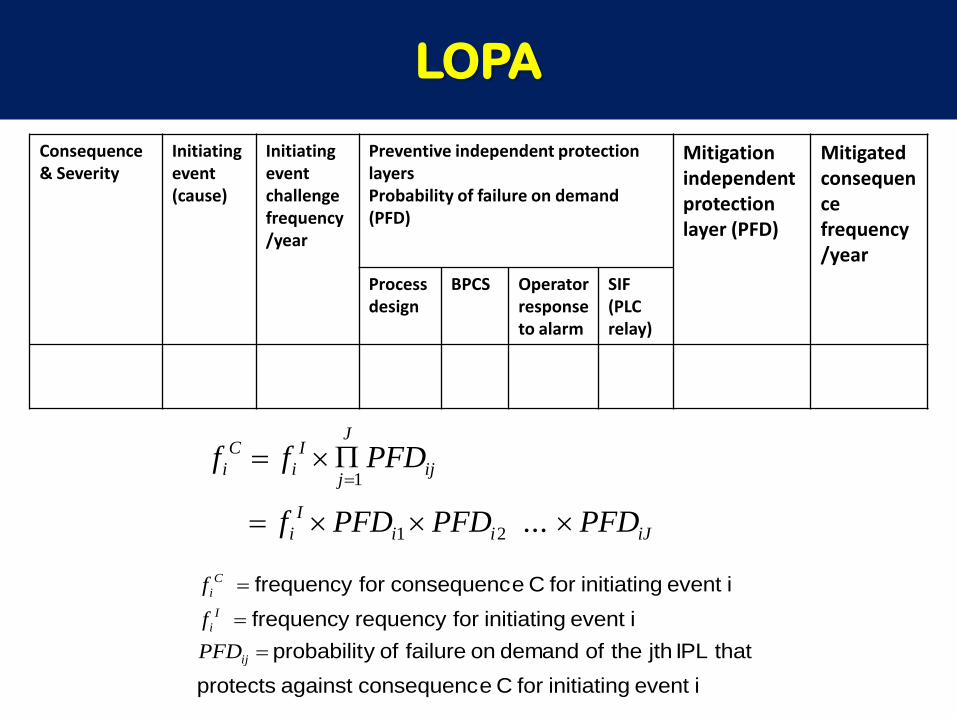
Consequence & Severity
Initiating event(cause)
Initiating event challenge frequency /year
Preventive independent protection layers Probability of failure on demand (PFD)
Mitigation independent protection layer (PFD)
Mitigated consequence frequency/year
Process design
BPCS Operator response to alarm
SIF (PLC relay)
iJii
I
i
ij
J
j
I
i
C
i
PFDPFDPFDf
PFDff
...21
1
i event initiating for C econsequenc against protects
that IPL jth the of demand on failure ofy probabilit
i event initiating forrequency frequency
i event initiating for C econsequenc forfrequency
ij
I
i
C
i
PFD
f
f

Typical Initiating Cause Likelihood
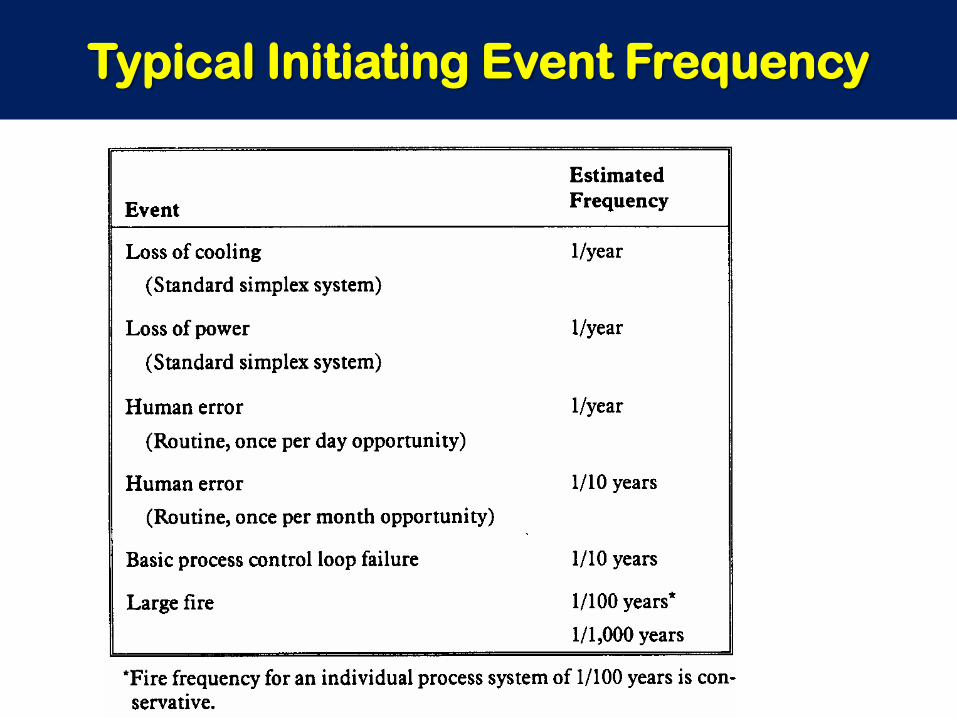
Typical Initiating Event Frequency
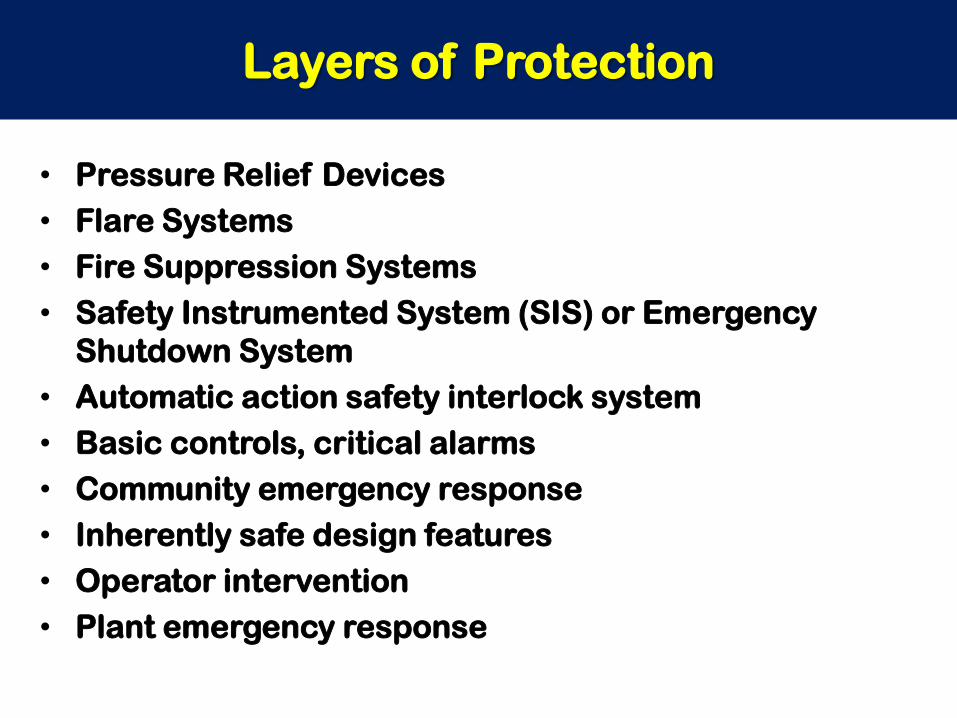
Layers of Protection
• Pressure Relief Devices
• Flare Systems
• Fire Suppression Systems
• Safety Instrumented System (SIS) or Emergency
Shutdown System
• Automatic action safety interlock system
• Basic controls, critical alarms
• Community emergency response
• Inherently safe design features
• Operator intervention
• Plant emergency response
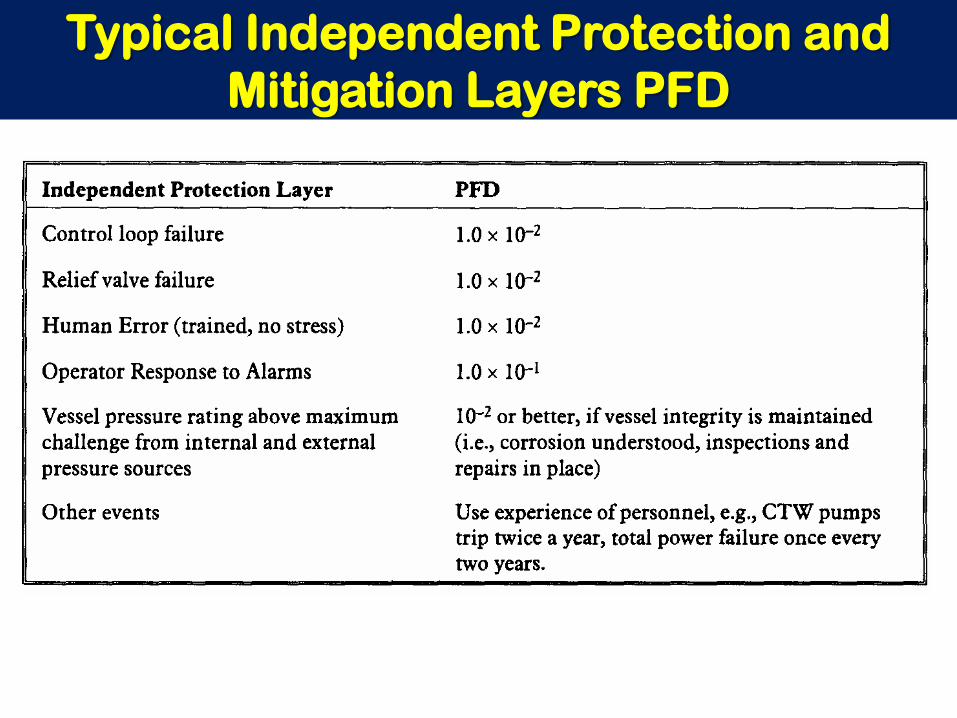
Typical Independent Protection and
Mitigation Layers PFD

Implementing LOPA
• One Cause – One Consequence – One
Scenario
– Do not combine consequences or causes
• What is IPL
– A device, system or action that is capable of
preventing a scenario from proceeding to its
undesired consequence independent of the
initiating event or the action of any other layer of
protection associated with the scenario.
– Procedure and inspection cannot be considered as
IPL
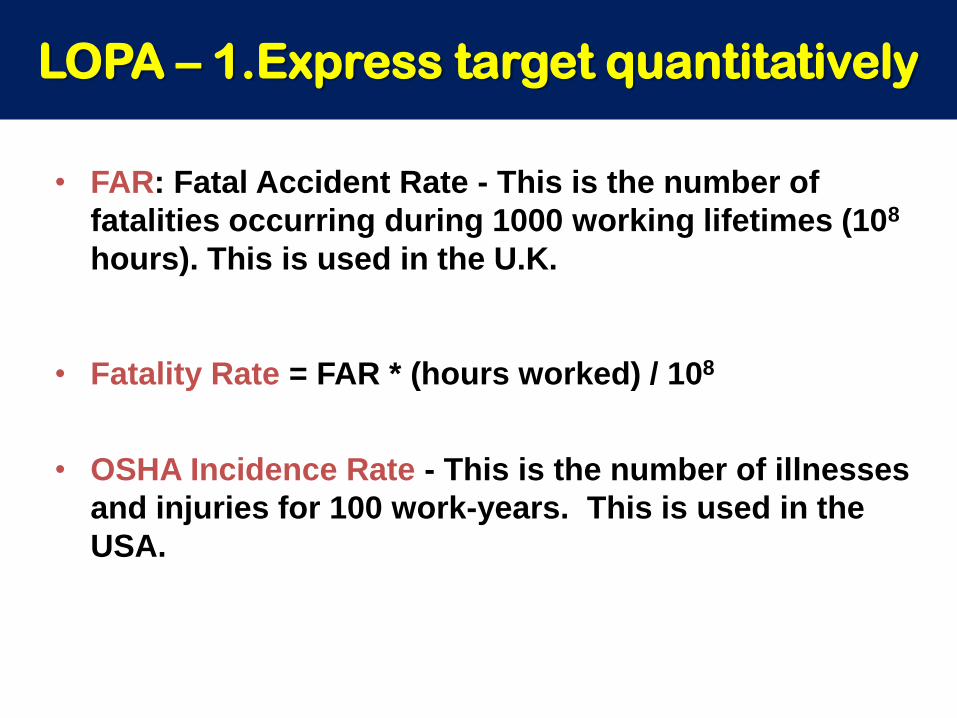
• FAR: Fatal Accident Rate - This is the number of
fatalities occurring during 1000 working lifetimes (108
hours). This is used in the U.K.
• Fatality Rate = FAR * (hours worked) / 108
• OSHA Incidence Rate - This is the number of illnesses
and injuries for 100 work-years. This is used in the
USA.
LOPA – 1.Express target quantitatively

Activity FAR
Chemical Industry 4
Steel Industry 8
Coal Mining 40
Construction 67
Uranium 70
Asbestos (old data?) 620
Staying home 3
Traveling by automobile 57
Traveling by airplane 240
Cigarette smoking ???
What is the fatality rate/year for the chemical
industry?
What is FAR for cigarette
smoking?
FAR Data for typical Activities
LOPA – 1.Express target quantitatively

• One standard used is to maintain the risk for
involuntary activities less (much less?) than typical
risks such as “staying home”
- Results in rules, such as fatality rate < 10-6/year
- See Wells (1996) Table 9.4
- Remember that many risks exist (total risk is sum)
• Are current risks accepted or merely tolerated?
• We must consider the inaccuracies of the estimates
• We must consider people outside of the
manufacturing site.
LOPA – 1.Express target quantitatively
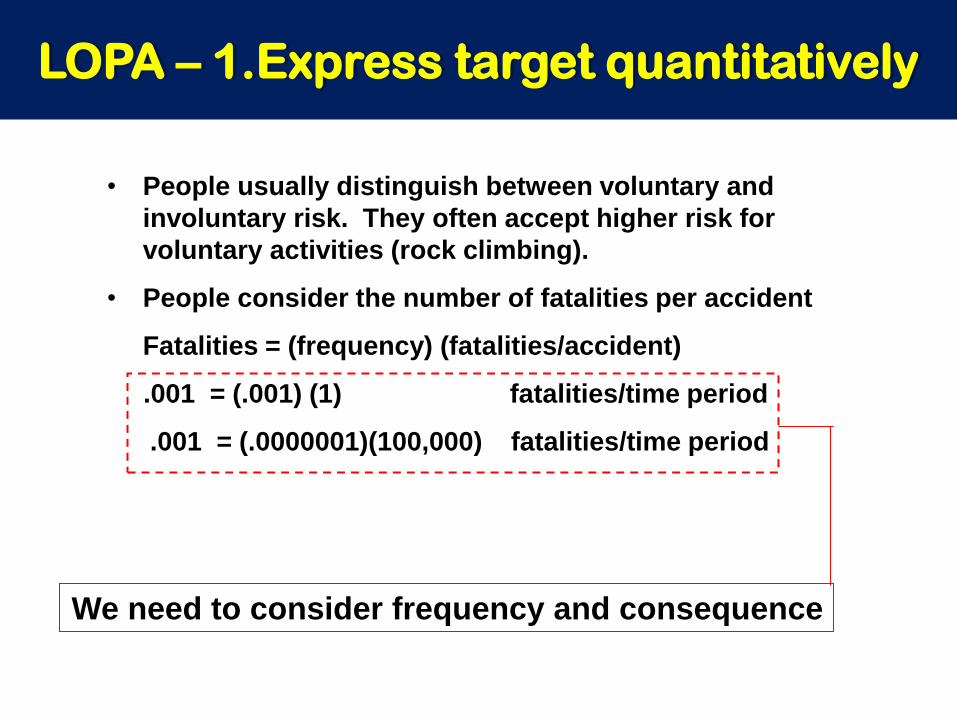
• People usually distinguish between voluntary and
involuntary risk. They often accept higher risk for
voluntary activities (rock climbing).
• People consider the number of fatalities per accident
Fatalities = (frequency) (fatalities/accident)
.001 = (.001) (1) fatalities/time period
.001 = (.0000001)(100,000) fatalities/time period
We need to consider frequency and consequence
LOPA – 1.Express target quantitatively

1.00E-09
1.00E-08
1.00E-07
1 10 100
Deaths per event, N
Pro
bab
ilit
y o
r F
req
uen
cy,
F
(even
ts/y
ear)
“Acceptable risk”
“Unacceptable risk”
The design must be enhanced to reduce the likelihood of
death (or serious damage) and/or to mitigate the effects.
The decision can be presented in a F-N plot similar to the one below.(The coordinate values here are not “standard”; they must be selected by the
professional.)
LOPA – 1.Express target quantitatively
• In Level of Protection Analysis (LOPA), we assume
that the probability of each element in the system
functioning (or failing) is independent of all other
elements.
• We consider the probability of the initiating event
(root cause) occurring
• We consider the probability that every independent
protection layer (IPL) will prevent the cause or
satisfactorily mitigate the effect
LOPA – 2.Determine the risk for system

IPL1
Initiating event, X
IPL2
IPL3Unsafe, Y1
Unsafe, Y2
IPLn
Unsafe, Yn
Safe/tolerable
unsafe
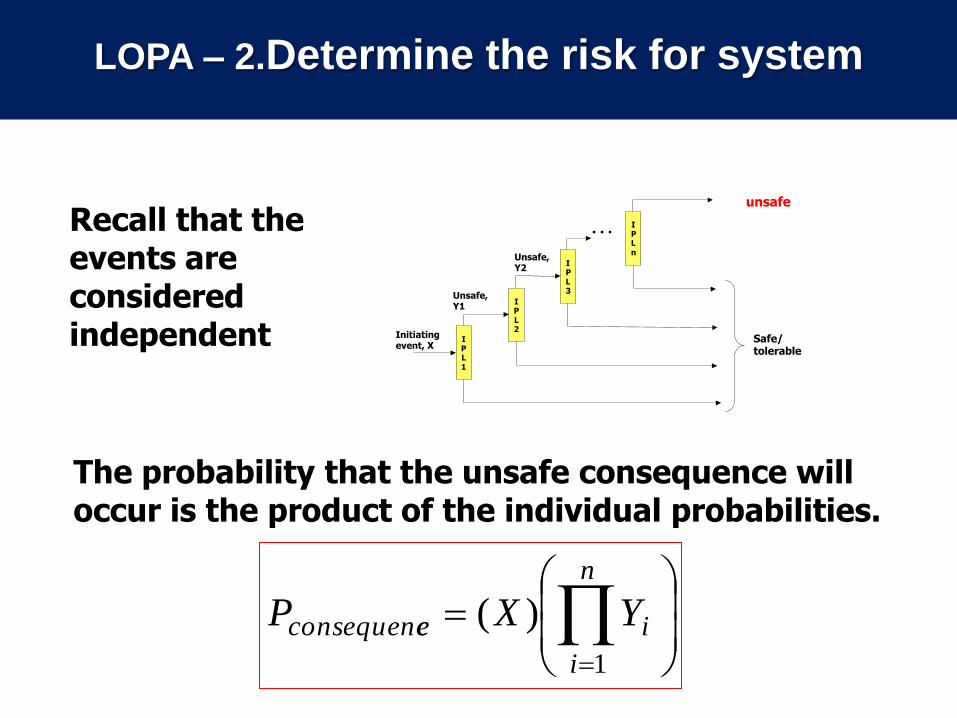
X is the probability of the event
Yi is the probability offailure on demand (PFD) for each IPL
LOPA – 2.Determine the risk for system
LOPA - Determine the risk for system
Recall that the events are considered independent
The probability that the unsafe consequence will occur is the product of the individual probabilities.
n
i
ieconsequenc YXP
1
)(
IPL1
Initiating event, X
IPL2
IPL3
Unsafe, Y1
Unsafe, Y2
IPLn
Safe/tolerable
unsafe
…
LOPA – 2.Determine the risk for system
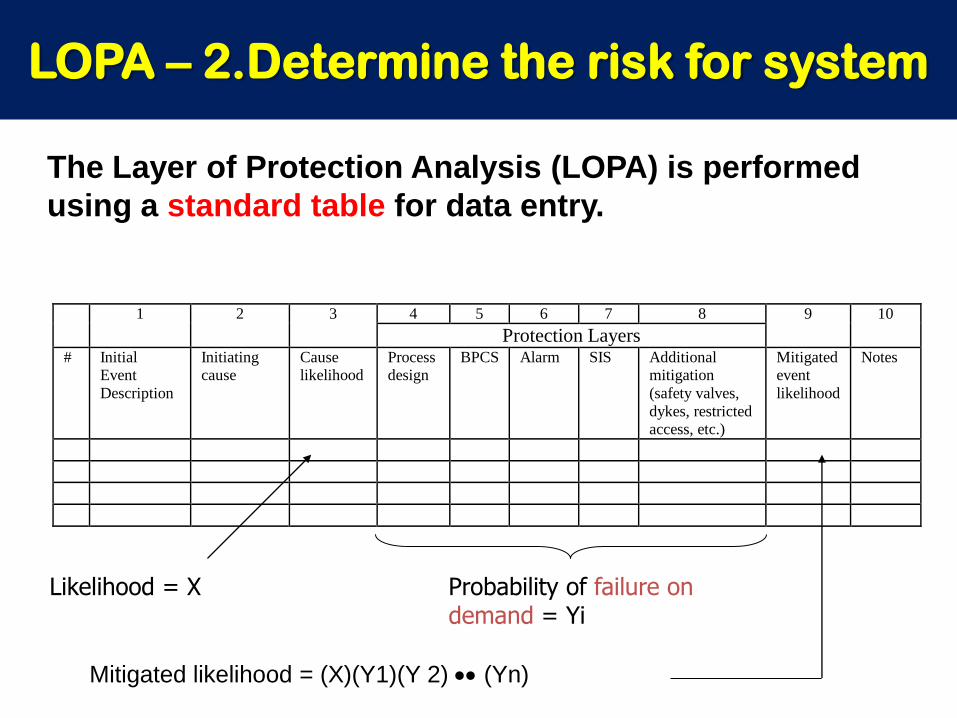
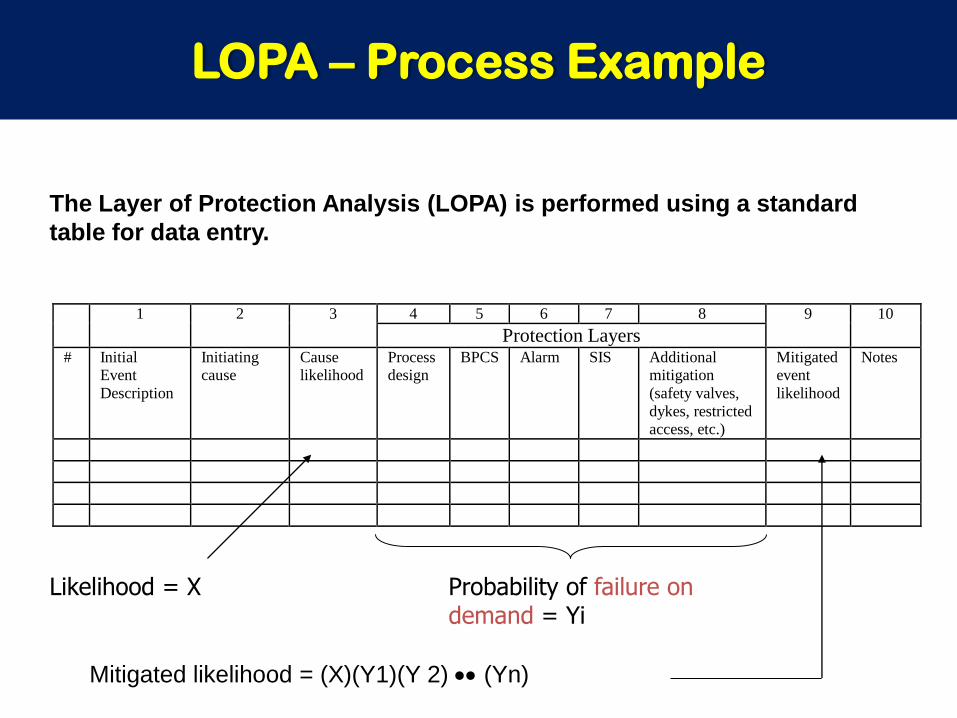
The Layer of Protection Analysis (LOPA) is performed
using a standard table for data entry.
Likelihood = X Probability of failure on demand = Yi
Mitigated likelihood = (X)(Y1)(Y 2) (Yn)
4 5 6 7 8 1 2 3
Protection Layers
9 10
# Initial Event
Description
Initiating cause
Cause likelihood
Process design
BPCS Alarm SIS Additional mitigation
(safety valves,
dykes, restricted access, etc.)
Mitigated event
likelihood
Notes
LOPA – 2.Determine the risk for system
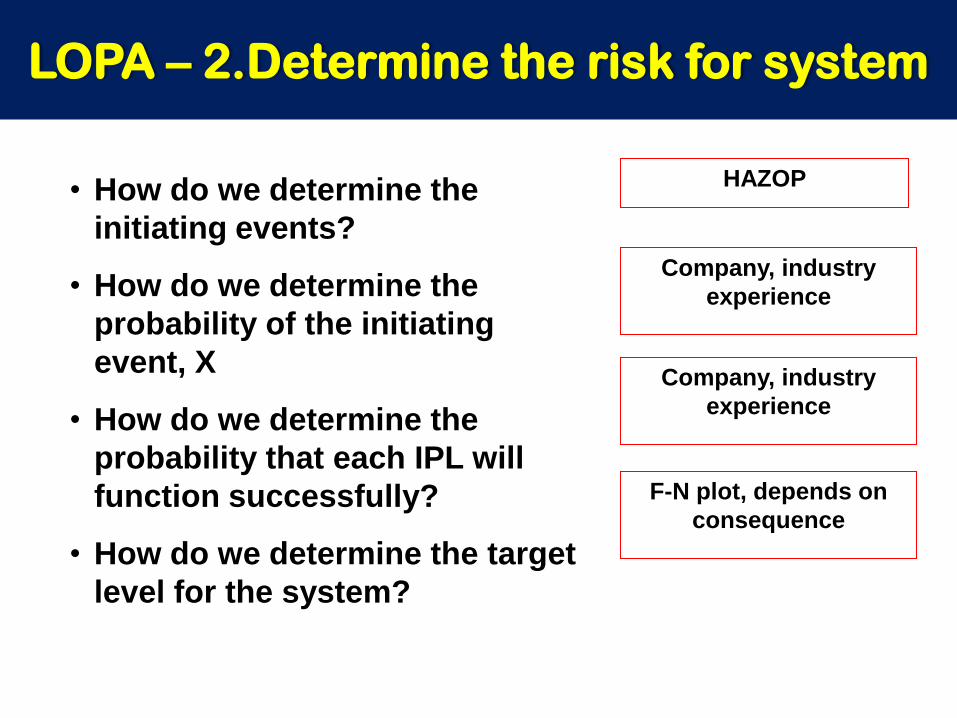
• How do we determine the
initiating events?
• How do we determine the
probability of the initiating
event, X
• How do we determine the
probability that each IPL will
function successfully?
• How do we determine the target
level for the system?
HAZOP
Company, industry
experience
Company, industry
experience
F-N plot, depends on
consequence
LOPA – 2.Determine the risk for system

Some typical protection layer Probability of Failure on Demand
(PFD)
• BPCS control loop = 0.10
• Operator response to alarm = 0.10
• Relief safety valve = 0.001
• Vessel failure at maximum design pressure = 10-4 or better
(lower)
Source: A. Frederickson, Layer of Protection Analysis, www.safetyusersgroup.com, May 2006
LOPA – 2.Determine the risk for system

Often, credit is taken for good design and maintenance
procedures.
• Proper materials of construction (reduce corrosion)
• Proper equipment specification (pumps, etc.)
• Good maintenance (monitor for corrosion, test
safety systems periodically, train personnel on
proper responses, etc.)
A typical value is PFD = 0.10
LOPA – 2.Determine the risk for system

The general approach is to
• Set the target frequency for an event leading to an
unsafe situation (based on F-N plot)
• Calculate the frequency for a proposed design
• If the frequency for the design is too high, reduce it
- The first approach is often to introduce or enhance
the safety interlock system (SIS) system
• Continue with improvements until the target
frequency has been achieved
LOPA – 3.Reduce the risk to achieve the target
The Layer of Protection Analysis (LOPA) is performed using a standard
table for data entry.
Likelihood = X Probability of failure on demand = Yi
Mitigated likelihood = (X)(Y1)(Y 2) (Yn)
4 5 6 7 8 1 2 3
Protection Layers
9 10
# Initial Event
Description
Initiating cause
Cause likelihood
Process design
BPCS Alarm SIS Additional mitigation
(safety valves,
dykes, restricted access, etc.)
Mitigated event
likelihood
Notes
LOPA – Process Example

Feed
Methane
Ethane (LK)
Propane
Butane
Pentane
Vapor
product
Liquid
product
Process
fluid
Steam
FC-1
F2 F3
T1 T2
T3
T5
TC-6 PC-1
LC-1
AC-1
L. Key
Split rangePAH
LAL
LAH
cascade
Class Exercise 1: Flash drum for “rough” component separation
for this proposed design.
LOPA – Process Example
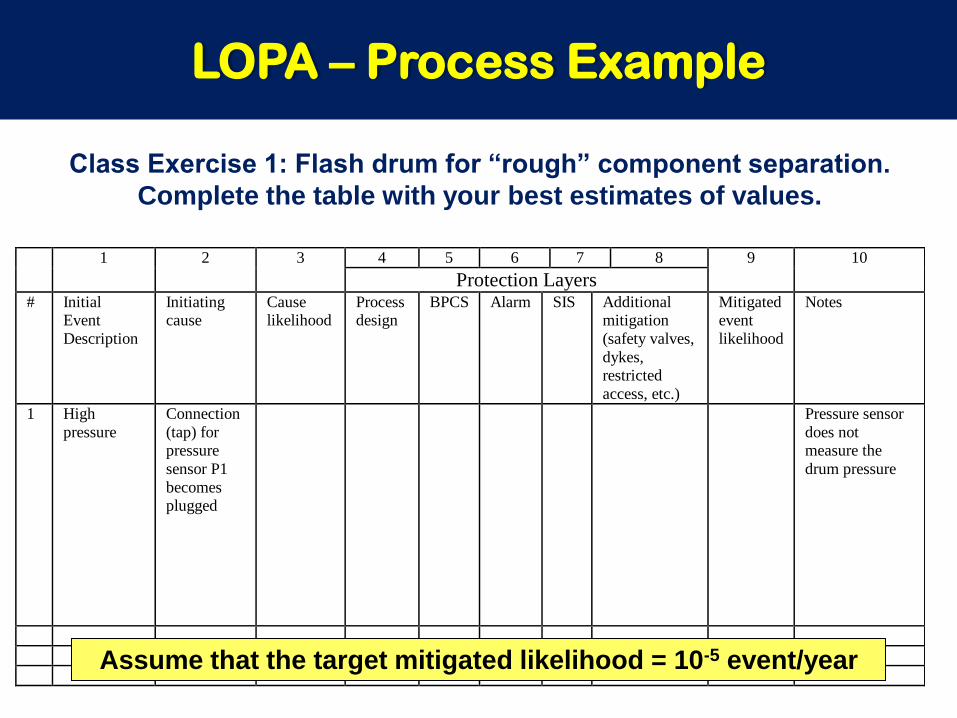
4 5 6 7 8 1 2 3
Protection Layers
9 10
# Initial Event
Description
Initiating cause
Cause likelihood
Process design
BPCS Alarm SIS Additional mitigation
(safety valves,
dykes, restricted
access, etc.)
Mitigated event
likelihood
Notes
1
High
pressure
Connection
(tap) for pressure
sensor P1
becomes plugged
Pressure sensor
does not measure the
drum pressure
Class Exercise 1: Flash drum for “rough” component separation.
Complete the table with your best estimates of values.
Assume that the target mitigated likelihood = 10-5 event/year
LOPA – Process Example

Class Exercise 1: Some observations about the design.
• The drum pressure controller uses only one
sensor; when it fails, the pressure is not controlled.
• The same sensor is used for control and alarming.
Therefore, the alarm provides no additional
protection for this initiating cause.
• No safety valve is provided (which is a serious
design flaw).
• No SIS is provided for the system. (No SIS would
be provided for a typical design.)
LOPA – Process Example

Class Exercise 1: Solution using initial design and typical
published values.
4 5 6 7 8 1 2 3
Protection Layers
9 10
# Initial Event
Description
Initiating cause
Cause likelihood
Process design
BPCS Alarm SIS Additional mitigation
(safety valves,
dykes, restricted
access, etc.)
Mitigated event
likelihood
Notes
1
High
pressure
Connection
(tap) for pressure
sensor P1
becomes plugged
0.10 0.10 1. 1.0 1.0 1.0 .01 Pressure sensor
does not measure the
drum pressure
Much too high! We must make improvements to the design.
LOPA – Process Example

4 5 6 7 8 1 2 3
Protection Layers
9 10
# Initial Event
Description
Initiating cause
Cause likelihood
Process design
BPCS Alarm SIS Additional mitigation
(safety valves,
dykes, restricted
access, etc.)
Mitigated event
likelihood
Notes
1
High
pressure
Connection
(tap) for pressure
sensor P1
becomes plugged
0.10 0.10 1.0 0.10 1.0 PRV 0.01
.00001 Pressure sensor
does not measure the
drum pressure
The PRV must
exhaust to a
separation (knock-out)
drum and fuel or
flare system.
Class Exercise 1: Solution using enhanced design and typical
published values.
Enhanced design includes
separate P sensor for alarm
and a pressure relief valve.
Sketch on process drawing.
The enhanced design
achieves the target
mitigated likelihood.
Verify table entries.
LOPA – Process Example

Feed
Methane
Ethane (LK)
Propane
Butane
Pentane
Vapor
product
Liquid
product
Process
fluid
Steam
FC-1
F2 F3
T1 T2
T3
T5
TC-6 PC-1
LC-1
AC-1
L. Key
Split range
LAL
LAH
cascade
P-2PAH
Class Exercise 1: Solution.
LOPA – Process Example

Class Exercise 1: Each IPL must be independent.
For the solution in the LOPA table and process sketch,
describe some situations (equipment faults) in which the
independent layers of protection are
- Independent
- Dependent
For each situation in which the IPLs are dependent,
suggest a design improvement that would remove the
common cause fault, so that the LOPA analysis in the
table would be correct.
Hints: Consider faults such as power
supply, signal transmission,
computing, and actuation
LOPA – Process Example

• The most common are BPCS, Alarms and Pressure
relief. They are typically provided in the base
design.
• The next most common is SIS, which requires
careful design and continuing maintenance
• The probability of failure on demand for an SIS
depends on its design. Duplicated equipment (e.g.,
sensors, valves, transmission lines) can improve the
performance
• A very reliable method is to design an “inherently
safe” process, but these concepts should be applied
in the base case
LOPA – Approaches to reducing risks

• The safety instrumented system (SIS) must use
independent sensor, calculation, and final element
to be independent!
• We desire an SIS that functions when a fault has
occurred and does not function when the fault has
not occurred.
• SIS performance improves with the use of
redundant elements; however, the systems
become complex, requiring high capital cost and
extensive ongoing maintenance.
• Use LOPA to determine the required PFD; then,
design the SIS to achieve the required PFD.
LOPA – Approaches to reducing risks

Safety Integrity Level (SIL)
Probability of Failure on Demand
SIL-1 0.10 to 0.001
SIL-2 0.01 to 0.001
SIL-3 0.001 to 0.0001
SIL-4 Less than 0.0001
Performance for the four SIL’s levels for a safety interlock system (SIS)
LOPA – Approaches to reducing risks

1 out of 1
must indicate
failure
T100s
2 out of 3
must indicate
failure
T100
T101
T102
Same variable,
multiple sensors!
s
False
shutdown
Failure
on
demand
5 x 10-35 x 10-3
2.5 x 10⁻⁶ 2.5 x 10⁻⁶
Better
performance,
more expensive
Two common designs for a safety interlock system (SIS)
LOPA – Approaches to reducing risks
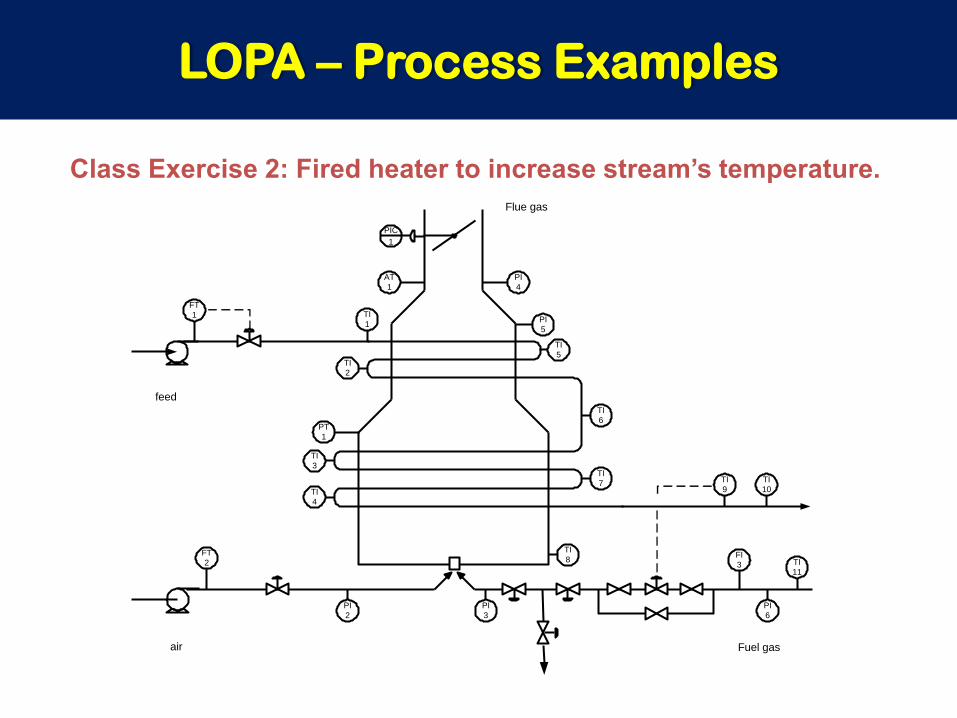
Class Exercise 2: Fired heater to increase stream’s temperature.
FT
1
FT
2
PT
1
PIC
1
AT
1
TI
1
TI
2
TI
3
TI
4
PI
2
PI
3
PI
4
TI
5
TI
6
TI
7
TI
8
TI
9
FI
3
TI
10
TI
11
PI
5
PI
6
air Fuel gas
feed
Flue gas
LOPA – Process Examples

4 5 6 7 8 1 2 3
Protection Layers
9 10
# Initial Event
Description
Initiating cause
Cause likelihood
Process design
BPCS Alarm SIS Additional mitigation
(safety valves,
dykes, restricted
access, etc.)
Mitigated event
likelihood
Notes
1
Combustibles
in stack, fire or explosion
Limited air
supply because air
blower
reaches maximum
power
All equipment is
functioning properly in this
scenario. The
feed rate is very high, beyond its
design value.
Class Exercise 2: Fired heater to increase stream’s temperature.
LOPA – Process Examples

Dowell, A. and D. Hendershoot, Simplified Risk Analysis - Layer of Protection Analysis,
AIChE National Meeting, Indianapolis, Paper 281a, Nov. 3-8, 2002
Dowell, A. and T. Williams, Layer of Protection Analysis: Generating Scenarios
Automatically from HAZOP Data, Process Safety Progress, 24, 1, 38-44 (March 2005).
Frederickson A., Layer of Protection Analysis, www.safetyusersgroup.com, May 2006
Gulland, W., Methods of Determining Safety Integrity Level (SIL) Requirements - Pros
and Cons, http://www.chemicalprocessing.com/whitepapers/2005/006.html
Haight, J. and V. Kecojevic, Automation vs. Human Intervention: What is the Best Fit
for the Best Performance?, Process Safety Progress, 24, 1, 45-51 (March 2005)
Melhem, G. and P. Stickles, How Much Safety is Enough, Hydrocarbon Processing,
1999
Wiegernick, J., Introduction to the Risk-Based Design of Safety Instrumented Systems
for the Process Industries, Seventh International Conference on Control, Automation,
Robotics and Vision, Singapore, Dec. 2002.
LOPA - References