lecture 1 slides - econometrics laboratory, uc berkeley
TRANSCRIPT

LECTURE 1Overview of U.S. Macroeconomic
History and Data
August 31, 2011
Economics 210c/236a Christina RomerFall 2011 David Romer

I. CHRISTINA ROMER: “SPURIOUS VOLATILITY IN
HISTORY UNEMPLOYMENT DATA”

0
5
10
15
20
25
301/
1/18
90
1/1/
1898
1/1/
1906
1/1/
1914
1/1/
1922
1/1/
1930
1/1/
1938
1/1/
1946
1/1/
1954
1/1/
1962
1/1/
1970
1/1/
1978
1/1/
1986
1/1/
1994
1/1/
2002
Perc
ent
Inconsistent Unemployment Data
From Historical Statistics of the United States

0
2
4
6
8
10
12
14
1907
1915
1923
1931
1939
1947
1955
1963
1971
1979
1987
1995
2003
Perc
ent
Inconsistent Unemployment Data
From Historical Statistics of the United States

Inconsistent GDP Data
From Martin Neil Baily, “Stabilization Policy and Private Economic Behavior”

Lebergott’s Methodology
Unemployed = Labor Force – Employed
• Labor force is overestimated in recessions.
• Employment is underestimated.
• So unemployment is overestimated in recessions.
• Just the opposite in booms.

More Consistent Unemployment Data
From Christina Romer, ”Spurious Volatility in Historical Unemployment Data”

From Christina Romer, ”Spurious Volatility in Historical Unemployment Data”

Evaluation of Romer

Implications of Findings
• Depression stands out more.
• Why wasn’t there a stabilization?

II. JOSEPH DAVIS: “AN ANNUAL INDEX OF U.S. INDUSTRIAL PRODUCTION, 1790-1915”

Data Sources for Davis’s Index of Industrial Production


Evaluation of Davis

From Joseph Davis, “An Annual Index of Industrial Production, 1790-1915”

From Joseph Davis, “An Annual Index of Industrial Production, 1790-1915”
0
1
2
3
4
5
6
7
8
1790
1798
1806
1814
1822
1830
1838
1846
1854
1862
1870
1878
1886
1894
1902
1910
Loga
rithm
s
Davis Index of Industrial Production

From Joseph Davis, “An Annual Index of Industrial Production, 1790-1915”

From Joseph Davis, “An Annual Index of Industrial Production, 1790-1915”
-0.25
-0.2
-0.15
-0.1
-0.05
0
0.05
0.1
0.15
0.2
1791
1796
1801
1806
1811
1816
1821
1826
1831
1836
1841
1846
1851
1856
1861
1866
1871
1876
1881
1886
1891
1896
1901
1906
1911
Percentage Change in Industrial Production

-0.20
-0.15
-0.10
-0.05
0.00
0.05
0.10
0.15
0.20
1820
1825
1830
1835
1840
1845
1850
1855
1860
1865
1870
1875
1880
1885
1890
1895
1900
1905
1910
1915
Percentage Change in Industrial Production
Standard Deviation1820-1889 0.0601890-1915 0.089

From Joseph Davis, “An Annual Index of Industrial Production, 1790-1915”

Implications of Findings
• May affect view of impact of panics in the 19th c.
• Increasing frequency of cycles after 1890 may reflect changes in price flexibility.
• Changes in volatility may reflect the emergence of demand-driven recessions.

III. MARGARET MCCONNELL AND GABRIEL PEREZ-QUIROS, “OUTPUT FLUCTUATIONS IN THE UNITED
STATES: WHAT HAS CHANGED SINCE THE EARLY
1980’S?”

From McConnell and Perez-Quiros, “Output Fluctuations in the United States”

From Christina Romer, ”Changes in Business Cycles”

From James Stock and Mark Watson, “Has the Business Cycle Changed?”

From McConnell and Perez-Quiros, “Output Fluctuations in the United States”


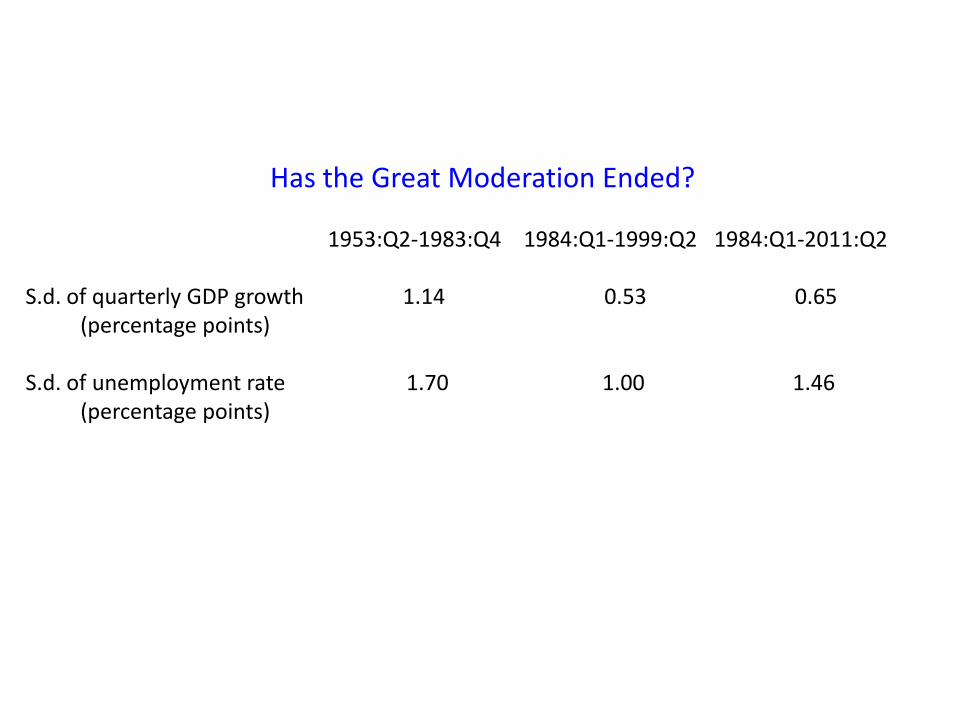
Has the Great Moderation Ended?
1953:Q2-1983:Q4 1984:Q1-1999:Q2 1984:Q1-2011:Q2
S.d. of quarterly GDP growth 1.14 0.53 0.65(percentage points)
S.d. of unemployment rate 1.70 1.00 1.46(percentage points)

IV. CHRISTOPHER HANES, “THE DEVELOPMENT OF
NOMINAL WAGE RIGIDITY IN THE LATE 19TH CENTURY”

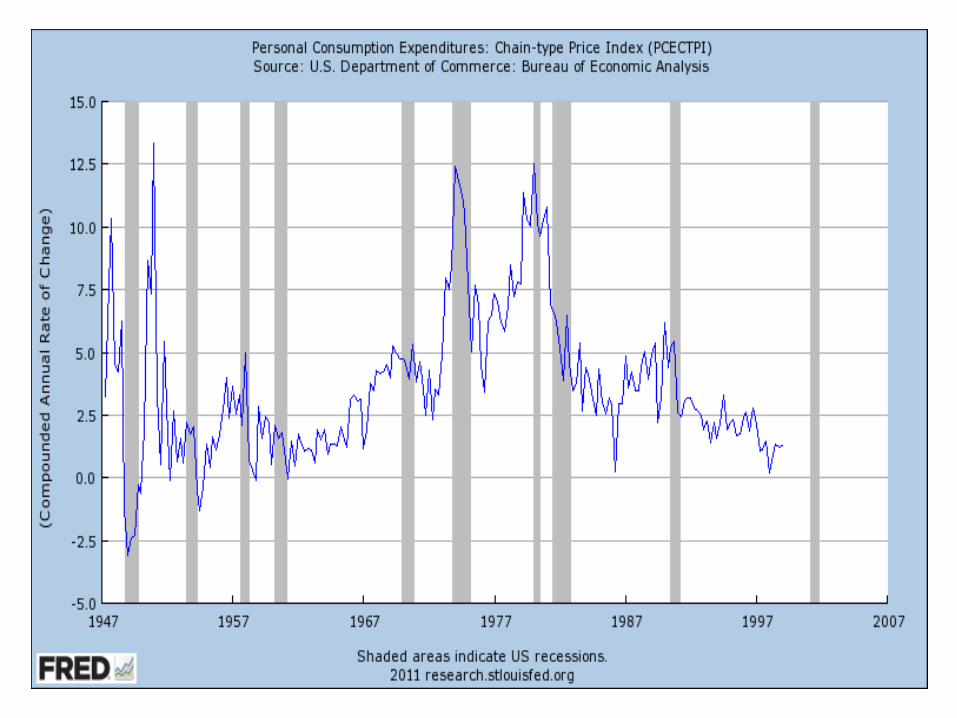
From J. Bradford DeLong, “America’s Peacetime Inflation,” in Romer and Romer, eds., Reducing Inflation: Motivation and Strategy (1997)

-6
-4
-2
0
2
4
6
8
1/1/
1866
1/1/
1869
1/1/
1872
1/1/
1875
1/1/
1878
1/1/
1881
1/1/
1884
1/1/
1887
1/1/
1890
1/1/
1893
1/1/
1896
1/1/
1899
1/1/
1902
1/1/
1905
Perc
ent
Hanes's Wage Inflation Series


From Hanes, “The Development of Nominal Wage Rigidity in the Late 19th Century”

From Hanes, “The Development of Nominal Wage Rigidity in the Late 19th Century”