lecture 10 el niño and the southern oscillation
TRANSCRIPT

lecture 10El Niño and the
Southern Oscillation(ENSO)Part I
sea surface height anomalies asmeasured by satellite altimetry

SPATIAL STRUCTUREOF ENSO

In 1899, the Indian monsoon failed,leading to drought and famine inIndia. This led Gilbert Walker, thehead of the Indian MeteorologicalService, to search for a way topredict the Indian monsoon. By theearly 20th century, he had identifieda peculiar see-saw relationshipbetween pressure over the maritimecontinent and India and the Pacificnear South America. When pressureis high over the eastern Pacific, it islow over the maritime continent, andvice versa. He called thisrelationship the SouthernOscillation.

Here is the contemporary view of the oscillation Walker discovered.This is the correlation of annual mean surface pressure with thesurface pressure gradient across the equatorial Pacific (pressure atTahiti minus Darwin). [Trenberth and Caron 2000]

In 1982, El Nino conditionsfirst appeared to the west ofthe date line and graduallyexpanded eastward. Thepanels show how, along theequator, the easterly tradewinds collapsed and werereplaced by westerly winds,while the zone of heavyprecipitation migratedeastward. The arrowsindicate the anomalouswinds. Precipitation isunusually high wherecontours are solid, and isunusually low wherecontours are dotted. Dindicated dry; W, wet. FromRasmussen and Wallace(1983), reprinted in Philander(1998).

The pressure pattern is associated with a very large-scale patternof precipitation anomalies. This is the correlation of annual meanprecipitation with the Southern Oscillation Index (pressure at Tahitiminus Darwin). [Trenberth and Caron 2000]

Since the 1800s, Peruvian fisherman noticed thattheir harvest completely failed every few years.This periodic event was associated with unusuallywarm waters off the coast of Peru. These warmwaters resulted from a shutdown of the upwellingcirculation normally found along the equator.Since upwelling supplies nutrients to the surfacewaters, this resulted in mass starvation of plantand animal life in the eastern equatorial Pacific.Since the periodic warming almost always occurredaround December, the fisherman named it El Niño,in reference to the Christ child.

Here is the contemporary view of sea surface temperature changeassociated with the Southern Oscillation. This is the correlation ofannual mean SST with the Southern Oscillation Index (pressure atTahiti minus Darwin). [Trenberth and Caron 2000]
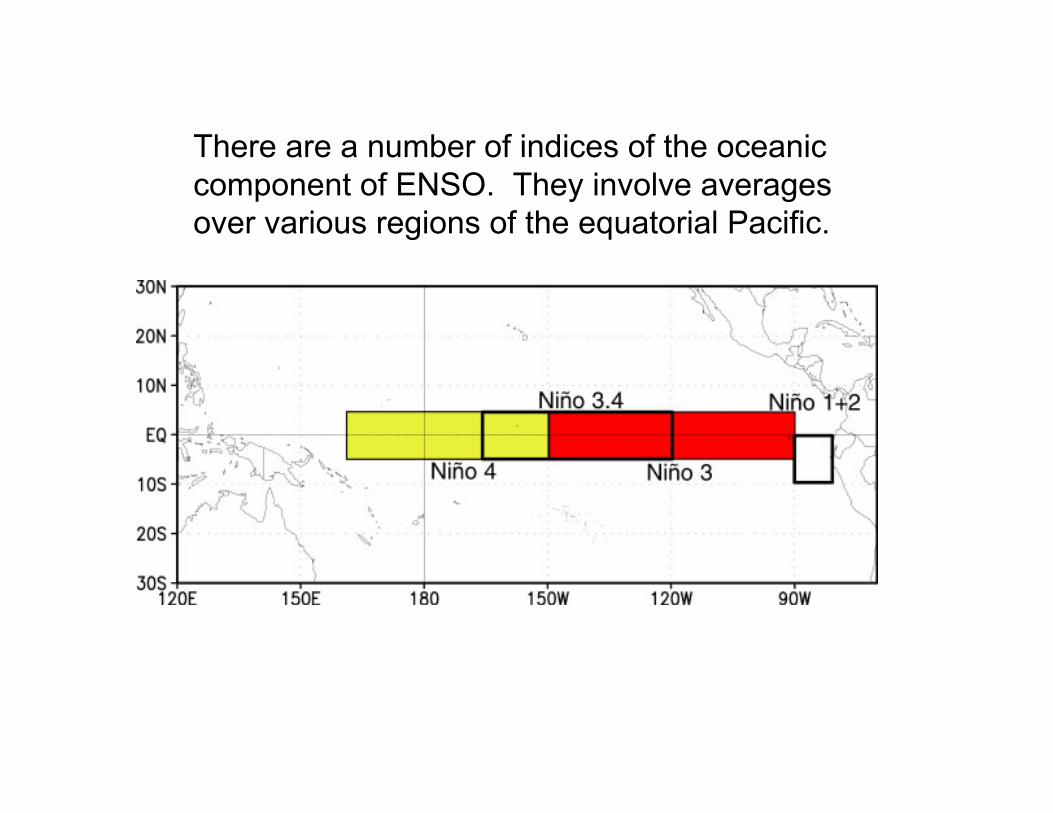
There are a number of indices of the oceaniccomponent of ENSO. They involve averagesover various regions of the equatorial Pacific.

1997/98 ENSO Evolution
Seasonal SST (left) and anomaly (right) for (a,b) DJF1997/98, (c,d) MAM 1998, (e,f) JJA 1998, (g,h) SON1998. Contour interval is 1ºC, with the 0.5ºC contourincluded. Anomalies are departures from the 1950-79adjusted OI climatology (Reynolds and Smith, 1995)(from BAMS, 1999, 80, S1-48)

Animation of the 1997-98 ENSO event

Animation of 4 El Niño events

Equatorial depth-longitude section of ocean temperatureanomalies for (a) DJF 1997/98, (b) MAM 1998, (c) JJA1998, (d) SON 1998. Contour interval is 1ºC. The dark lineis the 20ºC isotherm. Data are derived from an analysissystem that assimilates oceanic observations into anoceanic GCM (Behringer et al., 1998). Anomalies aredepartures from the 1983-92 base period means.
Variations in thermocline depth during ENSO

UNSTABLE AIR-SEAINTERACTIONS IN THE
TROPICS

If you look at sea surface temperature in the central equatorialPacific and the difference in pressure between Tahiti and Darwin,you see a very clear anti-correlation. Both of these are indices forthe ENSO phenomenon. The red portions are El Niño years, whilethe blue portions are La Niña years.
Note the typical timescale of the ENSOphenomenon.

How are atmosphere and oceanicconditions related during an El Niño?Under “normal” conditions, often referred toby the term La Niña, the easterly trade windsblow across the Pacific, generatingupwelling along the equator across most thePacific, and piling up warm water in thewest. The east-west contrast in sea surfacetemperature sets up low pressure and risingmotion in the west, and high pressure andsinking motion in the east.
When an El Niño occurs, the tradewinds collapse, upwelling of coldwater ceases along the equator, andsea surface temperatures rise in thecentral and eastern equatorialPacific. Pressure decreases in theseregions, and rising motion leads toprecipitation. Note also the changesin the tilt of the thermocline goingfrom El Niño to La Niña.

In 1969, UCLA professor Jacob Bjerknes was the first to recognizethat El Niño and the Southern Oscillation are actually manifestationsof the same physical phenomenon and that it results from an unstableinteraction between the atmosphere and the ocean. This resulted inthe term ENSO to refer to this phenomenon.

The Bjerknes Mechanism for growth of anomaliesBjerknes (1969) recognized that El Niño is theproduct of interaction between the ocean andatmosphere: A positive ocean-atmosphere feedback.
SST Walker Cell
Surface Wind
Ano
mal
y
Time
However, for the coupled system to oscillate, an out-of-phase restoring force is needed.
At the time, Bjerknes did not know what causes a turnaboutfrom a warm phase to a cold phase.
After the 1980s, the search began for the restoring force.

The effect of var-iations in the in-tensity of theBjerknes coupledfeedback strength onENSO behavior.A physical inter-pretation of thevariations in feedbackstrength is variationsin the mean depth ofthe thermocline.
reprinted in Philander(1998)