lecture 11 - concordia universityusers.encs.concordia.ca/~nrskumar/index_files/mech6491...lecture 11...
TRANSCRIPT

1
MECH 6491 Engineering Metrology
and Measurement Systems
Lecture 11
Instructor: N R Sivakumar

2
Spectroscopy
Introduction
Different Spectroscopy Methods
Fiber Optics
Introduction
Light Propagation
Fiber Optic Sensors
Fiber Bragg Sensors
Outline

Confocal Microscopy
Ordinary light microscope produces 2-D superposition of in-focus and
out-of-focus regions
Tracing only focused parts of photographs at different focus settings
difficult for specimens lacking clear borderlines
Slicing specimen into large number of thin sections is time-consuming
and may deform the specimen; cannot study living specimens this
way and alignment of images of different slices requires considerable
computer processing
In Confocal microscopy, a Laser beam illuminates spots on specimen
Computer compiles images created from each point to generate a 3-
dimensional image

Optical Principles
Specimen illuminated one point at a
time
Detector only registers light from
illuminated point
Resolution limit is improved
Very pronounced depth discrimination
is obtained
Can study different depth layers much
more clearly (no out-of-focus
information in image) and can study
surface structures

Why Confocal Microscopy?
3-D MICROSCOPY!
Scan a number of confocal images, refocusing
between successive images
Stack resulting images to produce 3-D structure
No need for alignment processing
Can record sections of live specimens
Can make projections of image to view from
different angles

Feasibility Studies
To successfully perform confocal
microscopy, specimen must be reasonably
transparent to allow light to penetrate to
regions below the surface of the specimen
Carlsson and Åslund selected three
different applications for their paper: two
physiological and one botanical

Feasibility Studies
Studied various neurons in spinal cord of lamprey
Used fluorescent confocal microscopy by staining cells with a dye
Obtained good understanding of 3-D structure of neurons by displaying projections through recorded volume in rapid succession
One difficulty in studying neurons is the specimen thickness (100s of μm): makes it impossible to scan deepest part of specimen using objective with large N.A.

Feasibility Studies
Studied ovule of Neuwiedia (an orchid)
Fragility of ovules limits physical slicing to 8μm; confocal microscopy allows specimen to remain intact and take ~1μm slices
Staining unnecessary due to autofluorescence from ovule wall and nuclei
Viewing sections more useful in this case
Digitization of data facilitates measurements of 3-D positions of nuclei, size of ovule, etc.

Feasibility Studies
Studied lung tissue from rat
Were able to avoid physical sectioning of specimen through confocal microscopy
Used data from individual sections directly for evaluation
Staining tissue before embedding in epoxy makes registering sections with high contrast possible
Stack of such sections allows measurement of interesting parameters concerning 3-D structure of lung tissue

10
A method used to identify and/or quantify
elements, atoms, molecules, matter, molecular structure
by observing absorption, emission or scattering interactions
with electromagnetic radiation (“light”)
generally involves measuring the absorption or the
emission of light by sample
What is Spectroscopy

11
From http://www.princeton.edu/~ehs/laserguide/section_1.htm
Electromagnetic radiation

12
Equation: C = v l
Speed of light, C = 3 x 1010 cm/sec
Frequency, v = cycles per second in Hz
Wavelength, l = distance between adjacent waves cm
Wave number, W = inverse of Wavelength in cm-1
Electromagnetic radiation

13
Absorption
“light” goes in, doesn’t come out
Emission
“light” is given off
Scattering
path of “light” is different than what went in,
frequency may be different too
Typical interactions

14
Absorption of light
Visible/UV (most often quantitative)
IR (more qualitative)
ESR (microwave)
NMR (radio frequency)
Emission of light
Fluorescence
Chemiluminescence
Other
Light scattering
X-ray diffraction
ORD (optical rotatory dispersion)
Typical interactions

15
What is a spectrum?
Graphical representation of what happens to electromagnetic
radiation
Ex. Infrared Spectrum (Aniline)
X: wavenumbers, y: transmittance

16
Some common techniques
Mass Spectrometry (1940s)
Raman (1930s/1960s)
UV/Vis (1941)
IR (1951)
Nuclear Magnetic Resonance (1952)
Electron Spin Resonance

17
Spectroscopy involves

18
Sources Provide some incident light or energy to be absorbed
by the sample that results the emission or transmission
As simple as a heated rod (glowbar)
A basic light bulb with a tungsten filament
Hollow cathode lamps
Lasers
Can have:
a broad range of emitted light
white light
a narrow range of emitted light
laser sources
adjustable intensity (like a dimmer on a lamp)
fixed intensity (like a simple light switch)

19
A typical UV-VIS Spectrophotometer has a Deuterium Gas Filled Lamp
for the UV-Range (200-350 nm) and a Tungsten Filament Lamp for the
visible to near IR range (350-1100 nm)
Some mechanism exists to switch from one lamp to the other when you
approach the threshold
Sources

20
Acronym:
ROY G BIV
Monochromator =
Dispersion element
plus slit system
MonoChromatorsEvery Good Spectrometer Needs a Monochromator

21
Monochromator = Wavelength Selector
Exit slit
MonoChromatorsEvery Good Spectrometer Needs a Monochromator

22
MonoChromators
Used to select wavelength (or range) of light that impinges
on the sample (absorbance, fluorescence)
This selected wavelength then strikes the detector
the ability to select the wavelength helps you to discriminate
between phenomena caused by sample
and that caused by interfering or
non-relevant species
Various types
based on filters
based on prisms
based on gratings

23
Filters Two types:
Interference filters depend on
destructive interference of the
impinging light to allow a
limited range of wavelengths
to pass through (expensive)
Absorption filters absorb
specific wavelength ranges of
light (cheaper)
Cutoff filters absorb light in a
specific range of wavelengths
Bandpass filters absorb light
outside of a specific range

24
Prisms
First type of widely used, wavelength selection devices
Often made of salts such as sodium chloride, etc.
VERY delicate. Often subject to damage in humidity
Not widely used today in spectroscopy equipment
The spectrometer resolving power, R, is defined as the wavelength
over the smallest resolvable wavelength change

25
Gratings Widely used in instruments today.
Light reflected off a surface is used for
selection of wavelengths
High resolution (<0.01 nm) if needed
Most expensive optical part of an
instrument
Resolving Power
Where m is diffraction
order and
Higher resolving power means a better
ability to separate light

26
Monochromator - Configuration
Czerny-Turner
(most common)
Prism
(Old School)

27
Slits Control the entrance of light into and out from the monochromator
Entrance slits control the light intensity entering the
monochromator and help control the range of wavelengths of light
that strike the grating
Less important than exit slits
Exit slits help select the range of wavelengths that exit the
monochromator and strike the detector
More important than entrance slits
Can be:
Fixed (just a slot)
Adjustable (effective bandwidth and intensity)

28
No absorption
Direction of light altered
Reflection; Scattering
Refraction (as a prism) due to different refractive index
Diffraction – dispersion into wavelengths (diffraction grating)
Absorption by molecule of interest
Energy is transferred to molecules absorbing light. I is the
intensity of light (# photons/sec).
When Light hits the Sample …
Io (Incident light) I (Emergent light)
reflection
light path
scatter
Transmission
Absorption
Io (Incident light) I (Emergent light)
reflection
light path
scatter
Transmission
Absorption

29
Absorbance
log scale
0 1 20 40 60 80 100
%T
012
linear scale
Absorbance vs. Transmittance
T = I1/I0 A = -logT = log (I0/I1) Or, log (1/T)
Beer-Lambert Law
where = molar extinction coefficient (M-1cm-1)
b = path length (cm); c = concentration (mole/liter)
Therefore, with this relationship you can see that absorbance (A)
is directly proportional to the pathlength (b) and the sample
concentration (c).
A = b c

30
lmax
Abso
rban
ce
Concentration (M)
Abso
rban
ce
Concentration (M)
UV/Vis Spectroscopy

31
Fluorescence Spectroscopy
Fluorescence is an emission phenomenon
The incident energy (light) kicks an electron of an atom from a
lower energy state into an excited state
Then, the electron releases energy in the form of fluorescent light
when it falls back to the ground (lower energy) state
The energy transition from a higher to lower state within the
molecule concerned is measured by the detection of this emitted
radiation rather than the absorption

32
Fluorescence Spectroscopy
Fluorescent light (emission)
always has a longer
wavelength than the exciting
light

33
Introduction
• Ellipsometry is an optical technique for determining properties of surfaces and thin films.
• The instrument analyses polarized light. (A change in the polarization upon reflection from a surface).
• It does not measure a film thickness, or a surface coverage, or a refractive index.
Optical methods are, for this purposes, indirect methods:
Information about the samples is not directly obtained,but requires calculations based on idealized models.
Film Thickness - Ellipsometry
34
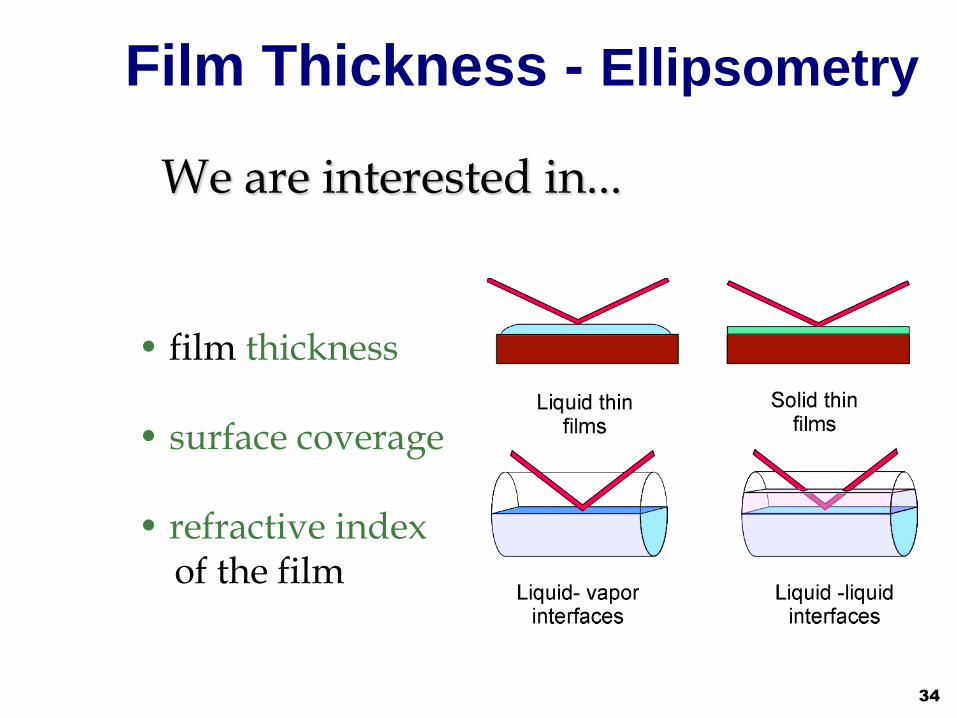
We are interested in...
• film thickness
• surface coverage
• refractive indexof the film
Film Thickness - Ellipsometry

35
The phenomenon of polarization
Malus’ law
2
0 cosII
Malus’ law describes the angular dependence of the intensity of light emitted from two polarizers in series. The angle is between the two polarization planes. I0 is the maximum intensity.
1cos00
0cos900
Maximum intensity
Nil intensity
Film Thickness - Ellipsometry

36
Polarized light
Superposition of two
linear polarized waves
Linear polarized light
No phase shift
90° phase shift, equal amplitudes
Film Thickness - Ellipsometry

37
The polarization can be described by:
• ratio of amplitudes
• phase shift
Elliptically polarized light
• 90° phase shift, unequal amplitudes• Phase shift other than 0° or 90°
elliptically polarized light
Film Thickness - Ellipsometry

38
Elliptically polarized light
Upon reflection the polarization will change
Upon reflection from the sample surface:
The amplitude ratio and/or the phase shift change
D (Del) and Y (Psi) quantify these changes
tanY is connected to the ‘amplitude ratio’,
and D is connected to the ‘phase shift’.
Ellipsometers measure two angles, called D (Del) and Y (Psi)
Film Thickness - Ellipsometry

39
When the light beam reaches the surface, some of the light is reflected and some passes into the material
The law of reflection says that the angle of the incidence is equal to the angle of reflection
Interaction of light with material
Snell’s law
N1 sin1 N2 sin2
for dielectric materials k 0
n1 sin1 n2 sin2
Film Thickness - Ellipsometry
iknN

40
The incident beam and the reflected beam define the
plane of incidence. Reflectivity.
Calculations are done with Fresnel’s formulas.
Reflectivity is calculated for linear polarized light
(p- polarized or s-polarized), yielding Rp and Rs.
P = parallel to the plane of incidence
S = perpendicular to the plane of incidence
Total reflection coefficients
Ep
Es
R – the ratio of the amplitude of the outgoing wave compared to that of the incoming wave
Film Thickness - Ellipsometry

41
medium1
medium2
p - WAVE
Hr
Er
Hi
Ei
Ht
Et
E - electric vector
H - magnetic vector
i - incident
r - reflected
t - transmitted
Film Thickness - Ellipsometry

42
s - WAVE
HrEr
Ei
Ht
Et
Hi
medium1
medium2
E - electric vector
H - magnetic vector
i - incident
r - reflected
t - transmitted
Film Thickness - Ellipsometry

43
The fundamental equation of ellipsometry
(precisely measured) (calculated for a given model)
tanYe(iD) = Rp / Rs
These total reflection coefficients (Rp and Rs) contain
complete information on the change in polarization.
Film Thickness - Ellipsometry

44
2112
2112
2211
2211
coscos
coscos
coscos
coscos
NN
NNR
NN
NNR
p
s
The fundamental equation of ellipsometry
iknN n=index of refraction
k=extinction coefficient
Optical constants n and k describe how light interacts with the material
v
cn
Speed of light in a vacuum
Speed of light in a material
k measures how much light is absorbed in the material and is dependent on l
1
2The incident angle
The refracted angle
N The complex index of refraction
1N
2N
The complex index of refraction of material 1The complex index of refraction of material 2
tanY e(iD) = Rp / Rs
Film Thickness - Ellipsometry

45
Quarter wave plate(compensator)
Light source Polarizer
Sample
Analyzer
Light detector
Apparatus Basics – nulling ellipsometer
Film Thickness - Ellipsometry

46
Ellipsometer
Film Thickness - Ellipsometry

47
Reflections with films
Multiple interfaces If more than one interface is present, the resultant reflected beam is made up of the initially reflected beam and the infinite series of beams which are transmitted from medium 2 back into medium 1
Rp and Rs in this case are function of b, where: 22 cos2 l
b Nd
l – the wavelength of the operation.
From Rp/Rs we find the thickness of the film.
Film Thickness - Ellipsometry

48
Examples
The delta/psi domain
The lower left quadrant is where the D /Y points for a free-film material (a substrate) will be located.The film-free values for several dielectrics, metals and semiconductors are shown
D
Film Thickness - Ellipsometry

49
Transparent filmExamples
The delta/psi trajectory for a transparent film of SiO2
(n=1.46, k=0) on a siliconsubstrate.The thickness where the trajectory closes on itself is a function of the angle of incidence, a wavelength and nair and nfilm.For measured D and Y there is a specific thickness of the film.
Film Thickness - Ellipsometry

50
ExamplesTransparent film
The D /Y trajectories for transparent films with different indices of refraction on silicon.Note that there are regions where the curves are not well separated. In these regions it is hard to determine the exact index of refraction.
Film Thickness - Ellipsometry

51
Absorbing film
Examples
The D /Y trajectory for a growing film of Ta on a silicon substrate.For a very thick film of an absorbing material, the delta/psi point will be characteristic of a substrate of the film material.The film-growth trajectory, therefore, is the movement from the silicon point to the tantalum point.
Film Thickness - Ellipsometry
http://www.ccn.yamanashi.ac.jp/~kondoh/el
lips_e.html (ellips 2.xls)

52
Fibre Optic Metrology
With a carrier frequency of some 1014 Hz, light has the potential of
being modulated at much higher frequencies than radio waves
Since the mid-1960s the idea of communication through optical fibers
has developed into a vital branch of electro-optics
Great progress has been made in many communication systems
From the viewpoint of optical metrology, optical fibers are an
attractive alternative for guiding light
An even more important reason for studying optical fibers is their
potential for making new types of sensors

53
Light Propagation
Optical fiber consists of a central cylindrical core with refractive index n1,
surrounded by a layer of material called the cladding with a lower refractive
index n2
If < light will undergo total internal reflection between the core and the
cladding and propagate along the fiber, ideally with no loss
If > light will be lost. is an important parameter in fiber coupling
usually given by the NA

54
Coupling of the light can be
done with the help of a lens,
Light Propagation
or by putting the fibre in close proximity to the light source and linking
them with an index-matching liquid to reduce reflection losses

55
Sensors using optical fibers have the potential for sensing
acoustic pressure, magnetic fields, temperature, acceleration and
rate of rotation
Sensors for measuring current and voltage based on polarization
rotation induced by the magnetic field around conductors due to
the Faraday effect in optical fibers have been developed
Lot of standard optical equipment (Laser Doppler velocimeter)
has been redesigned using optical fibers
Fibre optic Sensors

56
Temperature Sensor - Thin semiconductor chip is sandwiched between
two ends of fibers inside a steel pipe
Light coming through the fiber is partly absorbed by the semiconductor
This absorption is temperature-dependent and the amount of light detected
at the end of the fiber to the right is therefore proportional to the
temperature
Fibre optic Sensors

57
Pressure Sensor
The optical fiber is placed between two corrugated plates
When pressure is applied to the plates, the light intensity transmitted by the
fiber changes, owing to micro-bending loss
Such systems have also been applied as hydrophones and accelerometers
Fibre optic Sensors

58
Fiber-optic sensors based on interferometry - The fibers A and B can be
regarded as either arm in a Mach-Zehnder interferometer where the detector
will record an intensity which is dependent on the optical path length
difference through A and B
When fiber A is exposed to loads such as tension, pressure, etc., the optical
path length of A will change and one gets a signal from the detector
proportional to the load
Fibre optic Sensors

59
Special application of optical fibers - two fibre bundles, A and B, are mixed
together in a bundle C in such a way that every second fiber in the cross-
section of C comes from, say, bundle A.
Shows two neighboring fibers, A and B. Fiber A emits a conical light beam.
Fiber B will receive light inside a cone of the same magnitude
Fibre optic Sensors
If a plane surface is placed a distance l in
front of the fiber ends, light will be
scattered back and the amount of light
received by fiber B will be proportional to
the area of overlap between the two cones

60
A curve describing the relation between the received light
intensity IB versus the distance l therefore will look like that
given in c
For a distance l so long that the whole cross-section of fiber
B is covered with light, IB will have its maximum
A further increase in l will decrease the value of IB
Fibre optic Sensors
When bundle C is placed close to
surface the detector will get signal
proportional to distance
If it is in the linear portion, the
resolution can be in nanometers

61
Most important innovation of the 1990s in optical fibre sensing is the
development of fiber bragg grating (FBG) sensors
FBG is a periodic perturbation of the refractive index along the fiber length
which is formed by exposure of the core of doped silica single-mode fibers by
UV laser light using phase masks
or more efficiently, directly during the drawing process by an interference
pattern of short laser pulses.
The formation of permanent gratings in an optical fiber was first
demonstrated by Hill et al. in 1978
Fibre Bragg Sensors

62
FBGs work is similar to a reflection hologram
http://www.youtube.com/watch?v=CJGYVw8WpuQ
When the object and reference waves are incident from opposite sides of the
thick hologram emulsion, layers of metallic silver of the developed hologram
are parallel to the hologram plane.
By reconstructing the hologram in white light, the reconstructed wave would
be single colored with a wavelength equal to 2d where d is the layer spacing.
The refractive index variations in the core along the fiber length (the Z axis)
can be described as
Where q = 2/d is the frequency; nc is RI of Core (1.46); Dn is the amplitude
of RI variations and d is the grating period
Fibre Bragg Sensors

63
When a wave ui(li) is incident from the left into a fiber, light with a narrow
bandwidth is reflected from the refractive index variations, maximum
reflectance occurring at the Bragg wavelength (lB = 2d)
The unreflected light is transmitted
Spectral Width Dl
Fibre Bragg Sensors

64
The unreflected light is transmitted and a typical intensity profile for
the transmitted light is shown
The intensity profile of the reflected light is found by turning the figure
upside down
Fibre Bragg Sensors
Experiments have shown that
using L= 10 mm and d = lB/2n
= 1.5446/(2 * 1.46) = 0.53 µm,
gives Dl = 1.12 Å, which
compares quite well with the
experimental value of 1.75 Å

65
FBGs have been used in fibre optic communication, optical
switching, optical signal processing and optical storage
FBGs as sensors - any change in fibre properties, such as
strain, which varies the grating pitch, will change lB.
Shifts in the spectrum are independent of the light intensity
With careful selection of the lBs, FBG sensors can be coupled
in tandem without affecting the measurand of each other
Fibre Bragg Sensors

66
The sensitivity is governed by the fiber elastic, elasto-optic properties and the
nature of the load or strain applied to the structure that the fiber is attached to.
The shift in DlB due to strain is given by
Where the principal strains 1 and t are along and traverse to the fiber axis
respectively. If the strain is homogenous then
P11 and P12 are pockels coeff and is the poisson ratio
Fibre Bragg Sensors
Typical sensitivity to axial strains are
1nm/millistrain at 1300nm and 0.64nm/
millistrain at 820nm

67
The temperature sensitivity is mainly due to the thermo-optic effect.
Figure shows DlB as a function of temperature at lB = 1556 m
Response is almost linear sensitivity =
FBG sensors can also be used to measure acoustic signals
Fibre Bragg Sensors
However, the sensitivity is quite
low (10-10 Pa-1) because the
glass fiber is very stiff
The sensitivity is also low for
measuring electric and
magnetic fields