lecture 15 spectra of stars.ppt - texas a&m...
TRANSCRIPT

Lecture 15:
The Spectra of Stars
Astronomy 101 – Wednesday, February 25

Colors of StarsColors of Stars
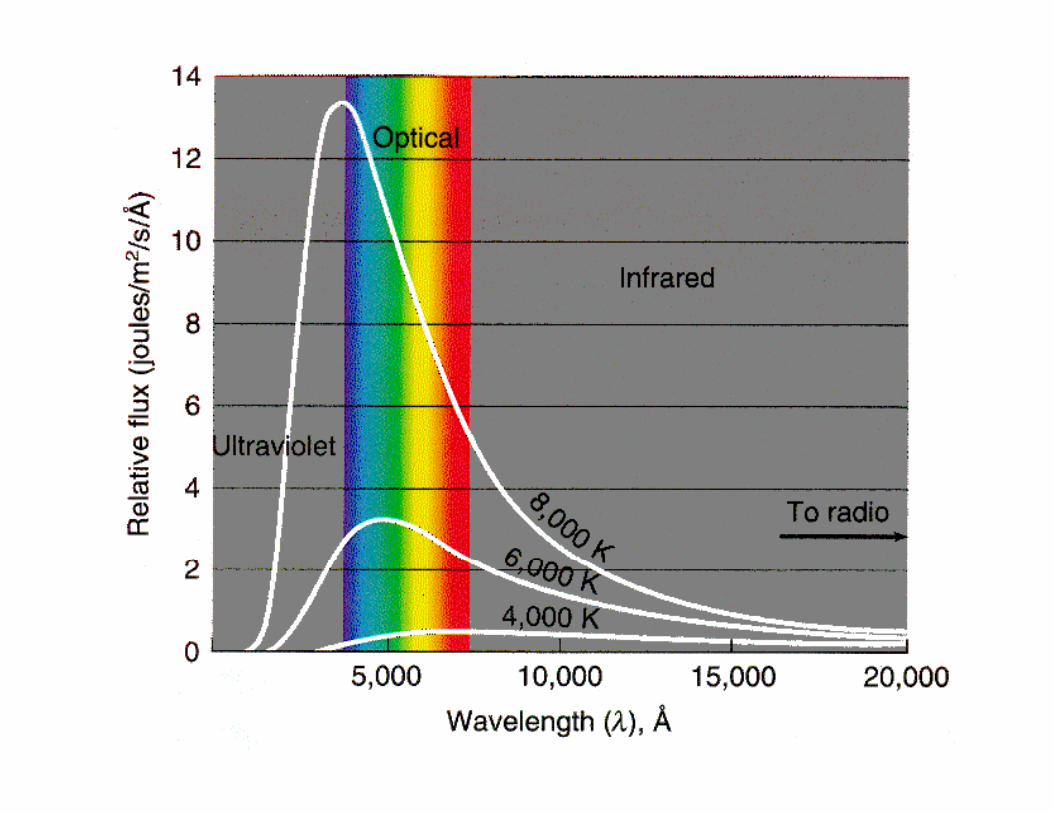
• Stars are made of hot dense gasStars are made of hot, dense gas– Continuous spectrum from the lowest visible layers (“photosphere”)layers ( photosphere ).
– Approximates a blackbody spectrum.
• From Wien’s Law we expect:• From Wien s Law, we expect:– hotter stars appear BLUE (T=10,000‐50,000 K)middle stars appear YELLOW (T~6000K)– middle stars appear YELLOW (T 6000K)
– cool stars appear RED (T~3000K)

Spectra of StarsSpectra of Stars
• Hot dense lower photosphere of a star isHot, dense lower photosphere of a star is surrounded by thinner (but still fairly hot) atmosphereatmosphere.– Produces an Absorption Line spectrum.
Lines come from the elements in the stellar– Lines come from the elements in the stellar atmosphere.

Spectral Classification of StarsSpectral Classification of Stars
• Astronomers noticed that stellar spectraAstronomers noticed that stellar spectra showed many similarities.
• Can stars be classified by their spectra?• Can stars be classified by their spectra?
• Draper Survey at Harvard (1886 1897):• Draper Survey at Harvard (1886‐1897):– Objective Prism Photography
bt i d t f 100 000 t– obtained spectra of >100,000 stars
– hired women as “computers” to analyze spectra

Objective Prism Spectra

Harvard ClassificationHarvard Classification
• Edward Pickering’s first attempt at aEdward Pickering s first attempt at a systematic spectral classification:– Sort by Hydrogen absorption line strength– Sort by Hydrogen absorption‐line strength
– Spectral Type “A” = strongest Hydrogen lines
followed by types B C D etc (weaker)– followed by types B, C, D, etc. (weaker)
• Problem:Other lines followed no discernible patterns.

Edward Pickering Harvard “Computers” (c. 1900)

Annie Jump CannonAnnie Jump Cannon
• Leader of Pickering’s “computers” she noticedLeader of Pickering s computers , she noticed subtle patterns among metal lines.
• Re arranged Pickering’s ABC spectral types• Re‐arranged Pickering s ABC spectral types, throwing out most as redundant.
L f 7 i d 3 d l• Left 7 primary and 3 secondary classes:
• O B A F G K M (R N S)
• Unifying factor: Temperature

Annie Jump CannonAnnie Jump Cannon

The Spectral SequenceThe Spectral Sequence
O B A F G K M L THotter Cooler
50,000K 2000KBluer Redder
50,000K 2000K
Spectral Sequence is a Temperature Sequence

Spectral TypesSpectral Types

The Spectral Sequence is a Temperature Sequence
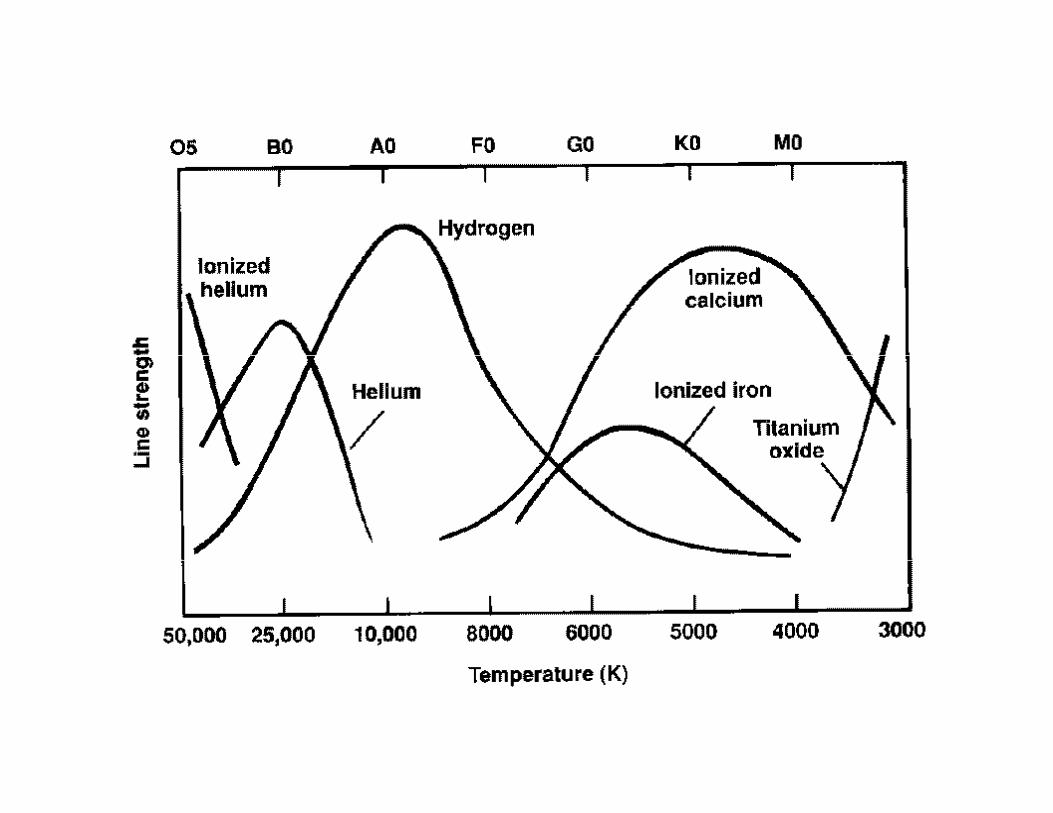
• Gross differences among the spectral types are due to differences in Temperatureare due to differences in Temperature.
• Composition differences are minor at best.– Demonstrated by Cecilia Payne‐Gaposhkin in 1920’s
• Why?What lines you see depends on the state of excitation and ionization of the gas.
Example: Hydrogen LinesExample: Hydrogen Lines
• Visible Hydrogen absorption lines come fromVisible Hydrogen absorption lines come from the second excited state.
• B Stars (15 30 000 K):• B Stars (15‐30,000 K):
Most of H is ionized, so only very weak H lines.
• A Stars (10 000 K):• A Stars (10,000 K):
Ideal excitation conditions, strongest H lines.
G St (6000 K)• G Stars (6000 K):
Too cool, little excited H, so only weak H lines.
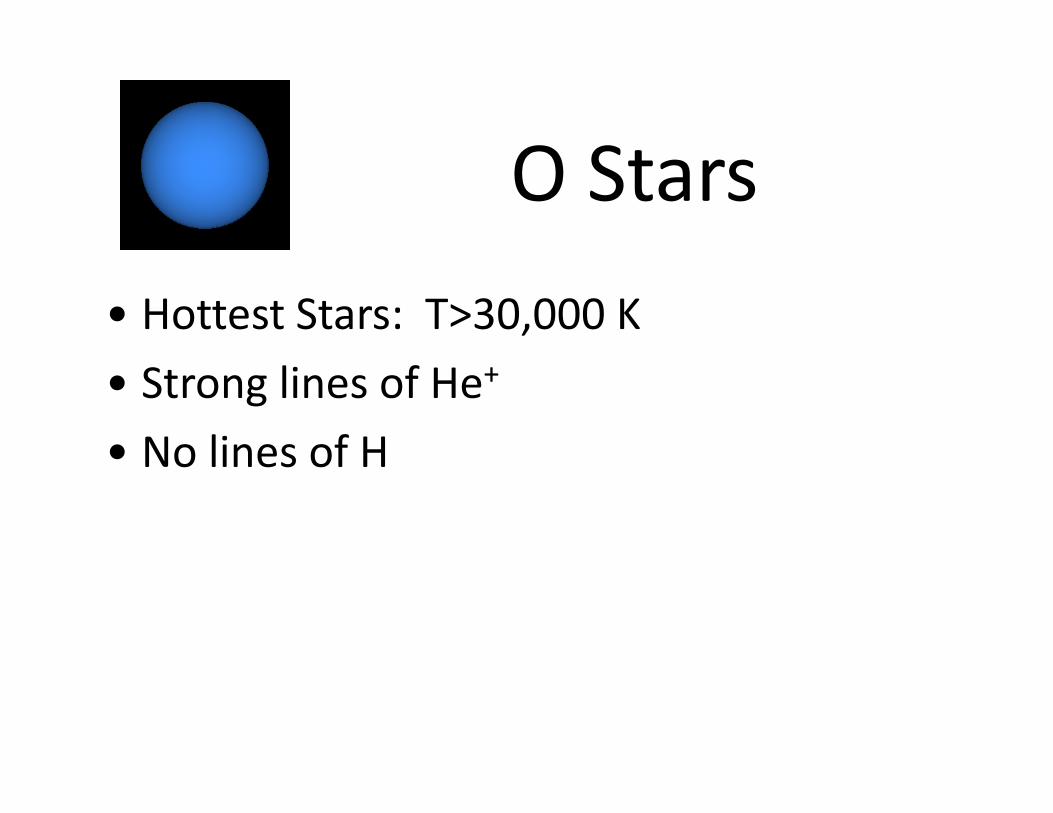
O StO Stars
• Hottest Stars: T>30,000 K
• Strong lines of He+
• No lines of H• No lines of H

B StB Stars• T=15,000 30,000 K• Strong lines of He
• Very weak lines of HVery weak lines of H

A StA Stars
• T = 10,000 7500 K• Strong lines of H
• Weak lines of Ca+• Weak lines of Ca+

F StF Stars• T = 7500 6000 K• weaker lines of H
• Ca+ lines growing strongerCa lines growing stronger
• first weak metal lines appear
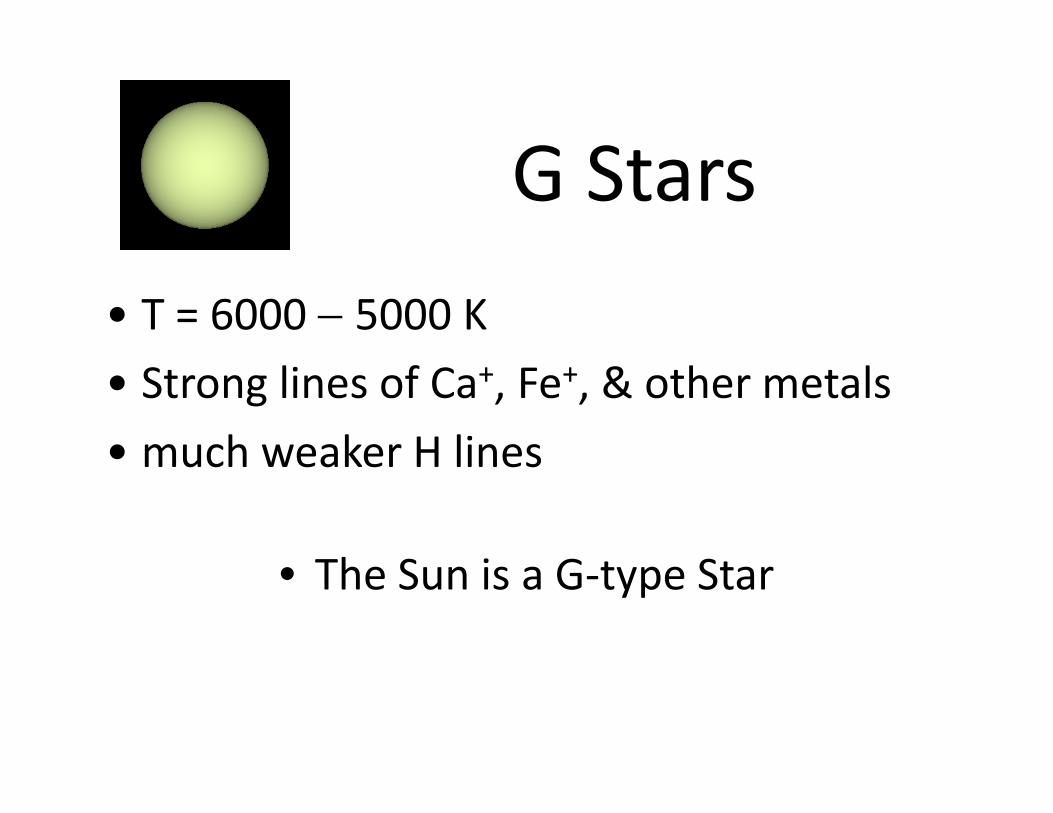
G StG Stars
• T = 6000 5000 K• Strong lines of Ca+, Fe+, & other metals
• much weaker H lines• much weaker H lines
Th S i G S• The Sun is a G‐type Star

K StK Stars• Cool Stars: T = 5000 3500 K• Strongest metal lines
• H lines practically goneH lines practically gone
• first weak CH & CN molecular bands

M StM Stars
• Very cool stars: T 2000‐3500 K• Strong molecular bands (especially TiO)
• No lines of H• No lines of H
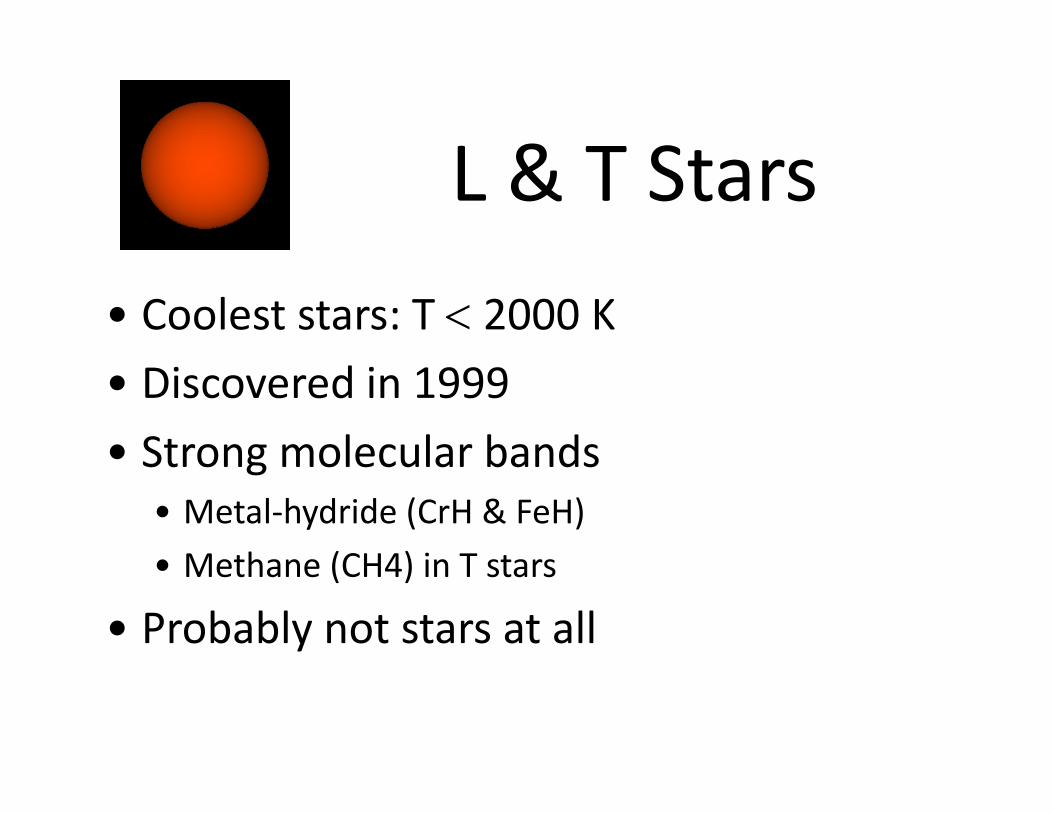
L & T StL & T Stars
• Coolest stars: T 2000 K• Discovered in 1999
• Strong molecular bands• Strong molecular bands• Metal‐hydride (CrH & FeH)
• Methane (CH4) in T stars• Methane (CH4) in T stars
• Probably not stars at all

Modern Synthesis: The M‐K SystemModern Synthesis: The M K System
• An understanding of atomic physics and betterAn understanding of atomic physics and better techniques permit finer distinctions.
• Morgan Keenan (M K) Classification System:• Morgan‐Keenan (M‐K) Classification System:Start with Harvard classes:
• O B A F G K M L TSubdivide each class into numbered subclasses:
• A0 A1 A2 A3 ... A9
Examples:Examples:
• The Sun:The Sun:G2 star
• Other Bright Stars• Other Bright Stars:Betelgeuse: M2 star (Orion)
( )Rigel: B8 star (Orion)
Sirius: A1 star (Canis Major)
Aldebaran: K5 star (Taurus)
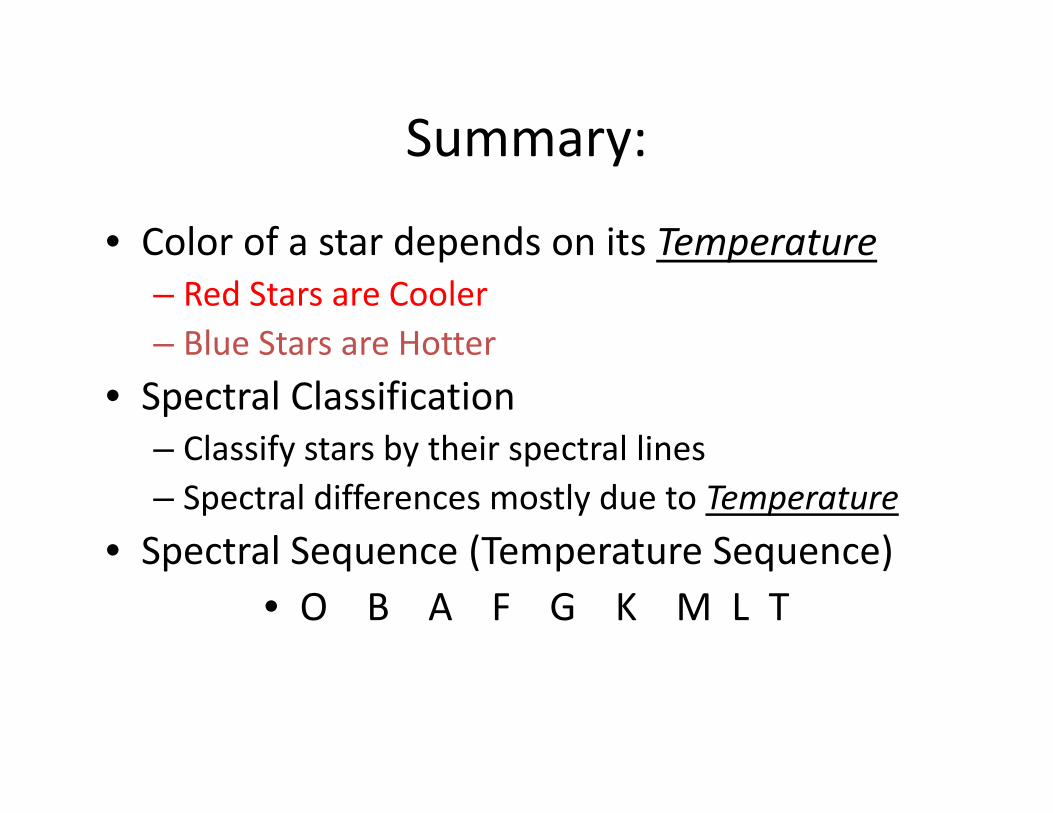
Summary:Summary:
• Color of a star depends on its TemperatureColor of a star depends on its Temperature– Red Stars are Cooler– Blue Stars are Hotter
• Spectral Classification– Classify stars by their spectral linesClassify stars by their spectral lines– Spectral differences mostly due to Temperature
• Spectral Sequence (Temperature Sequence)Spectral Sequence (Temperature Sequence)• O B A F G K M L T
Questions:Questions:
• What does the temperature of a star mean?What does the temperature of a star mean?• Are there stars with temperatures higher than 50000K?50000K?
• Are hotter stars brighter than cooler stars? Are they more luminous?they more luminous?
• Why did it take so long to find L & T stars?