lecture 16: factorial anova interactions practice laura mcavinue school of psychology trinity...
Post on 22-Dec-2015
215 views
TRANSCRIPT
Lecture 16:Factorial ANOVA Interactions
Practice
Laura McAvinue
School of Psychology
Trinity College Dublin

Recall Eysenck’s Study
Eysenck was interested in the effects of Age & Depth of Processing on Recall. He obtained a sample of 60 old & young participants and randomly assigned them to three groups. All three groups were given a list of words to study. The first group was asked to count the number of letters in each word, the second group was asked to think of an adjective that could be used with the word and a third group was asked to form an image associated with the word.
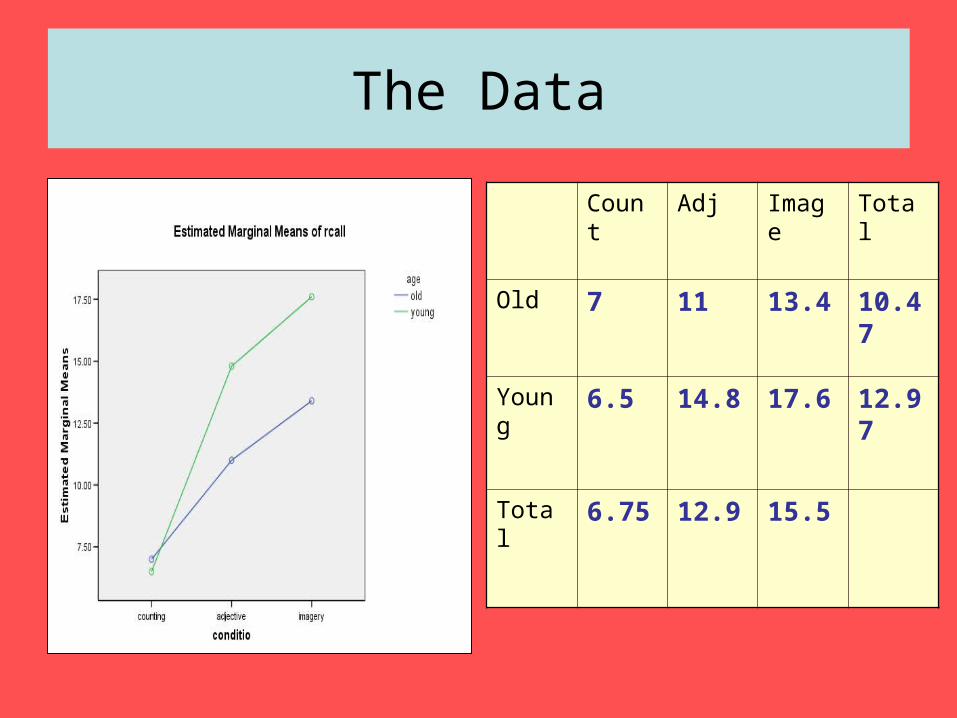
The Data
Count Adj Image Total
Old 7 11 13.4 10.47
Young 6.5 14.8 17.6 12.97
Total 6.75 12.9 15.5
• This factorial ANOVA will allow us to investigate three kinds of effects. What are these?
– Main effect due to Age– Main effect due to Learning Condition– Interaction between Age & Learning Condition
Factorial ANOVA
• Dependent variable = Recall
• Independent variables = Age & Learning Condition
• Ask for descriptive statistics
• Ask for homogeneity of variance test
• Ask for profile plot of the means
Run the Factorial ANOVA

Check the Assumptions
• Is Levene’s statistic significant?– Yes!
• What can we conclude from this?– We cannot assume equality of variance
among the groups– Results of ANOVA may not be valid
Levene's Test of Equality of Error Variancesa
Dependent Variable: rcall
3.167 5 54 .014F df1 df2 Sig.
Tests the null hypothesis that the error variance of thedependent variable is equal across groups.
Design: Intercept+age+conditio+age * conditioa.
• Is there a main effect of age? – Report this
• Is there a main effect of Condition? – Report this
• Is there an interaction between Age & Condition? – Report this
Examine the Output
What does the ANOVA tell us?
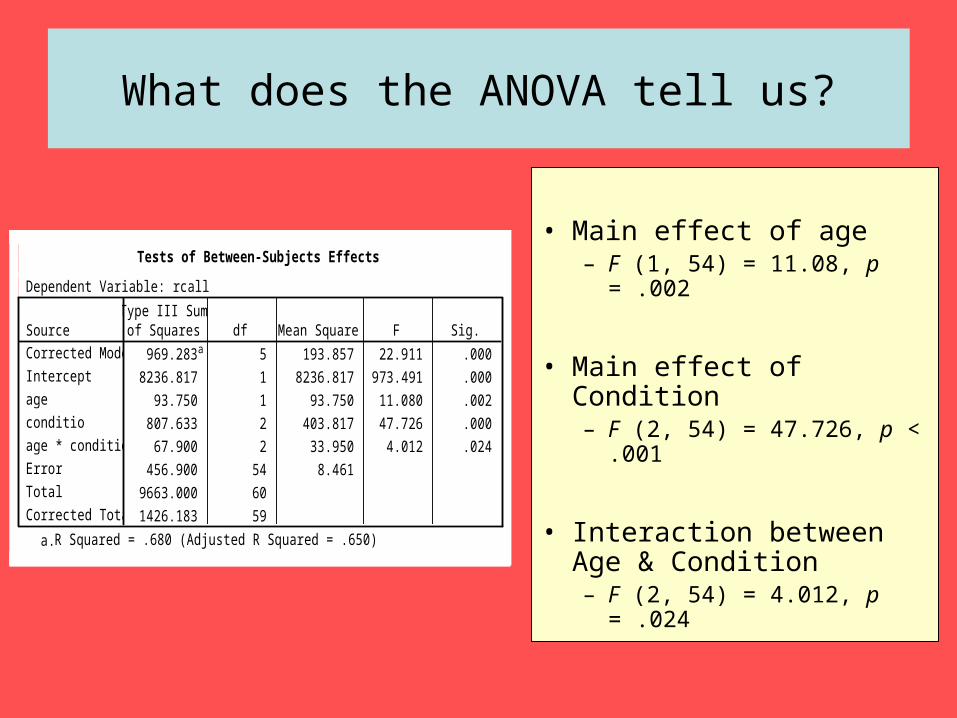
Tests of Between-Subjects Effects
Dependent Variable: rcall
969.283a 5 193.857 22.911 .000
8236.817 1 8236.817 973.491 .000
93.750 1 93.750 11.080 .002
807.633 2 403.817 47.726 .000
67.900 2 33.950 4.012 .024
456.900 54 8.461
9663.000 60
1426.183 59
SourceCorrected Model
Intercept
age
conditio
age * conditio
Error
Total
Corrected Total
Type III Sumof Squares df Mean Square F Sig.
R Squared = .680 (Adjusted R Squared = .650)a.
• Main effect of age– F (1, 54) = 11.08, p = .002
• Main effect of Condition – F (2, 54) = 47.726, p
< .001
• Interaction between Age & Condition – F (2, 54) = 4.012, p = .024
• What is a main effect?– The effect of one independent variable averaged across the levels
of the other independent variable
– The effect of one independent variable ignoring the other variable
• What is a simple effect?– The effect of one variable at one level of another variable
• Should we do an analysis of simple effects here?– Yes!
• Why?– Because there is a significant interaction between Age & Condition
– In order to tease apart the interaction
Simple Effects
What are the Simple Effects we can analyse?
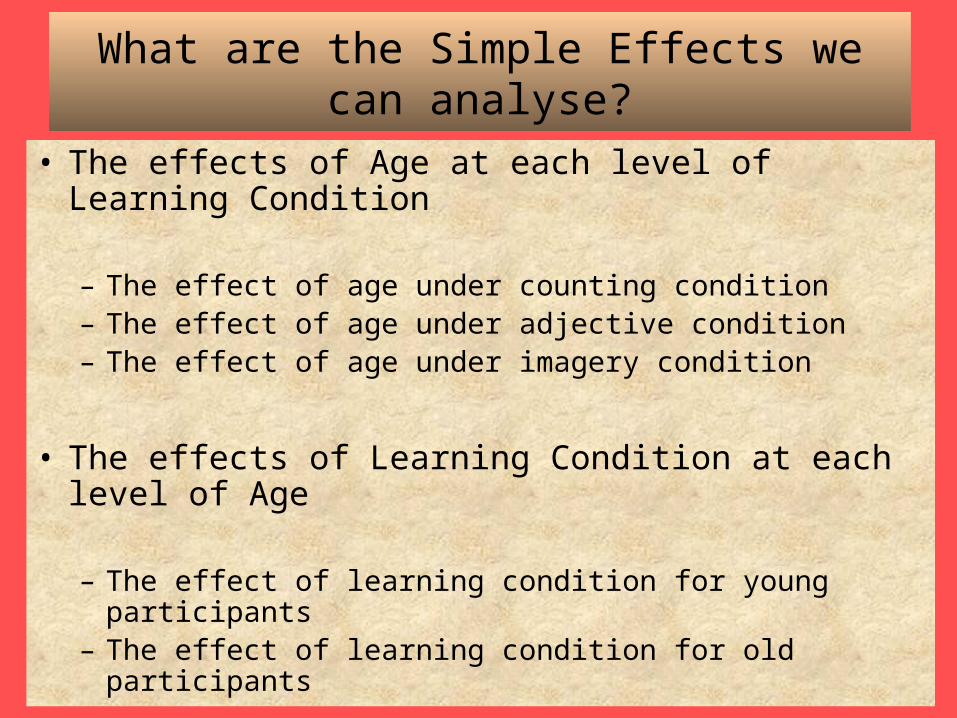
• The effects of Age at each level of Learning Condition
– The effect of age under counting condition– The effect of age under adjective condition– The effect of age under imagery condition
• The effects of Learning Condition at each level of Age
– The effect of learning condition for young participants– The effect of learning condition for old participants

• Split File
• Organise output according to Learning Condition
• One Way ANOVA with Recall as the dependent variable & Age as the independent variable
• Split File
• Organise output according to Age
• One Way ANOVA with Recall as the dependent variable and Learning Condition as the Independent variable
Simple Effects of Age at each Level of
Learning Condition
Simple Effects of Learning Condition at
each Level of Age
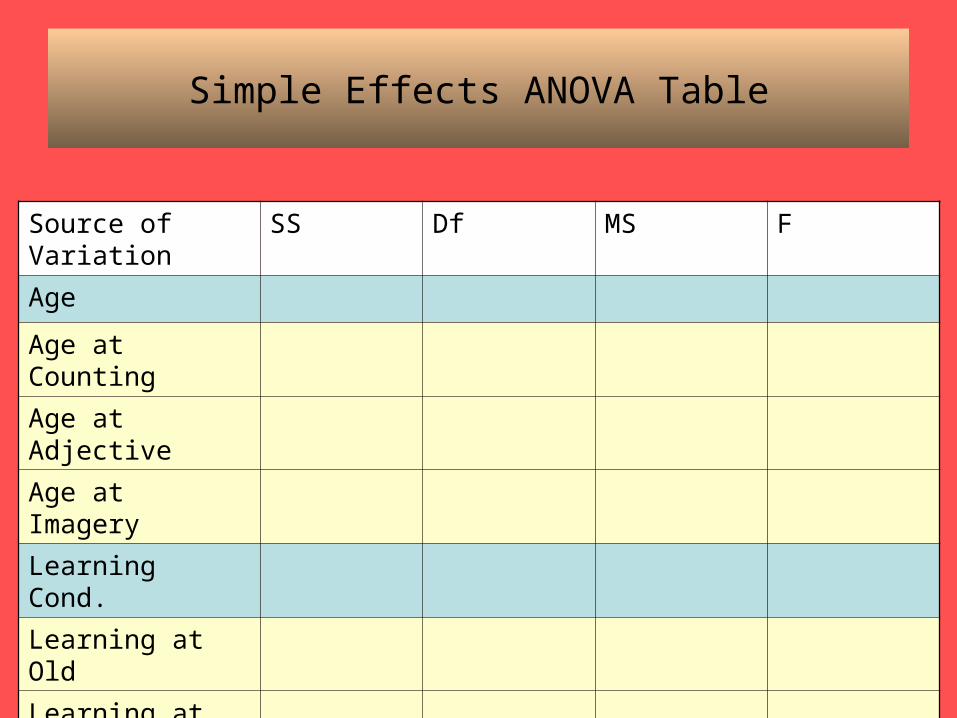
Simple Effects ANOVA Table
Source of Variation
SS Df MS F
Age
Age at Counting
Age at Adjective
Age at Imagery
Learning Cond.
Learning at Old
Learning at Young
Error
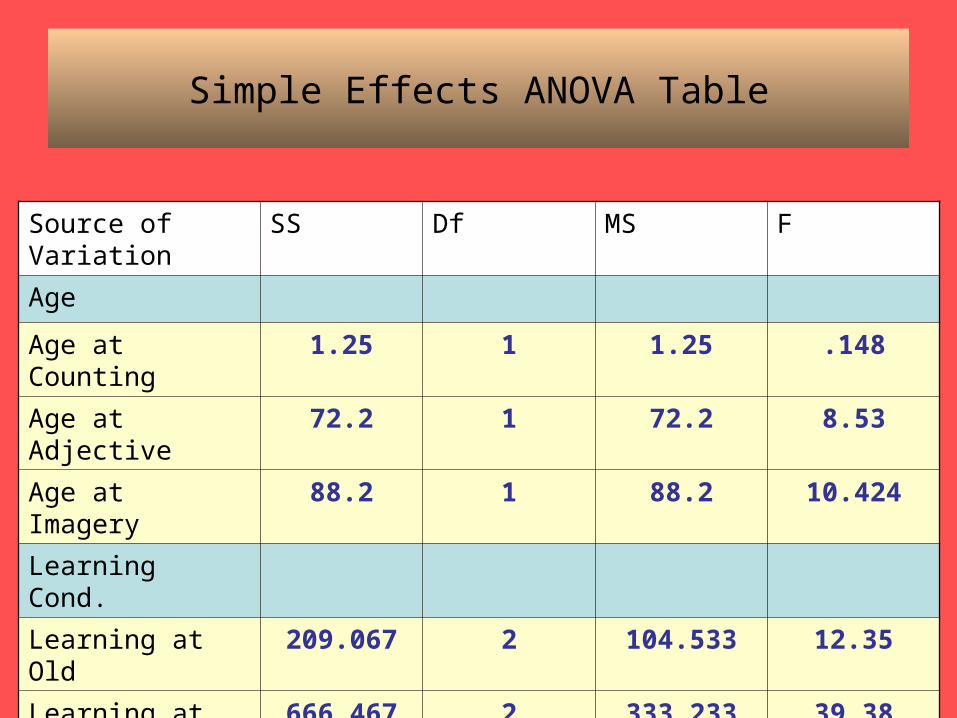
Simple Effects ANOVA Table
Source of Variation
SS Df MS F
Age
Age at Counting 1.25 1 1.25 .148
Age at Adjective 72.2 1 72.2 8.53
Age at Imagery 88.2 1 88.2 10.424
Learning Cond.
Learning at Old 209.067 2 104.533 12.35
Learning at Young 666.467 2 333.233 39.38
Error 456.9 54 8.461
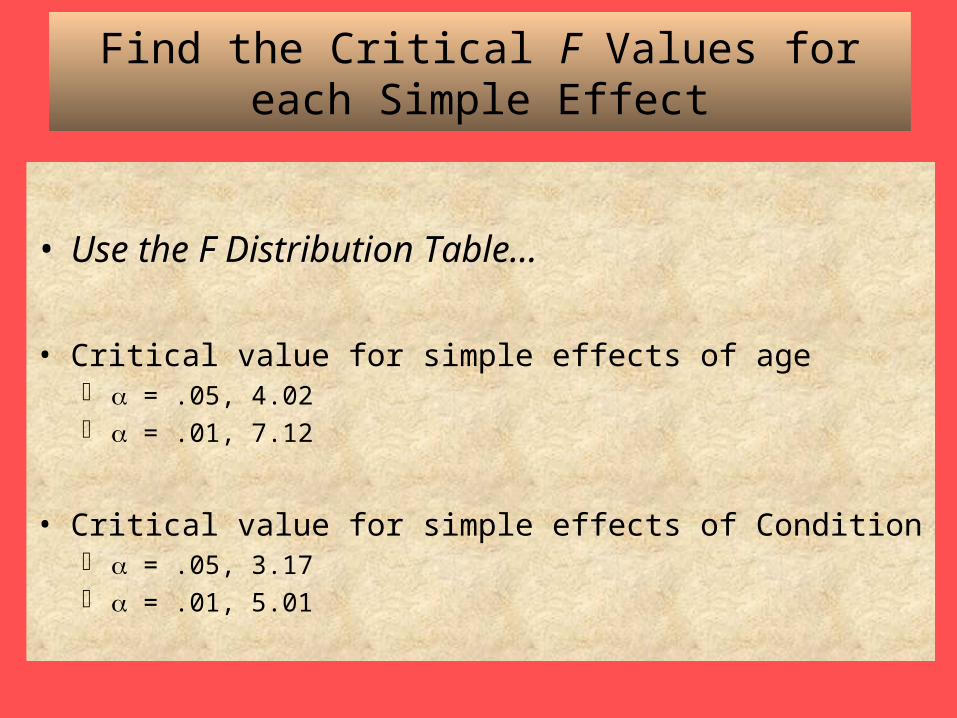
Find the Critical F Values for each Simple Effect
• Use the F Distribution Table…
• Critical value for simple effects of age = .05, 4.02 = .01, 7.12
• Critical value for simple effects of Condition = .05, 3.17 = .01, 5.01
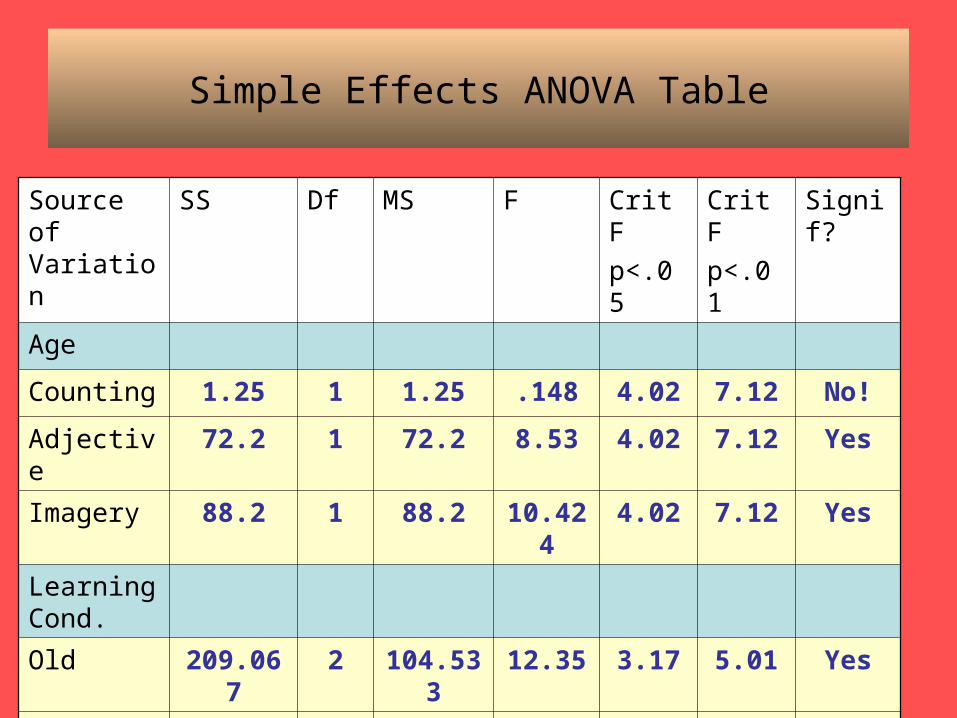
Simple Effects ANOVA Table
Source of Variation
SS Df MS F Crit F
p<.05
Crit F
p<.01
Signif?
Age
Counting 1.25 1 1.25 .148 4.02 7.12 No!
Adjective 72.2 1 72.2 8.53 4.02 7.12 Yes
Imagery 88.2 1 88.2 10.424 4.02 7.12 Yes
Learning Cond.
Old 209.067 2 104.533 12.35 3.17 5.01 Yes
Young 666.467 2 333.233 39.38 3.17 5.01 Yes
Error 456.9 54 8.461

Interpretation
• Explain the effects of Age & Learning Strategy on Recall, drawing on the results of the ANOVA to back up your explanation.
• Are there any further analyses that you think might be required?– posthoc
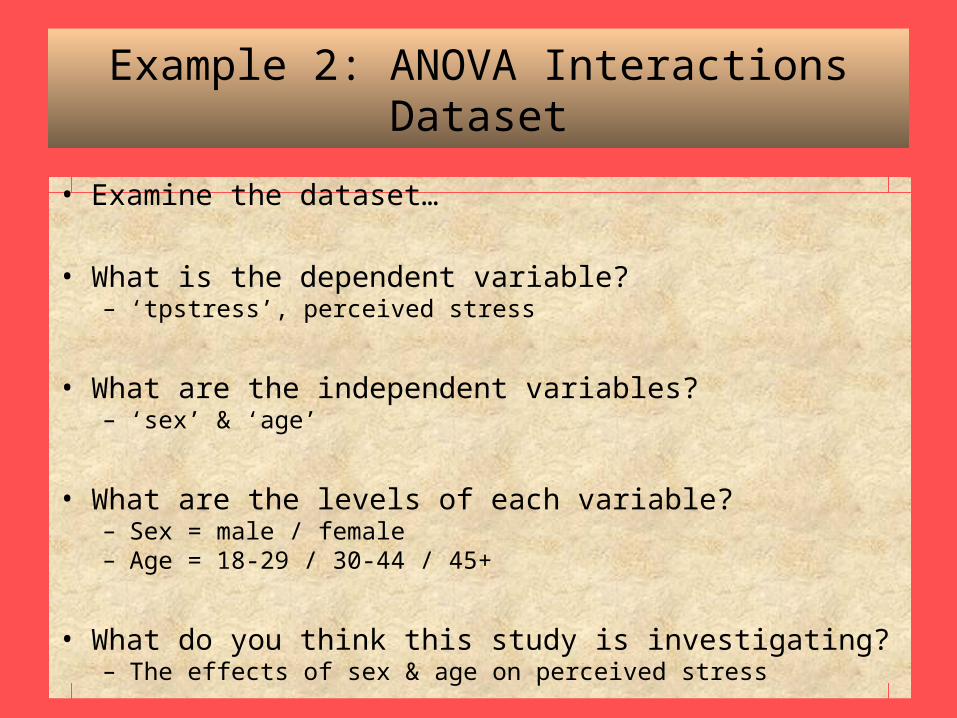
• Examine the dataset…
• What is the dependent variable?– ‘tpstress’, perceived stress
• What are the independent variables?– ‘sex’ & ‘age’
• What are the levels of each variable?– Sex = male / female– Age = 18-29 / 30-44 / 45+
• What do you think this study is investigating?– The effects of sex & age on perceived stress
Example 2: ANOVA Interactions Dataset

• Ask for descriptives, homogeneity test & a means plot
Run the Two Way Factorial ANOVA
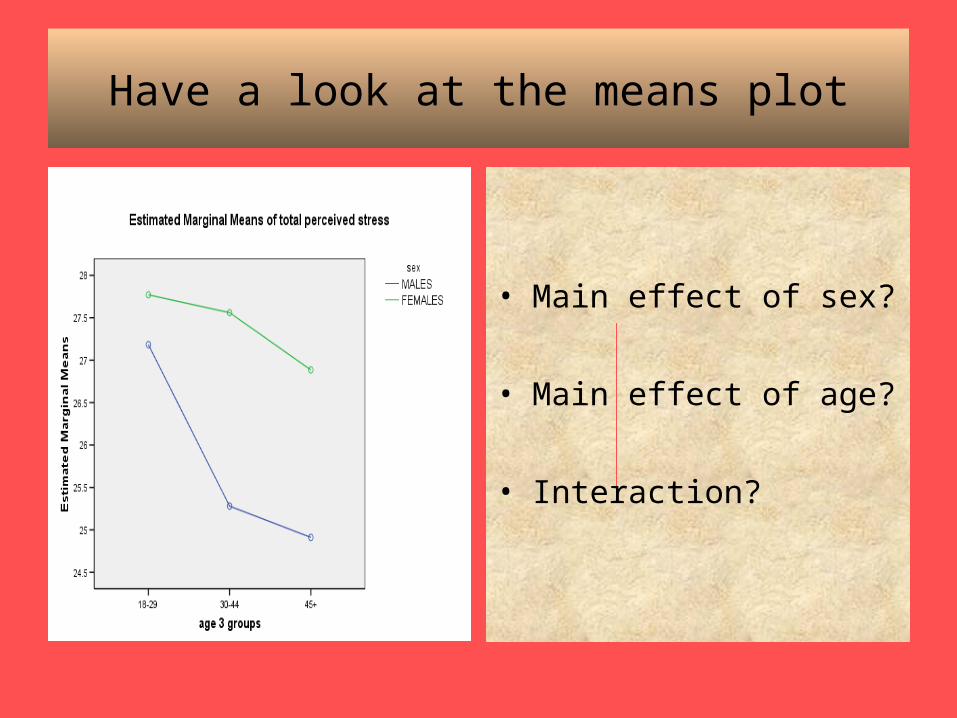
Have a look at the means plot
• Main effect of sex?
• Main effect of age?
• Interaction?
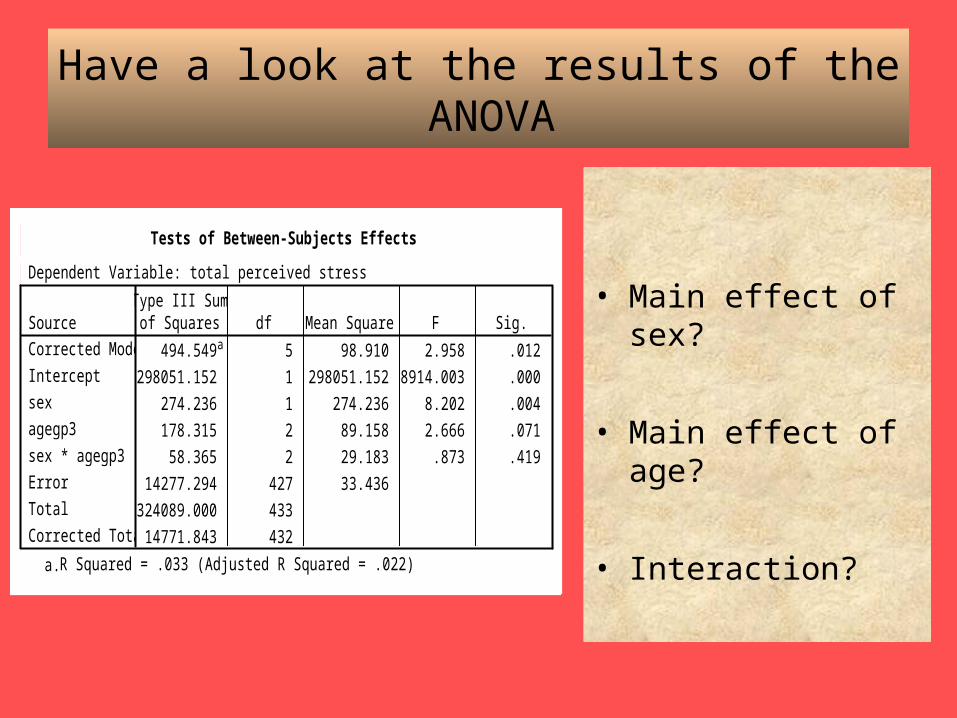
Have a look at the results of the ANOVA
• Main effect of sex?
• Main effect of age?
• Interaction?
Tests of Between-Subjects Effects
Dependent Variable: total perceived stress
494.549a 5 98.910 2.958 .012
298051.152 1 298051.152 8914.003 .000
274.236 1 274.236 8.202 .004
178.315 2 89.158 2.666 .071
58.365 2 29.183 .873 .419
14277.294 427 33.436
324089.000 433
14771.843 432
SourceCorrected Model
Intercept
sex
agegp3
sex * agegp3
Error
Total
Corrected Total
Type III Sumof Squares df Mean Square F Sig.
R Squared = .033 (Adjusted R Squared = .022)a.
• Are any other analyses required?
• Explain the results of the study in your own words.
Interpretation