lecture 2 : theguide method
TRANSCRIPT
U08038 The Human Computer Interface
Lecture 2 : The GUIDE Method

2
This WeekOverview of GUIDEInitial stages of the GUIDE method:
– User classes– User requirements
Data gathering and analysis
This week’s reading: Chapters 8 and 9.3
Coursework ExperienceThe purpose of the coursework is for you to experience the process of User-Centred Design
It involves• specification,• design,• build,• evaluation
3
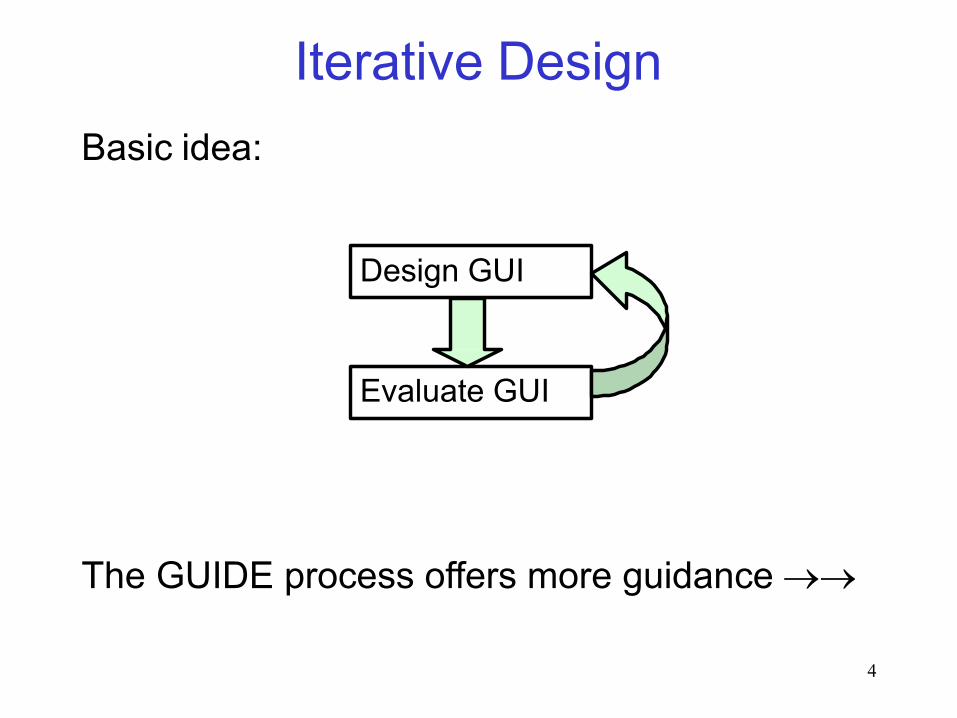
Iterative DesignBasic idea:
The GUIDE process offers more guidance ®®
Design GUI
Evaluate GUI
4

The GUIDE MethodDefine users and usability requirements
Model user objects
Definestyle guide
Designing GUI
Prototype GUI
Evaluate GUI
Model user
tasks
5
6
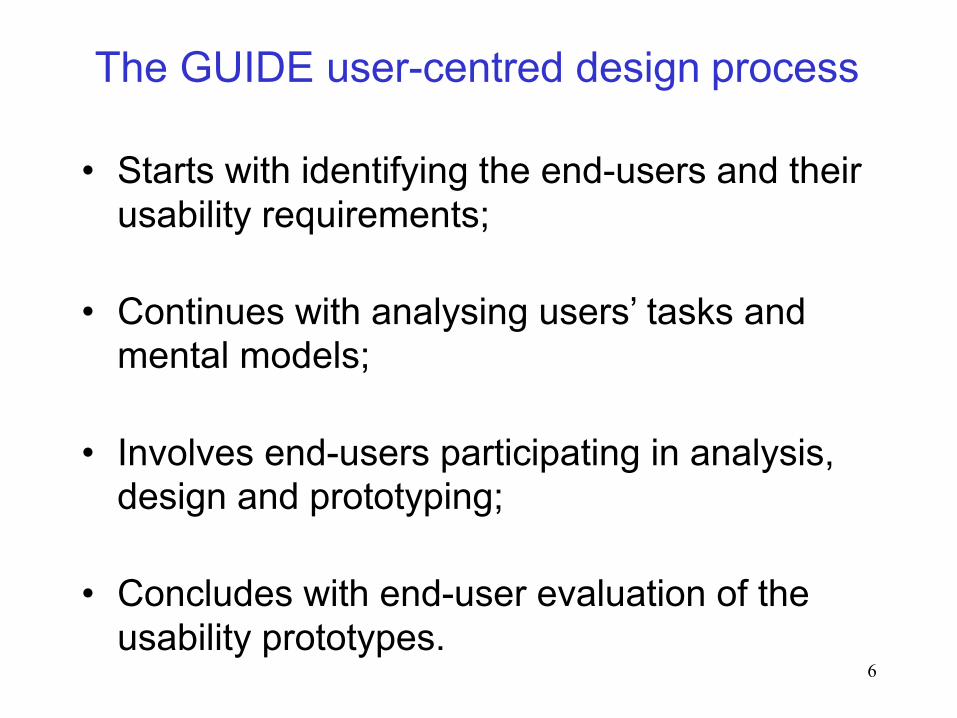
The GUIDE user-centred design process
• Starts with identifying the end-users and their usability requirements;
• Continues with analysing users’ tasks and mental models;
• Involves end-users participating in analysis, design and prototyping;
• Concludes with end-user evaluation of the usability prototypes.

7
User-Centred Design Theory1. Early and continual focus on users
• Define a major group of potential users (if you can)
• Talk to them about good and bad points of their present job and/or system.
• Watch them doing their present job.• Ask them to think aloud as they
work. Try their jobs (if possible)
• Do a formal task analysis
• Develop testable behavioural goals for proposedsystems.

8
Define Users and Usability Requirements
• Who are the users? Describe the users in each class– e.g. characteristics, skills, knowledge?
• Identify user classes• What usability requirements are critical?• How can the usability requirements be
measured?– e.g. performance levels, criteria

10
User Classes• A user class is a subset of the total population
of end-users who are similar in terms of their system usage and relevant personal characteristics.
• eg in a hotel room booking system an important user role might be to maintain room bookings. We might separate 3 user classes:– Reception desk staff– Management– Trainees

10
User Classes• Users can be:• Primary – those who interact directly with the
system• Secondary – those who will occasionally use
it or use it through an intermediary• Tertiary – those who will be affected by the
systems use or who make decisions about its purchase
(Eason, 1987)
11
Examples of User Class Characteristics• Type of user (direct/indirect/remote etc)• Experience level (novice, intermediate, expert etc)• Frequency of use• Mandatory/discretionary use• Educational ability• Tasks performed• General characteristics (eg age/sex if relevant)• Language issues• Learning style

12
Usability Requirements• Efficiency: speed of performance
• Simplicity: incidence of errors
• Satisfaction: eg ability to recover from errors
• Learnability: ease in learning the system
• Memorability: ease of retention of learned skills
• Personalisation: ability to customise
• Effectiveness: Ease with which users can achieve tasks
• Cognitive Load: Mental demand
13
Examples of Measurement
• Satisfaction:
SUS questionnaire
http://www.usability.gov/how-to-and-tools/methods/system-usability-scale.html
• Cognitive Load:
Nasa TLX questionnairehttp://pro.sagepub.com/content/55/1/1375.full.pdf+html(use Shibboleth institutional access and login at the prompt with your usual Brookes credentials)

14
A Quick Example to illustrate
– Calendar software
We will look at this to understand how GUIDE works.
However, note that systems are so complex that it would take longer than this lecture to document and design. We will look at just some aspects of the systems and design.

15
CalendarWho are the users?
User classes?
Usability requirements?
Measuring usability requirements?
16
Data Gathering• Different kinds of requirements, eg.
– usabililty– functional– non-functional
• Data gathering methods, eg– Interviews– Questionnaires– Observation
• Data recording methods
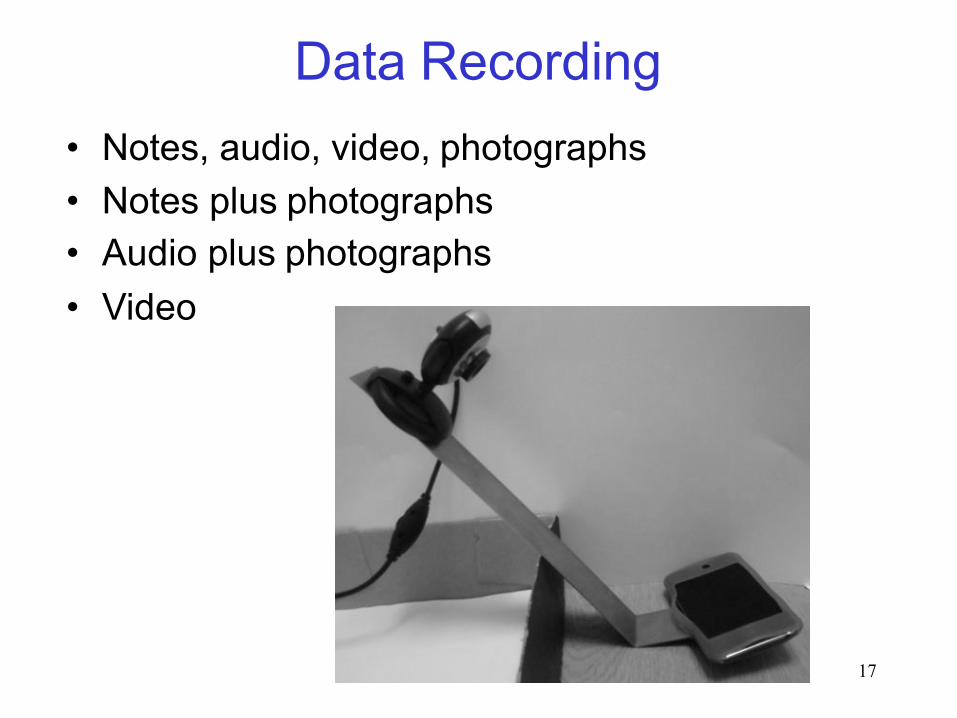
Data Recording• Notes, audio, video, photographs• Notes plus photographs• Audio plus photographs• Video
17
27
Interviews
• Unstructured - are not directed by a script. Rich but not replicable.
• Structured - are tightly scripted, often like a questionnaire. Replicable but may lack richness.
• Semi-structured - guided by a script but interesting issues can be explored in more depth. Can provide a good balance between richness and replicability.
It can sometimes be useful to use props to enrich the interview process, eg prototypes

28
Interview questions• Two types:
– ‘closed questions’ have a predetermined answer format, e.g., ‘yes’ or ‘no’
– ‘open questions’ do not have a predetermined format• Closed questions are easier to analyze• Avoid:
– Long questions– Compound sentences - split them into two– Jargon and language that the interviewee may not
understand– Leading questions that make assumptions e.g., why do
you like …?– Unconscious biases e.g., gender stereotypes

20
Questionnaires
• Questions can be closed or open• Closed questions are easier to analyze, and
may be done by computer• Can be administered to large populations• Paper, email and the web used for
dissemination• Sampling can be a problem when the size of a
population is unknown as is common online
21
Questionnaire Design
• The impact of a question can be influenced by question order.
• Do you need different versions of the questionnaire for different user classes?
• Provide clear instructions on how to complete the questionnaire.
• Strike a balance between using white space and keeping the questionnaire compact.
• Decide on whether phrases will all be positive, all negative or mixed.
22
Response Format
• Question Type eg– Multiple Choice– Scale– Grid
23
Questionnaires
• Advantages– Responses are usually received quickly– No copying and postage costs– Data can be collected in database for analysis– Time required for data analysis is reduced– Errors can be corrected easily
• Disadvantages– Sampling is problematic if population size is
unknown– Preventing individuals from responding more than
once
24
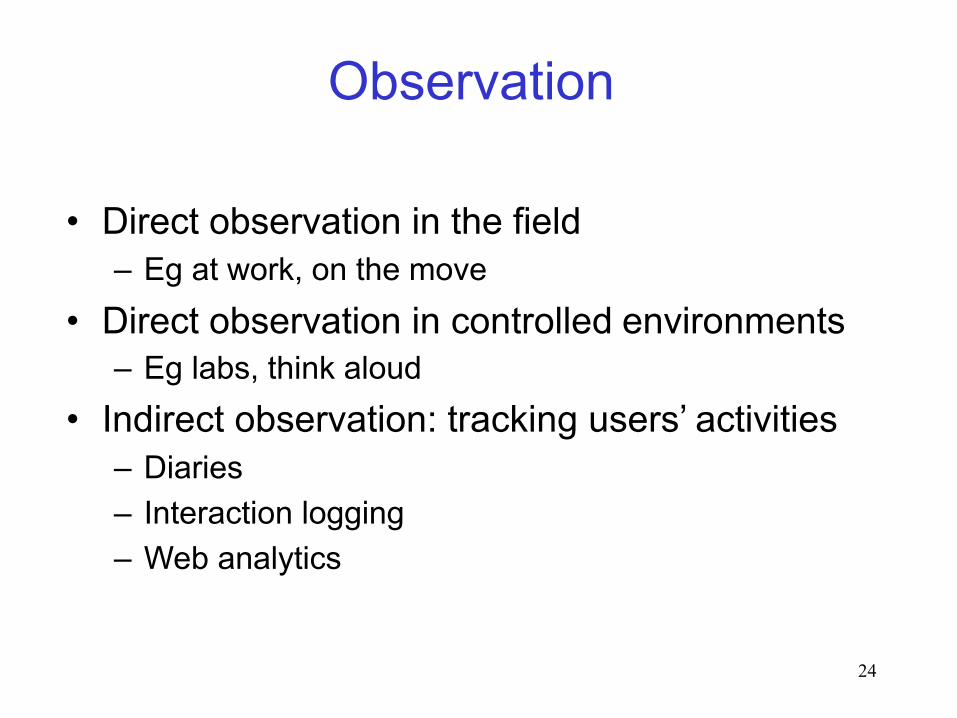
Observation
• Direct observation in the field– Eg at work, on the move
• Direct observation in controlled environments– Eg labs, think aloud
• Indirect observation: tracking users’ activities– Diaries– Interaction logging– Web analytics
35
Data gathering: Summary
• Three main data gathering methods: interviews, questionnaires, observation
• Interviews may be structured, semi-structured or unstructured
• Questionnaires may be on paper, online or telephone
• Observation may be direct or indirect, in the field or in controlled setting
• Techniques can be combined depending on study focus, participants, nature of technique and available resources
26
Data Analysis
• Quantitative data – expressed as numbers• Qualitative data – difficult to measure sensibly
as numbers, e.g. count number of words to measure dissatisfaction
• Quantitative analysis – numerical methods to ascertain size, magnitude, amount
• Qualitative analysis – expresses the nature of elements and is represented as themes, patterns, stories
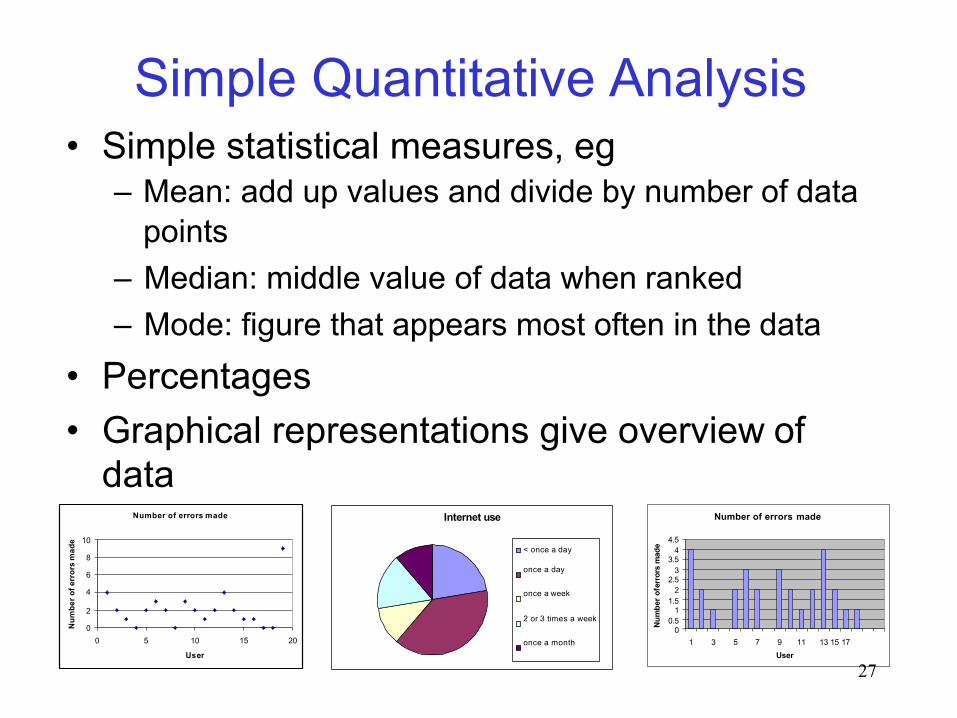
Simple Quantitative Analysis• Simple statistical measures, eg
– Mean: add up values and divide by number of data points
– Median: middle value of data when ranked– Mode: figure that appears most often in the data
• Percentages• Graphical representations give overview of
dataNumber of errors made
10
8
6
4
2
00 5 15 2010
User
Num
ber o
f err
ors
mad
e
Internet use
< once a day
once a day
once a week
2 or 3 times a week
once a month
Number of errors made
4.54
3.53
2.52
1.51
0.50
1 3 5 7 9 11 13 15 17User
27Nu
mbe
r ofe
rror
s m
ade
38
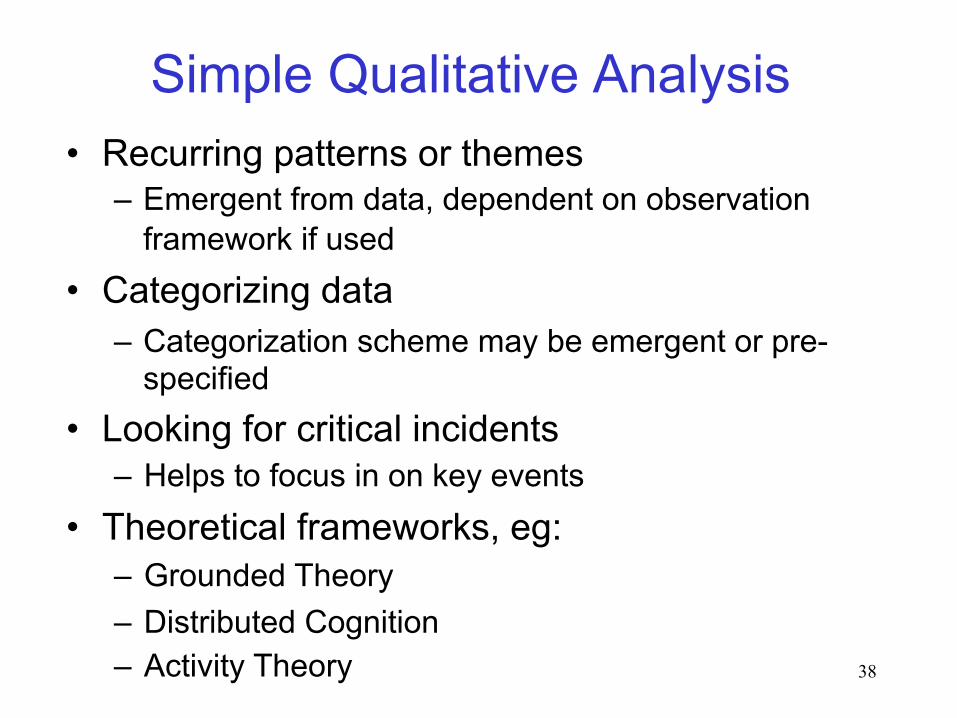
Simple Qualitative Analysis• Recurring patterns or themes
– Emergent from data, dependent on observation framework if used
• Categorizing data– Categorization scheme may be emergent or pre-
specified• Looking for critical incidents
– Helps to focus in on key events• Theoretical frameworks, eg:
– Grounded Theory– Distributed Cognition– Activity Theory
40
Data analysis: Summary• The data analysis that can be done depends
on the data gathering that was done• Qualitative and quantitative data may be
gathered from any of the three main datagathering approaches
• Percentages and averages are commonlyused in Interaction Design
• Mean, median and mode are different kinds of‘average’ and can have very different answersfor the same set of data
• Presentation of the findings should notoverstate the evidence
30
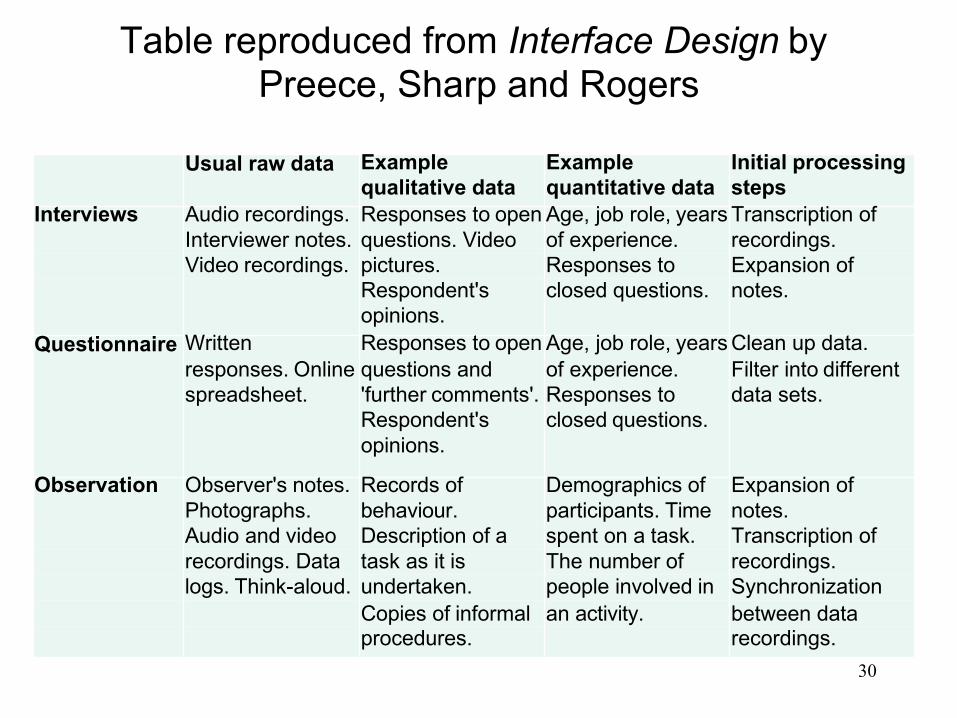
Table reproduced from Interface Design by Preece, Sharp and Rogers
Usual raw data Examplequalitative data
Examplequantitative data
Initial processingsteps
Interviews Audio recordings. Responses to open Age, job role, years Transcription ofInterviewer notes. questions. Video of experience. recordings.Video recordings. pictures. Responses to Expansion of
Respondent's closed questions. notes.opinions.
Questionnaire Writtenresponses. Online spreadsheet.
Responses to openquestions and 'further comments'. Respondent's opinions.
Age, job role, yearsof experience. Responses to closed questions.
Clean up data.Filter into different data sets.
Observation Observer's notes. Records of Demographics of Expansion ofPhotographs. behaviour. participants. Time notes.Audio and video Description of a spent on a task. Transcription ofrecordings. Data task as it is The number of recordings.logs. Think-aloud. undertaken. people involved in Synchronization
Copies of informal an activity. between dataprocedures. recordings.
31
Next Week
Task Analysis Mental Models