lecture 213/15/06 environmental club meeting today at 5:30 laska classroom 317
Post on 22-Dec-2015
213 views
TRANSCRIPT

Lecture 21 3/15/06
Environmental Club MeetingToday at 5:30Laska classroom 317

Building a titration curve via calculationsComparison of a titration of a strong acid vs. a weak acid
Region x-axis (mL of acid/base)
0.1 M NaOH
y-axis (pH)
100 mL of 0.1 M HCl
y-axis (pH)
100 mL of 0.1 M HF
Initial pH 0 1Before the equivalence point(1/2 equiv. point)
50 1.47
equivalence point 100 7
After the equivalence point
150 12.3

0
1
2
3
4
5
6
7
8
9
10
11
12
13
14
0 10 20 30 40 50 60 70 80 90 100 110 120 130 140 150 160 170 180 190 200
mL 0.1 M NaOH
pH

0
1
2
3
4
5
6
7
8
9
10
11
12
13
14
0 10 20 30 40 50 60 70 80 90 100 110 120 130 140 150 160 170 180 190 200
mL 0.1 M NaOH
pH

Initial pH (0.1 M NaOH titrating 0.1 M HF)
Ka = 6.8 x 10⁻⁴
X-axis:
Y-axis:

Building a titration curve via calculationsComparison of a titration of a strong acid vs. a weak acid
Region
x-axis (mL of acid/base)
0.1 M NaOH
y-axis (pH)
100 mL of 0.1 M HCl
y-axis (pH)
100 mL of 0.1 M HF
Initial pH 0 1 2.10Before the equivalence point(1/2 equiv. point)
50 1.47
equivalence point 100 7
After the equivalence point
150 12.3

0
1
2
3
4
5
6
7
8
9
10
11
12
13
14
0 10 20 30 40 50 60 70 80 90 100 110 120 130 140 150 160 170 180 190 200
mL 0.1 M NaOH
pH

Equivalence point (NaOH titrating HF)
X-axis
Y-axis

Building a titration curve via calculationsComparison of a titration of a strong acid vs. a weak acid
Region
x-axis (mL of acid/base)
0.1 M NaOH
y-axis (pH)
100 mL of 0.1 M HCl
y-axis (pH)
100 mL of 0.1 M HF
Initial pH 0 1 2.10Before the equivalence point(1/2 equiv. point)
50 1.47
equivalence point 100 7 7.93
After the equivalence point
150 12.3

0
1
2
3
4
5
6
7
8
9
10
11
12
13
14
0 10 20 30 40 50 60 70 80 90 100 110 120 130 140 150 160 170 180 190 200
mL 0.1 M NaOH
pH

½ Equivalence point (NaOH titrating HF)
X-axis
Y-axis

Building a titration curve via calculationsComparison of a titration of a strong acid vs. a weak acid
Region
x-axis (mL of acid/base)
0.1 M NaOH
y-axis (pH)
100 mL of 0.1 M HCl
y-axis (pH)
100 mL of 0.1 M HF
Initial pH 0 1 2.10Before the equivalence point(1/2 equiv. point)
50 1.47 3.16
equivalence point 100 7 7.93
After the equivalence point
150 12.3

0
1
2
3
4
5
6
7
8
9
10
11
12
13
14
0 10 20 30 40 50 60 70 80 90 100 110 120 130 140 150 160 170 180 190 200
mL 0.1 M NaOH
pH

After Equivalence point (NaOH titrating HF)
X-axis
Y-axis

Building a titration curve via calculationsComparison of a titration of a strong acid vs. a weak acid
Region
x-axis (mL of acid/base)
0.1 M NaOH
y-axis (pH)
100 mL of 0.1 M HCl
y-axis (pH)
100 mL of 0.1 M HF
Initial pH 0 1 2.10Before the equivalence point(1/2 equiv. point)
50 1.47 3.16
equivalence point 100 7 7.93
After the equivalence point
150 12.3 12.3

0
1
2
3
4
5
6
7
8
9
10
11
12
13
14
0 10 20 30 40 50 60 70 80 90 100 110 120 130 140 150 160 170 180 190 200
mL 0.1 M NaOH
pH

0
1
2
3
4
5
6
7
8
9
10
11
12
13
14
0 10 20 30 40 50 60 70 80 90 100 110 120 130 140 150 160 170 180 190 200
mL 0.1 M NaOH
pH

Titration of a polyprotic acid
http://www.creative-chemistry.org.uk/alevel/module4/documents/N-ch4-05.pdf
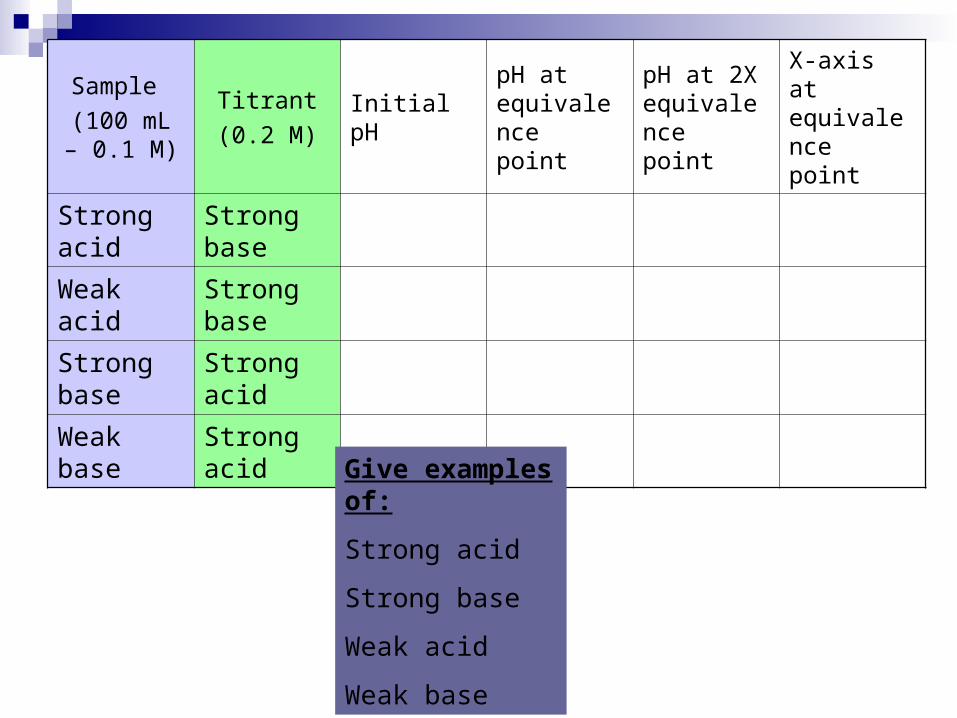
Sample (100 mL –
0.1 M)
Titrant(0.2 M)
Initial pHpH at equivalence point
pH at 2X equivalence point
X-axis at equivalence point
Strong acid
Strong base
Weak acid
Strong base
Strong base
Strong acid
Weak base
Strong acid
Give examples of:
Strong acid
Strong base
Weak acid
Weak base
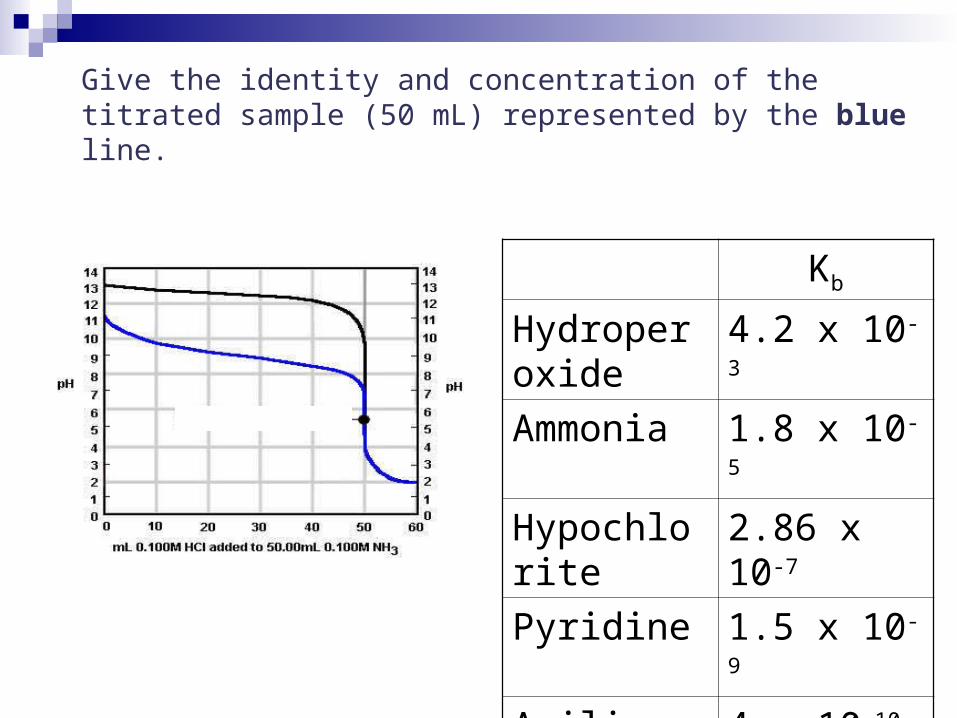
Give the identity and concentration of the titrated sample (50 mL) represented by the blue line.
Kb
Hydroperoxide
4.2 x 10⁻³
Ammonia 1.8 x 10⁻⁵
Hypochlorite 2.86 x 10⁻⁷
Pyridine 1.5 x 10⁻⁹
Aniline 4 x 10⁻¹⁰