lecture # 22 wind energy
TRANSCRIPT
Lecture # 22 Wind Energy
Ahmed Ghoniem April 27, 2020
• A quick recap, what we covered and what is yet to come • Wind energy resources and potential • Wind machines and wind turbine physics
The lecture today is ~ 90 min

Hoffert et al., Science, 298 (2002)
© AAAS. All rights reserved. This content is excluded from our Creative Commons license. For more information, see https://ocw.mit.edu/fairuse.
Fuel cell handbook. Office of fossil energy.
Image courtesy of DOE.
Mancini TR. An overview of concentrating solar power.
Image courtesy of DOE.
2© by Ahmed F. Ghoniem
© Informa UK Limited. All rights reserved. This content is excluded from our Creative Commons license. For more information, see https://ocw.mit.edu/fairuse.
Tad W. Patzek (2004) "Thermodynamics of the Corn-Ethanol Biofuel Cycle", Critical Reviews in Plant Sciences, 23:6, 519-567, DOI: 10.1080/07352680490886905.

Electrification Worldwide • Less developed countries have 80% of world�s population, consume ~ 30% of total energy • ~2B people without consistent access to electricity • The system is moving away from fuels and towards electricity, for many reasons • Opportunities and challenges
Middle East – 78.1%
Transition Economies – 99.5%
Latin America – 90.0%
Developing Asia – 72.0%
Africa – 37.1% Image courtesy of NASA.
3

Needs: Energy Consumption ~ 600 EJ (~ 440 EJ in early 2000’s) produced by close to 18 Sankey diagram TW Power (6.1 TW for electricity generation) US resources, consumption and patterns
~100 EJ/y 2018, <17% of the world total (25% in 2004) Biomass & waste, 10% Other renewables, 2%
Coal, 26%
Oil, 31%
Gas, 23%
Nuclear, 5%
Hydro, 3%
© IEA. All rights reserved. This content is excluded from our Creative Commons license. For more information, see https://ocw.mit.edu/fairuse. Image courtesy of U.S. Energy Information Administration.
World primary energy consumption in 2014, 13,558 Mtoe (was 11,059 Mtoe in 2006). http://www.eia.gov/totalenergy/data/monthly/pdf/flow/total_energy.pdf Except for hydropower, primary energy measures the thermal energy equivalent in the fuel
that was used to produce a useful form of energy, e.g., thermal energy (heat), mechanical energy, electrical energy, etc. When energy is obtained directly in the form of electricity,efficiency is used to convert it to equivalent thermal energy. 41 toe ~ 42 GJ. IEA World Energy Outlook 2015, p57.

World primary energy supply by fuel/source*
Installed power (electricity) generation The dotted line is the prediction based on new policies to be implemented. capacity worldwide by source and prediction The shaded areas show the possible scenarios between current policies and sustainable development. Source: IEA world energy outlook 2018, P38 in the new policies scenario
© IEA. All rights reserved. This content is excluded from our Creative Commons license. For more information, see https://ocw.mit.edu/fairuse.
Source: IEA world energy outlook 2018, P344
5

Shares of global primary energy, 2017 and 2040
Source: https://www.iea.org/weo2018/fuels/
© IEA. All rights reserved. This content is excluded from our Creative Commons license. For more information, see https://ocw.mit.edu/fairuse.
New Policies Scenario (NPS): Global oil demand growth slows but does not peak before 2040. Sustainable Development Scenario (SDS): Determined policy interventions to address climate change lead to a peak in global oil demand around 2020 at 97 mb/d.
Global Greenhouse Gas Emissions by Economic Sector (2015)
https://www.epa.gov/sites/production/ files/2016-05/global_emissions_sector_2015.png
Image courtesy of EPA.
6

Meeting CO2 targets using a portfolio of technologies • New policies scenario: implementing measures affecting energy markets that had been adopted as of mid-2015 (as
well as the energy-related components of climate pledges in the run-up to COP21) • 450 scenario: depicts a pathway to the 2�C climate goal that can be achieved by fostering technologies that are close
to becoming available at commercial scale.
1. Efficiency improvement
2. New and clean energy
3. CCS
IEA world energy outlook 2015, P55
© IEA. All rights reserved. This content is excluded from our Creative Commons license. For more information, see https://ocw.mit.edu/fairuse. 7
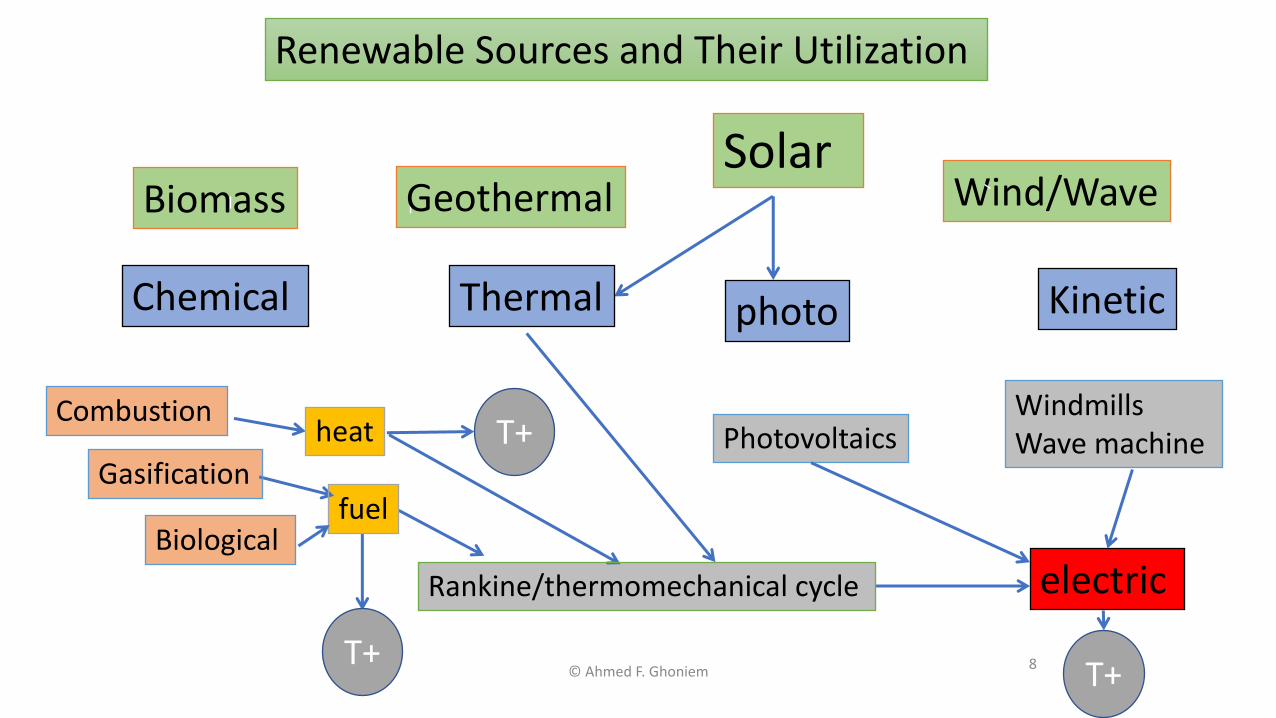
Renewable Sources and Their Utilization
Solar Wind/Wave Biomass Geothermal
Chemical Thermal Kinetic photo
Windmills Combustion
T+
T+heat Photovoltaics Wave machine Gasification
fuel Biological
Rankine/thermomechanical cycle electric
8© Ahmed F. Ghoniem T+

Significant Potential for Wind
© The Associated Press. All rights reserved. This content is excluded from our Creative Commons license. For more information, see https://ocw.mit.edu/fairuse.
Wind Energy Engineering handbook, T.M. Lectcher, ed., AP Press, 2017 9

Wind power class and potential
Power density at 50 m, W/m2
Wind speed at 50 m, m/s
3 Fair 300-400 6.4-7.0 4 Good 400-500 7.0-7.5 5 Excellent 500-600 7.5-8.0 6 Outstanding 600-800 8.0-8.8 7 Superb 800-1600 8.8-11.1
Image courtesy of NREL, DOE.
10
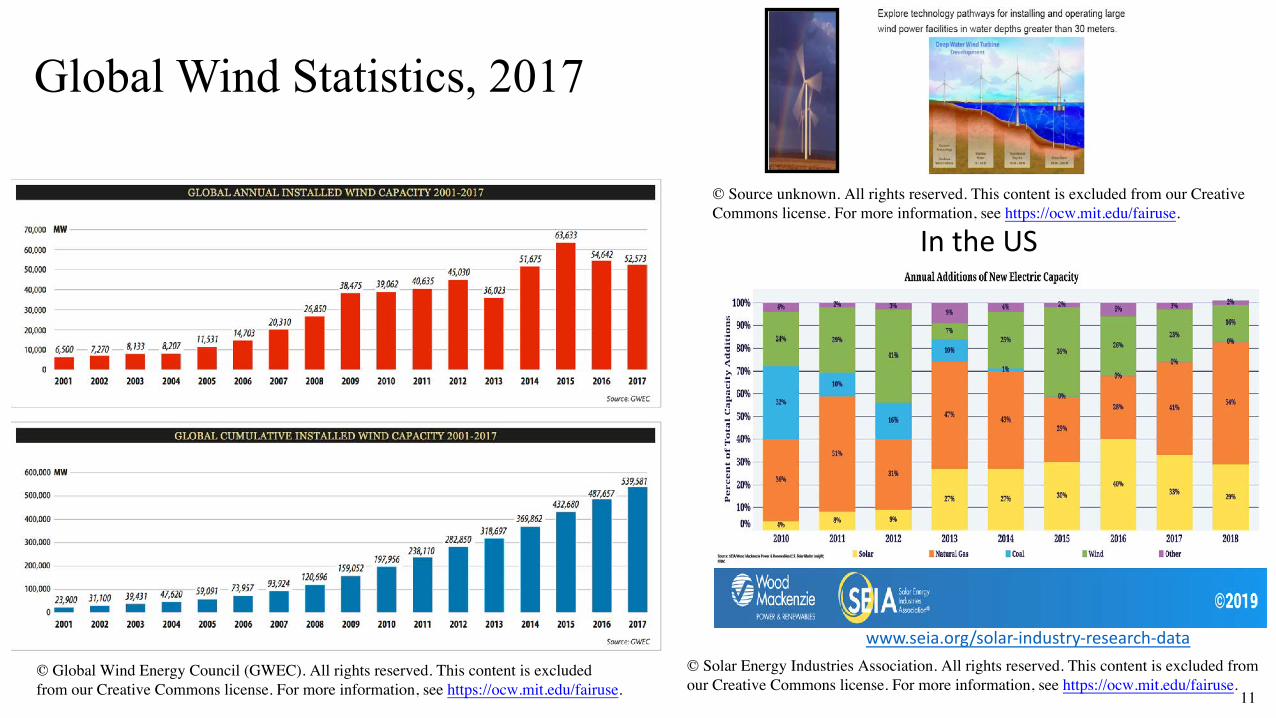
Global Wind Statistics, 2017
© Source unknown. All rights reserved. This content is excluded from our Creative Commons license. For more information, see https://ocw.mit.edu/fairuse.
In the US
www.seia.org/solar-industry-research-data © Solar Energy Industries Association. All rights reserved. This content is excluded from © Global Wind Energy Council (GWEC). All rights reserved. This content is excluded our Creative Commons license. For more information, see https://ocw.mit.edu/fairuse.from our Creative Commons license. For more information, see https://ocw.mit.edu/fairuse. 11

Extracting Wind Energy 1 1 Modern horizontal axis 2 ! 2 3P = mVwind =
2 ρairVwind A wind turbine (3 blades)
Take: ρair ~ 1.3kg/m3, V ~ 10m/s, Rturbine ~ 10 m P ~ 180kW (assuming 100% conversion efficiency)
Unusual vertical axis wind machine
Old fashion wind mill MacKay, Sustainable Energy-without the hot air, Cambridge, 2009.
12© UIT Cambridge Ltd. All rights reserved. This content is excluded from our Creative Commons license. For more information, see https://ocw.mit.edu/fairuse.

1/18/2019. Rotterdam. GE announced plans this week to erect a prototype of the world’s largest wind turbine, the Haliade-X, on the city’s outskirts.
© GE. All rights reserved. This content is excluded from our Creative Commons license. For more information, see https://ocw.mit.edu/fairuse. 13
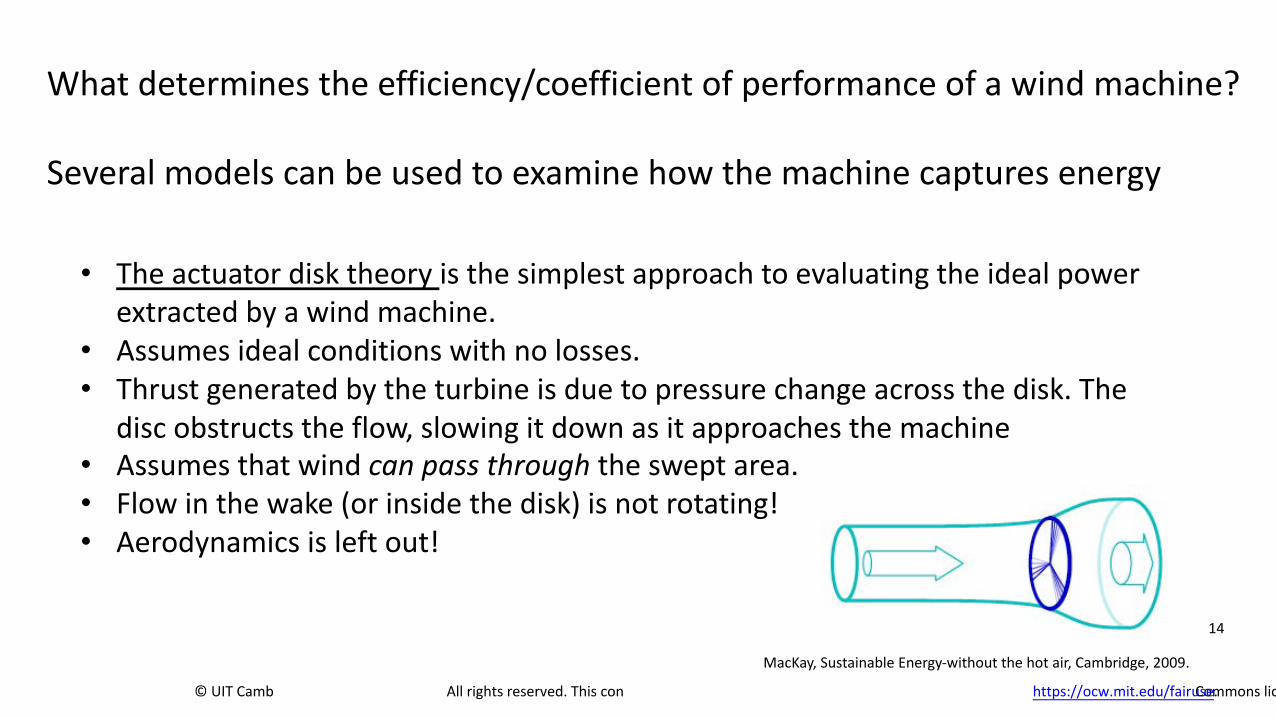
What determines the efficiency/coefficient of performance of a wind machine?
Several models can be used to examine how the machine captures energy
• The actuator disk theory is the simplest approach to evaluating the ideal power
extracted by a wind machine.
• Assumes ideal conditions with no losses.
• Thrust generated by the turbine is due to pressure change across the disk. The
disc obstructs the flow, slowing it down as it approaches the machine
• Assumes that wind can pass through the swept area.
• Flow in the wake (or inside the disk) is not rotating!
• Aerodynamics is left out!
MacKay, Sustainable Energy-without the hot air, Cambridge, 2009.
© UIT Cambridge Ltd. All rights reserved. This content is excluded from our Creative Commons license. For more information, see https://ocw.mit.edu/fairuse.
14

mass conservation: A∞U∞ = AdUd = AwUw = m! ρ
Bernoulli: p∞ + 21 ρU∞
2 = p+ + 21 ρUd
2
1 2 1 2p− + 2 ρUd = p∞ +
2 ρUw
Momentum (across disk): T = ( p+ − p− ) Ad
Momentum (entire CV): T = m! (U∞ −Uw ) Solve: Ud = 1 (U∞ +Uw ),2
T = 2ρA U∞ −Ud )Ud and ℘ = T Ud ( 2( = 2ρA U∞ −Ud )Ud
℘ U∞ −Udthe power coefficient is C p = = 4α (1−α )2 , α =1 2 ρU∞
3 Ad U∞
2for maximum power: α =1/3, and Ud = U∞ .3 Maximum Power Coefficient, Betz limit (efficiency): Cp = 0.593
15
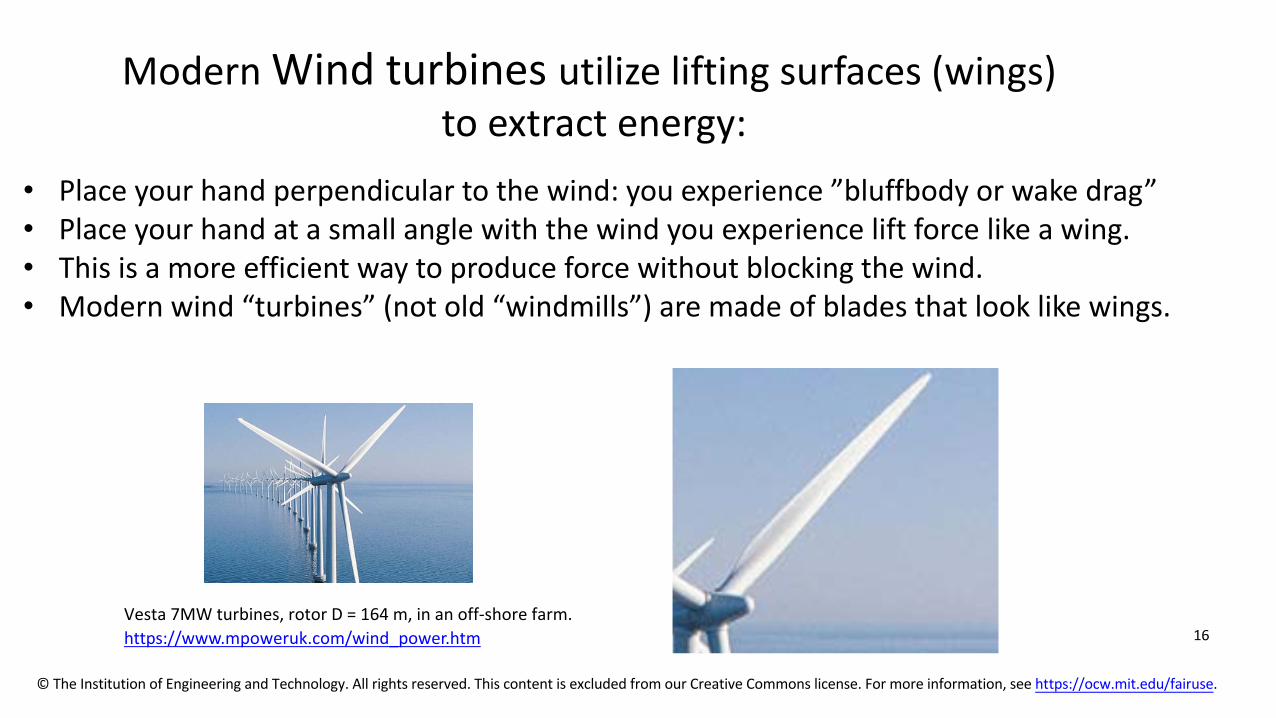
Modern Wind turbines utilize lifting surfaces (wings) to extract energy:
• Place your hand perpendicular to the wind: you experience ”bluffbody or wake drag” • Place your hand at a small angle with the wind you experience lift force like a wing. • This is a more efficient way to produce force without blocking the wind. • Modern wind “turbines” (not old “windmills”) are made of blades that look like wings.
Vesta 7MW turbines, rotor D = 164 m, in an off-shore farm. https://www.mpoweruk.com/wind_power.htm
© The Institution of Engineering and Technology. All rights reserved. This content is excluded from our Creative Commons license. For more information, see https://ocw.mit.edu/fairuse.
16
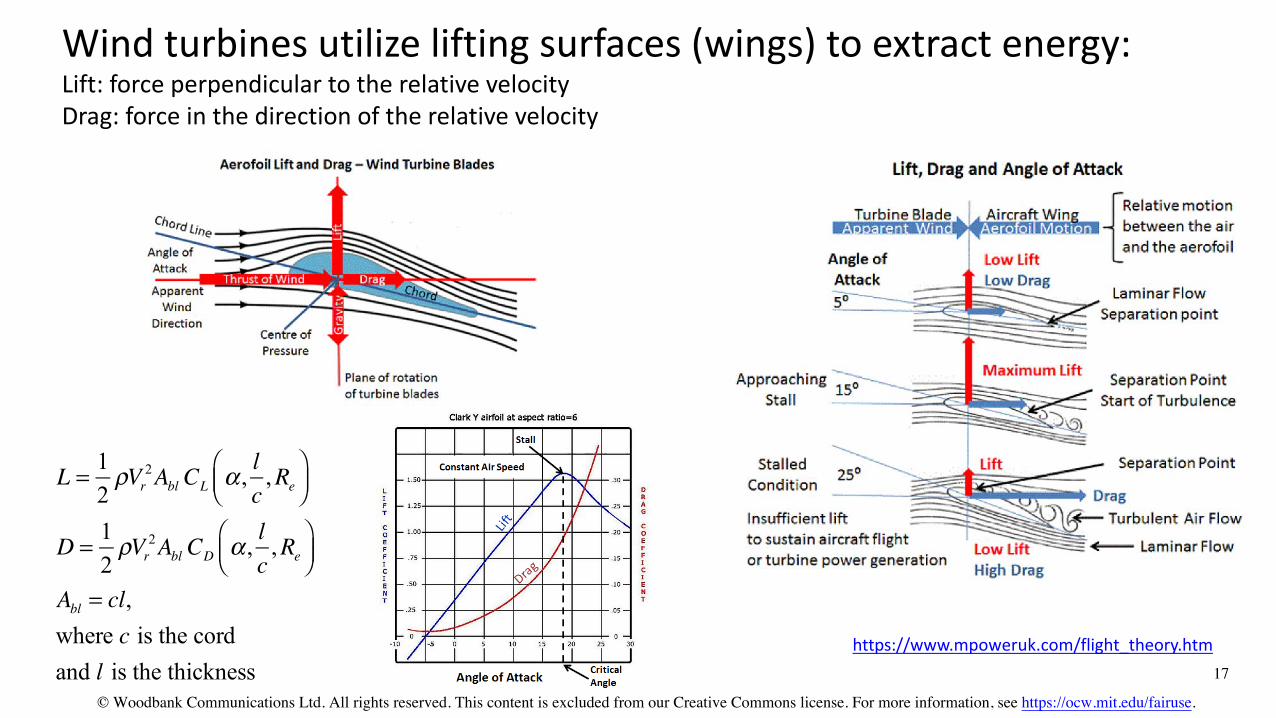
Wind turbines utilize lifting surfaces (wings) to extract energy: Lift: force perpendicular to the relative velocity Drag: force in the direction of the relative velocity
1 2 ρVr
lα , , ReL = 2 Abl CL c
2 ρVr
⎜ ⎟
⎜ ⎟
Abl = cl, where c is the cord https://www.mpoweruk.com/flight_theory.htm and l is the thickness
© Woodbank Communications Ltd. All rights reserved. This content is excluded from our Creative Commons license. For more information, see https://ocw.mit.edu/fairuse.
⎞⎠
⎞⎠
⎛⎝
⎛⎝
lα , , ReD = 2 Abl CD c 1
17
DL
b
b
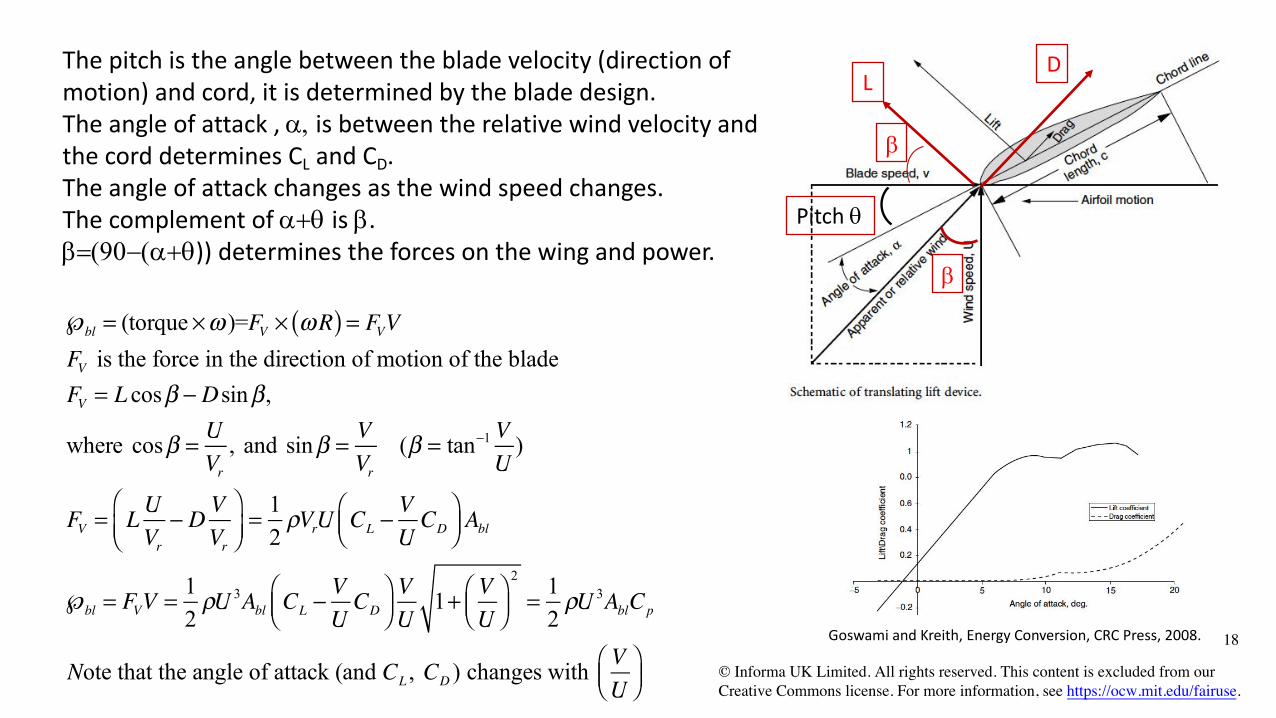
Pitch q
The pitch is the angle between the blade velocity (direction of motion) and cord, it is determined by the blade design. The angle of attack , a, is between the relative wind velocity and the cord determines CL and CD. The angle of attack changes as the wind speed changes. The complement of a+q is b. b=(90-(a+q)) determines the forces on the wing and power.
℘bl = (torque ×ω )=FV × (ω R) = FVV FV is the force in the direction of motion of the blade FV = L cosβ − Dsin β,
U Vwhere cosβ = , and sin β = (β = tan−1 V )Vr Vr U
⎛ L U ⎞ 1 ⎛ V ⎞FV =
⎝⎜ − D V
⎠⎟ =
2 ρVrU ⎝⎜ CL − CD ⎠⎟ AblVr Vr U
℘bl = FVV = 2 ρU 3Abl ⎝⎜ CL − CD ⎠⎟ 1+ ⎝⎜ ⎠⎟ =
2 ρU 3AblCp
1 ⎛ V ⎞ V ⎛ V ⎞ 2 1
U U U Goswami and Kreith, Energy Conversion, CRC Press, 2008.
⎛ V ⎞Note that the angle of attack (and CL , CD ) changes with © Informa UK Limited. All rights reserved. This content is excluded from our ⎝⎜ U ⎠⎟ Creative Commons license. For more information, see https://ocw.mit.edu/fairuse.
18
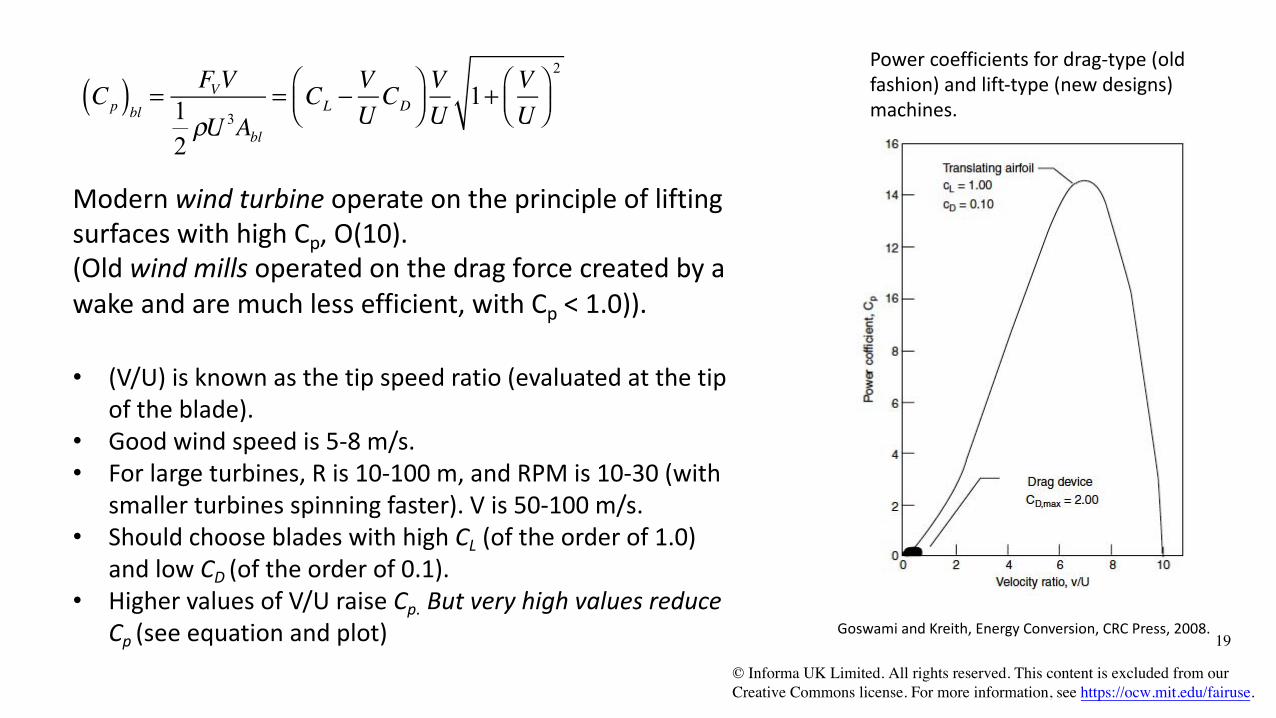
(Cp )bl = 1 = ⎝⎜ CL − U CD ⎠⎟ U
1+ ⎝⎜ U ⎠⎟ machines.
Power coefficients for drag-type (old FVV ⎛ V ⎞ V ⎛ V ⎞
2 fashion) and lift-type (new designs)
2 ρU 3Abl
Modern wind turbine operate on the principle of lifting surfaces with high Cp, O(10). (Old wind mills operated on the drag force created by a wake and are much less efficient, with Cp < 1.0)).
• (V/U) is known as the tip speed ratio (evaluated at the tip of the blade).
• Good wind speed is 5-8 m/s. • For large turbines, R is 10-100 m, and RPM is 10-30 (with
smaller turbines spinning faster). V is 50-100 m/s. • Should choose blades with high CL (of the order of 1.0)
and low CD (of the order of 0.1). • Higher values of V/U raise Cp. But very high values reduce
Goswami and Kreith, Energy Conversion, CRC Press, 2008. Cp (see equation and plot) 19
© Informa UK Limited. All rights reserved. This content is excluded from our Creative Commons license. For more information, see https://ocw.mit.edu/fairuse.

change with radius to maintain optimal (a+q) or b almost constant, i.e., must use twisted blades between the root and tip.
• For optimal performance, it is also necessary to vary the overall blade angle as the wind speed changes to maximize Cp, this is Pitch Control.
• Speed sensors are mounted on the nacelle to measure the wind speed and adjust the blade pitch.
• It is important that the horizontal turbine axis
• Previous analysis is applicable at some radius along the blade.
• But blade speed increases along r (V=wr) while U remains constant, causing V/U or a, q and b to change.
• For a good design, the blade pitch q must © The Institution of Engineering and Technology. All rights reserved. This content is excluded from our Creative Commons license. For more information, see https://ocw.mit.edu/fairuse.
is always aligned in the wind direction; this is
�
Fixed pitch angle © Woodbank Communications Ltd. All rights reserved. This content is excluded from our Creative Commons license. For more information, see https://ocw.mit.edu/fairuse.
increasing pitch Yaw Control. towards root 20

Almost all modern wind turbine have 3 blades, optimized to operate at highest efficiency at nominal wind speeds
• It is important to keep (V/U)max power low to minimize stresses on blades, etc. (at U ~ 10 m/s, V ~ 100 m/s!)
• “Old fashion” wind mills operate more on the principle of wake drag in which the blades are almost perpendicular to the wind.
• This is less efficient and requires wider blades, and more of them.
• They also spin slower and generate higher torques; more suitable for mechanical applications.
From Wind Turbines by Eric Hau
© Springer Nature Switzerland AG. All rights reserved. This content is excluded from our Creative Commons license. For more information, see https://ocw.mit.edu/fairuse. 21
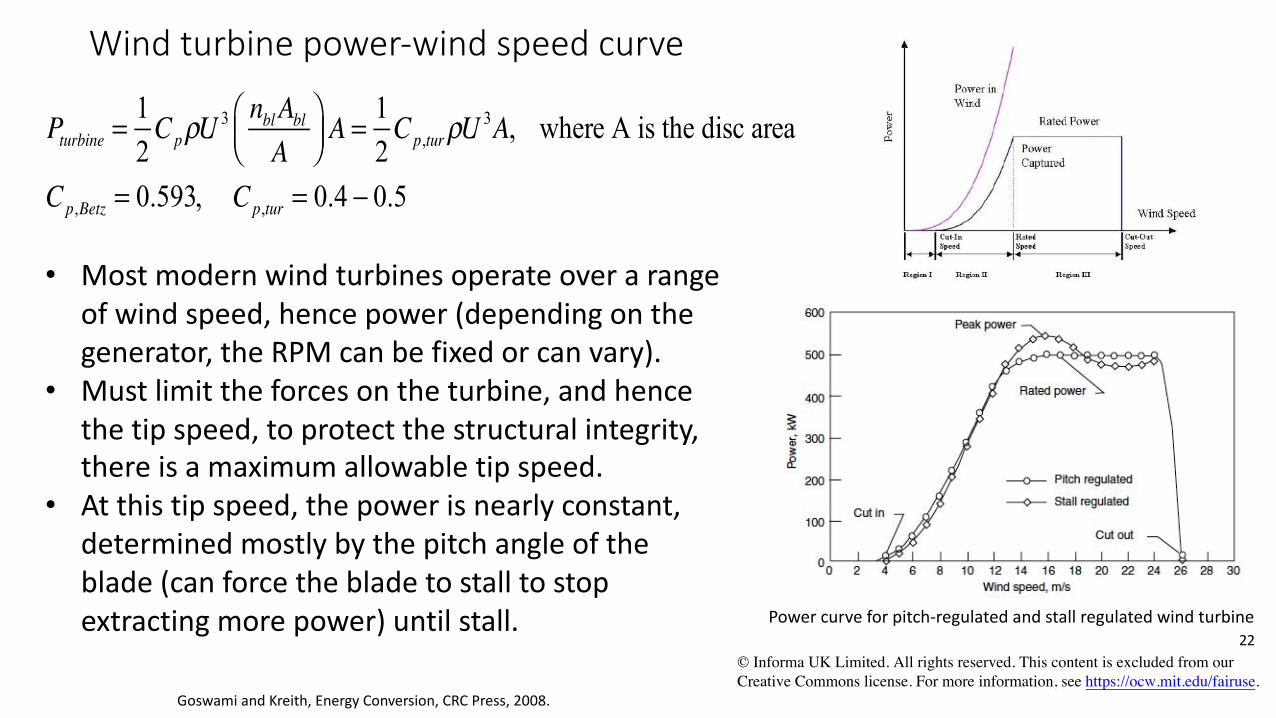
Wind turbine power-wind speed curve
1 ⎛ nblAbl ⎞ 1Pturbine = Cp ρU 3
⎝⎜ ⎠⎟ A = Cp,tur ρU 3A, where A is the disc area 2 A 2
Cp,Betz = 0.593, Cp,tur = 0.4 − 0.5
• Most modern wind turbines operate over a range of wind speed, hence power (depending on the generator, the RPM can be fixed or can vary).
• Must limit the forces on the turbine, and hence the tip speed, to protect the structural integrity, there is a maximum allowable tip speed.
• At this tip speed, the power is nearly constant, determined mostly by the pitch angle of the blade (can force the blade to stall to stop extracting more power) until stall. Power curve for pitch-regulated and stall regulated wind turbine
© Informa UK Limited. All rights reserved. This content is excluded from our Creative Commons license. For more information, see https://ocw.mit.edu/fairuse.
Goswami and Kreith, Energy Conversion, CRC Press, 2008.
22
https://www.mpoweruk.com/wind_power.htm
23
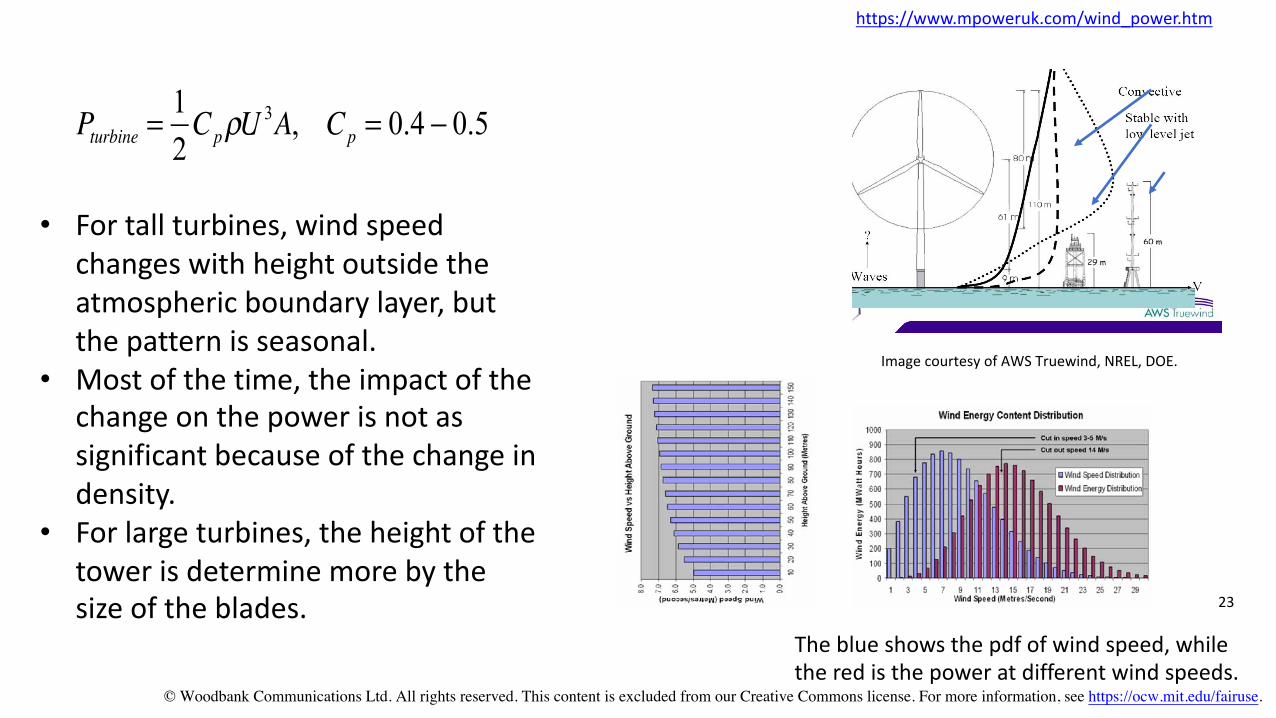
Pturbine = 1 Cp ρU 3A, Cp = 0.4 − 0.52
• For tall turbines, wind speedchanges with height outside theatmospheric boundary layer, butthe pattern is seasonal.
• Most of the time, the impact of thechange on the power is not assignificant because of the change indensity.
• For large turbines, the height of thetower is determine more by thesize of the blades.
The blue shows the pdf of wind speed, while the red is the power at different wind speeds.
© Woodbank Communications Ltd. All rights reserved. This content is excluded from our Creative Commons license. For more information, see https://ocw.mit.edu/fairuse.
Image courtesy of AWS Truewind, NREL, DOE.

Generators
• Most turbines (especially the larger ones) utilize induction (asynchronous) generators. These generators have simple rugged construction, and can be used as motors (reversing the current) for starting up the turbine.
• Power electronics are used to condition the power (frequency and voltage instabilities) before sending it to the grid.
• The generators can operate with variable speed (in case the rotational speed of the turbine varies in response to changing the wind conditions, again using power electronics to condition the power (especially the frequency of the AC current) before feeding to to the grid.
• Synchronous generators are also used, which can be directly connected with the turbine shaft.
© Woodbank Communications Ltd. All rights reserved. This content is excluded from our Creative Commons license. For more information, see https://ocw.mit.edu/fairuse.
24

Double fed Induction Generator (DFIG).
What is inside the nacelle?
Most widely used because of efficiency, simplicity and price. Can be used as a motor to start the turbine. https://www.mpoweruk.com/wind_power.htm 25 Produces high quality power.
© Woodbank Communications Ltd. All rights reserved. This content is excluded from our Creative Commons license. For more information, see https://ocw.mit.edu/fairuse.

NOISE: Mostly aerodynamic noise are associated with flow over turbine blades:
Sound pressure level is defiend as: Jianu et al, World Sustainable Forum, 2011
2 2SPL =10 log10 ( prms / pref ) pref = 10 µPa
Noise scales with M5
From Wind Turbines by Eric Hau 26
© Springer Nature Switzerland AG. All rights reserved. This content is excluded from our Creative Commons license. For more information, see https://ocw.mit.edu/fairuse.
© Source unknown. All rights reserved. This content is excluded from our Creative Commons license. For more information, see https://ocw.mit.edu/fairuse.

As always with noise, The noise factor effectiveness depends
on frequency
Adding serration to reduce noise
Using brushes can reduce noise by up tp 10 dB
© GE. All rights reserved. This content is excluded from our Creative Commons license. For more information, see https://ocw.mit.edu/fairuse.
Emitted mostly from Silent rotor by acoustic the tip optimization (SIROCCO) (highest speed) Jianu et al, World Sustainable Forum, 2011
© Sciforum. All rights reserved. This content is excluded from our Creative Commons license. For more information, see https://ocw.mit.edu/fairuse. 27
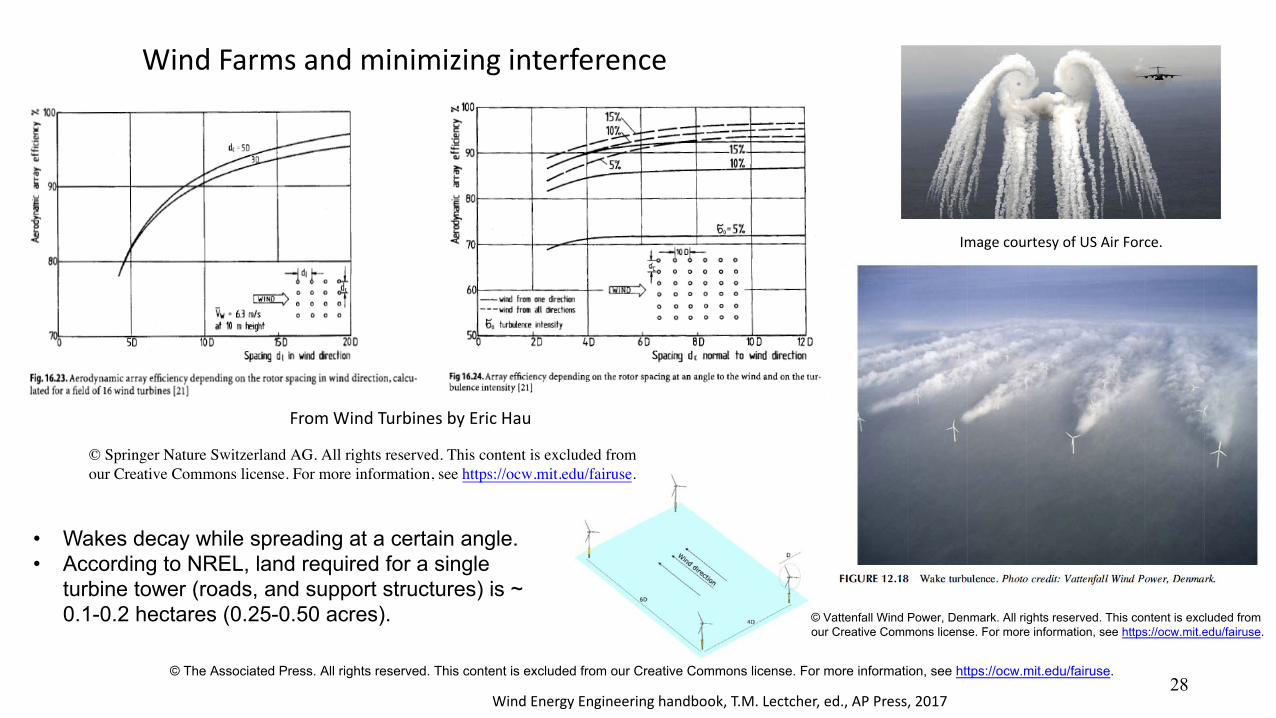
Wind Farms and minimizing interference
Image courtesy of US Air Force.
© Springer Nature Switzerland AG. All rights reserved. This content is excluded from our Creative Commons license. For more information, see https://ocw.mit.edu/fairuse.
© Vattenfall Wind Power, Denmark. All rights reserved. This content is excluded from our Creative Commons license. For more information, see https://ocw.mit.edu/fairuse.
From Wind Turbines by Eric Hau
• Wakes decay while spreading at a certain angle.• According to NREL, land required for a single
turbine tower (roads, and support structures) is ~0.1-0.2 hectares (0.25-0.50 acres).
© The Associated Press. All rights reserved. This content is excluded from our Creative Commons license. For more information, see https://ocw.mit.edu/fairuse. 28
Wind Energy Engineering handbook, T.M. Lectcher, ed., AP Press, 2017

Off-shore wind
Image courtesy of NREL, DOE.
29
© Center for Energy Efficiency and Renewable Energy (CEERE), University of Massachusetts. All rights reserved. This content is excluded from our Creative Commons license. For more information, see https://ocw.mit.edu/fairuse.
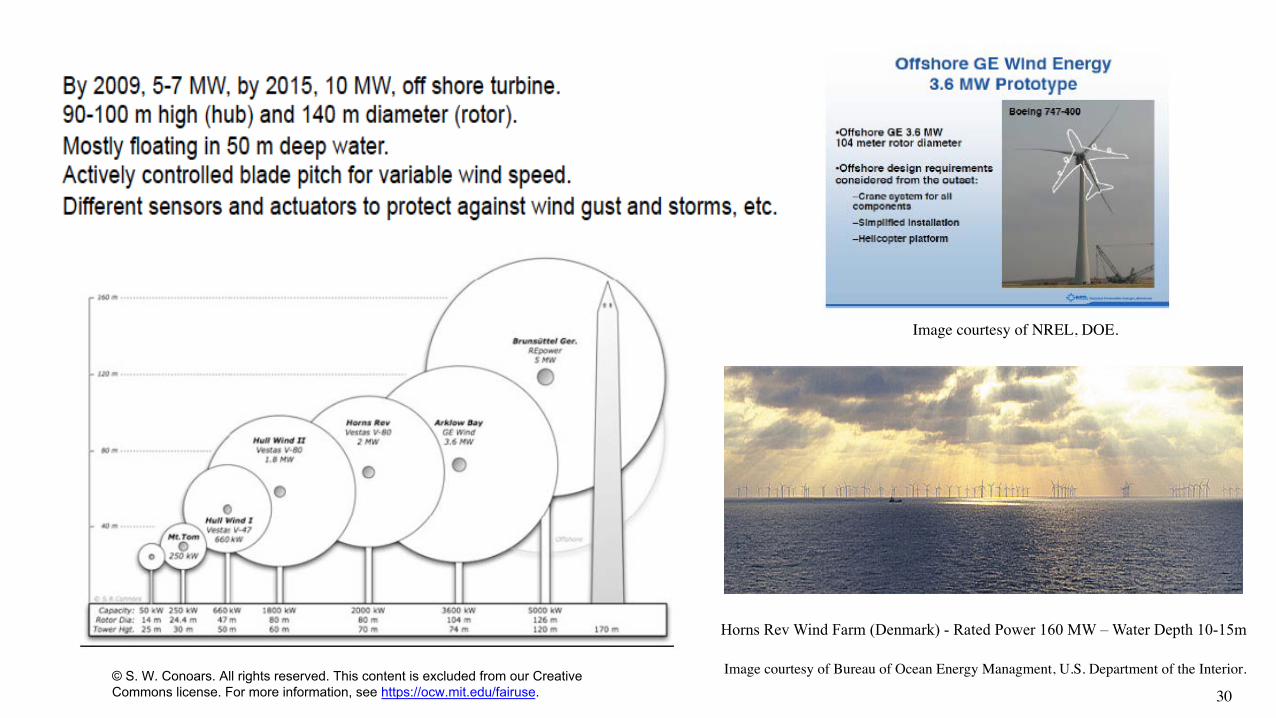
Image courtesy of NREL, DOE.
Horns Rev Wind Farm (Denmark) - Rated Power 160 MW – Water Depth 10-15m
Image courtesy of Bureau of Ocean Energy Managment, U.S. Department of the Interior.© S. W. Conoars. All rights reserved. This content is excluded from our Creative Commons license. For more information, see https://ocw.mit.edu/fairuse. 30

Vesta 7MW turbines, rotor D = 164 m https://www.mpoweruk.com/wind_power.htm © The Institution of Engineering and Technology. All rights reserved. Image courtesy of NREL, DOE. This content is excluded from our Creative Commons license. For more information, see https://ocw.mit.edu/fairuse.
31

MIT OpenCourseWare https://ocw.mit.edu/
2.60J Fundamentals of Advanced Energy Conversion Spring 2020
For information about citing these materials or our Terms of Use, visit: https://ocw.mit.edu/terms.