lecture 3 differential expression proteomics - … · lecture 3 differential ... biomarkers to...
TRANSCRIPT

Lecture 3 Differential Expression Proteomics
Arthur Moseley arthurmoseleydukeedu
Genome Academy April 2013
Quantitative Mass Spectrometry of Peptides and Proteins
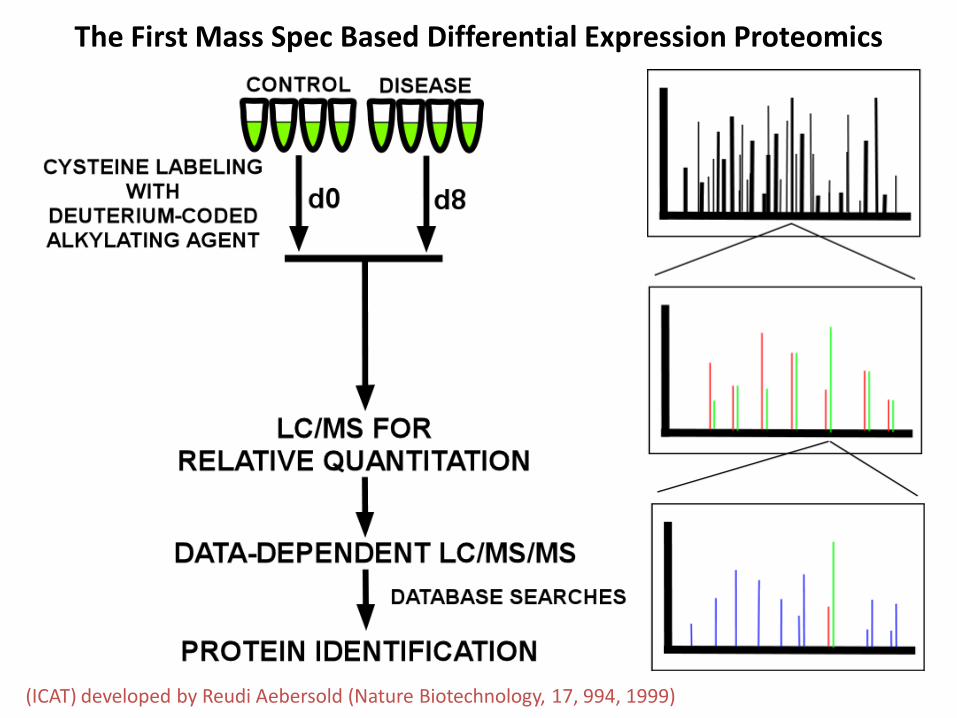
ndash Quantitative MS is easy to try hard to do right ndash Sets of ldquoLight and Heavyrdquo reagents can be used for relative
quantitation
ndash Quantitative MS often relies on use of isotopically labeled authentic standards
ndash Spiking authentic stable-labeled molecules (peptides drugs pesticides etc) into samples provides for molar quantitation
bull THE Gold standard approach for quantitative mass spectrometry
ndash Label-free quantitation is often very useful bull Used for relative quantitation and ldquoTop-3rdquo Mole Quantitation bull Ultimate flexibility in experimental design
ldquoOld-Schoolrdquo Differential Expression Proteomics
(ICAT) developed by Reudi Aebersold (Nature Biotechnology 17 994 1999)
The First Mass Spec Based Differential Expression Proteomics
ICAT Reagent and Strategy
Goshe and Smith Curr Op in Biotech (2003) 14101
Stable Isotope Labeling for Quantitative Proteomics - Lots of Options
Analytical Challenges Associated with Performing Quantitative Proteomics Using Chemical Isotopic Labeling
bull Bypassing gels avoids problems with membrane proteins other special cases
bull Sample loading issues contributing to poor dynamic range are reduced
bull Not all proteins contain targeted amino acid (tag dependent consideration)
bull Post-translational modifications can be missed (tag dependent)
bull Quantitation from LCMS relative intensities of isotope clusters
bull Qualitative Identification from LCMSMS peptide sequencing (MSMS)
bull Analytical challenge - very complex mixtures (30000+ peptidessample) are made more complex by isotope labeling (doubles number of analytes)
ndash pre-fractionate samples ndash Multidimensional analytical HPLC (capillary LCLCMSMS)
httpdocsappliedbiosystemscompebiodocs00113379pdf
Applied Biosystems iTRAQ reagents use isobaric tags
Multiple tags present with the same nominal mass in survey spectra Quantitation is done during the MSMS step simultaneously with peptide identification Only quantify peptides sequenced by MSMS - A subset of all peptides present
Label-free methods quantitate all species regardless of identification
Goshe and Smith Curr Op in Biotech (2003) 14101
Metabolic Stable Isotope Coding
SILAC generates a lot of data regarding 2 samples - Be aware of statistical limitations
Even when quantitative methods are used most of the time the focus is on function There is little attention to the details of quantitation
Such an approach is fundamentally flawed
Forget not the basic principals of quantitative analyses
ndash Replication QCs Validation
Rigorously use Quantitatively Reproducible Analytical Methods Forget not the basics of analytical chemistry
bull Highly reproducible chromatography is required
bull A high sampling rate across the chromatographic peak is required for accurate quantitation bullIdeally want 15-20 sampling points across chromatographic profile bullHighly reproducible chromatography is required for sample-to-sample comparisons
bull High resolution accurate mass (precursor amp products) tandem mass spectrometry technology needed
bull For quantitative selectivity (near isobaric cross-talk)
bull For accurate qualitative identifications 1 FPR at peptide level (Decoy DB Peptide Prophet)
bull No QCs = No Quantifiably Reliable Data
bull No Replication = No Quantifiably Reliable Data
bull No Common Standard = No Meaningful Comparison across Projects
Overview of Label Free Quantitation
LC Separation
Acquisition of MS Data
Import Raw Data Data Alignment amp Feature Extraction
Import Raw MSMS Data
Annotation amp PeptideProtein
Analysis
Statistical Analysis of Differences
Acquisition of Selected MSMS
Data Via Targeted Analysis
Peptide Identification
(Database Search Engine)
(courtesy Rosetta Biosoftware)
LC retention time
mas
s-to
-cha
rge
(mz
) rat
io
Gel-Free Label Free Proteomics High Resolution Accurate Mass 3D Peptide Mass Map
X and Y coordinates identify the peptide Y coordinate (mass-to charge ratio) is fixed to lt5 ppm error
X coordinate (LC Retention Time) has more variability (typically lt 6 seconds)
An isotope group of a peptide
bullIntensity (AUC) of SIC of peptide is the quantitative measure
bullMust be accurately measured across statistically significant sample cohort
Results of Data Alignment based on Accurate Mass and Retention Time
Raw Data
Aligned Data
111015 Features Aligned across 16 LCMS Analyses
of Cell Lines
How to QC this vast Amount of Data
Aligned Data Combined by
Biological Condition
QC of Individual Isotope Groups pairwise t-tests of significance of peak area
measurement
Column Condition QC1 Sample 1 Sample 2 Sample 3 Sample 4 Sample 5 Sample 6 Sample 7 Sample 8 Sample 9 Sample 10 QC 2 Sample 11 Sample 12 Sample 13
Rigorously use Quantitatively Reproducible Analytical Methods Daily QC Checks of Data Acquisition Precision and Reproducibility
Instrument Performance Checks Day 1(+) QCs Column Conditioning Preliminary database searches
Day 2 Data Collection Day 3 Data Collection
QC X-1 Sample X-5
Sample X-4
Sample X-3
Sample X-2
Sample X-1
Sample X QC X helliphelliphellip
Day X Data Collection
bull Want to maximize biological powering - analyzing as many samples as possible
bull Must use robust LC-MS platform and singlicate analysis of each sample
bull Data QC is performed by daily injections of a ldquostandardrdquo of the same biological sample (pool)
bull Aliquots of same pool used in all projects ndash QC tracking across projects
Quantitatively Reproducible Analytical Methods Forget not the basics of analytical chemistry
Assessing Quantitative Reproducibility with Daily QCs
bull Analytical Variability ~ 35000 peptides
bull Daily QC Sample (pool of QC plasma sample)
bull Analytical + Biological Variability bull Patient Samples
25 CV Plasma Peptides
Note X- Axis Scale Differences QC Samples 0 to 170 CV Biological Samples 0 to 500 CV
125 CV Plasma Peptides
~ 40 peptides CV lt 10
~ 70 peptides CV lt 20
~ 90 peptides CV lt 25
~ 2 peptides
CV lt 25
QC Metric 1 = CV (Anal + Biol Variability) - CV (Anal Variability)
- Alternating cycles (1 sec each) of precursor product scans provides high reproducibility via a high sampling rate across chromatographic peak
- Major attribute of MSE
VVGLSTLPEYIEK 128 CV across all samples
Rigorously use Quantitatively Reproducible Analytical Methods Assessing Quantitative Reproducibility at the Peptide Level with QCs
Reproducibility of Internal Standard Spiked into Each Sample
ADH1_YEAST (50fmolug) Peptide Abundance across 60 patient clinical cohort
DDA Data Qual only
Label Free Intensity Plots differential expression visualization
Cluster Analysis of Label Free Quantitation Datasets
bull Cluster Analyses ndash Examine large data sets
and determine if items behave similarly
ndash Data belonging to the same cluster are similar at some level
ndash Data sets in different clusters are less similar at some level
ndash Make a preliminary assessment of possible relationships between clusters and identify data sets for further investigation
Proteins
Trea
tmen
t Gro
ups
Differential Protein Expression
bull Differential protein expression studies are key for ndash Identifying biomarkers of disease and treatment response ndash Elucidating biological pathways ndash Identifying and validating protein drug targets
bull Essentially all differential proteomics studies have
studied relative protein expression ndash Isotope labeling methods ndash Label free methods
bull Differential proteomic expression studies based on
ldquoabsoluterdquo quantitation have yet to be fully exploited
Relative Protein Expression
bull Provides data on protein expression changes between two or more samples within the same experiment
bull Requires direct comparison of proteolytic peptides or marker ions from proteolytic peptides ndash Provides relative abundance ratios of the same
protein between different samples ndash Data does not easily extrapolate beyond the
experiment bull Experiments are isolated ldquoislands of informationrdquo
One Exemplar Biomarker Discovery amp Verification Project
Biomarkers to Predict Outcomes of Hepatitis C Patient Treatment in Serum of Treatment Naive Patients
Jeanette McCarthy Keyur Patel Joe Lucas and John McHutchison
Spontaneous clearance (~25)
20 cirrhosis
3-5 cancer
Chronic infection
Eligible for Treatment
Responders Non-responders (gt50)
Hepatic Fibrosis Steatosis Insulin resistance Dyslipidemia
Increased risk of diabetes
Unknown consequences
Cohort Selection and Placement in the Pipeline (Guided by an ldquoUnmet Clinical Needrdquo US HUPO 2009)
First Discover in Matched Cohorts to Focus on the Clinical Variable of Interest
Second Verify in All-Comers Trials to Test Robustness
Number of Analytes
Number of Samples
10000s
10s
100-1000
100 -1000
10s
1000s
Biomarker Validation
Biomarker Discovery
Biomarker Verification
Duke Hepatology Biorepository - 3169 patients Discovery Cohort - small discovery experiment - well matched cohort from Biorepository - n = 55 patients - lsquoomic LCMSMS
Biomarker Discovery Paradigm Challenge Hepatitis C Cohorts ndash all by UPLCQ-Tof
Open Platform LCMS LCMSMS (MRM) LCMSMS (MRM)
Verification Cohort 2 - pediatric patients - ldquoall-comersrdquo trial - N = 50 patients
Verification Cohort 1 - well matched cohort from Biorepository - n = 41 patients
Verification Validation Cohort 3 - ldquoall-comersrdquo trial (Australia) - N = 243 patients
Insure Professional Use of Statistical Tools Suitable for High Dimensional Data Analyses
Sparse Latent Factor Regression - Bayesian Factor Regression Modeling
35000 Isotope Groups Predictive Factor ldquoMetaproteinsrdquo
Factor Score ldquoExpression Valuerdquo
Statistical Analysis Joe Lucas PhD
Duke IGSP
bull Regression - Leads directly to prediction bull Sparsity ndash Most peptides are irrelevant for prediction bull Latent Factors ndash let data determine important relationships bull Resulting model for prediction
bull Initial Metaprotein Model - 650 Isotope Groups
Pastor Thomas Bayes
Key Features of Metaprotein Expression Modeling Bayesian Factor Regression Model
bull Allows correction of large scale correlational structure between proteins arising from technical rather than biological variability
bull Casts a ldquowide netrdquo initially for predictive peptides
bull Models both identified and unidentified peptides
bull Utilizes identifications while allowing for incorrect identifications
bull Recognizes that some peptides from a protein may be post-translationally modified and the expression of these peptides may not be representative of the protein as a whole
bull Can be used in the creation of predictive models based on multiple proteins
capturing ldquopathwayrdquo expression
Joe Lucas et al ldquoMetaprotein Expression Modeling for Label-Free Quantitative Proteomicsrdquo J Proteome Res in review Oral presentation 2011 RECOMB Satellite Conference on Computational Proteomics
Remember A Metaprotein Modelhellip bull A Metaprotein is a group of peptides which exhibit
a similar expression pattern across the cohort(s)
bull A Metaprotein may contain ndash All peptides from one protein ndash A subset of peptides from a protein ndash A collection of peptides from multiple proteins
bull Model constructed with intensity measurements
aggregated at the isotope group level ndash Identified or unidentified peptides
Metaprotein expression modeling for label-free quantitative proteomics Lucas JE Thompson JW Dubois LG McCarthy J Tillmann H Thompson A Shire N Hendrickson R Dieguez F Goldman P Schwarz K Patel K McHutchison J Moseley MA BMC Bioinformatics 2012 May 413(1)74
Discovery and Initial Verification of SVR-Prediction Using Unbiased Data
Discovery Data Build Model
Use Model to Predict SVR (Blinded)
Patel et al Hepatology 2011 Jun53(6)1809-1818
Reproducibility of Metaprotein Biosignatures
bull Build predictive model with first three cohorts bull Predict NR SVR in ldquoBig Pharmardquo measured data
ndash different LCMSMS (LTQ-Orbi) system in different lab ndash Metaprotein model maintained consistent results
Discovery Cohort N = 55
Matched
Discovery Cohort Measured by
Big Pharma Lab
Verification Cohort 1
N = 41 Matched
Verification Cohort 2
N = 50 All-Comers
Relative Protein Expression
bull Provides data on protein expression changes between two or more samples within the same experiment
bull Requires direct comparison of proteolytic peptides or marker ions from proteolytic peptides ndash Provides relative abundance ratios of the same
protein between different samples ndash Data does not extrapolate beyond the experiment
bull Experiments are isolated ldquoislands of informationrdquo
Absolute Protein Expression ndash lsquoomic scale
bull Calculation of the absolute amount of the proteins present (ng or fm) in a sample ndash Permits determination of stoichiometry of
proteins in macromolecular complexes ndash Permits extrapolation of results to different
experiments in different labs
bull These workers made the notable and unexpected observation ndash ldquothe average MS signal response for the three
most abundant peptides per mole of protein is constant within a coefficient of variation of less than 10rdquo
ndash ldquoGiven an internal standard this relationship is used to calculate a universal response factor (countsmole)rdquo
NOTE ndash ldquoabsoluterdquo is a controversial description
Intensity Distribution of Peptides from One Protein Response Per fmol for a Six Protein Mixture
Biological ldquoValidationrdquo by Determining Stoichometric Ratios
Absolute Quantification of Proteins by LCMSE
A Virtue of Parrallel MS Acquistion
Jeffrey C Silva Marc V Gorenstein Guo-Zhong Li Johannes PC Vissers Scott Geromanos Molecular amp Cellular Proteomics 5144-156 2006
Absolute Quantitation at the Protein Level - E coli lysate spiked with 4 exogenous proteins
Absolute Quantitation for Measurement of Fold-Changes E coli spiking Experiment
Quantitative proteomics reveals metabolic and pathogenic properties of Chlamydia trachomatis developmental forms Hector A Saka1 J Will Thompson2 Yi-Shan Chen1 Yadunanda Kumar13 Laura G Dubois2 M Arthur Moseley2 andRaphael H Valdivia1
Mol Microbiol 2011 December 82(5) 1185ndash1203 PMCID PMC3225693
Quantitative proteomics reveals metabolic and pathogenic properties of Chlamydia trachomatis developmental forms
Hector A Saka1 J Will Thompson2 Yi-Shan Chen1 Yadunanda Kumar13 Laura G Dubois2 M Arthur Moseley2 and Raphael H Valdivia1
C trachomatis is the most common bacterial STD and exhibits a biphasic development cycle ndash EB infectious RB non-infectious
Protein Identification Metrics (Swissprot Human NCBI C trachomatis 1 FDR)
EB (775)
RB (1120)
420 355 700
HUMAN (990 ~5)
CHLAMYDIA (485 55)
EB (349)
RB (851)
210 139 641 210 216 59
EB (426)
RB (269)
Mass spectrometry allows us to distinctly isolate the signal from Chlamydia versus Human gt54 of C trachomatis proteome
Global Strategy for Using Mass Spectrometry to Deal with Mixed Proteomes using UPLCUPLCMSMS
Calculate sum ng of Chlamydia proteins use this to normalize fmol values
EB CT842 80 plusmn 3 fmolug RB CT842 84 plusmn 19 fmolug
Calculate fmol of Each Protein Using Method of Silva and Geromanos
EB 339 Chlamydia Proteins CT842 200 plusmn 25 fmol
RB 181 Chlamydia Proteins CT842 47 plusmn 9 fmol
Remove Peptide Matches Shared Between Species
EB 14 Homologous Peptides RB 8 Homologous Peptides
Search Against Both Human and Chlamydia DB
EB 754 Human 3916 Chlamydia Peptides RB 4025 Human 1274 Chlamydia Peptides
Protein NameSample 1
(uncorrected)Sample 2
(uncorrected)Sample 1
(corrected)Sample 2
(corrected)Measured Ratio (uncorrected)
Measured Ratio (corrected) Theoretical Ratio
ALBU_BOVIN 217plusmn4 118plusmn35 561plusmn9 132plusmn39 18 43 40ADH1_YEAST 234plusmn6 260plusmn7 604plusmn7 291plusmn7 090 21 20ENO1_YEAST 50plusmn3 112plusmn7 129plusmn5 125plusmn7 050 10 20PYGM_RABIT 277plusmn05 105plusmn5 69plusmn3 117plusmn5 026 060 050E Coli Proteins (average) 109plusmn6 263plusmn17 281plusmn12 294plusmn19 041 10 10
RatiosQuantitation (fmolug)
Validation of Species-Specific Quantitation using a Model System
Sample 1 Sample 2Spiked E Coli Lysate 025 ug 05 ugMouse Brain Lysate 025 ug 0 ugTotal Column Load 05 ug 05 ug
Reproducibility of Protein Quantitation
Protein CV Distribution EB Protein CV Distribution RB
Species-Specific Correction Applied to Chlamydia Protein Quantitation
EB vs RB Quantitation (with Species-Specific Scaling) Select Proteins with Verification
Protein Classes and Relative Abundance in the Developmental Forms
- EBs are enriched in T3S-effectors and chaperones as well as in enzymes involved in glucose catabolism - RBs are enriched for protein synthesis and assembly components ATP generation and transport and nutrient import
Molecular Evidence of the Different Metabolic Properties of the two Developmental Stages
Proteomic results show the EB and RB proteomes are streamlined for their function - maximum infectivity for EB replicative capacity for RBs
Figure 1Fundamentals of isotope-dilution mass spectrometry for quantification (A) Amount of the native or endogenous peptide in the sample is quantified using the ratio of the mass spectrometric response to the endogenous peptide and the SIS peptide and the initial amount of the SIS peptide spiked into the sample (B) In SRM only specific product ions from collision-induced dissociation events are recorded The top panel illustrates the operations of an ion-trap mass spectrometer whereas the bottom panel illustrates the operations of a triple quadrupole mass spectrometer for SRM Note that operations in an ion-trap are sequential in time for a given population of injected ions whereas in a triple quadrupole each quadrupole specializes in carrying the three operations simultaneously on the ions that are continuously conveyed Parent ion mz product ion mz and elution-time criteria from SRM enable selectivity and sensitivity for the detection of specific peptides in complex mixtures from biological sources Recording multiple product ion trasitions as in multiple reaction monitoring can further increase the selectivity SIS Stable isotope-labeled standard SRM Selected reaction monitoring
A Simple Explanation of Selected Reaction Monitoring for Quantitative Analysis Mayya and Han Expert Rev Proteomics 3(6) 597-610 (2006)
(A) In the regular MRM mode of acquisition the mass spectrometer records product ion transitions intended from the SIS peptide and the endogenous peptide in alternate scans (B) The mass spectrometer can be instructed to record multiple product ion transitions from multiple SIS and endogenous peptide pairs and continue to do so in each acquisition cycle for the entire duration of chromatography This allows multiplexed quantification However the reduced sampling frequency can compromise sensitivity reproducibility and accuracy of quantification (C) The chromatographic duration can be subdivided into time-segments or slices wherein different endogenous peptides are quantified using corresponding acquisition cycles However the method is limited by the peak capacity of the online chromatographic method and requires highly reproducible elution times (D) It is practically difficult to achieve consistent elution times of peptides in complex mixtures on a routine basis A hybrid staggered multiplexingrsquo is an optimum strategy as it attempts to maximize the elution time-window for the peptides and also to minimize the number of MRMs in each acquisition cycle The peptide-pairs in each acquisition cycle are indicated for illustrating the staggeredrsquo nature of acquisition
Skyline Open Source Software for Targeted Method Development and Data Analysis
Fig 2 Calibration curves for quantifying heavy-labeled pure AAC and TNFα peptides The ion signals for different amounts of pure synthetic heavy peptides were measured using LCndashMS and used to determine the linear range of quantification on the linear ion trap instrument Duplicate analyses were performed for each amount of peptide injected Error bars show the range for each measurement
A major bottleneck for validation of new clinical diagnostics is the development of highly sensitive and specific assays for quantifying proteins We previously described a method stable isotope standards with capture by antipeptide antibodies wherein a specific tryptic peptide is selected as a stoichiometric representative of the protein from which it is cleaved is enriched from biological samples using immobilized antibodies and is quantitated using mass spectrometry against a spiked internal standard to yield a measure of protein concentration In this study we optimized a magnetic-bead-based platform amenable to high-throughput peptide capture and demonstrated that antibody capture followed by mass spectrometry can achieve ion signal enhancements on the order of 10(3) with precision (CVs lt10) and accuracy (relative error approximately 20) sufficient for quantifying biomarkers in the physiologically relevant ngmL range These methods are generally applicable to any protein or biological fluid of interest and hold great potential for providing a desperately needed bridging technology between biomarker discovery and clinical application
Anal Biochem 2007 Mar 1362(1)44-54 Epub 2006 Dec 20 Antibody-based enrichment of peptides on magnetic beads for mass-spectrometry-based quantification of serum biomarkers Whiteaker JR Zhao L Zhang HY Feng LC Piening BD Anderson L Paulovich AG Source Fred Hutchinson Cancer Research Center 1100 Fairview Avenue N PO Box 19024 Seattle WA 98109-1024 USA
Acknowledgments Duke University Proteomics Core Facility
httpwwwgenomedukeeducoresproteomics
Biostatistics Dr Joseph Lucas Funding NIH S10 grant Duke School of Medicine CTSA grant UL1RR024128
- Lecture 3Differential Expression Proteomics
- Quantitative Mass Spectrometry of Peptides and Proteins
- ldquoOld-Schoolrdquo Differential Expression Proteomics
- The First Mass Spec Based Differential Expression Proteomics
- Slide Number 5
- Slide Number 6
- Analytical Challenges Associated with Performing Quantitative Proteomics Using Chemical Isotopic Labeling
- Slide Number 8
- Metabolic Stable Isotope Coding
- Slide Number 10
- Slide Number 11
- Slide Number 12
- Slide Number 13
- Overview of Label Free Quantitation
- Slide Number 15
- Slide Number 16
- Slide Number 17
- Slide Number 18
- Slide Number 19
- Slide Number 20
- Label Free Intensity Plots differential expression visualization
- Cluster Analysis of Label Free Quantitation Datasets
- Differential Protein Expression
- Relative Protein Expression
- One Exemplar Biomarker Discovery amp Verification ProjectBiomarkers to Predict Outcomes of Hepatitis C Patient Treatment in Serum of Treatment Naive PatientsJeanette McCarthy Keyur Patel Joe Lucas and John McHutchison
- Cohort Selection and Placement in the Pipeline(Guided by an ldquoUnmet Clinical Needrdquo US HUPO 2009)
- Slide Number 27
- Slide Number 28
- Key Features of Metaprotein Expression Modeling Bayesian Factor Regression Model
- Remember A Metaprotein Modelhellip
- Discovery and Initial Verification of SVR-Prediction Using Unbiased Data
- Slide Number 32
- Relative Protein Expression
- Absolute Protein Expression ndash lsquoomic scale
- Slide Number 35
- Slide Number 36
- Absolute Quantitation at the Protein Level - E coli lysate spiked with 4 exogenous proteins
- Absolute Quantitation for Measurement of Fold-Changes E coli spiking Experiment
- Slide Number 39
- Quantitative proteomics reveals metabolic and pathogenicproperties of Chlamydia trachomatis developmental formsHector A Saka1 J Will Thompson2 Yi-Shan Chen1 Yadunanda Kumar13 Laura GDubois2 M Arthur Moseley2 and Raphael H Valdivia1
- Protein Identification Metrics(Swissprot Human NCBI C trachomatis 1 FDR)
- Global Strategy for Using Mass Spectrometry to Deal with Mixed Proteomes using UPLCUPLCMSMS
- Validation of Species-Specific Quantitationusing a Model System
- Reproducibility of Protein Quantitation
- Species-Specific Correction Applied to Chlamydia Protein Quantitation
- Protein Classes and Relative Abundance in the Developmental Forms
- Molecular Evidence of the Different Metabolic Properties of the two Developmental Stages
- Slide Number 48
- Slide Number 49
- Slide Number 50
- Skyline Open Source Software for Targeted Method Development and Data Analysis
- Slide Number 52
- Slide Number 53
- Slide Number 54
- Slide Number 55
- AcknowledgmentsDuke University Proteomics Core Facilityhttpwwwgenomedukeeducoresproteomics
-

Quantitative Mass Spectrometry of Peptides and Proteins
ndash Quantitative MS is easy to try hard to do right ndash Sets of ldquoLight and Heavyrdquo reagents can be used for relative
quantitation
ndash Quantitative MS often relies on use of isotopically labeled authentic standards
ndash Spiking authentic stable-labeled molecules (peptides drugs pesticides etc) into samples provides for molar quantitation
bull THE Gold standard approach for quantitative mass spectrometry
ndash Label-free quantitation is often very useful bull Used for relative quantitation and ldquoTop-3rdquo Mole Quantitation bull Ultimate flexibility in experimental design
ldquoOld-Schoolrdquo Differential Expression Proteomics
(ICAT) developed by Reudi Aebersold (Nature Biotechnology 17 994 1999)
The First Mass Spec Based Differential Expression Proteomics
ICAT Reagent and Strategy
Goshe and Smith Curr Op in Biotech (2003) 14101
Stable Isotope Labeling for Quantitative Proteomics - Lots of Options
Analytical Challenges Associated with Performing Quantitative Proteomics Using Chemical Isotopic Labeling
bull Bypassing gels avoids problems with membrane proteins other special cases
bull Sample loading issues contributing to poor dynamic range are reduced
bull Not all proteins contain targeted amino acid (tag dependent consideration)
bull Post-translational modifications can be missed (tag dependent)
bull Quantitation from LCMS relative intensities of isotope clusters
bull Qualitative Identification from LCMSMS peptide sequencing (MSMS)
bull Analytical challenge - very complex mixtures (30000+ peptidessample) are made more complex by isotope labeling (doubles number of analytes)
ndash pre-fractionate samples ndash Multidimensional analytical HPLC (capillary LCLCMSMS)
httpdocsappliedbiosystemscompebiodocs00113379pdf
Applied Biosystems iTRAQ reagents use isobaric tags
Multiple tags present with the same nominal mass in survey spectra Quantitation is done during the MSMS step simultaneously with peptide identification Only quantify peptides sequenced by MSMS - A subset of all peptides present
Label-free methods quantitate all species regardless of identification
Goshe and Smith Curr Op in Biotech (2003) 14101
Metabolic Stable Isotope Coding
SILAC generates a lot of data regarding 2 samples - Be aware of statistical limitations
Even when quantitative methods are used most of the time the focus is on function There is little attention to the details of quantitation
Such an approach is fundamentally flawed
Forget not the basic principals of quantitative analyses
ndash Replication QCs Validation
Rigorously use Quantitatively Reproducible Analytical Methods Forget not the basics of analytical chemistry
bull Highly reproducible chromatography is required
bull A high sampling rate across the chromatographic peak is required for accurate quantitation bullIdeally want 15-20 sampling points across chromatographic profile bullHighly reproducible chromatography is required for sample-to-sample comparisons
bull High resolution accurate mass (precursor amp products) tandem mass spectrometry technology needed
bull For quantitative selectivity (near isobaric cross-talk)
bull For accurate qualitative identifications 1 FPR at peptide level (Decoy DB Peptide Prophet)
bull No QCs = No Quantifiably Reliable Data
bull No Replication = No Quantifiably Reliable Data
bull No Common Standard = No Meaningful Comparison across Projects
Overview of Label Free Quantitation
LC Separation
Acquisition of MS Data
Import Raw Data Data Alignment amp Feature Extraction
Import Raw MSMS Data
Annotation amp PeptideProtein
Analysis
Statistical Analysis of Differences
Acquisition of Selected MSMS
Data Via Targeted Analysis
Peptide Identification
(Database Search Engine)
(courtesy Rosetta Biosoftware)
LC retention time
mas
s-to
-cha
rge
(mz
) rat
io
Gel-Free Label Free Proteomics High Resolution Accurate Mass 3D Peptide Mass Map
X and Y coordinates identify the peptide Y coordinate (mass-to charge ratio) is fixed to lt5 ppm error
X coordinate (LC Retention Time) has more variability (typically lt 6 seconds)
An isotope group of a peptide
bullIntensity (AUC) of SIC of peptide is the quantitative measure
bullMust be accurately measured across statistically significant sample cohort
Results of Data Alignment based on Accurate Mass and Retention Time
Raw Data
Aligned Data
111015 Features Aligned across 16 LCMS Analyses
of Cell Lines
How to QC this vast Amount of Data
Aligned Data Combined by
Biological Condition
QC of Individual Isotope Groups pairwise t-tests of significance of peak area
measurement
Column Condition QC1 Sample 1 Sample 2 Sample 3 Sample 4 Sample 5 Sample 6 Sample 7 Sample 8 Sample 9 Sample 10 QC 2 Sample 11 Sample 12 Sample 13
Rigorously use Quantitatively Reproducible Analytical Methods Daily QC Checks of Data Acquisition Precision and Reproducibility
Instrument Performance Checks Day 1(+) QCs Column Conditioning Preliminary database searches
Day 2 Data Collection Day 3 Data Collection
QC X-1 Sample X-5
Sample X-4
Sample X-3
Sample X-2
Sample X-1
Sample X QC X helliphelliphellip
Day X Data Collection
bull Want to maximize biological powering - analyzing as many samples as possible
bull Must use robust LC-MS platform and singlicate analysis of each sample
bull Data QC is performed by daily injections of a ldquostandardrdquo of the same biological sample (pool)
bull Aliquots of same pool used in all projects ndash QC tracking across projects
Quantitatively Reproducible Analytical Methods Forget not the basics of analytical chemistry
Assessing Quantitative Reproducibility with Daily QCs
bull Analytical Variability ~ 35000 peptides
bull Daily QC Sample (pool of QC plasma sample)
bull Analytical + Biological Variability bull Patient Samples
25 CV Plasma Peptides
Note X- Axis Scale Differences QC Samples 0 to 170 CV Biological Samples 0 to 500 CV
125 CV Plasma Peptides
~ 40 peptides CV lt 10
~ 70 peptides CV lt 20
~ 90 peptides CV lt 25
~ 2 peptides
CV lt 25
QC Metric 1 = CV (Anal + Biol Variability) - CV (Anal Variability)
- Alternating cycles (1 sec each) of precursor product scans provides high reproducibility via a high sampling rate across chromatographic peak
- Major attribute of MSE
VVGLSTLPEYIEK 128 CV across all samples
Rigorously use Quantitatively Reproducible Analytical Methods Assessing Quantitative Reproducibility at the Peptide Level with QCs
Reproducibility of Internal Standard Spiked into Each Sample
ADH1_YEAST (50fmolug) Peptide Abundance across 60 patient clinical cohort
DDA Data Qual only
Label Free Intensity Plots differential expression visualization
Cluster Analysis of Label Free Quantitation Datasets
bull Cluster Analyses ndash Examine large data sets
and determine if items behave similarly
ndash Data belonging to the same cluster are similar at some level
ndash Data sets in different clusters are less similar at some level
ndash Make a preliminary assessment of possible relationships between clusters and identify data sets for further investigation
Proteins
Trea
tmen
t Gro
ups
Differential Protein Expression
bull Differential protein expression studies are key for ndash Identifying biomarkers of disease and treatment response ndash Elucidating biological pathways ndash Identifying and validating protein drug targets
bull Essentially all differential proteomics studies have
studied relative protein expression ndash Isotope labeling methods ndash Label free methods
bull Differential proteomic expression studies based on
ldquoabsoluterdquo quantitation have yet to be fully exploited
Relative Protein Expression
bull Provides data on protein expression changes between two or more samples within the same experiment
bull Requires direct comparison of proteolytic peptides or marker ions from proteolytic peptides ndash Provides relative abundance ratios of the same
protein between different samples ndash Data does not easily extrapolate beyond the
experiment bull Experiments are isolated ldquoislands of informationrdquo
One Exemplar Biomarker Discovery amp Verification Project
Biomarkers to Predict Outcomes of Hepatitis C Patient Treatment in Serum of Treatment Naive Patients
Jeanette McCarthy Keyur Patel Joe Lucas and John McHutchison
Spontaneous clearance (~25)
20 cirrhosis
3-5 cancer
Chronic infection
Eligible for Treatment
Responders Non-responders (gt50)
Hepatic Fibrosis Steatosis Insulin resistance Dyslipidemia
Increased risk of diabetes
Unknown consequences
Cohort Selection and Placement in the Pipeline (Guided by an ldquoUnmet Clinical Needrdquo US HUPO 2009)
First Discover in Matched Cohorts to Focus on the Clinical Variable of Interest
Second Verify in All-Comers Trials to Test Robustness
Number of Analytes
Number of Samples
10000s
10s
100-1000
100 -1000
10s
1000s
Biomarker Validation
Biomarker Discovery
Biomarker Verification
Duke Hepatology Biorepository - 3169 patients Discovery Cohort - small discovery experiment - well matched cohort from Biorepository - n = 55 patients - lsquoomic LCMSMS
Biomarker Discovery Paradigm Challenge Hepatitis C Cohorts ndash all by UPLCQ-Tof
Open Platform LCMS LCMSMS (MRM) LCMSMS (MRM)
Verification Cohort 2 - pediatric patients - ldquoall-comersrdquo trial - N = 50 patients
Verification Cohort 1 - well matched cohort from Biorepository - n = 41 patients
Verification Validation Cohort 3 - ldquoall-comersrdquo trial (Australia) - N = 243 patients
Insure Professional Use of Statistical Tools Suitable for High Dimensional Data Analyses
Sparse Latent Factor Regression - Bayesian Factor Regression Modeling
35000 Isotope Groups Predictive Factor ldquoMetaproteinsrdquo
Factor Score ldquoExpression Valuerdquo
Statistical Analysis Joe Lucas PhD
Duke IGSP
bull Regression - Leads directly to prediction bull Sparsity ndash Most peptides are irrelevant for prediction bull Latent Factors ndash let data determine important relationships bull Resulting model for prediction
bull Initial Metaprotein Model - 650 Isotope Groups
Pastor Thomas Bayes
Key Features of Metaprotein Expression Modeling Bayesian Factor Regression Model
bull Allows correction of large scale correlational structure between proteins arising from technical rather than biological variability
bull Casts a ldquowide netrdquo initially for predictive peptides
bull Models both identified and unidentified peptides
bull Utilizes identifications while allowing for incorrect identifications
bull Recognizes that some peptides from a protein may be post-translationally modified and the expression of these peptides may not be representative of the protein as a whole
bull Can be used in the creation of predictive models based on multiple proteins
capturing ldquopathwayrdquo expression
Joe Lucas et al ldquoMetaprotein Expression Modeling for Label-Free Quantitative Proteomicsrdquo J Proteome Res in review Oral presentation 2011 RECOMB Satellite Conference on Computational Proteomics
Remember A Metaprotein Modelhellip bull A Metaprotein is a group of peptides which exhibit
a similar expression pattern across the cohort(s)
bull A Metaprotein may contain ndash All peptides from one protein ndash A subset of peptides from a protein ndash A collection of peptides from multiple proteins
bull Model constructed with intensity measurements
aggregated at the isotope group level ndash Identified or unidentified peptides
Metaprotein expression modeling for label-free quantitative proteomics Lucas JE Thompson JW Dubois LG McCarthy J Tillmann H Thompson A Shire N Hendrickson R Dieguez F Goldman P Schwarz K Patel K McHutchison J Moseley MA BMC Bioinformatics 2012 May 413(1)74
Discovery and Initial Verification of SVR-Prediction Using Unbiased Data
Discovery Data Build Model
Use Model to Predict SVR (Blinded)
Patel et al Hepatology 2011 Jun53(6)1809-1818
Reproducibility of Metaprotein Biosignatures
bull Build predictive model with first three cohorts bull Predict NR SVR in ldquoBig Pharmardquo measured data
ndash different LCMSMS (LTQ-Orbi) system in different lab ndash Metaprotein model maintained consistent results
Discovery Cohort N = 55
Matched
Discovery Cohort Measured by
Big Pharma Lab
Verification Cohort 1
N = 41 Matched
Verification Cohort 2
N = 50 All-Comers
Relative Protein Expression
bull Provides data on protein expression changes between two or more samples within the same experiment
bull Requires direct comparison of proteolytic peptides or marker ions from proteolytic peptides ndash Provides relative abundance ratios of the same
protein between different samples ndash Data does not extrapolate beyond the experiment
bull Experiments are isolated ldquoislands of informationrdquo
Absolute Protein Expression ndash lsquoomic scale
bull Calculation of the absolute amount of the proteins present (ng or fm) in a sample ndash Permits determination of stoichiometry of
proteins in macromolecular complexes ndash Permits extrapolation of results to different
experiments in different labs
bull These workers made the notable and unexpected observation ndash ldquothe average MS signal response for the three
most abundant peptides per mole of protein is constant within a coefficient of variation of less than 10rdquo
ndash ldquoGiven an internal standard this relationship is used to calculate a universal response factor (countsmole)rdquo
NOTE ndash ldquoabsoluterdquo is a controversial description
Intensity Distribution of Peptides from One Protein Response Per fmol for a Six Protein Mixture
Biological ldquoValidationrdquo by Determining Stoichometric Ratios
Absolute Quantification of Proteins by LCMSE
A Virtue of Parrallel MS Acquistion
Jeffrey C Silva Marc V Gorenstein Guo-Zhong Li Johannes PC Vissers Scott Geromanos Molecular amp Cellular Proteomics 5144-156 2006
Absolute Quantitation at the Protein Level - E coli lysate spiked with 4 exogenous proteins
Absolute Quantitation for Measurement of Fold-Changes E coli spiking Experiment
Quantitative proteomics reveals metabolic and pathogenic properties of Chlamydia trachomatis developmental forms Hector A Saka1 J Will Thompson2 Yi-Shan Chen1 Yadunanda Kumar13 Laura G Dubois2 M Arthur Moseley2 andRaphael H Valdivia1
Mol Microbiol 2011 December 82(5) 1185ndash1203 PMCID PMC3225693
Quantitative proteomics reveals metabolic and pathogenic properties of Chlamydia trachomatis developmental forms
Hector A Saka1 J Will Thompson2 Yi-Shan Chen1 Yadunanda Kumar13 Laura G Dubois2 M Arthur Moseley2 and Raphael H Valdivia1
C trachomatis is the most common bacterial STD and exhibits a biphasic development cycle ndash EB infectious RB non-infectious
Protein Identification Metrics (Swissprot Human NCBI C trachomatis 1 FDR)
EB (775)
RB (1120)
420 355 700
HUMAN (990 ~5)
CHLAMYDIA (485 55)
EB (349)
RB (851)
210 139 641 210 216 59
EB (426)
RB (269)
Mass spectrometry allows us to distinctly isolate the signal from Chlamydia versus Human gt54 of C trachomatis proteome
Global Strategy for Using Mass Spectrometry to Deal with Mixed Proteomes using UPLCUPLCMSMS
Calculate sum ng of Chlamydia proteins use this to normalize fmol values
EB CT842 80 plusmn 3 fmolug RB CT842 84 plusmn 19 fmolug
Calculate fmol of Each Protein Using Method of Silva and Geromanos
EB 339 Chlamydia Proteins CT842 200 plusmn 25 fmol
RB 181 Chlamydia Proteins CT842 47 plusmn 9 fmol
Remove Peptide Matches Shared Between Species
EB 14 Homologous Peptides RB 8 Homologous Peptides
Search Against Both Human and Chlamydia DB
EB 754 Human 3916 Chlamydia Peptides RB 4025 Human 1274 Chlamydia Peptides
Protein NameSample 1
(uncorrected)Sample 2
(uncorrected)Sample 1
(corrected)Sample 2
(corrected)Measured Ratio (uncorrected)
Measured Ratio (corrected) Theoretical Ratio
ALBU_BOVIN 217plusmn4 118plusmn35 561plusmn9 132plusmn39 18 43 40ADH1_YEAST 234plusmn6 260plusmn7 604plusmn7 291plusmn7 090 21 20ENO1_YEAST 50plusmn3 112plusmn7 129plusmn5 125plusmn7 050 10 20PYGM_RABIT 277plusmn05 105plusmn5 69plusmn3 117plusmn5 026 060 050E Coli Proteins (average) 109plusmn6 263plusmn17 281plusmn12 294plusmn19 041 10 10
RatiosQuantitation (fmolug)
Validation of Species-Specific Quantitation using a Model System
Sample 1 Sample 2Spiked E Coli Lysate 025 ug 05 ugMouse Brain Lysate 025 ug 0 ugTotal Column Load 05 ug 05 ug
Reproducibility of Protein Quantitation
Protein CV Distribution EB Protein CV Distribution RB
Species-Specific Correction Applied to Chlamydia Protein Quantitation
EB vs RB Quantitation (with Species-Specific Scaling) Select Proteins with Verification
Protein Classes and Relative Abundance in the Developmental Forms
- EBs are enriched in T3S-effectors and chaperones as well as in enzymes involved in glucose catabolism - RBs are enriched for protein synthesis and assembly components ATP generation and transport and nutrient import
Molecular Evidence of the Different Metabolic Properties of the two Developmental Stages
Proteomic results show the EB and RB proteomes are streamlined for their function - maximum infectivity for EB replicative capacity for RBs
Figure 1Fundamentals of isotope-dilution mass spectrometry for quantification (A) Amount of the native or endogenous peptide in the sample is quantified using the ratio of the mass spectrometric response to the endogenous peptide and the SIS peptide and the initial amount of the SIS peptide spiked into the sample (B) In SRM only specific product ions from collision-induced dissociation events are recorded The top panel illustrates the operations of an ion-trap mass spectrometer whereas the bottom panel illustrates the operations of a triple quadrupole mass spectrometer for SRM Note that operations in an ion-trap are sequential in time for a given population of injected ions whereas in a triple quadrupole each quadrupole specializes in carrying the three operations simultaneously on the ions that are continuously conveyed Parent ion mz product ion mz and elution-time criteria from SRM enable selectivity and sensitivity for the detection of specific peptides in complex mixtures from biological sources Recording multiple product ion trasitions as in multiple reaction monitoring can further increase the selectivity SIS Stable isotope-labeled standard SRM Selected reaction monitoring
A Simple Explanation of Selected Reaction Monitoring for Quantitative Analysis Mayya and Han Expert Rev Proteomics 3(6) 597-610 (2006)
(A) In the regular MRM mode of acquisition the mass spectrometer records product ion transitions intended from the SIS peptide and the endogenous peptide in alternate scans (B) The mass spectrometer can be instructed to record multiple product ion transitions from multiple SIS and endogenous peptide pairs and continue to do so in each acquisition cycle for the entire duration of chromatography This allows multiplexed quantification However the reduced sampling frequency can compromise sensitivity reproducibility and accuracy of quantification (C) The chromatographic duration can be subdivided into time-segments or slices wherein different endogenous peptides are quantified using corresponding acquisition cycles However the method is limited by the peak capacity of the online chromatographic method and requires highly reproducible elution times (D) It is practically difficult to achieve consistent elution times of peptides in complex mixtures on a routine basis A hybrid staggered multiplexingrsquo is an optimum strategy as it attempts to maximize the elution time-window for the peptides and also to minimize the number of MRMs in each acquisition cycle The peptide-pairs in each acquisition cycle are indicated for illustrating the staggeredrsquo nature of acquisition
Skyline Open Source Software for Targeted Method Development and Data Analysis
Fig 2 Calibration curves for quantifying heavy-labeled pure AAC and TNFα peptides The ion signals for different amounts of pure synthetic heavy peptides were measured using LCndashMS and used to determine the linear range of quantification on the linear ion trap instrument Duplicate analyses were performed for each amount of peptide injected Error bars show the range for each measurement
A major bottleneck for validation of new clinical diagnostics is the development of highly sensitive and specific assays for quantifying proteins We previously described a method stable isotope standards with capture by antipeptide antibodies wherein a specific tryptic peptide is selected as a stoichiometric representative of the protein from which it is cleaved is enriched from biological samples using immobilized antibodies and is quantitated using mass spectrometry against a spiked internal standard to yield a measure of protein concentration In this study we optimized a magnetic-bead-based platform amenable to high-throughput peptide capture and demonstrated that antibody capture followed by mass spectrometry can achieve ion signal enhancements on the order of 10(3) with precision (CVs lt10) and accuracy (relative error approximately 20) sufficient for quantifying biomarkers in the physiologically relevant ngmL range These methods are generally applicable to any protein or biological fluid of interest and hold great potential for providing a desperately needed bridging technology between biomarker discovery and clinical application
Anal Biochem 2007 Mar 1362(1)44-54 Epub 2006 Dec 20 Antibody-based enrichment of peptides on magnetic beads for mass-spectrometry-based quantification of serum biomarkers Whiteaker JR Zhao L Zhang HY Feng LC Piening BD Anderson L Paulovich AG Source Fred Hutchinson Cancer Research Center 1100 Fairview Avenue N PO Box 19024 Seattle WA 98109-1024 USA
Acknowledgments Duke University Proteomics Core Facility
httpwwwgenomedukeeducoresproteomics
Biostatistics Dr Joseph Lucas Funding NIH S10 grant Duke School of Medicine CTSA grant UL1RR024128
- Lecture 3Differential Expression Proteomics
- Quantitative Mass Spectrometry of Peptides and Proteins
- ldquoOld-Schoolrdquo Differential Expression Proteomics
- The First Mass Spec Based Differential Expression Proteomics
- Slide Number 5
- Slide Number 6
- Analytical Challenges Associated with Performing Quantitative Proteomics Using Chemical Isotopic Labeling
- Slide Number 8
- Metabolic Stable Isotope Coding
- Slide Number 10
- Slide Number 11
- Slide Number 12
- Slide Number 13
- Overview of Label Free Quantitation
- Slide Number 15
- Slide Number 16
- Slide Number 17
- Slide Number 18
- Slide Number 19
- Slide Number 20
- Label Free Intensity Plots differential expression visualization
- Cluster Analysis of Label Free Quantitation Datasets
- Differential Protein Expression
- Relative Protein Expression
- One Exemplar Biomarker Discovery amp Verification ProjectBiomarkers to Predict Outcomes of Hepatitis C Patient Treatment in Serum of Treatment Naive PatientsJeanette McCarthy Keyur Patel Joe Lucas and John McHutchison
- Cohort Selection and Placement in the Pipeline(Guided by an ldquoUnmet Clinical Needrdquo US HUPO 2009)
- Slide Number 27
- Slide Number 28
- Key Features of Metaprotein Expression Modeling Bayesian Factor Regression Model
- Remember A Metaprotein Modelhellip
- Discovery and Initial Verification of SVR-Prediction Using Unbiased Data
- Slide Number 32
- Relative Protein Expression
- Absolute Protein Expression ndash lsquoomic scale
- Slide Number 35
- Slide Number 36
- Absolute Quantitation at the Protein Level - E coli lysate spiked with 4 exogenous proteins
- Absolute Quantitation for Measurement of Fold-Changes E coli spiking Experiment
- Slide Number 39
- Quantitative proteomics reveals metabolic and pathogenicproperties of Chlamydia trachomatis developmental formsHector A Saka1 J Will Thompson2 Yi-Shan Chen1 Yadunanda Kumar13 Laura GDubois2 M Arthur Moseley2 and Raphael H Valdivia1
- Protein Identification Metrics(Swissprot Human NCBI C trachomatis 1 FDR)
- Global Strategy for Using Mass Spectrometry to Deal with Mixed Proteomes using UPLCUPLCMSMS
- Validation of Species-Specific Quantitationusing a Model System
- Reproducibility of Protein Quantitation
- Species-Specific Correction Applied to Chlamydia Protein Quantitation
- Protein Classes and Relative Abundance in the Developmental Forms
- Molecular Evidence of the Different Metabolic Properties of the two Developmental Stages
- Slide Number 48
- Slide Number 49
- Slide Number 50
- Skyline Open Source Software for Targeted Method Development and Data Analysis
- Slide Number 52
- Slide Number 53
- Slide Number 54
- Slide Number 55
- AcknowledgmentsDuke University Proteomics Core Facilityhttpwwwgenomedukeeducoresproteomics
-

Goshe and Smith Curr Op in Biotech (2003) 14101
Stable Isotope Labeling for Quantitative Proteomics - Lots of Options
Analytical Challenges Associated with Performing Quantitative Proteomics Using Chemical Isotopic Labeling
bull Bypassing gels avoids problems with membrane proteins other special cases
bull Sample loading issues contributing to poor dynamic range are reduced
bull Not all proteins contain targeted amino acid (tag dependent consideration)
bull Post-translational modifications can be missed (tag dependent)
bull Quantitation from LCMS relative intensities of isotope clusters
bull Qualitative Identification from LCMSMS peptide sequencing (MSMS)
bull Analytical challenge - very complex mixtures (30000+ peptidessample) are made more complex by isotope labeling (doubles number of analytes)
ndash pre-fractionate samples ndash Multidimensional analytical HPLC (capillary LCLCMSMS)
httpdocsappliedbiosystemscompebiodocs00113379pdf
Applied Biosystems iTRAQ reagents use isobaric tags
Multiple tags present with the same nominal mass in survey spectra Quantitation is done during the MSMS step simultaneously with peptide identification Only quantify peptides sequenced by MSMS - A subset of all peptides present
Label-free methods quantitate all species regardless of identification
Goshe and Smith Curr Op in Biotech (2003) 14101
Metabolic Stable Isotope Coding
SILAC generates a lot of data regarding 2 samples - Be aware of statistical limitations
Even when quantitative methods are used most of the time the focus is on function There is little attention to the details of quantitation
Such an approach is fundamentally flawed
Forget not the basic principals of quantitative analyses
ndash Replication QCs Validation
Rigorously use Quantitatively Reproducible Analytical Methods Forget not the basics of analytical chemistry
bull Highly reproducible chromatography is required
bull A high sampling rate across the chromatographic peak is required for accurate quantitation bullIdeally want 15-20 sampling points across chromatographic profile bullHighly reproducible chromatography is required for sample-to-sample comparisons
bull High resolution accurate mass (precursor amp products) tandem mass spectrometry technology needed
bull For quantitative selectivity (near isobaric cross-talk)
bull For accurate qualitative identifications 1 FPR at peptide level (Decoy DB Peptide Prophet)
bull No QCs = No Quantifiably Reliable Data
bull No Replication = No Quantifiably Reliable Data
bull No Common Standard = No Meaningful Comparison across Projects
Overview of Label Free Quantitation
LC Separation
Acquisition of MS Data
Import Raw Data Data Alignment amp Feature Extraction
Import Raw MSMS Data
Annotation amp PeptideProtein
Analysis
Statistical Analysis of Differences
Acquisition of Selected MSMS
Data Via Targeted Analysis
Peptide Identification
(Database Search Engine)
(courtesy Rosetta Biosoftware)
LC retention time
mas
s-to
-cha
rge
(mz
) rat
io
Gel-Free Label Free Proteomics High Resolution Accurate Mass 3D Peptide Mass Map
X and Y coordinates identify the peptide Y coordinate (mass-to charge ratio) is fixed to lt5 ppm error
X coordinate (LC Retention Time) has more variability (typically lt 6 seconds)
An isotope group of a peptide
bullIntensity (AUC) of SIC of peptide is the quantitative measure
bullMust be accurately measured across statistically significant sample cohort
Results of Data Alignment based on Accurate Mass and Retention Time
Raw Data
Aligned Data
111015 Features Aligned across 16 LCMS Analyses
of Cell Lines
How to QC this vast Amount of Data
Aligned Data Combined by
Biological Condition
QC of Individual Isotope Groups pairwise t-tests of significance of peak area
measurement
Column Condition QC1 Sample 1 Sample 2 Sample 3 Sample 4 Sample 5 Sample 6 Sample 7 Sample 8 Sample 9 Sample 10 QC 2 Sample 11 Sample 12 Sample 13
Rigorously use Quantitatively Reproducible Analytical Methods Daily QC Checks of Data Acquisition Precision and Reproducibility
Instrument Performance Checks Day 1(+) QCs Column Conditioning Preliminary database searches
Day 2 Data Collection Day 3 Data Collection
QC X-1 Sample X-5
Sample X-4
Sample X-3
Sample X-2
Sample X-1
Sample X QC X helliphelliphellip
Day X Data Collection
bull Want to maximize biological powering - analyzing as many samples as possible
bull Must use robust LC-MS platform and singlicate analysis of each sample
bull Data QC is performed by daily injections of a ldquostandardrdquo of the same biological sample (pool)
bull Aliquots of same pool used in all projects ndash QC tracking across projects
Quantitatively Reproducible Analytical Methods Forget not the basics of analytical chemistry
Assessing Quantitative Reproducibility with Daily QCs
bull Analytical Variability ~ 35000 peptides
bull Daily QC Sample (pool of QC plasma sample)
bull Analytical + Biological Variability bull Patient Samples
25 CV Plasma Peptides
Note X- Axis Scale Differences QC Samples 0 to 170 CV Biological Samples 0 to 500 CV
125 CV Plasma Peptides
~ 40 peptides CV lt 10
~ 70 peptides CV lt 20
~ 90 peptides CV lt 25
~ 2 peptides
CV lt 25
QC Metric 1 = CV (Anal + Biol Variability) - CV (Anal Variability)
- Alternating cycles (1 sec each) of precursor product scans provides high reproducibility via a high sampling rate across chromatographic peak
- Major attribute of MSE
VVGLSTLPEYIEK 128 CV across all samples
Rigorously use Quantitatively Reproducible Analytical Methods Assessing Quantitative Reproducibility at the Peptide Level with QCs
Reproducibility of Internal Standard Spiked into Each Sample
ADH1_YEAST (50fmolug) Peptide Abundance across 60 patient clinical cohort
DDA Data Qual only
Label Free Intensity Plots differential expression visualization
Cluster Analysis of Label Free Quantitation Datasets
bull Cluster Analyses ndash Examine large data sets
and determine if items behave similarly
ndash Data belonging to the same cluster are similar at some level
ndash Data sets in different clusters are less similar at some level
ndash Make a preliminary assessment of possible relationships between clusters and identify data sets for further investigation
Proteins
Trea
tmen
t Gro
ups
Differential Protein Expression
bull Differential protein expression studies are key for ndash Identifying biomarkers of disease and treatment response ndash Elucidating biological pathways ndash Identifying and validating protein drug targets
bull Essentially all differential proteomics studies have
studied relative protein expression ndash Isotope labeling methods ndash Label free methods
bull Differential proteomic expression studies based on
ldquoabsoluterdquo quantitation have yet to be fully exploited
Relative Protein Expression
bull Provides data on protein expression changes between two or more samples within the same experiment
bull Requires direct comparison of proteolytic peptides or marker ions from proteolytic peptides ndash Provides relative abundance ratios of the same
protein between different samples ndash Data does not easily extrapolate beyond the
experiment bull Experiments are isolated ldquoislands of informationrdquo
One Exemplar Biomarker Discovery amp Verification Project
Biomarkers to Predict Outcomes of Hepatitis C Patient Treatment in Serum of Treatment Naive Patients
Jeanette McCarthy Keyur Patel Joe Lucas and John McHutchison
Spontaneous clearance (~25)
20 cirrhosis
3-5 cancer
Chronic infection
Eligible for Treatment
Responders Non-responders (gt50)
Hepatic Fibrosis Steatosis Insulin resistance Dyslipidemia
Increased risk of diabetes
Unknown consequences
Cohort Selection and Placement in the Pipeline (Guided by an ldquoUnmet Clinical Needrdquo US HUPO 2009)
First Discover in Matched Cohorts to Focus on the Clinical Variable of Interest
Second Verify in All-Comers Trials to Test Robustness
Number of Analytes
Number of Samples
10000s
10s
100-1000
100 -1000
10s
1000s
Biomarker Validation
Biomarker Discovery
Biomarker Verification
Duke Hepatology Biorepository - 3169 patients Discovery Cohort - small discovery experiment - well matched cohort from Biorepository - n = 55 patients - lsquoomic LCMSMS
Biomarker Discovery Paradigm Challenge Hepatitis C Cohorts ndash all by UPLCQ-Tof
Open Platform LCMS LCMSMS (MRM) LCMSMS (MRM)
Verification Cohort 2 - pediatric patients - ldquoall-comersrdquo trial - N = 50 patients
Verification Cohort 1 - well matched cohort from Biorepository - n = 41 patients
Verification Validation Cohort 3 - ldquoall-comersrdquo trial (Australia) - N = 243 patients
Insure Professional Use of Statistical Tools Suitable for High Dimensional Data Analyses
Sparse Latent Factor Regression - Bayesian Factor Regression Modeling
35000 Isotope Groups Predictive Factor ldquoMetaproteinsrdquo
Factor Score ldquoExpression Valuerdquo
Statistical Analysis Joe Lucas PhD
Duke IGSP
bull Regression - Leads directly to prediction bull Sparsity ndash Most peptides are irrelevant for prediction bull Latent Factors ndash let data determine important relationships bull Resulting model for prediction
bull Initial Metaprotein Model - 650 Isotope Groups
Pastor Thomas Bayes
Key Features of Metaprotein Expression Modeling Bayesian Factor Regression Model
bull Allows correction of large scale correlational structure between proteins arising from technical rather than biological variability
bull Casts a ldquowide netrdquo initially for predictive peptides
bull Models both identified and unidentified peptides
bull Utilizes identifications while allowing for incorrect identifications
bull Recognizes that some peptides from a protein may be post-translationally modified and the expression of these peptides may not be representative of the protein as a whole
bull Can be used in the creation of predictive models based on multiple proteins
capturing ldquopathwayrdquo expression
Joe Lucas et al ldquoMetaprotein Expression Modeling for Label-Free Quantitative Proteomicsrdquo J Proteome Res in review Oral presentation 2011 RECOMB Satellite Conference on Computational Proteomics
Remember A Metaprotein Modelhellip bull A Metaprotein is a group of peptides which exhibit
a similar expression pattern across the cohort(s)
bull A Metaprotein may contain ndash All peptides from one protein ndash A subset of peptides from a protein ndash A collection of peptides from multiple proteins
bull Model constructed with intensity measurements
aggregated at the isotope group level ndash Identified or unidentified peptides
Metaprotein expression modeling for label-free quantitative proteomics Lucas JE Thompson JW Dubois LG McCarthy J Tillmann H Thompson A Shire N Hendrickson R Dieguez F Goldman P Schwarz K Patel K McHutchison J Moseley MA BMC Bioinformatics 2012 May 413(1)74
Discovery and Initial Verification of SVR-Prediction Using Unbiased Data
Discovery Data Build Model
Use Model to Predict SVR (Blinded)
Patel et al Hepatology 2011 Jun53(6)1809-1818
Reproducibility of Metaprotein Biosignatures
bull Build predictive model with first three cohorts bull Predict NR SVR in ldquoBig Pharmardquo measured data
ndash different LCMSMS (LTQ-Orbi) system in different lab ndash Metaprotein model maintained consistent results
Discovery Cohort N = 55
Matched
Discovery Cohort Measured by
Big Pharma Lab
Verification Cohort 1
N = 41 Matched
Verification Cohort 2
N = 50 All-Comers
Relative Protein Expression
bull Provides data on protein expression changes between two or more samples within the same experiment
bull Requires direct comparison of proteolytic peptides or marker ions from proteolytic peptides ndash Provides relative abundance ratios of the same
protein between different samples ndash Data does not extrapolate beyond the experiment
bull Experiments are isolated ldquoislands of informationrdquo
Absolute Protein Expression ndash lsquoomic scale
bull Calculation of the absolute amount of the proteins present (ng or fm) in a sample ndash Permits determination of stoichiometry of
proteins in macromolecular complexes ndash Permits extrapolation of results to different
experiments in different labs
bull These workers made the notable and unexpected observation ndash ldquothe average MS signal response for the three
most abundant peptides per mole of protein is constant within a coefficient of variation of less than 10rdquo
ndash ldquoGiven an internal standard this relationship is used to calculate a universal response factor (countsmole)rdquo
NOTE ndash ldquoabsoluterdquo is a controversial description
Intensity Distribution of Peptides from One Protein Response Per fmol for a Six Protein Mixture
Biological ldquoValidationrdquo by Determining Stoichometric Ratios
Absolute Quantification of Proteins by LCMSE
A Virtue of Parrallel MS Acquistion
Jeffrey C Silva Marc V Gorenstein Guo-Zhong Li Johannes PC Vissers Scott Geromanos Molecular amp Cellular Proteomics 5144-156 2006
Absolute Quantitation at the Protein Level - E coli lysate spiked with 4 exogenous proteins
Absolute Quantitation for Measurement of Fold-Changes E coli spiking Experiment
Quantitative proteomics reveals metabolic and pathogenic properties of Chlamydia trachomatis developmental forms Hector A Saka1 J Will Thompson2 Yi-Shan Chen1 Yadunanda Kumar13 Laura G Dubois2 M Arthur Moseley2 andRaphael H Valdivia1
Mol Microbiol 2011 December 82(5) 1185ndash1203 PMCID PMC3225693
Quantitative proteomics reveals metabolic and pathogenic properties of Chlamydia trachomatis developmental forms
Hector A Saka1 J Will Thompson2 Yi-Shan Chen1 Yadunanda Kumar13 Laura G Dubois2 M Arthur Moseley2 and Raphael H Valdivia1
C trachomatis is the most common bacterial STD and exhibits a biphasic development cycle ndash EB infectious RB non-infectious
Protein Identification Metrics (Swissprot Human NCBI C trachomatis 1 FDR)
EB (775)
RB (1120)
420 355 700
HUMAN (990 ~5)
CHLAMYDIA (485 55)
EB (349)
RB (851)
210 139 641 210 216 59
EB (426)
RB (269)
Mass spectrometry allows us to distinctly isolate the signal from Chlamydia versus Human gt54 of C trachomatis proteome
Global Strategy for Using Mass Spectrometry to Deal with Mixed Proteomes using UPLCUPLCMSMS
Calculate sum ng of Chlamydia proteins use this to normalize fmol values
EB CT842 80 plusmn 3 fmolug RB CT842 84 plusmn 19 fmolug
Calculate fmol of Each Protein Using Method of Silva and Geromanos
EB 339 Chlamydia Proteins CT842 200 plusmn 25 fmol
RB 181 Chlamydia Proteins CT842 47 plusmn 9 fmol
Remove Peptide Matches Shared Between Species
EB 14 Homologous Peptides RB 8 Homologous Peptides
Search Against Both Human and Chlamydia DB
EB 754 Human 3916 Chlamydia Peptides RB 4025 Human 1274 Chlamydia Peptides
Protein NameSample 1
(uncorrected)Sample 2
(uncorrected)Sample 1
(corrected)Sample 2
(corrected)Measured Ratio (uncorrected)
Measured Ratio (corrected) Theoretical Ratio
ALBU_BOVIN 217plusmn4 118plusmn35 561plusmn9 132plusmn39 18 43 40ADH1_YEAST 234plusmn6 260plusmn7 604plusmn7 291plusmn7 090 21 20ENO1_YEAST 50plusmn3 112plusmn7 129plusmn5 125plusmn7 050 10 20PYGM_RABIT 277plusmn05 105plusmn5 69plusmn3 117plusmn5 026 060 050E Coli Proteins (average) 109plusmn6 263plusmn17 281plusmn12 294plusmn19 041 10 10
RatiosQuantitation (fmolug)
Validation of Species-Specific Quantitation using a Model System
Sample 1 Sample 2Spiked E Coli Lysate 025 ug 05 ugMouse Brain Lysate 025 ug 0 ugTotal Column Load 05 ug 05 ug
Reproducibility of Protein Quantitation
Protein CV Distribution EB Protein CV Distribution RB
Species-Specific Correction Applied to Chlamydia Protein Quantitation
EB vs RB Quantitation (with Species-Specific Scaling) Select Proteins with Verification
Protein Classes and Relative Abundance in the Developmental Forms
- EBs are enriched in T3S-effectors and chaperones as well as in enzymes involved in glucose catabolism - RBs are enriched for protein synthesis and assembly components ATP generation and transport and nutrient import
Molecular Evidence of the Different Metabolic Properties of the two Developmental Stages
Proteomic results show the EB and RB proteomes are streamlined for their function - maximum infectivity for EB replicative capacity for RBs
Figure 1Fundamentals of isotope-dilution mass spectrometry for quantification (A) Amount of the native or endogenous peptide in the sample is quantified using the ratio of the mass spectrometric response to the endogenous peptide and the SIS peptide and the initial amount of the SIS peptide spiked into the sample (B) In SRM only specific product ions from collision-induced dissociation events are recorded The top panel illustrates the operations of an ion-trap mass spectrometer whereas the bottom panel illustrates the operations of a triple quadrupole mass spectrometer for SRM Note that operations in an ion-trap are sequential in time for a given population of injected ions whereas in a triple quadrupole each quadrupole specializes in carrying the three operations simultaneously on the ions that are continuously conveyed Parent ion mz product ion mz and elution-time criteria from SRM enable selectivity and sensitivity for the detection of specific peptides in complex mixtures from biological sources Recording multiple product ion trasitions as in multiple reaction monitoring can further increase the selectivity SIS Stable isotope-labeled standard SRM Selected reaction monitoring
A Simple Explanation of Selected Reaction Monitoring for Quantitative Analysis Mayya and Han Expert Rev Proteomics 3(6) 597-610 (2006)
(A) In the regular MRM mode of acquisition the mass spectrometer records product ion transitions intended from the SIS peptide and the endogenous peptide in alternate scans (B) The mass spectrometer can be instructed to record multiple product ion transitions from multiple SIS and endogenous peptide pairs and continue to do so in each acquisition cycle for the entire duration of chromatography This allows multiplexed quantification However the reduced sampling frequency can compromise sensitivity reproducibility and accuracy of quantification (C) The chromatographic duration can be subdivided into time-segments or slices wherein different endogenous peptides are quantified using corresponding acquisition cycles However the method is limited by the peak capacity of the online chromatographic method and requires highly reproducible elution times (D) It is practically difficult to achieve consistent elution times of peptides in complex mixtures on a routine basis A hybrid staggered multiplexingrsquo is an optimum strategy as it attempts to maximize the elution time-window for the peptides and also to minimize the number of MRMs in each acquisition cycle The peptide-pairs in each acquisition cycle are indicated for illustrating the staggeredrsquo nature of acquisition
Skyline Open Source Software for Targeted Method Development and Data Analysis
Fig 2 Calibration curves for quantifying heavy-labeled pure AAC and TNFα peptides The ion signals for different amounts of pure synthetic heavy peptides were measured using LCndashMS and used to determine the linear range of quantification on the linear ion trap instrument Duplicate analyses were performed for each amount of peptide injected Error bars show the range for each measurement
A major bottleneck for validation of new clinical diagnostics is the development of highly sensitive and specific assays for quantifying proteins We previously described a method stable isotope standards with capture by antipeptide antibodies wherein a specific tryptic peptide is selected as a stoichiometric representative of the protein from which it is cleaved is enriched from biological samples using immobilized antibodies and is quantitated using mass spectrometry against a spiked internal standard to yield a measure of protein concentration In this study we optimized a magnetic-bead-based platform amenable to high-throughput peptide capture and demonstrated that antibody capture followed by mass spectrometry can achieve ion signal enhancements on the order of 10(3) with precision (CVs lt10) and accuracy (relative error approximately 20) sufficient for quantifying biomarkers in the physiologically relevant ngmL range These methods are generally applicable to any protein or biological fluid of interest and hold great potential for providing a desperately needed bridging technology between biomarker discovery and clinical application
Anal Biochem 2007 Mar 1362(1)44-54 Epub 2006 Dec 20 Antibody-based enrichment of peptides on magnetic beads for mass-spectrometry-based quantification of serum biomarkers Whiteaker JR Zhao L Zhang HY Feng LC Piening BD Anderson L Paulovich AG Source Fred Hutchinson Cancer Research Center 1100 Fairview Avenue N PO Box 19024 Seattle WA 98109-1024 USA
Acknowledgments Duke University Proteomics Core Facility
httpwwwgenomedukeeducoresproteomics
Biostatistics Dr Joseph Lucas Funding NIH S10 grant Duke School of Medicine CTSA grant UL1RR024128
- Lecture 3Differential Expression Proteomics
- Quantitative Mass Spectrometry of Peptides and Proteins
- ldquoOld-Schoolrdquo Differential Expression Proteomics
- The First Mass Spec Based Differential Expression Proteomics
- Slide Number 5
- Slide Number 6
- Analytical Challenges Associated with Performing Quantitative Proteomics Using Chemical Isotopic Labeling
- Slide Number 8
- Metabolic Stable Isotope Coding
- Slide Number 10
- Slide Number 11
- Slide Number 12
- Slide Number 13
- Overview of Label Free Quantitation
- Slide Number 15
- Slide Number 16
- Slide Number 17
- Slide Number 18
- Slide Number 19
- Slide Number 20
- Label Free Intensity Plots differential expression visualization
- Cluster Analysis of Label Free Quantitation Datasets
- Differential Protein Expression
- Relative Protein Expression
- One Exemplar Biomarker Discovery amp Verification ProjectBiomarkers to Predict Outcomes of Hepatitis C Patient Treatment in Serum of Treatment Naive PatientsJeanette McCarthy Keyur Patel Joe Lucas and John McHutchison
- Cohort Selection and Placement in the Pipeline(Guided by an ldquoUnmet Clinical Needrdquo US HUPO 2009)
- Slide Number 27
- Slide Number 28
- Key Features of Metaprotein Expression Modeling Bayesian Factor Regression Model
- Remember A Metaprotein Modelhellip
- Discovery and Initial Verification of SVR-Prediction Using Unbiased Data
- Slide Number 32
- Relative Protein Expression
- Absolute Protein Expression ndash lsquoomic scale
- Slide Number 35
- Slide Number 36
- Absolute Quantitation at the Protein Level - E coli lysate spiked with 4 exogenous proteins
- Absolute Quantitation for Measurement of Fold-Changes E coli spiking Experiment
- Slide Number 39
- Quantitative proteomics reveals metabolic and pathogenicproperties of Chlamydia trachomatis developmental formsHector A Saka1 J Will Thompson2 Yi-Shan Chen1 Yadunanda Kumar13 Laura GDubois2 M Arthur Moseley2 and Raphael H Valdivia1
- Protein Identification Metrics(Swissprot Human NCBI C trachomatis 1 FDR)
- Global Strategy for Using Mass Spectrometry to Deal with Mixed Proteomes using UPLCUPLCMSMS
- Validation of Species-Specific Quantitationusing a Model System
- Reproducibility of Protein Quantitation
- Species-Specific Correction Applied to Chlamydia Protein Quantitation
- Protein Classes and Relative Abundance in the Developmental Forms
- Molecular Evidence of the Different Metabolic Properties of the two Developmental Stages
- Slide Number 48
- Slide Number 49
- Slide Number 50
- Skyline Open Source Software for Targeted Method Development and Data Analysis
- Slide Number 52
- Slide Number 53
- Slide Number 54
- Slide Number 55
- AcknowledgmentsDuke University Proteomics Core Facilityhttpwwwgenomedukeeducoresproteomics
-
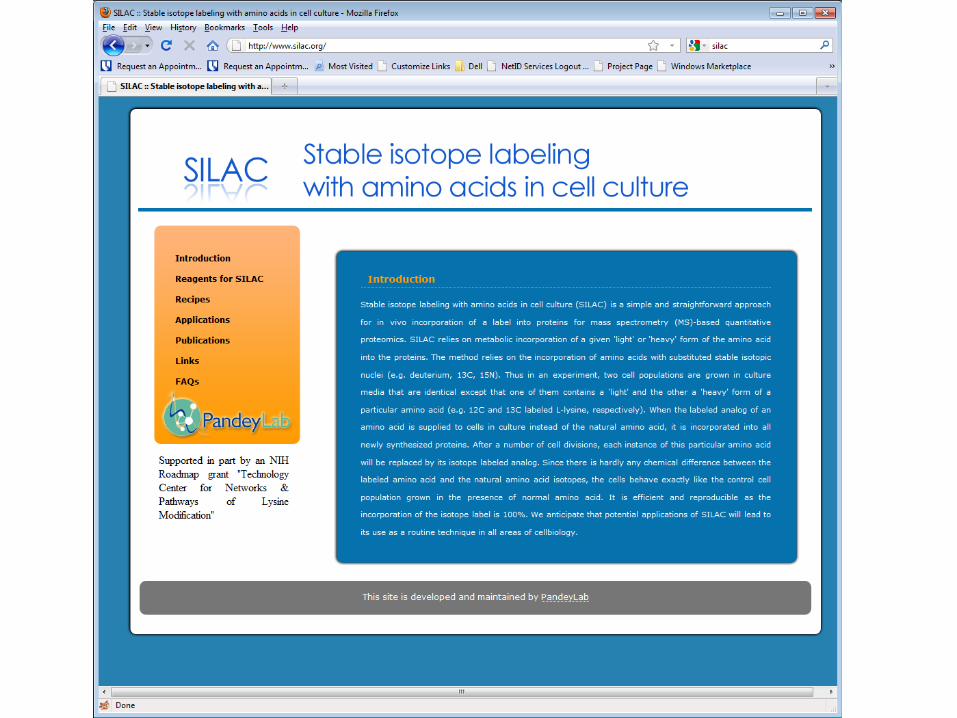
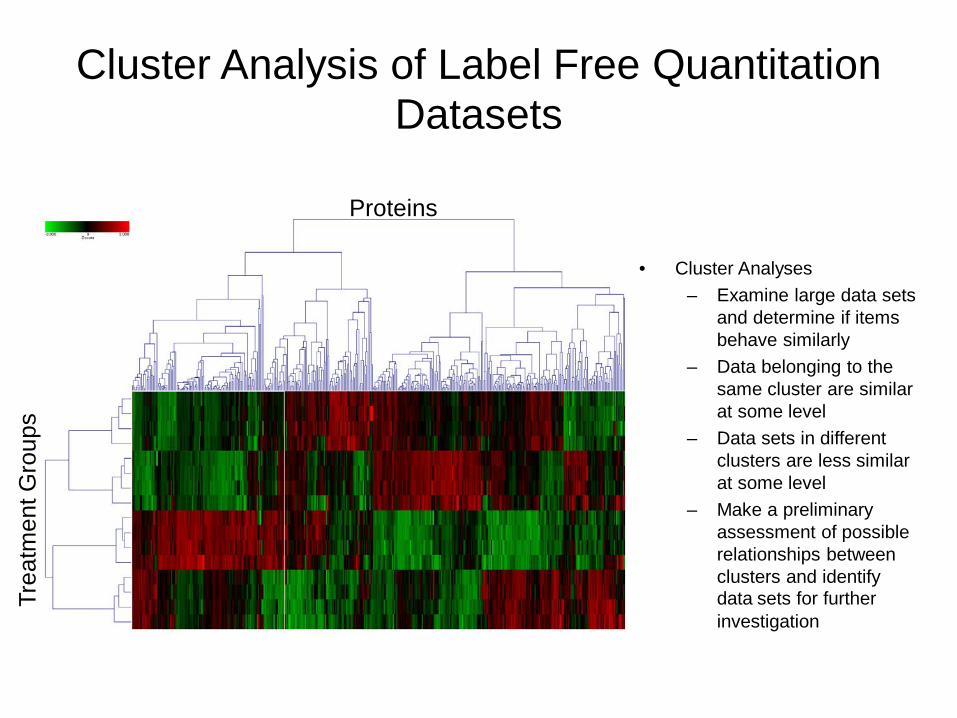
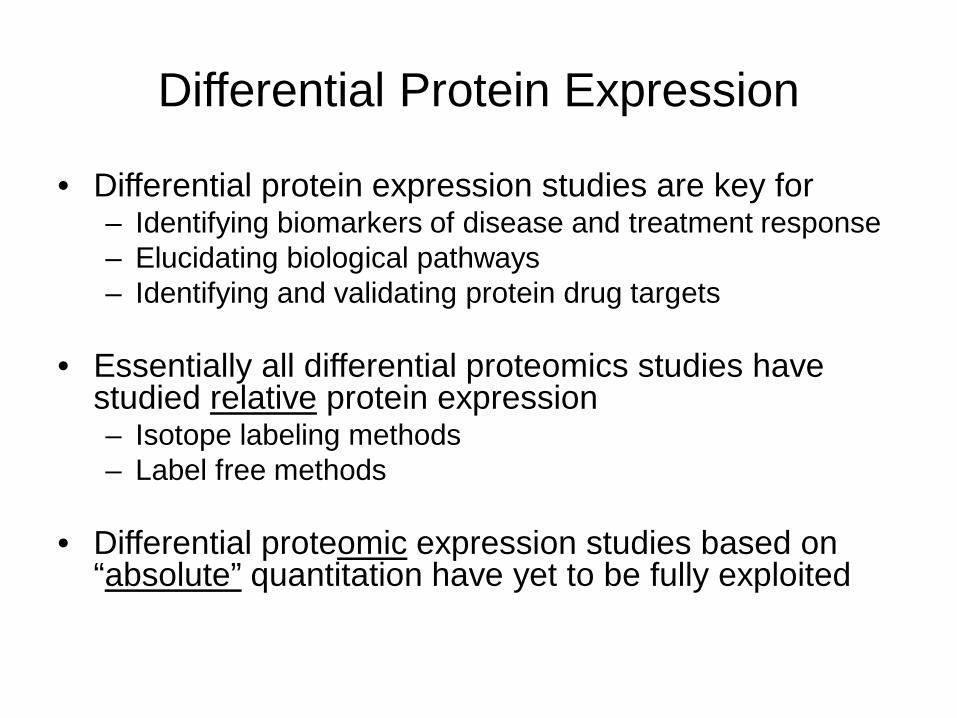
Relative Protein Expression
bull Provides data on protein expression changes between two or more samples within the same experiment
bull Requires direct comparison of proteolytic peptides or marker ions from proteolytic peptides ndash Provides relative abundance ratios of the same
protein between different samples ndash Data does not easily extrapolate beyond the
experiment bull Experiments are isolated ldquoislands of informationrdquo
One Exemplar Biomarker Discovery amp Verification Project
Biomarkers to Predict Outcomes of Hepatitis C Patient Treatment in Serum of Treatment Naive Patients
Jeanette McCarthy Keyur Patel Joe Lucas and John McHutchison
Spontaneous clearance (~25)
20 cirrhosis
3-5 cancer
Chronic infection
Eligible for Treatment
Responders Non-responders (gt50)
Hepatic Fibrosis Steatosis Insulin resistance Dyslipidemia
Increased risk of diabetes
Unknown consequences
Cohort Selection and Placement in the Pipeline (Guided by an ldquoUnmet Clinical Needrdquo US HUPO 2009)
First Discover in Matched Cohorts to Focus on the Clinical Variable of Interest
Second Verify in All-Comers Trials to Test Robustness
Number of Analytes
Number of Samples
10000s
10s
100-1000
100 -1000
10s
1000s
Biomarker Validation
Biomarker Discovery
Biomarker Verification
Duke Hepatology Biorepository - 3169 patients Discovery Cohort - small discovery experiment - well matched cohort from Biorepository - n = 55 patients - lsquoomic LCMSMS
Biomarker Discovery Paradigm Challenge Hepatitis C Cohorts ndash all by UPLCQ-Tof
Open Platform LCMS LCMSMS (MRM) LCMSMS (MRM)
Verification Cohort 2 - pediatric patients - ldquoall-comersrdquo trial - N = 50 patients
Verification Cohort 1 - well matched cohort from Biorepository - n = 41 patients
Verification Validation Cohort 3 - ldquoall-comersrdquo trial (Australia) - N = 243 patients
Insure Professional Use of Statistical Tools Suitable for High Dimensional Data Analyses
Sparse Latent Factor Regression - Bayesian Factor Regression Modeling
35000 Isotope Groups Predictive Factor ldquoMetaproteinsrdquo
Factor Score ldquoExpression Valuerdquo
Statistical Analysis Joe Lucas PhD
Duke IGSP
bull Regression - Leads directly to prediction bull Sparsity ndash Most peptides are irrelevant for prediction bull Latent Factors ndash let data determine important relationships bull Resulting model for prediction
bull Initial Metaprotein Model - 650 Isotope Groups
Pastor Thomas Bayes
Key Features of Metaprotein Expression Modeling Bayesian Factor Regression Model
bull Allows correction of large scale correlational structure between proteins arising from technical rather than biological variability
bull Casts a ldquowide netrdquo initially for predictive peptides
bull Models both identified and unidentified peptides
bull Utilizes identifications while allowing for incorrect identifications
bull Recognizes that some peptides from a protein may be post-translationally modified and the expression of these peptides may not be representative of the protein as a whole
bull Can be used in the creation of predictive models based on multiple proteins
capturing ldquopathwayrdquo expression
Joe Lucas et al ldquoMetaprotein Expression Modeling for Label-Free Quantitative Proteomicsrdquo J Proteome Res in review Oral presentation 2011 RECOMB Satellite Conference on Computational Proteomics
Remember A Metaprotein Modelhellip bull A Metaprotein is a group of peptides which exhibit
a similar expression pattern across the cohort(s)
bull A Metaprotein may contain ndash All peptides from one protein ndash A subset of peptides from a protein ndash A collection of peptides from multiple proteins
bull Model constructed with intensity measurements
aggregated at the isotope group level ndash Identified or unidentified peptides
Metaprotein expression modeling for label-free quantitative proteomics Lucas JE Thompson JW Dubois LG McCarthy J Tillmann H Thompson A Shire N Hendrickson R Dieguez F Goldman P Schwarz K Patel K McHutchison J Moseley MA BMC Bioinformatics 2012 May 413(1)74
Discovery and Initial Verification of SVR-Prediction Using Unbiased Data
Discovery Data Build Model
Use Model to Predict SVR (Blinded)
Patel et al Hepatology 2011 Jun53(6)1809-1818
Reproducibility of Metaprotein Biosignatures
bull Build predictive model with first three cohorts bull Predict NR SVR in ldquoBig Pharmardquo measured data
ndash different LCMSMS (LTQ-Orbi) system in different lab ndash Metaprotein model maintained consistent results
Discovery Cohort N = 55
Matched
Discovery Cohort Measured by
Big Pharma Lab
Verification Cohort 1
N = 41 Matched
Verification Cohort 2
N = 50 All-Comers
Relative Protein Expression
bull Provides data on protein expression changes between two or more samples within the same experiment
bull Requires direct comparison of proteolytic peptides or marker ions from proteolytic peptides ndash Provides relative abundance ratios of the same
protein between different samples ndash Data does not extrapolate beyond the experiment
bull Experiments are isolated ldquoislands of informationrdquo
Absolute Protein Expression ndash lsquoomic scale
bull Calculation of the absolute amount of the proteins present (ng or fm) in a sample ndash Permits determination of stoichiometry of
proteins in macromolecular complexes ndash Permits extrapolation of results to different
experiments in different labs
bull These workers made the notable and unexpected observation ndash ldquothe average MS signal response for the three
most abundant peptides per mole of protein is constant within a coefficient of variation of less than 10rdquo
ndash ldquoGiven an internal standard this relationship is used to calculate a universal response factor (countsmole)rdquo
NOTE ndash ldquoabsoluterdquo is a controversial description
Intensity Distribution of Peptides from One Protein Response Per fmol for a Six Protein Mixture
Biological ldquoValidationrdquo by Determining Stoichometric Ratios
Absolute Quantification of Proteins by LCMSE
A Virtue of Parrallel MS Acquistion
Jeffrey C Silva Marc V Gorenstein Guo-Zhong Li Johannes PC Vissers Scott Geromanos Molecular amp Cellular Proteomics 5144-156 2006
Absolute Quantitation at the Protein Level - E coli lysate spiked with 4 exogenous proteins
Absolute Quantitation for Measurement of Fold-Changes E coli spiking Experiment
Quantitative proteomics reveals metabolic and pathogenic properties of Chlamydia trachomatis developmental forms Hector A Saka1 J Will Thompson2 Yi-Shan Chen1 Yadunanda Kumar13 Laura G Dubois2 M Arthur Moseley2 andRaphael H Valdivia1
Mol Microbiol 2011 December 82(5) 1185ndash1203 PMCID PMC3225693
Quantitative proteomics reveals metabolic and pathogenic properties of Chlamydia trachomatis developmental forms
Hector A Saka1 J Will Thompson2 Yi-Shan Chen1 Yadunanda Kumar13 Laura G Dubois2 M Arthur Moseley2 and Raphael H Valdivia1
C trachomatis is the most common bacterial STD and exhibits a biphasic development cycle ndash EB infectious RB non-infectious
Protein Identification Metrics (Swissprot Human NCBI C trachomatis 1 FDR)
EB (775)
RB (1120)
420 355 700
HUMAN (990 ~5)
CHLAMYDIA (485 55)
EB (349)
RB (851)
210 139 641 210 216 59
EB (426)
RB (269)
Mass spectrometry allows us to distinctly isolate the signal from Chlamydia versus Human gt54 of C trachomatis proteome
Global Strategy for Using Mass Spectrometry to Deal with Mixed Proteomes using UPLCUPLCMSMS
Calculate sum ng of Chlamydia proteins use this to normalize fmol values
EB CT842 80 plusmn 3 fmolug RB CT842 84 plusmn 19 fmolug
Calculate fmol of Each Protein Using Method of Silva and Geromanos
EB 339 Chlamydia Proteins CT842 200 plusmn 25 fmol
RB 181 Chlamydia Proteins CT842 47 plusmn 9 fmol
Remove Peptide Matches Shared Between Species
EB 14 Homologous Peptides RB 8 Homologous Peptides
Search Against Both Human and Chlamydia DB
EB 754 Human 3916 Chlamydia Peptides RB 4025 Human 1274 Chlamydia Peptides
Protein NameSample 1
(uncorrected)Sample 2
(uncorrected)Sample 1
(corrected)Sample 2
(corrected)Measured Ratio (uncorrected)
Measured Ratio (corrected) Theoretical Ratio
ALBU_BOVIN 217plusmn4 118plusmn35 561plusmn9 132plusmn39 18 43 40ADH1_YEAST 234plusmn6 260plusmn7 604plusmn7 291plusmn7 090 21 20ENO1_YEAST 50plusmn3 112plusmn7 129plusmn5 125plusmn7 050 10 20PYGM_RABIT 277plusmn05 105plusmn5 69plusmn3 117plusmn5 026 060 050E Coli Proteins (average) 109plusmn6 263plusmn17 281plusmn12 294plusmn19 041 10 10
RatiosQuantitation (fmolug)
Validation of Species-Specific Quantitation using a Model System
Sample 1 Sample 2Spiked E Coli Lysate 025 ug 05 ugMouse Brain Lysate 025 ug 0 ugTotal Column Load 05 ug 05 ug
Reproducibility of Protein Quantitation
Protein CV Distribution EB Protein CV Distribution RB
Species-Specific Correction Applied to Chlamydia Protein Quantitation
EB vs RB Quantitation (with Species-Specific Scaling) Select Proteins with Verification
Protein Classes and Relative Abundance in the Developmental Forms
- EBs are enriched in T3S-effectors and chaperones as well as in enzymes involved in glucose catabolism - RBs are enriched for protein synthesis and assembly components ATP generation and transport and nutrient import
Molecular Evidence of the Different Metabolic Properties of the two Developmental Stages
Proteomic results show the EB and RB proteomes are streamlined for their function - maximum infectivity for EB replicative capacity for RBs
Figure 1Fundamentals of isotope-dilution mass spectrometry for quantification (A) Amount of the native or endogenous peptide in the sample is quantified using the ratio of the mass spectrometric response to the endogenous peptide and the SIS peptide and the initial amount of the SIS peptide spiked into the sample (B) In SRM only specific product ions from collision-induced dissociation events are recorded The top panel illustrates the operations of an ion-trap mass spectrometer whereas the bottom panel illustrates the operations of a triple quadrupole mass spectrometer for SRM Note that operations in an ion-trap are sequential in time for a given population of injected ions whereas in a triple quadrupole each quadrupole specializes in carrying the three operations simultaneously on the ions that are continuously conveyed Parent ion mz product ion mz and elution-time criteria from SRM enable selectivity and sensitivity for the detection of specific peptides in complex mixtures from biological sources Recording multiple product ion trasitions as in multiple reaction monitoring can further increase the selectivity SIS Stable isotope-labeled standard SRM Selected reaction monitoring
A Simple Explanation of Selected Reaction Monitoring for Quantitative Analysis Mayya and Han Expert Rev Proteomics 3(6) 597-610 (2006)
(A) In the regular MRM mode of acquisition the mass spectrometer records product ion transitions intended from the SIS peptide and the endogenous peptide in alternate scans (B) The mass spectrometer can be instructed to record multiple product ion transitions from multiple SIS and endogenous peptide pairs and continue to do so in each acquisition cycle for the entire duration of chromatography This allows multiplexed quantification However the reduced sampling frequency can compromise sensitivity reproducibility and accuracy of quantification (C) The chromatographic duration can be subdivided into time-segments or slices wherein different endogenous peptides are quantified using corresponding acquisition cycles However the method is limited by the peak capacity of the online chromatographic method and requires highly reproducible elution times (D) It is practically difficult to achieve consistent elution times of peptides in complex mixtures on a routine basis A hybrid staggered multiplexingrsquo is an optimum strategy as it attempts to maximize the elution time-window for the peptides and also to minimize the number of MRMs in each acquisition cycle The peptide-pairs in each acquisition cycle are indicated for illustrating the staggeredrsquo nature of acquisition
Skyline Open Source Software for Targeted Method Development and Data Analysis
Fig 2 Calibration curves for quantifying heavy-labeled pure AAC and TNFα peptides The ion signals for different amounts of pure synthetic heavy peptides were measured using LCndashMS and used to determine the linear range of quantification on the linear ion trap instrument Duplicate analyses were performed for each amount of peptide injected Error bars show the range for each measurement
A major bottleneck for validation of new clinical diagnostics is the development of highly sensitive and specific assays for quantifying proteins We previously described a method stable isotope standards with capture by antipeptide antibodies wherein a specific tryptic peptide is selected as a stoichiometric representative of the protein from which it is cleaved is enriched from biological samples using immobilized antibodies and is quantitated using mass spectrometry against a spiked internal standard to yield a measure of protein concentration In this study we optimized a magnetic-bead-based platform amenable to high-throughput peptide capture and demonstrated that antibody capture followed by mass spectrometry can achieve ion signal enhancements on the order of 10(3) with precision (CVs lt10) and accuracy (relative error approximately 20) sufficient for quantifying biomarkers in the physiologically relevant ngmL range These methods are generally applicable to any protein or biological fluid of interest and hold great potential for providing a desperately needed bridging technology between biomarker discovery and clinical application
Anal Biochem 2007 Mar 1362(1)44-54 Epub 2006 Dec 20 Antibody-based enrichment of peptides on magnetic beads for mass-spectrometry-based quantification of serum biomarkers Whiteaker JR Zhao L Zhang HY Feng LC Piening BD Anderson L Paulovich AG Source Fred Hutchinson Cancer Research Center 1100 Fairview Avenue N PO Box 19024 Seattle WA 98109-1024 USA
Acknowledgments Duke University Proteomics Core Facility
httpwwwgenomedukeeducoresproteomics
Biostatistics Dr Joseph Lucas Funding NIH S10 grant Duke School of Medicine CTSA grant UL1RR024128
- Lecture 3Differential Expression Proteomics
- Quantitative Mass Spectrometry of Peptides and Proteins
- ldquoOld-Schoolrdquo Differential Expression Proteomics
- The First Mass Spec Based Differential Expression Proteomics
- Slide Number 5
- Slide Number 6
- Analytical Challenges Associated with Performing Quantitative Proteomics Using Chemical Isotopic Labeling
- Slide Number 8
- Metabolic Stable Isotope Coding
- Slide Number 10
- Slide Number 11
- Slide Number 12
- Slide Number 13
- Overview of Label Free Quantitation
- Slide Number 15
- Slide Number 16
- Slide Number 17
- Slide Number 18
- Slide Number 19
- Slide Number 20
- Label Free Intensity Plots differential expression visualization
- Cluster Analysis of Label Free Quantitation Datasets
- Differential Protein Expression
- Relative Protein Expression
- One Exemplar Biomarker Discovery amp Verification ProjectBiomarkers to Predict Outcomes of Hepatitis C Patient Treatment in Serum of Treatment Naive PatientsJeanette McCarthy Keyur Patel Joe Lucas and John McHutchison
- Cohort Selection and Placement in the Pipeline(Guided by an ldquoUnmet Clinical Needrdquo US HUPO 2009)
- Slide Number 27
- Slide Number 28
- Key Features of Metaprotein Expression Modeling Bayesian Factor Regression Model
- Remember A Metaprotein Modelhellip
- Discovery and Initial Verification of SVR-Prediction Using Unbiased Data
- Slide Number 32
- Relative Protein Expression
- Absolute Protein Expression ndash lsquoomic scale
- Slide Number 35
- Slide Number 36
- Absolute Quantitation at the Protein Level - E coli lysate spiked with 4 exogenous proteins
- Absolute Quantitation for Measurement of Fold-Changes E coli spiking Experiment
- Slide Number 39
- Quantitative proteomics reveals metabolic and pathogenicproperties of Chlamydia trachomatis developmental formsHector A Saka1 J Will Thompson2 Yi-Shan Chen1 Yadunanda Kumar13 Laura GDubois2 M Arthur Moseley2 and Raphael H Valdivia1
- Protein Identification Metrics(Swissprot Human NCBI C trachomatis 1 FDR)
- Global Strategy for Using Mass Spectrometry to Deal with Mixed Proteomes using UPLCUPLCMSMS
- Validation of Species-Specific Quantitationusing a Model System
- Reproducibility of Protein Quantitation
- Species-Specific Correction Applied to Chlamydia Protein Quantitation
- Protein Classes and Relative Abundance in the Developmental Forms
- Molecular Evidence of the Different Metabolic Properties of the two Developmental Stages
- Slide Number 48
- Slide Number 49
- Slide Number 50
- Skyline Open Source Software for Targeted Method Development and Data Analysis
- Slide Number 52
- Slide Number 53
- Slide Number 54
- Slide Number 55
- AcknowledgmentsDuke University Proteomics Core Facilityhttpwwwgenomedukeeducoresproteomics
-
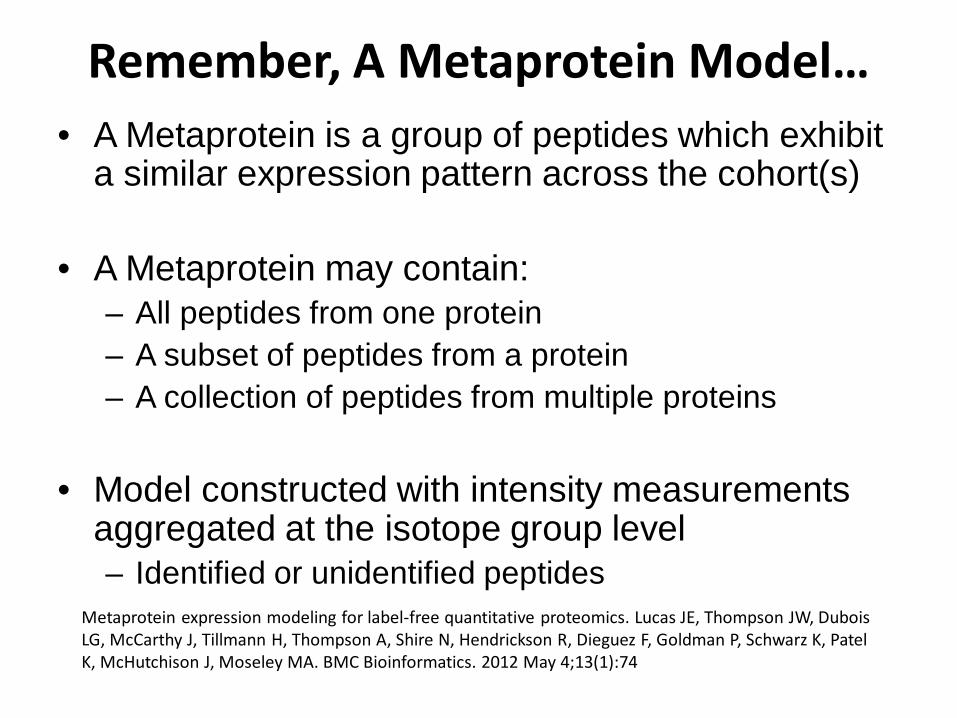
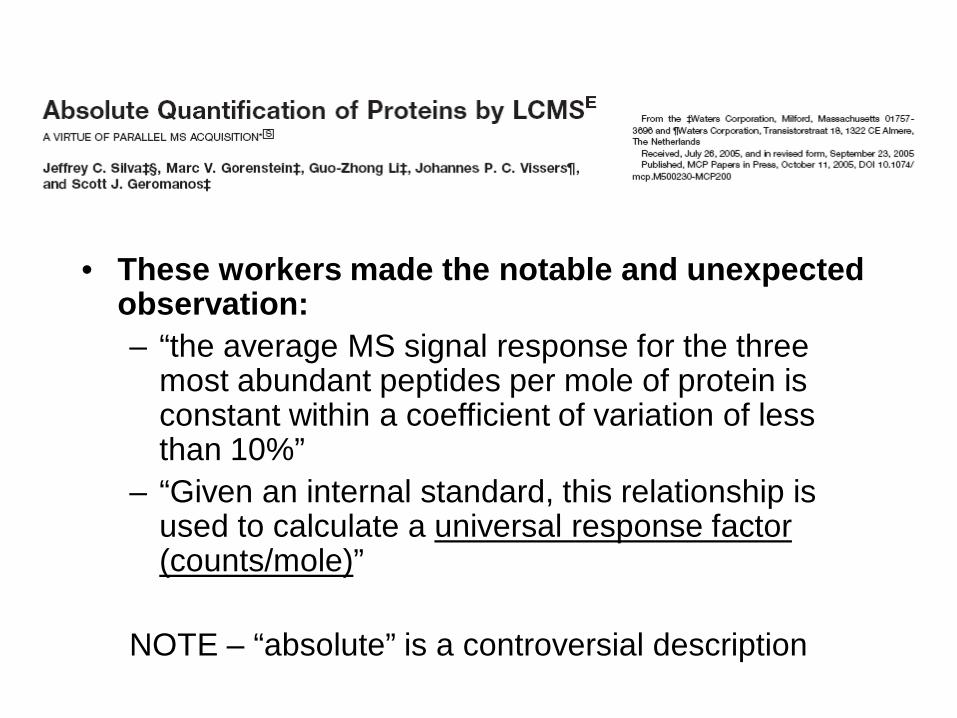
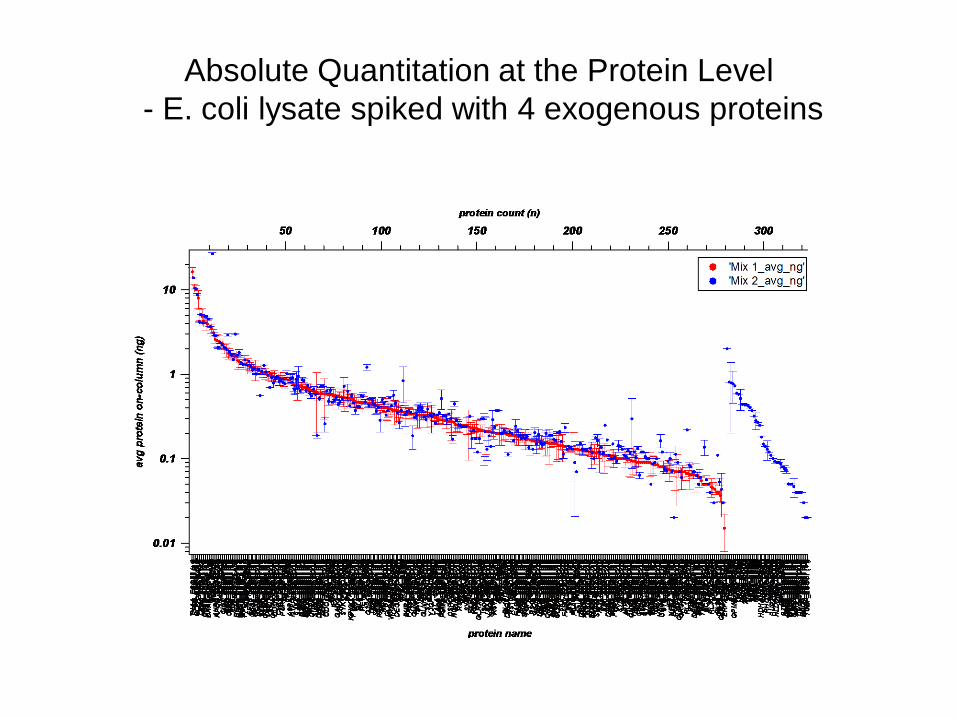
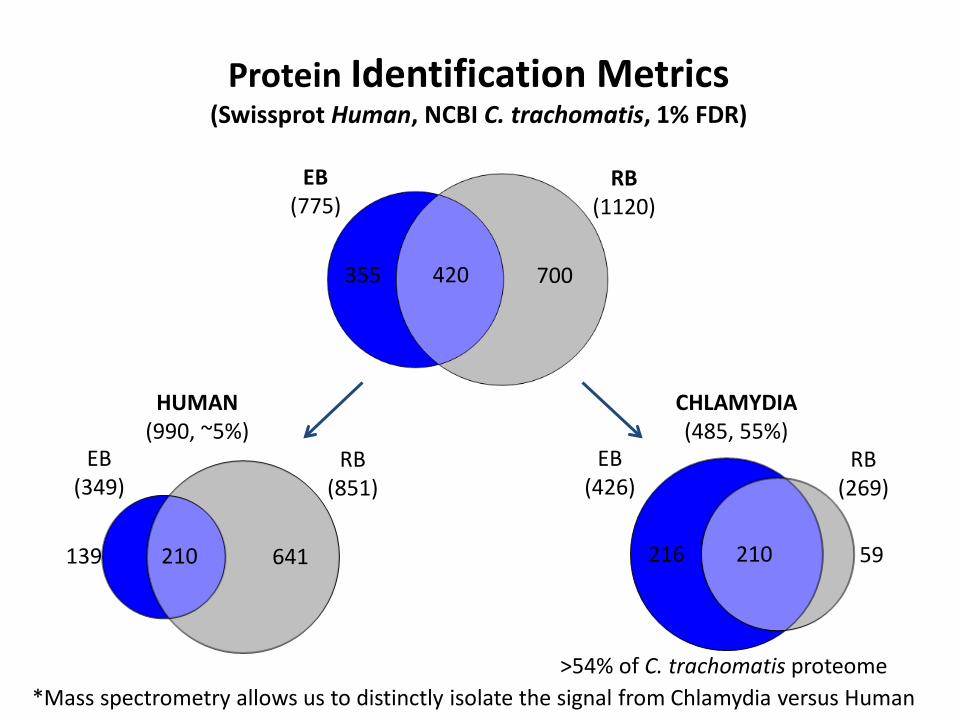