lecture 4
DESCRIPTION
material scienceTRANSCRIPT

9/21/2015
1
Phase Diagrams
1
2
Phase Equilibria: Solubility Limit
Question: What is thesolubility limit for sugar inwater at 20ºC?
Answer: 65 wt% sugar.At 20ºC, if C < 65 wt% sugar: syrupAt 20ºC, if C > 65 wt% sugar:
syrup + sugar
65
• Solubility Limit:Maximum concentration forwhich only a single phasesolution exists.
Sugar/Water Phase Diagram
Suga
r
Tem
pera
ture
(ºC
)
0 20 40 60 80 100C = Composition (wt% sugar)
L(liquid solution
i.e., syrup)
SolubilityLimit L
(liquid)+S
(solidsugar)20
40
60
80
100
Wat
er
Adapted from Fig. 9.1,Callister & Rethwisch 8e.
• Solution – solid, liquid, or gas solutions, single phase• Mixture – more than one phase

9/21/2015
2
3
• Components:The elements or compounds which are present in the alloy
(e.g., Al and Cu)
• Phases:The physically and chemically distinct material regionsthat form (e.g., α and β).
Aluminum-CopperAlloy
Components and Phases
α (darkerphase)
β (lighterphase)
Adapted from chapter-opening photograph,Chapter 9, Callister,Materials Science &Engineering: AnIntroduction, 3e.
4
70 80 1006040200
Tem
pera
ture
(ºC
)
C = Composition (wt% sugar)
L(liquid solution
i.e., syrup)
20
100
40
60
80
0
L(liquid)
+S
(solidsugar)
Effect of Temperature & Composition• Altering T can change # of phases: path A to B.• Altering C can change # of phases: path B to D.
water-sugarsystem
Adapted from Fig. 9.1,Callister & Rethwisch 8e.
D (100ºC,C = 90)2 phases
B (100ºC,C = 70)1 phase
A (20ºC,C = 70)2 phases

9/21/2015
3
5
Cu-Ni phase diagram
Isomorphous Binary Phase Diagram
• Phase diagram:Cu-Ni system.
• System is:
Adapted from Fig. 9.3(a), Callister & Rethwisch 8e. (Fig. 9.3(a) is adaptedfrom Phase Diagrams of Binary Nickel Alloys, P. Nash (Ed.), ASMInternational, Materials Park, OH (1991).
-- binaryi.e., 2 components:Cu and Ni.
-- isomorphousi.e., completesolubility of onecomponent inanother; α phasefield extends from0 to 100 wt% Ni.
wt% Ni20 40 60 80 10001000
1100
1200
1300
1400
1500
1600T(ºC)
L (liquid)
α(FCC solidsolution)
6
Phase Diagrams• Indicate phases as a function of T, C, and P.• For this course:
- binary systems: just 2 components.- independent variables: T and C (P = 1 atm is almost always used).
PhaseDiagramfor Cu-Nisystem
Adapted from Fig. 9.3(a), Callister &Rethwisch 8e. (Fig. 9.3(a) is adapted fromPhase Diagrams of Binary Nickel Alloys,P. Nash (Ed.), ASM International,Materials Park, OH (1991).
• 2 phases:L (liquid)α (FCC solid solution)
• 3 different phase fields:LL + αα
wt% Ni20 40 60 80 10001000
1100
1200
1300
1400
1500
1600T(ºC)
L (liquid)
α(FCC solidsolution)

9/21/2015
4
wt% Ni20 40 60 80 10001000
1100
1200
1300
1400
1500
1600T(ºC)
L (liquid)
α(FCC solidsolution)
Cu-Niphase
diagram
7
Phase Diagrams:Determination of phase(s) present
• Rule 1: If we know T and Co, then we know:-- which phase(s) is (are) present.
• Examples:A(1100ºC, 60 wt% Ni):
1 phase: α
B(1250ºC, 35 wt% Ni):2 phases: L + α
B(1
250º
C,3
5)A(1100ºC,60)
Adapted from Fig. 9.3(a), Callister &Rethwisch 8e. (Fig. 9.3(a) is adapted fromPhase Diagrams of Binary Nickel Alloys,P. Nash (Ed.), ASM International,Materials Park, OH (1991).
8
wt% Ni20
1200
1300
T(ºC)
L (liquid)
α(solid)
30 40 50
Cu-Nisystem
Phase Diagrams:Determination of phase compositions
• Rule 2: If we know T and C0, then we can determine:-- the composition of each phase.
• Examples:
TAA
35C0
32CL
At TA = 1320ºC:Only Liquid (L) presentCL = C0 ( = 35 wt% Ni)
At TB = 1250ºC:Both and L presentCL = C liquidus ( = 32 wt% Ni)C = Csolidus ( = 43 wt% Ni)
At TD = 1190ºC:Only Solid (α) presentC = C0 ( = 35 wt% Ni)
Consider C0 = 35 wt% Ni
DTD
tie line
4C3
Adapted from Fig. 9.3(a), Callister & Rethwisch 8e.(Fig. 9.3(a) is adapted from Phase Diagrams ofBinary Nickel Alloys, P. Nash (Ed.), ASMInternational, Materials Park, OH (1991).
BTB
9/21/2015
5
9
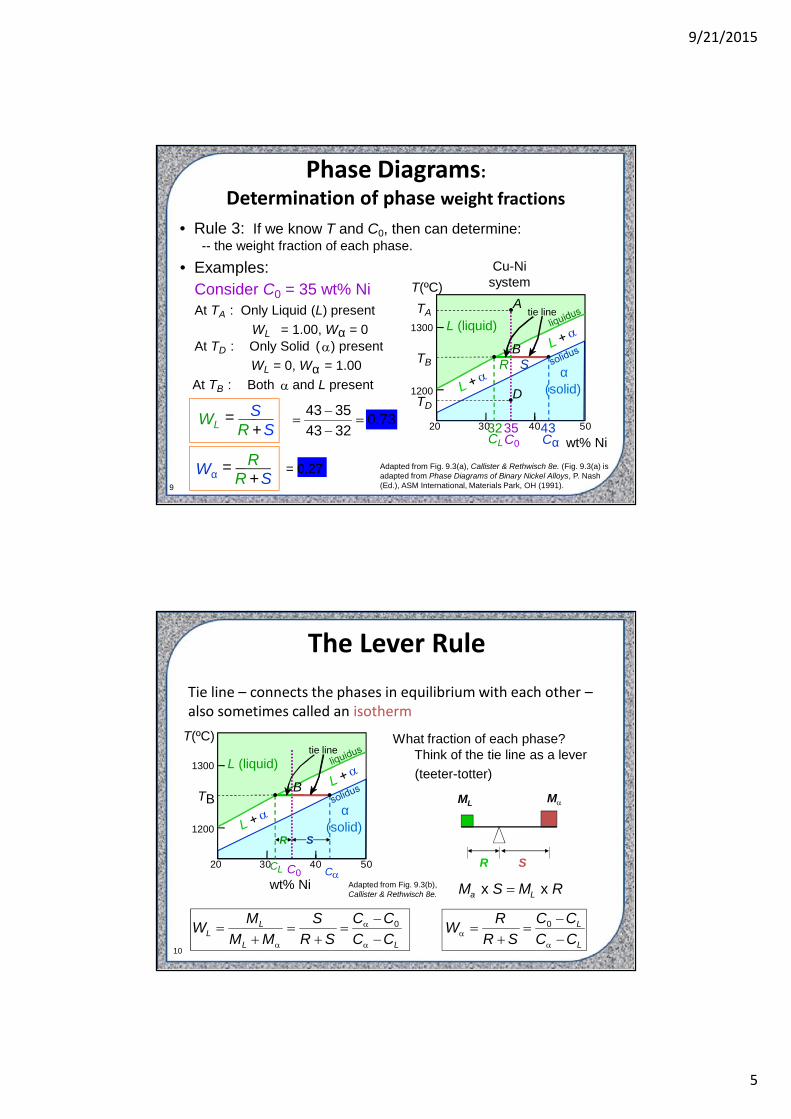
• Rule 3: If we know T and C0, then can determine:-- the weight fraction of each phase.
• Examples:
At TA : Only Liquid (L) presentWL = 1.00, Wα = 0
At TD : Only Solid () presentWL = 0, Wα = 1.00
Phase Diagrams:Determination of phase weight fractions
wt% Ni20
1200
1300
T(ºC)
L (liquid)
α(solid)
30 40 50
Cu-Nisystem
TAA
35C0
32CL
BTB
DTD
tie line
4Cα3
R SAt TB : Both and L present
73.032433543
= 0.27
WL = SR +S
Wα = RR +S
Consider C0 = 35 wt% Ni
Adapted from Fig. 9.3(a), Callister & Rethwisch 8e. (Fig. 9.3(a) isadapted from Phase Diagrams of Binary Nickel Alloys, P. Nash(Ed.), ASM International, Materials Park, OH (1991).
10
Tie line – connects the phases in equilibrium with each other –also sometimes called an isotherm
The Lever Rule
What fraction of each phase?Think of the tie line as a lever(teeter-totter)
ML M
R S
M x S ML x R
L
L
LL
LL CC
CCSR
RWCCCC
SRS
MMMW
00
wt% Ni20
1200
1300
T(ºC)
L (liquid)
α(solid)
30 40 50
BTB
tie line
C0CL C
SR
Adapted from Fig. 9.3(b),Callister & Rethwisch 8e.

9/21/2015
6
11wt% Ni
20
1200
1300
30 40 50110 0
L (liquid)
α(solid)
T(ºC)
A
35C0
L: 35wt%NiCu-Ni
system
• Phase diagram:Cu-Ni system.
Adapted from Fig. 9.4,Callister & Rethwisch 8e.
• Considermicrostucturalchanges thataccompany thecooling of aC0 = 35 wt% Ni alloy
Ex: Cooling of a Cu-Ni Alloy
46354332
α: 43 wt% NiL: 32 wt% Ni
Bα: 46 wt% NiL: 35 wt% Ni
C
EL: 24 wt% Ni
α: 36 wt% Ni
24 36D
• Slow rate of cooling:Equilibrium structure
• Fast rate of cooling:Cored structure
First α to solidify:46 wt% NiLast α to solidify:< 35 wt% Ni
12
• Cα changes as we solidify.• Cu-Ni case: First α to solidify has Cα = 46 wt% Ni.
Last α to solidify has Cα = 35 wt% Ni.
Cored vs Equilibrium Structures
Uniform Cα:35 wt% Ni

9/21/2015
7
13
2 componentshas a special compositionwith a min. melting T.
Adapted from Fig. 9.7,Callister & Rethwisch 8e.
Binary-Eutectic Systems
• 3 single phase regions(L, α, β)
• Limited solubility:α: mostly Cuβ: mostly Ag
• TE : No liquid below TE
: Composition attemperature TE
• CE
Ex.: Cu-Ag systemCu-Agsystem
L (liquid)
α L + α L+β β
α + β
C, wt% Ag20 40 60 80 1000
200
1200T(ºC)
400
600
800
1000
CE
TE 8.0 71.9 91.2779ºC
Ag) wt%1.29( Ag) wt%.08( Ag) wt%9.71( Lcooling
heating
• Eutectic reactionL(CE) (CE) + (CE)
14
L+αL+β
α + β
200
T(ºC)
18.3
C, wt% Sn20 60 80 1000
300
100
L (liquid)
α 183ºC61.9 97.8
β
• For a 40 wt% Sn-60 wt% Pb alloy at 150ºC, determine:-- the phases present
Pb-Snsystem
EX 1: Pb-Sn Eutectic System
Answer: α + β-- the phase compositions
-- the relative amountof each phase
150
40C0
11C
99C
SR
Answer: Cα = 11 wt% SnCβ = 99 wt% Sn
W
=C - C0C - C
= 99 - 4099 - 11 = 59
88 = 0.67
SR+S =
W =C0 - CC - C
=RR+S
= 2988
= 0.33= 40 - 1199 - 11
Answer:
Adapted from Fig. 9.8,Callister & Rethwisch 8e.

9/21/2015
8
15
Answer: Cα = 17 wt% Sn-- the phase compositions
L+β
α + β
200
T(ºC)
C, wt% Sn20 60 80 1000
300
100
L (liquid)
α βL+α
183ºC
• For a 40 wt% Sn-60 wt% Pb alloy at 220ºC, determine:-- the phases present: Pb-Sn
system
EX 2: Pb-Sn Eutectic System
-- the relative amountof each phase
Wα =CL - C0
CL - C=
46 - 4046 - 17
=6
29 = 0.21
WL =C0 - CCL - C
=2329 = 0.79
40C0
46CL
17C
220SR
Answer: α + L
CL = 46 wt% Sn
Answer:
Adapted from Fig. 9.8,Callister & Rethwisch 8e.
16
• For alloys for whichC0 < 2 wt% Sn
• Result: at room temperature-- polycrystalline with grains of
α phase havingcomposition C0
Microstructural Developmentsin Eutectic Systems I
0
L+ α200
T(ºC)
C , wt% Sn10
2
20C0
300
100
L
α
30
α+β
400
(room T solubility limit)
TE(Pb-SnSystem)
αL
L: C0 wt% Sn
α: C0 wt% Sn
Adapted from Fig. 9.11,Callister & Rethwisch 8e.
9/21/2015
9
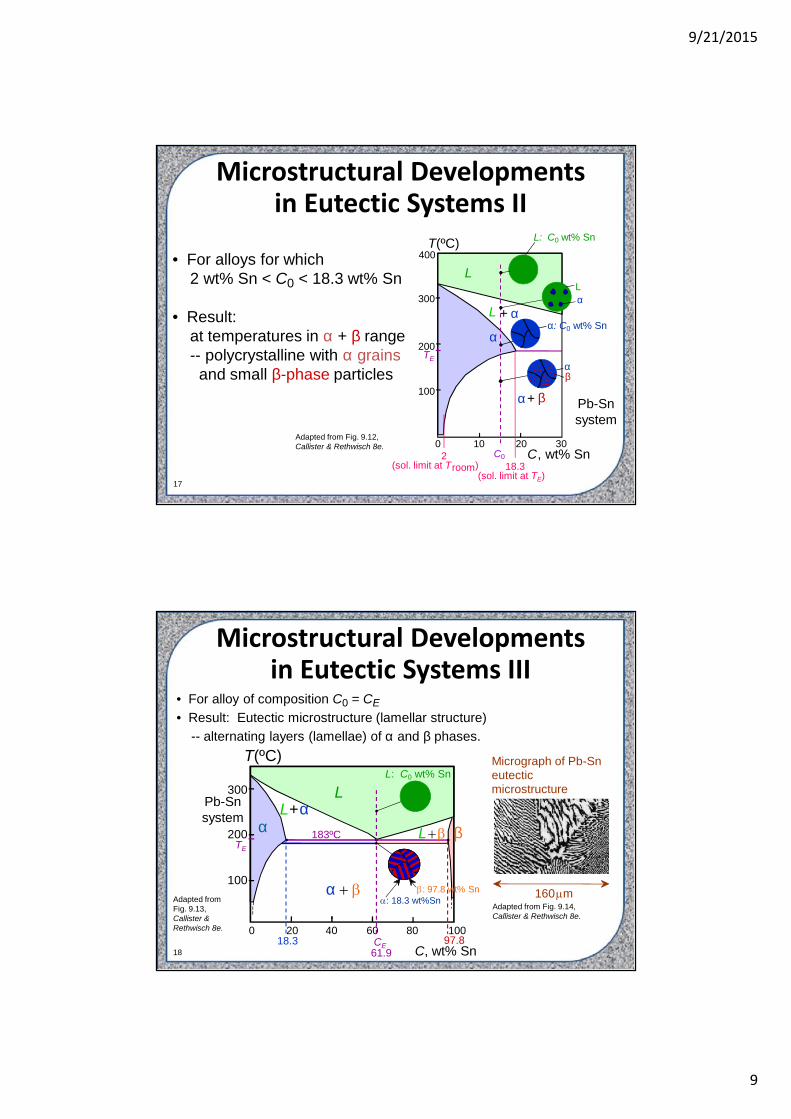
17
• For alloys for which2 wt% Sn < C0 < 18.3 wt% Sn
• Result:at temperatures in α + β range-- polycrystalline with α grains
and small β-phase particles
Adapted from Fig. 9.12,Callister & Rethwisch 8e.
Microstructural Developmentsin Eutectic Systems II
Pb-Snsystem
L + α
200
T(ºC)
C, wt% Sn10
18.3
200C0
300
100
L
α
30
α+ β
400
(sol. limit at TE)
TE
2(sol. limit at Troom)
Lα
L: C0 wt% Sn
αβ
α: C0 wt% Sn
18
• For alloy of composition C0 = CE• Result: Eutectic microstructure (lamellar structure)
-- alternating layers (lamellae) of α and β phases.
Adapted fromFig. 9.13,Callister &Rethwisch 8e.
Microstructural Developmentsin Eutectic Systems III
Adapted from Fig. 9.14,Callister & Rethwisch 8e.
160m
Micrograph of Pb-Sneutecticmicrostructure
Pb-Snsystem
L
α
200
T(ºC)
C, wt% Sn20 60 80 1000
300
100
L
α βL+α
183ºC
40
TE
18.3
: 18.3 wt%Sn
97.8
: 97.8 wt% Sn
CE61.9
L: C0 wt% Sn

9/21/2015
10
19
Lamellar Eutectic Structure
Adapted from Figs. 9.14 & 9.15, Callister & Rethwisch 8e.
20
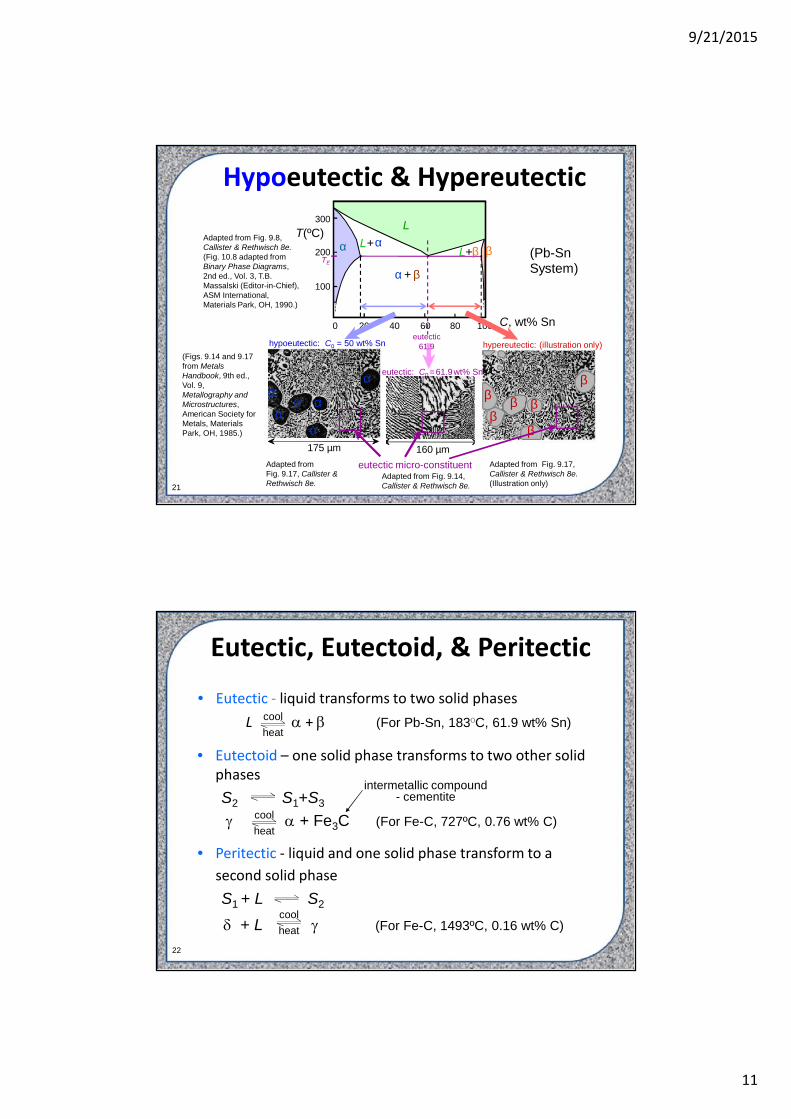
• For alloys for which 18.3 wt% Sn < C0 < 61.9 wt% Sn• Result: α phase particles and a eutectic microconstituent
Microstructural Developmentsin Eutectic Systems IV
18.3 61.9
SR
97.8
SR
primary αeutectic α
eutectic β
WL = (1- Wα) = 0.50
Cα = 18.3 wt% Sn
CL = 61.9 wt% SnS
R + SWα = = 0.50
• Just above TE :
• Just below TE :C = 18.3 wt% Sn
C = 97.8 wt% SnS
R + SW= = 0.73
W = 0.27Adapted from Fig. 9.16,Callister & Rethwisch 8e.
Pb-Snsystem
L+200
T(ºC)
C, wt% Sn
20 60 80 1000
300
100
L
α βL+
40
+
TE
L: C0 wt% Sn LL
9/21/2015
11
21
L+αL+β
α + β
200
C, wt% Sn20 60 80 1000
300
100
L
α βTE
40
(Pb-SnSystem)
Hypoeutectic & Hypereutectic
Adapted from Fig. 9.8,Callister & Rethwisch 8e.(Fig. 10.8 adapted fromBinary Phase Diagrams,2nd ed., Vol. 3, T.B.Massalski (Editor-in-Chief),ASM International,Materials Park, OH, 1990.)
160 µmeutectic micro-constituent
Adapted from Fig. 9.14,Callister & Rethwisch 8e.
hypereutectic: (illustration only)
β
βββ
β
β
Adapted from Fig. 9.17,Callister & Rethwisch 8e.(Illustration only)
(Figs. 9.14 and 9.17from MetalsHandbook, 9th ed.,Vol. 9,Metallography andMicrostructures,American Society forMetals, MaterialsPark, OH, 1985.)
175 µm
α
α
α
αα
α
hypoeutectic: C0 = 50 wt% Sn
Adapted fromFig. 9.17, Callister &Rethwisch 8e.
T(ºC)
61.9eutectic
eutectic: C0 = 61.9wt% Sn
22
• Eutectoid – one solid phase transforms to two other solidphasesS2 S1+S3
+ Fe3C (For Fe-C, 727ºC, 0.76 wt% C)
intermetallic compound- cementite
coolheat
Eutectic, Eutectoid, & Peritectic
• Eutectic - liquid transforms to two solid phasesL + (For Pb-Sn, 183ºC, 61.9 wt% Sn)cool
heat
coolheat
• Peritectic - liquid and one solid phase transform to asecond solid phaseS1 + L S2
+ L (For Fe-C, 1493ºC, 0.16 wt% C)

9/21/2015
12
23
Eutectoid & Peritectic
Cu-Zn Phase diagram
Adapted from Fig. 9.21,Callister & Rethwisch 8e.Eutectoid transformation +
Peritectic transformation + L
24
Iron-Carbon (Fe-C) Phase Diagram• 2 important
points
- Eutectoid (B):γ α +Fe3C
- Eutectic (A):L γ +Fe3C
Adapted from Fig. 9.24,Callister & Rethwisch 8e.
Fe3C
(cem
entit
e)
1600
1400
1200
1000
800
600
4000 1 2 3 4 5 6 6.7
L
γ(austenite)
γ+L
γ+Fe3C
α+Fe3C
δ
(Fe) C, wt% C
1148ºC
T(ºC)
α 727ºC = Teutectoid
4.30Result: Pearlite =alternating layers ofα and Fe3C phases
120 µm
(Adapted from Fig. 9.27,Callister & Rethwisch 8e.)
0.76
Bγ γ
γγ
A L+Fe3C
Fe3C (cementite-hard)α (ferrite-soft)

9/21/2015
13
25
Fe3C
(cem
entit
e)
1600
1400
1200
1000
800
600
4000 1 2 3 4 5 6 6.7
L
γ(austenite)
γ+L
γ + Fe3C
α+ Fe3C
L+Fe3C
δ
(Fe) C, wt% C
1148ºC
T(ºC)
α727ºC
(Fe-CSystem)
C0
0.76
Hypoeutectoid Steel
Adapted from Figs. 9.24and 9.29,Callister &Rethwisch 8e.(Fig. 9.24 adapted fromBinary Alloy PhaseDiagrams, 2nd ed., Vol.1, T.B. Massalski (Ed.-in-Chief), ASM International,Materials Park, OH,1990.)
Adapted from Fig. 9.30, Callister & Rethwisch 8e.proeutectoid ferritepearlite
100 µm Hypoeutectoidsteel
α
pearlite
γγ γ
γααα
γγγ γ
γ γγγ
26
Fe3C
(cem
entit
e)
1600
1400
1200
1000
800
600
4000 1 2 3 4 5 6 6.7
L
γ(austenite)
γ+L
γ + Fe3C
α+ Fe3C
L+Fe3C
δ
(Fe) C, wt% C
1148ºC
T(ºC)
α727ºC
(Fe-CSystem)
C0
0.76
Hypoeutectoid Steel
γγ γ
γααα
srWα = s/(r + s)Wγ =(1 - Wα)
R Sα
pearlite
Wpearlite = Wγ
Wα’ = S/(R + S)W =(1 – Wα’)Fe3C
Adapted from Figs.9.24 and9.29,Callister &Rethwisch 8e.(Fig. 9.24 adaptedfrom Binary AlloyPhase Diagrams, 2nded., Vol. 1, T.B.Massalski (Ed.-in-Chief), ASMInternational,Materials Park, OH,1990.)
Adapted from Fig. 9.30, Callister & Rethwisch 8e.
proeutectoid ferritepearlite
100 µm Hypoeutectoidsteel

9/21/2015
14
27
Hypereutectoid Steel
Fe3C
(cem
entit
e)
1600
1400
1200
1000
800
600
4000 1 2 3 4 5 6 6.7
L
γ(austenite)
γ+L
γ +Fe3C
α +Fe3C
L+Fe3C
δ
(Fe) C, wt%C
1148ºC
T(ºC)
α
Adapted from Figs.9.24 and 9.32,Callister& Rethwisch 8e. (Fig.9.24 adapted fromBinary Alloy PhaseDiagrams, 2nd ed., Vol.1, T.B. Massalski (Ed.-in-Chief), ASMInternational, MaterialsPark, OH, 1990.)
(Fe-CSystem)
0.76 C0
Fe3C
γγγ γ
γγγ γ
γγγ γ
Adapted from Fig. 9.33, Callister & Rethwisch 8e.
proeutectoid Fe3C
60 µmHypereutectoidsteel
pearlite
pearlite
28
Fe3C
(cem
entit
e)
1600
1400
1200
1000
800
600
4000 1 2 3 4 5 6 6.7
L
γ(austenite)
γ+L
γ +Fe3C
α +Fe3C
L+Fe3C
δ
(Fe) C, wt%C
1148ºC
T(ºC)
α
Hypereutectoid Steel
(Fe-CSystem)
0.76 C0
pearlite
Fe3C
γγγ γ
xv
V X
Wpearlite = Wγ
Wα = X/(V +X)
W =(1 - Wα)Fe3C’
W =(1-Wγ)Wγ =x/(v + x)
Fe3C
Adapted from Fig. 9.33, Callister & Rethwisch 8e.
proeutectoid Fe3C
60 µmHypereutectoidsteel
pearlite
Adapted from Figs.9.24 and9.32,Callister &Rethwisch 8e. (Fig.9.24 adapted fromBinary Alloy PhaseDiagrams, 2nd ed.,Vol. 1, T.B.Massalski (Ed.-in-Chief), ASMInternational,Materials Park, OH,1990.)

9/21/2015
15
29
Alloying with Other Elements
• Teutectoid changes:
Adapted from Fig. 9.34,Callister & Rethwisch 8e.(Fig. 9.34 from Edgar C. Bain, Functions of theAlloying Elements in Steel, American Society forMetals, 1939, p. 127.)
T Eut
ecto
id(º
C)
wt. % of alloying elements
Ti
Ni
Mo SiW
Cr
Mn
• Ceutectoid changes:
Adapted from Fig. 9.35,Callister & Rethwisch 8e.(Fig. 9.35 from Edgar C. Bain, Functions of theAlloying Elements in Steel, American Society forMetals, 1939, p. 127.)
wt. % of alloying elements
Ceu
tect
oid
(wt%
C)
Ni
Ti
Cr
SiMnWMo
30
• Phase diagrams are useful tools to determine:-- the number and types of phases present,-- the composition of each phase,-- and the weight fraction of each phasegiven the temperature and composition of the system.
• The microstructure of an alloy depends on-- its composition, and-- whether or not cooling rate allows for maintenance of
equilibrium.
• Important phase diagram phase transformations includeeutectic, eutectoid, and peritectic.
Summary

9/21/2015
16
Phase Transformations
32
Phase TransformationsNucleation
nuclei (seeds) act as templates on which crystals grow for nucleusto form rate of addition of atoms to nucleus must be faster than rateof loss once nucleated, growth proceeds until equilibrium isattained
Driving force to nucleate increases as we increase T– supercooling (eutectic, eutectoid)– superheating (peritectic)
Small supercooling slow nucleation rate - few nuclei - large crystals
Large supercooling rapid nucleation rate - many nuclei - small crystals

9/21/2015
17
33
Solidification: Nucleation Types
• Homogeneous nucleationnuclei form in the bulk of liquid metal requiresconsiderable supercooling (typically 80-300ºC)
• Heterogeneous nucleation– much easier since stable “nucleating surface” is
already present — e.g., mold wall, impurities inliquid phase
– only very slight supercooling (0.1-10ºC)
34
r* = critical nucleus: for r < r* nuclei shrink; for r >r* nuclei grow (to reduce energy)Adapted from Fig.10.2(b), Callister & Rethwisch 8e.
Homogeneous Nucleation & Energy Effects
∆GT = Total Free Energy= ∆GS + ∆GV
Surface Free Energy - destabilizesthe nuclei (it takes energy to makean interface)
24 rGS
γ = surface tension
Volume (Bulk) Free Energy –stabilizes the nuclei (releases energy)
GrGV3
34
volumeunitenergyfreevolume
G

9/21/2015
18
35
Solidification
THTr
f
m
2*
Note: Hf and are weakly dependent on T
r* decreases as T increases
For typical T r* ~ 10 nm
Hf = latent heat of solidificationTm = melting temperatureγ = surface free energy
∆T = Tm - T = supercooling
r* = critical radius
36
Transformations & Undercooling
• For transf. to occur, must cool tobelow 727ºC(i.e., must “undercool”)
• Eutectoid transf. (Fe-Fe3C system):γ α + Fe3C
0.76 wt% C0.022 wt% C
6.7 wt% C
Fe3C
(cem
entit
e)
1600
1400
1200
1000
800
600
4000 1 2 3 4 5 6 6.7
L
γ(austenite)
γ+L
γ +Fe3C
α +Fe3C
L+Fe3C
δ
(Fe) C, wt%C
1148ºC
T(ºC)
αferrite
727ºC
Eutectoid:Equil. Cooling: Ttransf. = 727ºC
∆TUndercooling by Ttransf. < 727C
0.76
0.02
2
Adapted from Fig.9.24,Callister &Rethwisch 8e. (Fig. 9.24adapted from BinaryAlloy Phase Diagrams,2nd ed., Vol. 1, T.B.Massalski (Ed.-in-Chief),ASM International,Materials Park, OH,1990.)

9/21/2015
19
37
• Eutectoid composition, C0 = 0.76 wt% C• Begin at T > 727ºC• Rapidly cool to 625ºC• Hold T (625ºC) constant (isothermal treatment)
Adapted from Fig.10.14,Callister & Rethwisch8e. (Fig. 10.14 adaptedfrom H. Boyer (Ed.) Atlas ofIsothermal Transformationand Cooling TransformationDiagrams, AmericanSociety for Metals, 1997, p.28.)
Austenite-to-Pearlite Isothermal Transformation
400
500
600
700
Austenite (stable) TE (727ºC)Austenite(unstable)
Pearlite
T(ºC)
1 10 102 103 104 105
time (s)
γ γ
γγ γ
γ
38
10 103 105
time (s)10-1
400
600
800
T(ºC
)
Austenite (stable)
200
P
B
TEA
A
Bainite: Another Fe-Fe3C Transformation Product• Bainite:
-- elongated Fe3C particles inα-ferrite matrix
-- diffusion controlled• Isothermal Transf. Diagram,
C0 = 0.76 wt% C
Adapted from Fig. 10.18, Callister &Rethwisch 8e.
Adapted from Fig. 10.17, Callister &Rethwisch 8e. (Fig. 10.17 from MetalsHandbook, 8th ed., Vol. 8, Metallography,Structures, and Phase Diagrams, AmericanSociety for Metals, Materials Park, OH,1973.)
Fe3C(cementite)
5 µm
a(ferrite)
100% bainite
100% pearlite

9/21/2015
20
39
• Martensite:-- γ(FCC) to Martensite (BCT)
Adapted from Fig. 10.21, Callister &Rethwisch 8e. (Fig. 10.21 courtesyUnited States Steel Corporation.)
Adapted from Fig. 10.20,Callister & Rethwisch 8e.
Martensite:A Nonequilibrium Transformation Product
Martensite needlesAustenite
60m
40
(FCC) (BCC) + Fe3C
Martensite Formationslow cooling
temperingquench
M (BCT)
Martensite (M) – single phase– has body centered tetragonal (BCT)
crystal structure
Diffusionless transformationBCT if C0 > 0.15 wt% CBCT few slip planes hard, brittle

9/21/2015
21
41
Tempered Martensite
• tempered martensite less brittle than martensite• tempering reduces internal stresses caused by quenching
Adapted from Fig.10.33, Callister &Rethwisch 8e. (Fig.10.33 copyright byUnited States SteelCorporation, 1971.)
• tempering decreases TS, YS but increases %RA• tempering produces extremely small Fe3C particles surrounded by α.
Adapted fromFig. 10.34,Callister &Rethwisch 8e.(Fig. 10.34adapted fromFig. furnishedcourtesy ofRepublic SteelCorporation.)
9µm
YS(MPa)TS(MPa)
800
1000
1200
1400
1600
1800
30405060
200 400 600Tempering T (ºC)
%RA
TS
YS
%RA
Heat treat martensite to form tempered martensite
42
Phase Transformations of AlloysEffect of adding other elementsChange transition temp.
Cr, Ni, Mo, Si, Mn
retard + Fe3Creaction (and formation of
pearlite, bainite)
Adapted from Fig. 10.23, Callister & Rethwisch 8e.

9/21/2015
22
43
Adapted from Fig. 10.25,Callister & Rethwisch 8e.
Continuous CoolingTransformation Diagrams
Conversion of isothermaltransformation diagram tocontinuous coolingtransformation diagram
Cooling curve
44
Summary of Possible Transformations
Adapted from Fig. 10.36, Callister & Rethwisch 8e.
Austenite (γ)
Pearlite(α + Fe3C layers + aproeutectoid phase)
slowcool
Bainite(α + elong. Fe3C particles)
moderatecool
Martensite(BCT phasediffusionless
transformation)
rapidquench
TemperedMartensite(α + very fine
Fe3C particles)
reheat
Stre
ngth
Duc
tility
MartensiteT Martensite
bainitefine pearlite
coarse pearlitespheroidite
General Trends