lecture 40. lidar class review...
TRANSCRIPT

Lecture 40. Lidar Class Review (2)
Temperature Lidar
Wind Lidar
Aerosol Lidar
Constituent Lidar
Target Lidar
Accuracy versus Precision
Lidar Simulation and Error Analysis
Summary and Outlook

Temperature Lidar Techniques Temperature-dependent and temperature-sensitive effects
and phenomena are utilized in the temperature lidars tomeasure atmosphere temperatures.
Resonance Fluorescence Doppler Technique (Na, K, and Fe Doppler lidars)
Boltzmann Technique (Fe and N2
+ Boltzmann lidars, imagers, Bomem mappers) Integration Technique
(searchlight, Rayleigh & vibrational Raman lidars, falling sphere) Rayleigh Doppler Technique
(Rayleigh Doppler lidar and high-spectral-resolution Lidar) Rotational Raman Technique
(Rotational Raman lidar) Differential Absorption Technique
(DIAL lidar)

Doppler & Boltzmann Techniques Doppler effect and Boltzmann distribution are two effects that are
directly temperature-dependent. The Doppler technique and Boltzmanntechnique are “straight-forward” in the sense of deriving temperatureor wind. However, the lidar architecture is usually complicated andsophisticated, due to the high demands on frequency accuracy, linewidth,and power combination.
N2N1
=g2g1exp E2 E1( ) kBT{ }
E1
E2
N1, g1
N2, g2
E
T =E /kB
lng2g1
N1N2
= 0 =
r k
r v = 0
v cos
c
rms = 0
c
kBT
M=1
0
kBT
M
0
0.2
0.4
0.6
0.8
1
1.2
1.4
-40 -20 0 20 40
Rela
tive
Inte
nsity
(Arb
. Uni
t)
Frequency Offset (Arb. Unit)

Temperature Technique vs Altitude
150 200 250 300 3500
20
40
60
80
100
120
MSIS90 Temperature
Temperature (K)
Alt
itude
(km
)
Troposphere
Stratosphere
Mesosphere
Thermosphere
Mesopause
Stratopause
Tropopause
Airglow & Meteoric LayersOH, O, Na, Fe, K, CaPMC
OzonePSC
Temperature Technique vs Altitude 75-120km: resonance
fluorescence Dopplertechnique (Na, K, Fe) &Boltzmann technique (Fe,OH, O2)
30-90km: Rayleighintegration technique &Rayleigh Doppler technique
Below 30 km: scatteringDoppler technique, HSRL,and Raman technique(Boltzmann and integration)
Boundary layer: DIAL,HSRL, Rotational Raman
AerosolsClouds

Comparison of Temperature Technique
Boundary layer temperatureDifferential Absorption Lidar: Temp-dependence of line strength and lineshape
DIAL
Stratosphere and mesospheretemperature (30-90 km)Troposphere temperature (< 30 km)
Rayleigh or Raman Integration TempLidar: atmospheric density ratio totemperature, integration from upper level
Integration Technique:hydrostatic equilibriumand ideal gas law
Troposphere and stratospheretemperature
Rotation Raman Temperature Lidar: ratioof two Raman line intensities andpopulation on different initial energystates
Mesosphere and LowerThermosphere temperature (75-120km)
Resonance fluorescence BoltzmannTemperature Lidar: population ratio onthe lowest two ground states
Boltzmann Technique:temperature dependenceof population ratio
Stratosphere and tropospheretemperature and wind (up to 30km)
High-Spectral-Resolution Lidar: Dopplerbroadening of molecular scattering, ratioof two signals
Lower mesosphere, stratosphereand troposphere temperature andwind (up to 60 km)
Rayleigh Doppler Lidar : Dopplerbroadening of molecular scattering
Mesosphere and LowerThermosphere temperature andwind (75-120 km)
Resonance fluorescence Doppler Lidar:Doppler broadening and Doppler shift ofresonance fluorescence absorption cross-section (scan and ratio techs)
Doppler Technique:temperature dependenceof Doppler broadening(1 time Doppler shift andDoppler broadening forsingle absorption oremission process)(2 times Doppler shift andDoppler broadening forRayleigh scattering)
ApplicationsLidarsTechnique

Techniques for Wind MeasurementsUse wind-dependent effects or use definition of wind
Direct Motion Detection Technique:
(using the definition of velocity )
r v =
dr r (t)
dt
Geostrophic wind detection:
(1) Tracking aerosol/cloud motions(2) Laser Time-of-Flight Velocimetry(3) Laser Doppler Velocimetry
Temperature Pressure Gradients Geostrophic Wind
Doppler (Shift) Wind Technique: =
r k
r v
(1) Coherent (Heterodyne) Detection Doppler Wind Lidar
(2) Direct Detection Doppler Wind Lidar
= 2r k
r v or
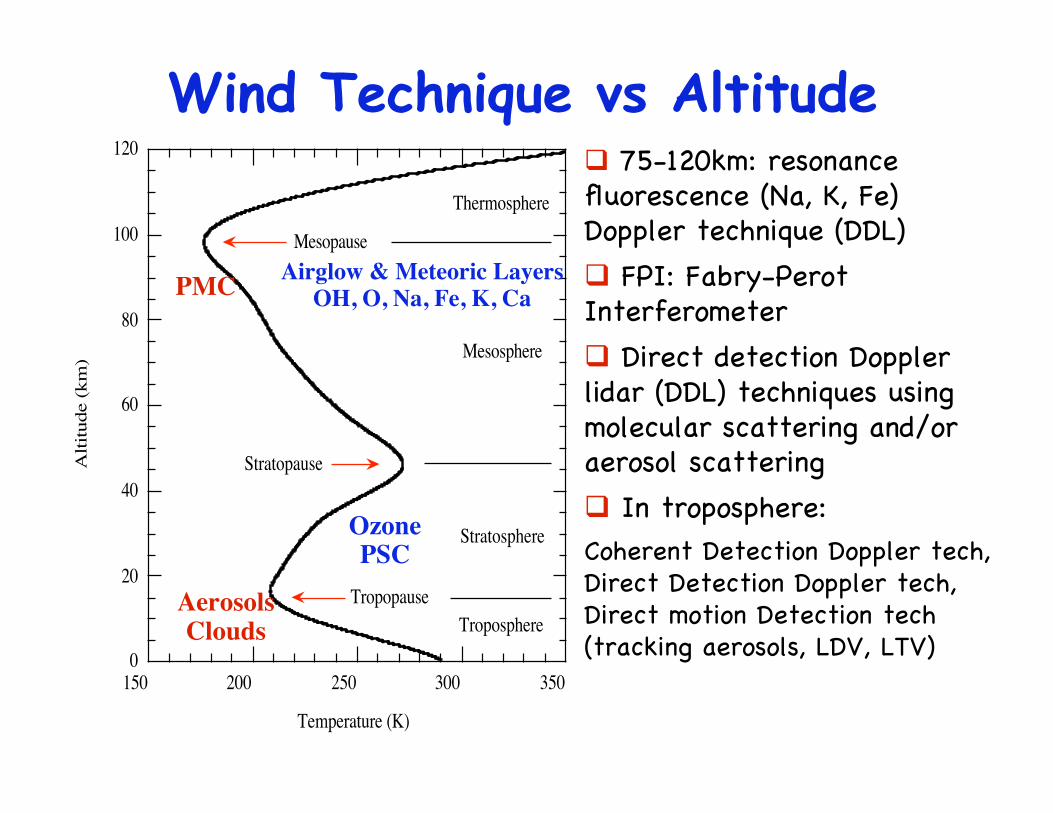
Wind Techniques vs Altitude
150 200 250 300 3500
20
40
60
80
100
120
MSIS90 Temperature
Temperature (K)
Alt
itude
(km
)
Troposphere
Stratosphere
Mesosphere
Thermosphere
Mesopause
Stratopause
Tropopause
75-120km: resonancefluorescence (Na, K, Fe)Doppler technique (DDL)
FPI: Fabry-PerotInterferometer
Direct detection Dopplerlidar (DDL) techniques usingmolecular scattering and/oraerosol scattering
In troposphere:Coherent Detection Doppler tech,Direct Detection Doppler tech,Direct motion Detection tech(tracking aerosols, LDV, LTV)
Airglow & Meteoric LayersOH, O, Na, Fe, K, CaPMC
OzonePSC
AerosolsClouds
Wind Technique vs Altitude
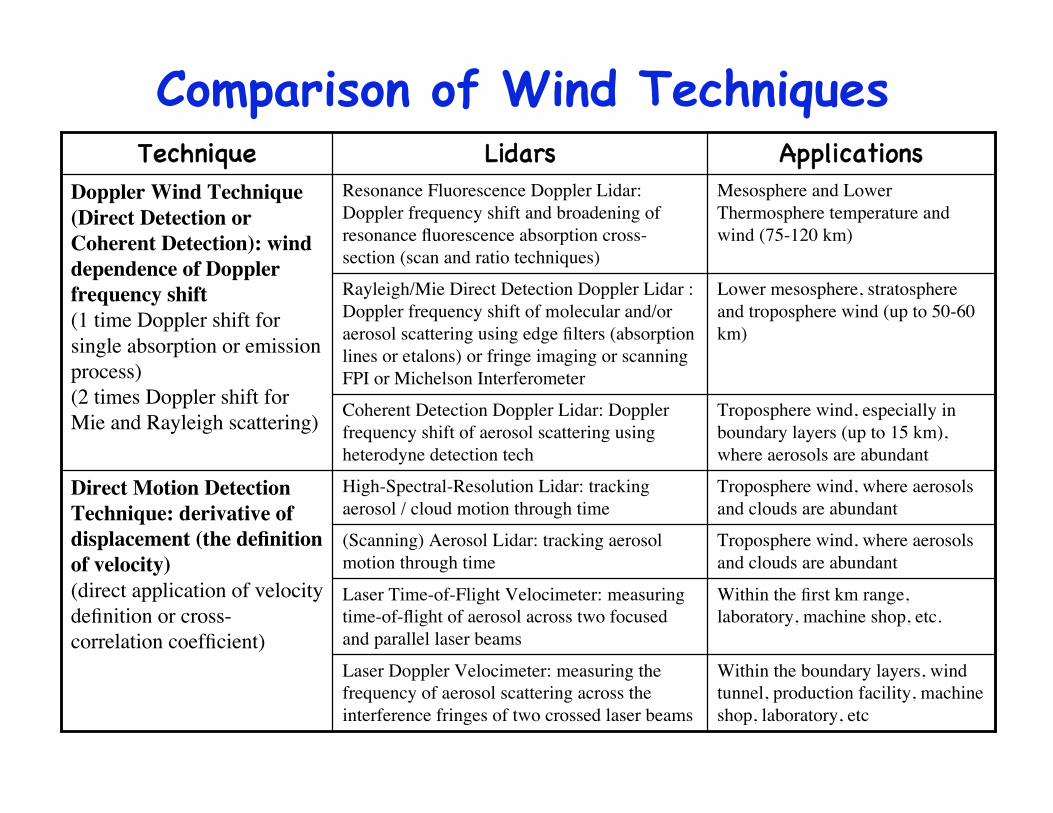
Comparison of Wind Techniques
Troposphere wind, where aerosolsand clouds are abundant
(Scanning) Aerosol Lidar: tracking aerosolmotion through time
Within the boundary layers, windtunnel, production facility, machineshop, laboratory, etc
Laser Doppler Velocimeter: measuring thefrequency of aerosol scattering across theinterference fringes of two crossed laser beams
Within the first km range,laboratory, machine shop, etc.
Laser Time-of-Flight Velocimeter: measuringtime-of-flight of aerosol across two focusedand parallel laser beams
Troposphere wind, where aerosolsand clouds are abundant
High-Spectral-Resolution Lidar: trackingaerosol / cloud motion through time
Direct Motion DetectionTechnique: derivative ofdisplacement (the definitionof velocity)(direct application of velocitydefinition or cross-correlation coefficient)
Troposphere wind, especially inboundary layers (up to 15 km),where aerosols are abundant
Coherent Detection Doppler Lidar: Dopplerfrequency shift of aerosol scattering usingheterodyne detection tech
Lower mesosphere, stratosphereand troposphere wind (up to 50-60km)
Rayleigh/Mie Direct Detection Doppler Lidar :Doppler frequency shift of molecular and/oraerosol scattering using edge filters (absorptionlines or etalons) or fringe imaging or scanningFPI or Michelson Interferometer
Mesosphere and LowerThermosphere temperature andwind (75-120 km)
Resonance Fluorescence Doppler Lidar:Doppler frequency shift and broadening ofresonance fluorescence absorption cross-section (scan and ratio techniques)
Doppler Wind Technique(Direct Detection orCoherent Detection): winddependence of Dopplerfrequency shift(1 time Doppler shift forsingle absorption or emissionprocess)(2 times Doppler shift forMie and Rayleigh scattering)
ApplicationsLidarsTechnique

Vector Wind Velocity Determination Vector (u, v, w) wind velocity estimates require radial velocity
measurements from at least three independent Line-Of-Sight (LOS).
Ideally: to obtain a vector wind at a given point in space is to view thesame point from 3 or more LOS directions
(1) Three or more lidar systems are required to do so
(2) When assuming W = 0, two lidar systems can do it.
Practically: under a necessary assumption of horizontal homogeneity ofthe wind field over the sensed volume, lidar beam scanning techniques canbe used to determine the vector wind velocity.
Two main techniques for this scanning -
(1) the Velocity-Azimuth-Display (VAD) technique:
-- conical scan lidar beam at a fixed elevation angle
(2) the Doppler-Beam-Swinging (DBS) techniques:
-- pointing lidar beam to vertical, tilted east, and tilted north

VAD and DBS Techniques
VR = u sin cos + v cos cos +w sin
VectorWind = (u,v,w) = (bsin max /cos ,bcos max /cos ,a /sin )
VAD

Aerosol Lidar Technique Comparison
150 200 250 300 3500
20
40
60
80
100
120
MSIS90 Temperature
Temperature (K)
Alt
itude
(km
)
Troposphere
Stratosphere
Mesosphere
Thermosphere
Mesopause
Stratopause
Tropopause
Airglow & Meteoric LayersOH, O, Na, Fe, K, CaPMC
Ozone
AerosolsClouds
Aerosols in mesosphere(Mesospheric Clouds ~ 85 km):Rayleigh/Mie lidar, resonancefluorescence lidar (detuned)
Aerosols in upper stratosphere(Polar Stratospheric Clouds ~ 20km): Rayleigh/Mie lidar,resonance fluorescence lidar
Aerosols in lower stratosphereand troposphere: Rayleigh/Mieelastic-scattering lidar, Ramanscattering lidar, High-Spectral-Resolution Lidar (HSRL)
White light lidar in the future In all altitude range,
polarization & multi-wavelengthdetections help reveal aerosolmicrophysical properties
PSC
Aerosol Lidar Technique Comparison

HSRL High-Spectral-Resolution-Lidar (HSRL) is to measure the molecule
scattering separately from the aerosol scattering, utilizing the differentspectral distribution of the Rayleigh and Mie scattering.
AerosolScattering
MolecularScattering

Constituent Lidar Techniques
150 200 250 300 3500
20
40
60
80
100
120
MSIS90 Temperature
Temperature (K)
Alt
itude
(km
)
Troposphere
Stratosphere
Mesosphere
Thermosphere
Mesopause
Stratopause
Tropopause
Meteoric Metal LayersNa, Fe, K, Ca, Li, Mg, etc
Ozone
He and N2+ in thermosphere:
resonance fluorescence lidar O in thermosphere: resonance
fluorescence lidar or DIAL fromspace
Metal atoms in 75-120km:resonance fluorescence lidar(broadband or narrowbandtransmitter)
Molecular species in lowerstratosphere & troposphere:Differential absorption lidar(DIAL), Raman scattering lidar,Raman DIAL, RVR Raman DIAL,Multiwavelength DIAL
The key is to use spectroscopydetection for distinguish species.
H2OO3SO2etc
Constituent Lidar Techniques

Comparison of Constituent Lidar Tech
Range-Resolved spatial & temporal distribution of these species, density, temp, wind and waves
Species, DensityTrace gas absorption inthe extinction terms
Elastic scattering from airmolecules and aerosols
MultiwavelengthDIAL
Species, DensityTrace gas absorption inthe extinction terms
Pure rotational Raman scatteringfrom N2 or O2 and Vibrational-Rotational Raman scattering fromN2 or O2
RVR Raman DIAL
Species, DensityTrace gas absorption inthe extinction terms
Inelastic Raman scattering fromN2 or O2
Raman DIAL
Species, Density,Mixing ratio
Trace gas scattering inthe backscatter terms,
Trace gas absorption inthe extinction terms
Inelastic Raman scattering fromtrace gas and reference N2 or O2
(no aerosol scattering)
Raman Lidar
Species, DensityTrace gas absorption inthe extinction terms
Elastic-scattering from airmolecules and aerosols
Conventional DIAL
Density, Temp
Wind, etc
Resonance fluorescence from He, N2+, O in thermosphereResonance
Fluorescence Lidar
Temp, Wind,Density, Wave
Resonance fluorescence from metal atoms in middle andupper atmosphere
ResonanceFluorescence Lidar
InterestsSignal Source & Trace GasTechnique

Target Lidar Techniques Target lidars, including fluorescence lidar, laser altimeter, hydrosphere
lidar, ladar, fish lidar, etc, are an variant of atmospheric lidars. Theyshare some of the same techniques used in atmospheric lidars.
Laser altimeter and ladar use time-of-flight to determine the rangeof objects or surface. Many factors are involved.
Fluorescence is used to measure organic materials, plants.
Raman scattering by water is used to normalize the lidar returns.
Target lidars face some different challenges and difficulties thanatmospheric lidars. These challenges and difficulties also determines thegrowing points in this field.
Target lidars have been deployed on different platforms for variousapplications. More efficient and compact target lidars on platforms likeUAV, promise more applications.

Laser Induced Fluorescence Lidar In contrast to free atoms and molecules,
solids and liquids exhibit broad absorption andemission spectra because of the strongintermolecular interactions.
A fixed frequency laser can be used forthe excitation due to the broad absorption.
Following the excitation, there is a veryfast (ps) radiationless relaxation down to thelowest sub-level of the excited state, wherethe molecules remain for a typical excited-state fluorescence lifetime.
The decay then occurs to different sub-levels of the ground state giving rise to adistribution of fluorescence light, whichreflect the lower-state level distribution.
Fixing the excitation wavelength, we canobtain fluorescence spectra. While fixing thedetection channel and varying the excitationwavelength, an excitation spectrum can berecorded.

Laser Altimeter (Laser Ranging) The time-of-flight
information from a lidarsystem can be used forlaser altimetry fromairborne or spaceborneplatforms to measure theheights of surfaces withhigh resolution andaccuracy.
The reflected pulsesfrom the solid surface(earth ground, ice sheet,etc) dominant the returnsignals, which allow adetermination of the time-of-flight to much higherresolution than the pulseduration time.

Accuracy versus Precision The accuracy of an experiment is a measure of how close the result of
the experiment is to the true value.
The precision is a measure of how well the result has been determined,without reference to its agreement with the true value. The precision isalso a measure of the reproducibility of the result in a given experiment.
Accuracy concerns about bias, i.e., how far away is the measurementresult from the true value? Precision concerns about uncertainty, i.e.,how certain or how sure are we about the measurement result?
Accuracy(Bias)
Precision(Uncertainty)
Systematic Errors Random Errors
x0
xm
Precise, butNot Accurate
Accurate, butNot Precise
xn
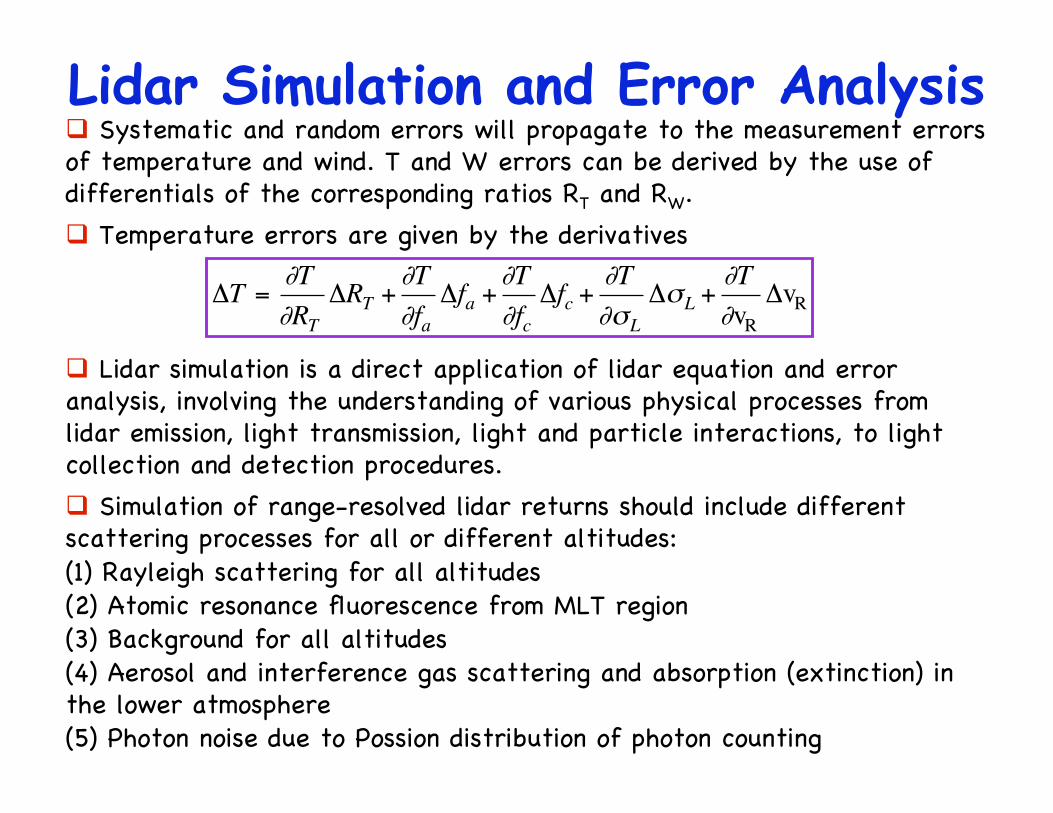
Lidar Simulation and Error Analysis Systematic and random errors will propagate to the measurement errors
of temperature and wind. T and W errors can be derived by the use ofdifferentials of the corresponding ratios RT and RW.
Temperature errors are given by the derivatives
T =T
RTRT +
T
fafa +
T
fcfc +
T
LL +
T
vRvR
Lidar simulation is a direct application of lidar equation and erroranalysis, involving the understanding of various physical processes fromlidar emission, light transmission, light and particle interactions, to lightcollection and detection procedures.
Simulation of range-resolved lidar returns should include differentscattering processes for all or different altitudes:(1) Rayleigh scattering for all altitudes(2) Atomic resonance fluorescence from MLT region(3) Background for all altitudes(4) Aerosol and interference gas scattering and absorption (extinction) inthe lower atmosphere(5) Photon noise due to Possion distribution of photon counting

Summary and Outlook Lidar remote sensing is an advanced technology that is not only
replacing conventional sensors in science study, environmental research,and industry application, but also creating new methods with uniqueproperties that could not be achieved before.
Lidar technology has been advanced dramatically in the past 20 years,owing to the new availability of lasers, detectors, creative people involved,and the demanding needs from various aspects.
Potential growing points at this stage include
(1) Solid-state resonance fluorescence lidar for mobile deployment globally
(2) Extend measurement range into thermosphere and lower mesosphere
(3) Doppler, DIAL, HSRL, and Raman lidar for lower atmosphere research
(4) Target lidar for novel applications
Always keep eyes open for new potentials: principles, phenomena,effects to be applied in lidar and optical remote sensing.
The exciting and growing lidar field is anxious for new “blood” - thecreative, intelligent, diligent, and passionate young researchers.