lecture 6: gwas in samples with structure
TRANSCRIPT
Lecture 6: GWAS in Samples with Structure
Lecture 6: GWAS in Samples with Structure
Timothy Thornton and Michael Wu
Summer Institute in Statistical Genetics 2015
1 / 25
Lecture 6: GWAS in Samples with Structure
Introduction
I Genetic association studies are widely used for theidentification of genes that influence complex traits.
I To date, hundreds of thousands of individuals have beenincluded in genome-wide association studies (GWAS) for themapping of both dichotomous and quantitative traits.
I Large-scale genomic studies often have high-dimensional dataconsisting of
I Tens of thousands of individualsI Genotypes data on a million (or more!) SNPs for all individuals
in the studyI Phenotype or Trait values of interest such as Height, BMI,
HDL cholesterol, blood pressure, diabetes, etc.
2 / 25
Lecture 6: GWAS in Samples with Structure
Introduction
I The vast majority of these studies have been conducted inpopulations of European ancestry
I Non-European populations have largely been underrepresentedin genetic studies, despite often bearing a disproportionatelyhigh burden for some diseases.
I Recent genetic studies have investigated more diversepopulations.
3 / 25
Lecture 6: GWAS in Samples with Structure
Case-Control Association Testing
I The observations in association studies can be confounded bypopulation structure
I Population structure: the presence of subgroups in thepopulation with ancestry differences
I Neglecting or not accounting for ancestry differences amongsample individuals can lead to false positive or spuriousassociations!
I This is a serious concern for all genetic association studies.
4 / 25
Lecture 6: GWAS in Samples with Structure
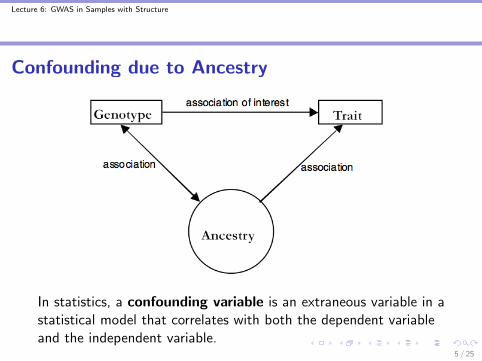
Confounding due to Ancestry
In statistics, a confounding variable is an extraneous variable in astatistical model that correlates with both the dependent variableand the independent variable.
5 / 25
Lecture 6: GWAS in Samples with Structure
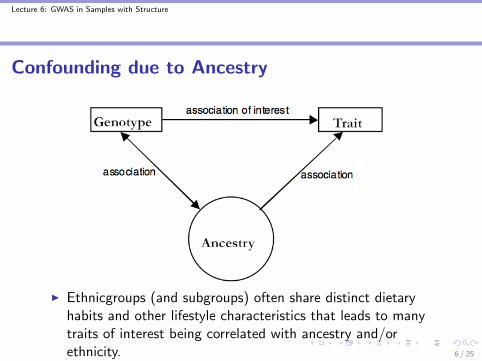
Confounding due to Ancestry
I Ethnicgroups (and subgroups) often share distinct dietaryhabits and other lifestyle characteristics that leads to manytraits of interest being correlated with ancestry and/orethnicity. 6 / 25
Lecture 6: GWAS in Samples with Structure
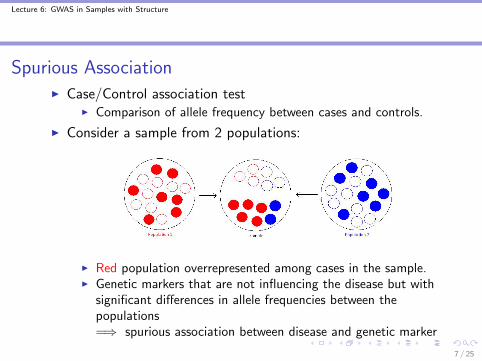
Spurious AssociationI Case/Control association test
I Comparison of allele frequency between cases and controls.
I Consider a sample from 2 populations:
I Red population overrepresented among cases in the sample.I Genetic markers that are not influencing the disease but with
significant differences in allele frequencies between thepopulations=⇒ spurious association between disease and genetic marker
7 / 25
Lecture 6: GWAS in Samples with Structure
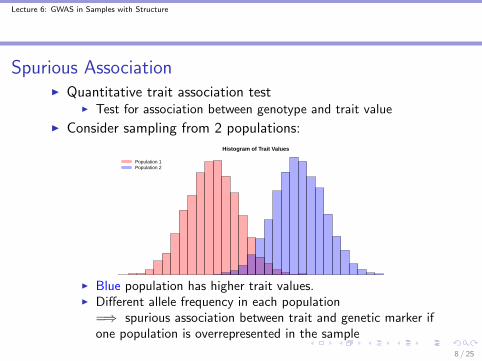
Spurious AssociationI Quantitative trait association test
I Test for association between genotype and trait value
I Consider sampling from 2 populations:Histogram of Trait Values
Population 1Population 2
I Blue population has higher trait values.I Different allele frequency in each population
=⇒ spurious association between trait and genetic marker ifone population is overrepresented in the sample
8 / 25
Lecture 6: GWAS in Samples with Structure
Genotype and Phenotype Data
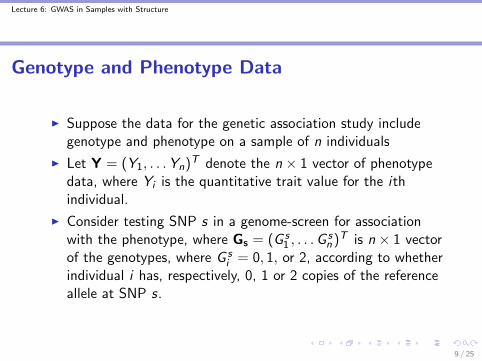
I Suppose the data for the genetic association study includegenotype and phenotype on a sample of n individuals
I Let Y = (Y1, . . .Yn)T denote the n × 1 vector of phenotypedata, where Yi is the quantitative trait value for the ithindividual.
I Consider testing SNP s in a genome-screen for associationwith the phenotype, where Gs = (G s
1 , . . .Gsn )T is n × 1 vector
of the genotypes, where G si = 0, 1, or 2, according to whether
individual i has, respectively, 0, 1 or 2 copies of the referenceallele at SNP s.
9 / 25
Lecture 6: GWAS in Samples with Structure
Genomic Control
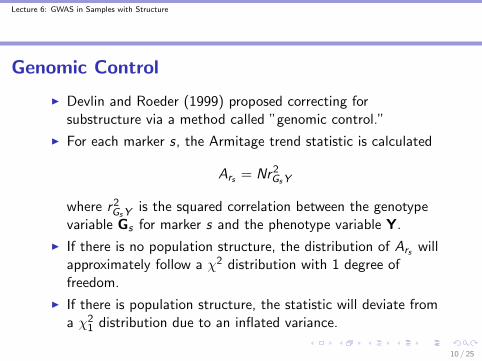
I Devlin and Roeder (1999) proposed correcting forsubstructure via a method called ”genomic control.”
I For each marker s, the Armitage trend statistic is calculated
Ars = Nr2GsY
where r2GsYis the squared correlation between the genotype
variable Gs for marker s and the phenotype variable Y.
I If there is no population structure, the distribution of Ars willapproximately follow a χ2 distribution with 1 degree offreedom.
I If there is population structure, the statistic will deviate froma χ2
1 distribution due to an inflated variance.
10 / 25
Lecture 6: GWAS in Samples with Structure
Genomic Control
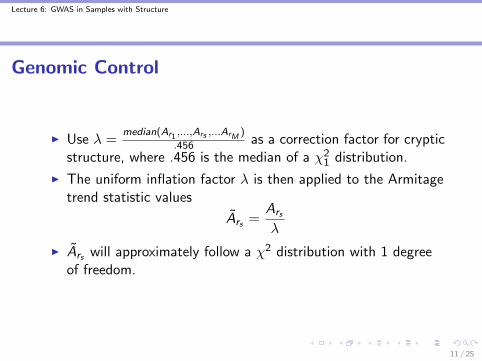
I Use λ =median(Ar1 ,...,Ars ,...ArM
)
.456 as a correction factor for crypticstructure, where .456 is the median of a χ2
1 distribution.
I The uniform inflation factor λ is then applied to the Armitagetrend statistic values
Ars =Ars
λ
I Ars will approximately follow a χ2 distribution with 1 degreeof freedom.
11 / 25
Lecture 6: GWAS in Samples with Structure
Correcting for Population Structure with PCA
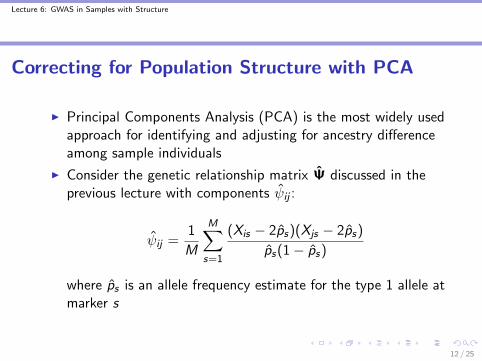
I Principal Components Analysis (PCA) is the most widely usedapproach for identifying and adjusting for ancestry differenceamong sample individuals
I Consider the genetic relationship matrix Ψ discussed in theprevious lecture with components ψij :
ψij =1
M
M∑s=1
(Xis − 2ps)(Xjs − 2ps)
ps(1− ps)
where ps is an allele frequency estimate for the type 1 allele atmarker s
12 / 25
Lecture 6: GWAS in Samples with Structure
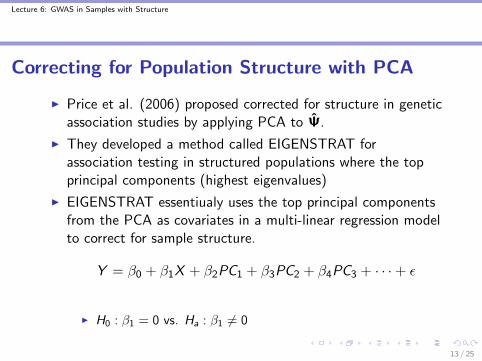
Correcting for Population Structure with PCA
I Price et al. (2006) proposed corrected for structure in geneticassociation studies by applying PCA to Ψ.
I They developed a method called EIGENSTRAT forassociation testing in structured populations where the topprincipal components (highest eigenvalues)
I EIGENSTRAT essentiualy uses the top principal componentsfrom the PCA as covariates in a multi-linear regression modelto correct for sample structure.
Y = β0 + β1X + β2PC1 + β3PC2 + β4PC3 + · · ·+ ε
I H0 : β1 = 0 vs. Ha : β1 6= 0
13 / 25
Lecture 6: GWAS in Samples with Structure
Samples with Population Structure and Relatedness
I The EIGENSTRAT methods was developed for unrelatedsamples with population structure
I Methods may not be valid in samples with related individuals(known and/or unknown)
I Many genetic studies have samples with related individuals
14 / 25
Lecture 6: GWAS in Samples with Structure
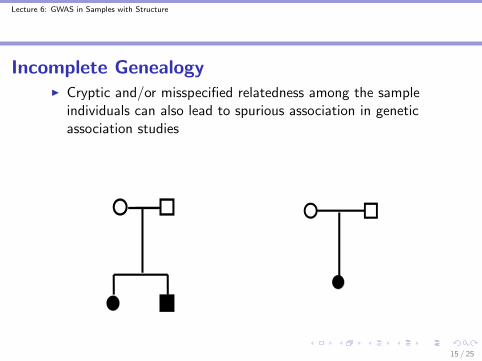
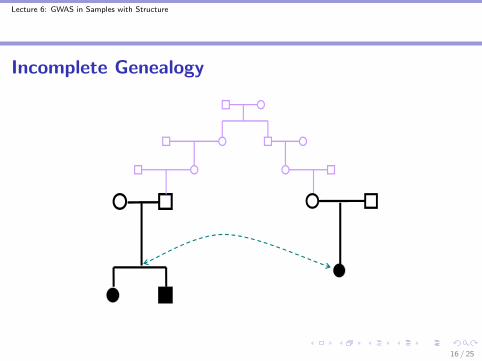
Incomplete GenealogyI Cryptic and/or misspecified relatedness among the sample
individuals can also lead to spurious association in geneticassociation studies
15 / 25
Lecture 6: GWAS in Samples with Structure
Incomplete Genealogy
16 / 25
Lecture 6: GWAS in Samples with Structure
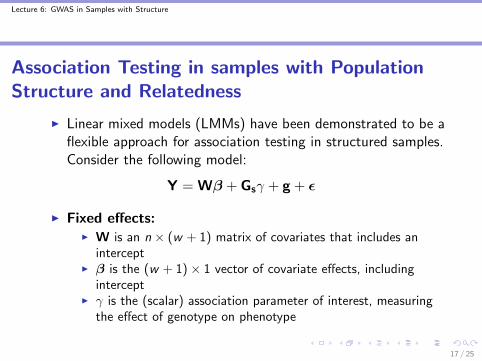
Association Testing in samples with PopulationStructure and Relatedness
I Linear mixed models (LMMs) have been demonstrated to be aflexible approach for association testing in structured samples.Consider the following model:
Y = Wβ + Gsγ + g + ε
I Fixed effects:I W is an n × (w + 1) matrix of covariates that includes an
interceptI β is the (w + 1)× 1 vector of covariate effects, including
interceptI γ is the (scalar) association parameter of interest, measuring
the effect of genotype on phenotype
17 / 25
Lecture 6: GWAS in Samples with Structure
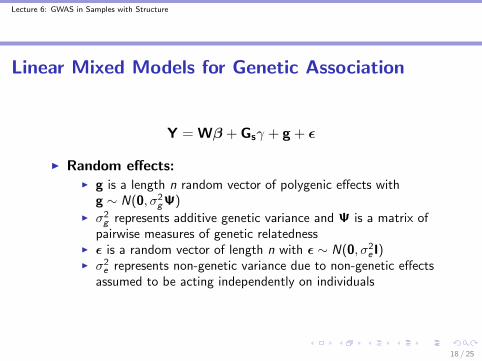
Linear Mixed Models for Genetic Association
Y = Wβ + Gsγ + g + ε
I Random effects:I g is a length n random vector of polygenic effects with
g ∼ N(0, σ2gΨ)
I σ2g represents additive genetic variance and Ψ is a matrix of
pairwise measures of genetic relatednessI ε is a random vector of length n with ε ∼ N(0, σ2
e I)I σ2
e represents non-genetic variance due to non-genetic effectsassumed to be acting independently on individuals
18 / 25
Lecture 6: GWAS in Samples with Structure
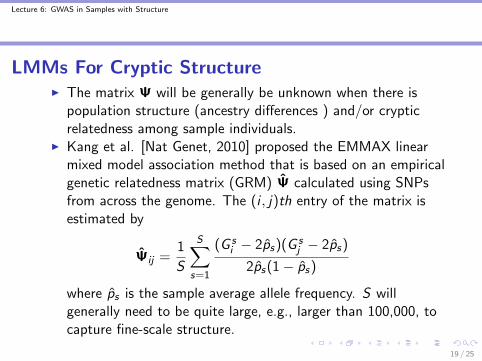
LMMs For Cryptic StructureI The matrix Ψ will be generally be unknown when there is
population structure (ancestry differences ) and/or crypticrelatedness among sample individuals.
I Kang et al. [Nat Genet, 2010] proposed the EMMAX linearmixed model association method that is based on an empiricalgenetic relatedness matrix (GRM) Ψ calculated using SNPsfrom across the genome. The (i , j)th entry of the matrix isestimated by
Ψij =1
S
S∑s=1
(G si − 2ps)(G s
j − 2ps)
2ps(1− ps)
where ps is the sample average allele frequency. S willgenerally need to be quite large, e.g., larger than 100,000, tocapture fine-scale structure.
Kang, Hyun Min, et al. (2010) ”Variance component model to account forsample structure in genome-wide association studies.” Nature genetics 42
19 / 25
Lecture 6: GWAS in Samples with Structure
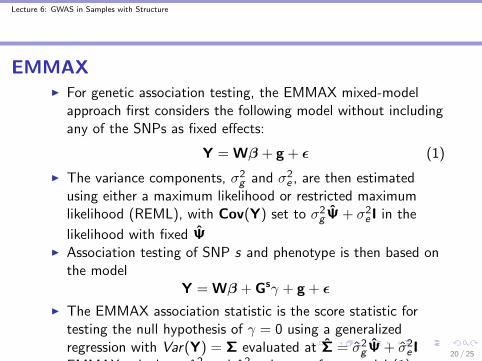
EMMAXI For genetic association testing, the EMMAX mixed-model
approach first considers the following model without includingany of the SNPs as fixed effects:
Y = Wβ + g + ε (1)
I The variance components, σ2g and σ2e , are then estimatedusing either a maximum likelihood or restricted maximumlikelihood (REML), with Cov(Y) set to σ2gΨ + σ2e I in the
likelihood with fixed ΨI Association testing of SNP s and phenotype is then based on
the modelY = Wβ + Gsγ + g + ε
I The EMMAX association statistic is the score statistic fortesting the null hypothesis of γ = 0 using a generalizedregression with Var(Y) = Σ evaluated at Σ = σ2gΨ + σ2e I
I EMMAX calculates σ2g and σ2e only once from model (1) toreduce computational burden.
20 / 25
Lecture 6: GWAS in Samples with Structure
GEMMA
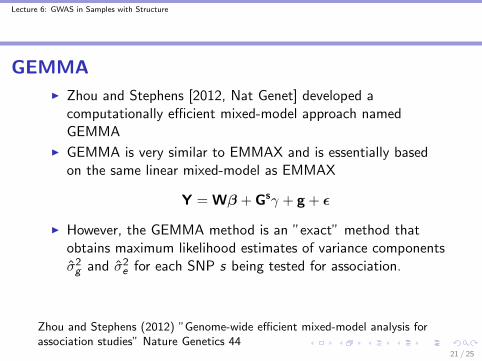
I Zhou and Stephens [2012, Nat Genet] developed acomputationally efficient mixed-model approach namedGEMMA
I GEMMA is very similar to EMMAX and is essentially basedon the same linear mixed-model as EMMAX
Y = Wβ + Gsγ + g + ε
I However, the GEMMA method is an ”exact” method thatobtains maximum likelihood estimates of variance componentsσ2g and σ2e for each SNP s being tested for association.
Zhou and Stephens (2012) ”Genome-wide efficient mixed-model analysis forassociation studies” Nature Genetics 44
21 / 25
Lecture 6: GWAS in Samples with Structure
Other LMM approachsI A number of similar linear mixed-effects methods have
recently been proposed when there is cryptic structure: Zhangat al. [2010, Nat Genet], Lippert et al. [2011, Nat Methods],Zhou & Stephens [2012, Nat Genet], and Svishcheva [2012,Nat, Genet], and others.
22 / 25
Lecture 6: GWAS in Samples with Structure
ROADTRIPS for Dichotomous Phenotypes
I Similar to LMMs, the ROADTRIPS approach of Thornton andMcPeek (2010) also incorporates an empirical covariancematrix Ψ .
I ROADTRIPS was developed for valid association testing incase-control samples with partially or completely unknownpopulation and pedigree structure
I ROADTRIPS extensions, to samples with structure, have beendeveloped for a number of association tests including Pearsonχ2 test and the Armitage trend test
23 / 25
Lecture 6: GWAS in Samples with Structure
References
I Devlin B, Roeder K (1999). Genomic control for associationstudies. Biometrics 55, 997-1004.
I Kang, H. M., Sul, J. H., Service, S. K., Zaitlen, N. A., Kong,S.Y., Freimer, N. B., Sabatti, C. Eskin, E. (2010) Variancecomponent model to account for sample structure ingenome-wide association studies. Nat Genet 42, 348-354.
I Price AL, Patterson NJ, Plenge RM, Weinblatt ME, ShadickNA, Reich D (2006). Principal components analysis correctsfor stratification in genome-wide association studies. Nat.Genet. 38, 904-909.
24 / 25
Lecture 6: GWAS in Samples with Structure
References
I Thornton, T., McPeek, M.S. (2010). ROADTRIPS:Case-Control Association Testing with Partially or CompletelyUnknown Population and Pedigree Structure. Am. J. Hum.Genet. 86, 172-184.
I Zhou, X., Stephens, M. (2012). Genome-wide efficientmixed-model analysis for association studies. Nature Genetics44,821-824.
25 / 25