lecture 6 protein function and enzyme kinetics. enzymes lower the energy of activation
TRANSCRIPT
Lecture 6
Protein function and enzyme kinetics
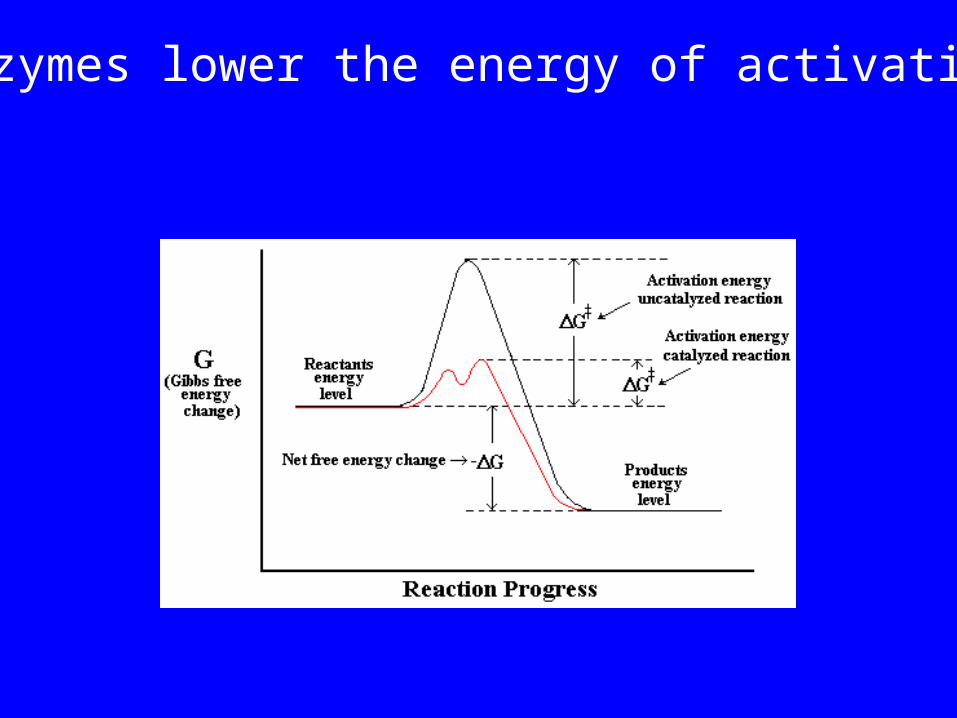
Enzymes lower the energy of activation

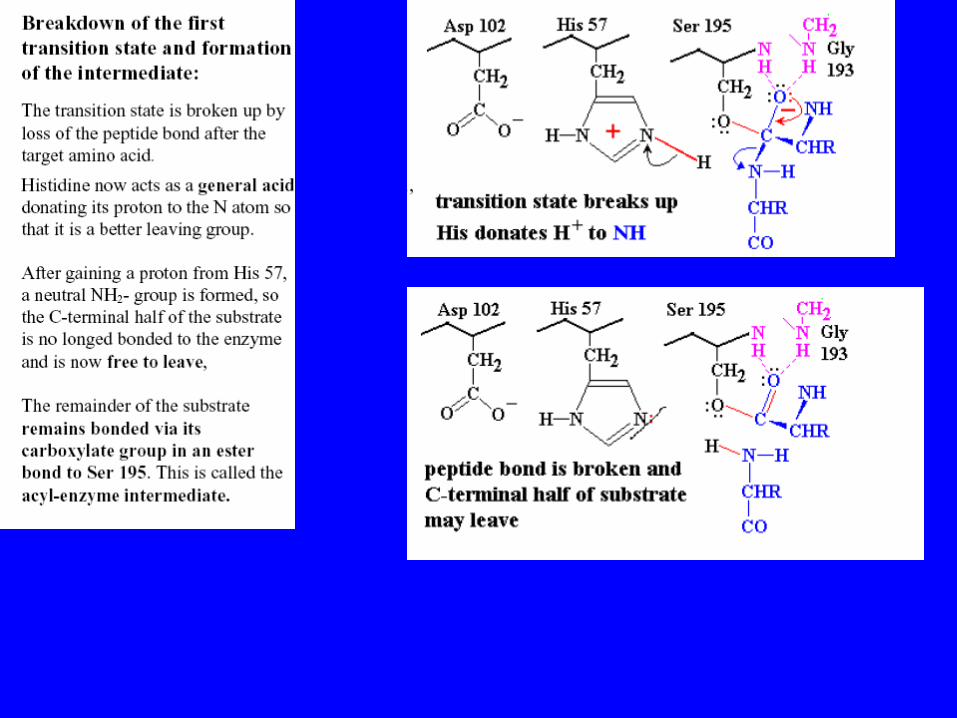
Transition State Stabilization by Chymotrypsin
• Structure of ts stabilized
• Stability lower energy
• Lower energy decreases G*
• Decreased G* increased rate


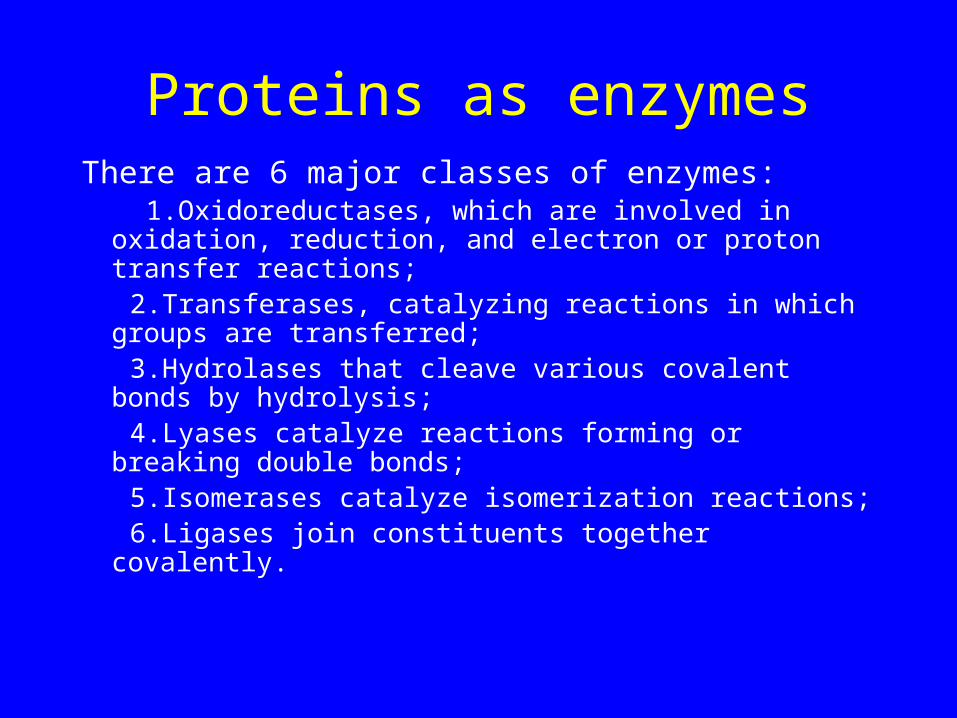
Proteins as enzymesThere are 6 major classes of enzymes: 1.Oxidoreductases, which are involved in oxidation,
reduction, and electron or proton transfer reactions; 2.Transferases, catalyzing reactions in which groups are
transferred; 3.Hydrolases that cleave various covalent bonds by
hydrolysis; 4.Lyases catalyze reactions forming or breaking double
bonds; 5.Isomerases catalyze isomerization reactions; 6.Ligases join constituents together covalently.

Enzymes fall into classes based on function
• There are 6 major classes of enzymes:
1.Oxidoreductases which are involved in oxidation, reduction, and electron or proton transfer reactions;
2.Transferases, catalysing reactions in which groups are transferred;
3.Hydrolases which cleave various covalent bonds by hydrolysis; 4
4.Lyases catalyse reactions forming or breaking double bonds;
5.Isomerases catalyse isomerisation reactions;
6.Ligases join substituents together covalently.
Enzyme Kinetics
• Enzymes are protein catalysts that, like all catalysts, speed up the rate of a chemical reaction without being used up in the process.

Enzyme reaction rates are determined by several factors.
• the concentration of substrate molecules (the more of them available, the quicker the enzyme molecules collide and bind with them). The concentration of substrate is designated [S] and is expressed in unit of molarity.
• the temperature. As the temperature rises, molecular motion - and hence collisions between enzyme and substrate - speed up. But as enzymes are proteins, there is an upper limit beyond which the enzyme becomes
denatured and ineffective.

Enzymes cont.
• the presence of inhibitors.
– competitive inhibitors are molecules that bind to the same site as the substrate - preventing the substrate from binding as they do so - but are not changed by the enzyme.
– noncompetitive inhibitors are molecules that bind to some other site on the enzyme reducing its catalytic power.
• pH. The conformation of a protein is influenced by pH and as enzyme activity is crucially dependent on its conformation, its activity is likewise affected.

How we determine how fast an enzyme works
• We set up a series of tubes containing graded concentrations of substrate, [S] . At time zero, we add a fixed amount of the enzyme preparation.
• Over the next few minutes, we measure the concentration of product formed. If the product absorbs light, we can easily do this in a spectrophotometer.
• Early in the run, when the amount of substrate is in substantial excess to the amount of enzyme, the rate we observe is the initial velocity of Vi.
Mechaelis Menton kinetics• Plotting Vi as a function of [S], we find that
• At low values of [S], the initial velocity,Vi, rises almost linearly with increasing [S].
• But as [S] increases, the gains in Vi level off (forming a rectangular hyperbola).
• The asymptote represents the maximum velocity of the reaction, designated Vmax
• The substrate concentration that produces a Vi that is one-half of Vmax is designated the Michaelis-Menten constant, Km(named after the scientists who developed the study of enzyme kinetics).
• Km is (roughly) an inverse measure of the affinity or strength of binding between the enzyme and its substrate. The lower the Km, the greater the affinity (so the lower the concentration of substrate needed to achieve a given rate).

Plotting out our data it might look like this.
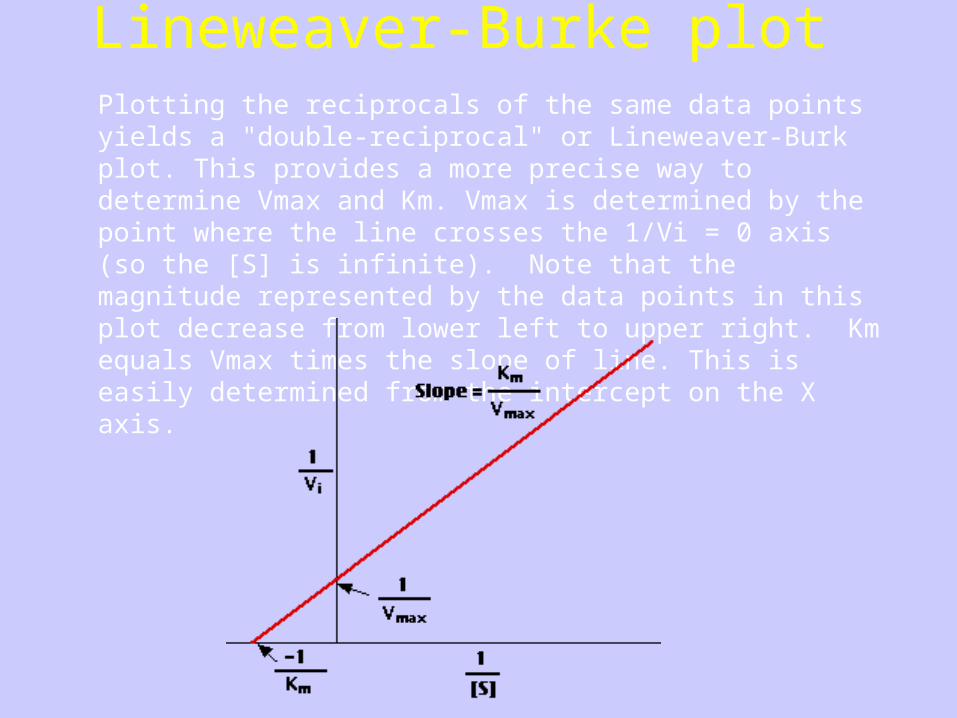
Lineweaver-Burke plotPlotting the reciprocals of the same data points yields a "double-reciprocal" or Lineweaver-Burk plot. This provides a more precise way to determine Vmax and Km. Vmax is determined by the point where the line crosses the 1/Vi = 0 axis (so the [S] is infinite). Note that the magnitude represented by the data points in this plot decrease from lower left to upper right. Km equals Vmax times the slope of line. This is easily determined from the intercept on the X axis.

Competitive inhibitors• Enzymes can be inhibited competitively, when the substrate
and inhibitor compete for binding to the same active site or noncompetitively, when the inhibitor binds somewhere else on the enzyme molecule reducing its efficiency.
• The distinction can be determined by plotting enzyme activity with and without the inhibitor present.
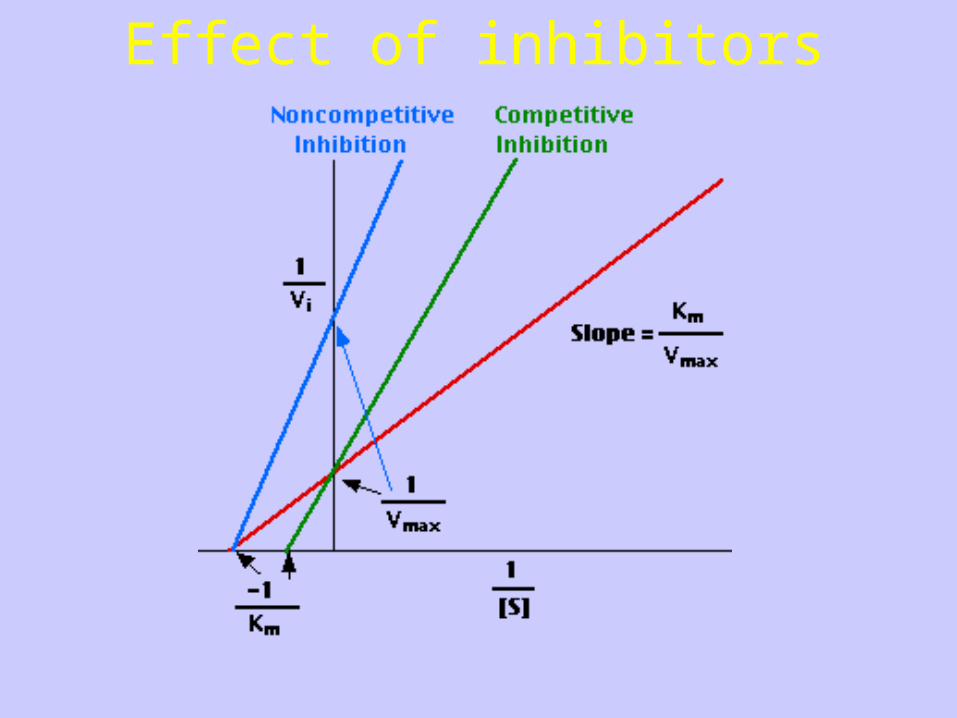
• Competitive Inhibition• In the presence of a competitive inhibitor, it takes a higher
substrate concentration to achieve the same velocities that• were reached in its absence. So while Vmax can still be
reached if sufficient substrate is available, one-half Vmax requires a higher [S] than before and thus Km is larger.

Non-competitive inhibitor
• With noncompetitive inhibition, enzyme molecules that have been bound by the inhibitor are taken out of the game so enzyme rate (velocity) is reduced for all values of [S], including Vmax and one-half Vmax but
• Km remains unchanged because the active site of those enzyme molecules that have not been inhibited is unchanged.

Competitive/noncompetitive inhibitor
Effect of inhibitors

How do proteins function?• Structural: Actin is an example it is a major
component of the cells architecture as well as the contractile apparatus
• Carriers: Hemoglobin is an example. It functions to carry O2 to tissue and eliminate CO2
• Regulatory: Transcription factors bind to DNA a control the level of mRNA that is produced
• Transport: EGFR-epithelial growth factor receptor. Binds EGF and signals for cell growth.
• Binders: Immunoglobulin proteins or antibodies- bind to foreign proteins and destroy infectious agents.
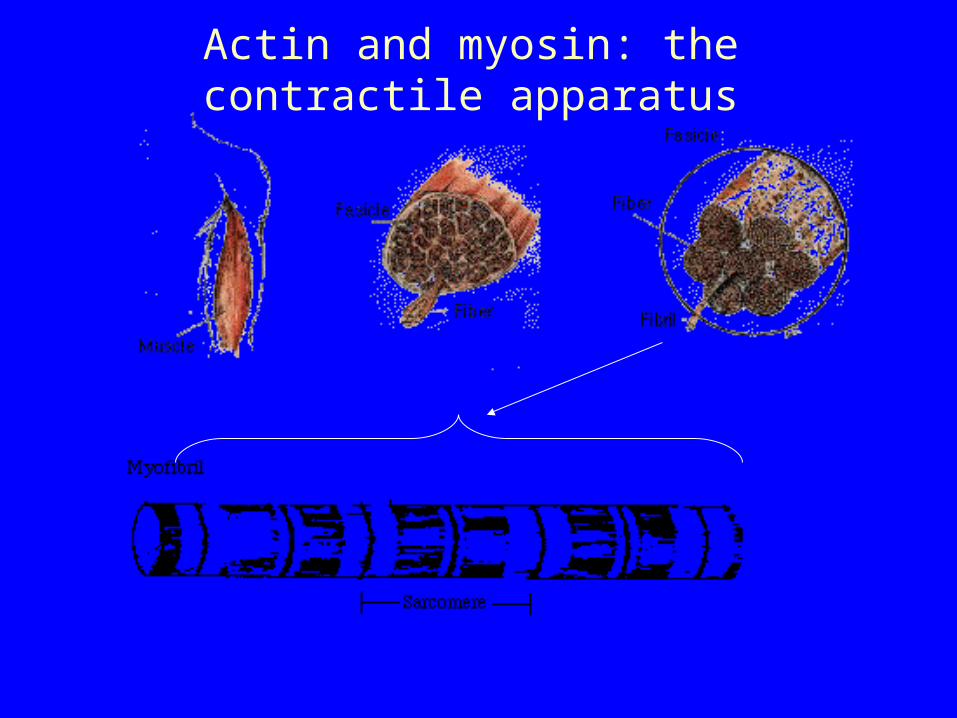
Actin and myosin: the contractile apparatus

Skeletal Muscle Cells

Skeletal Muscle Structure
• Muscle cells are formed by fusion of myoblasts
• Myofibrils are parallel arrays of long cylinders packed in the muscle cell
• Sarcomeres are symmetric repeating units from z-line to z-line in the myofibril
• Thick filaments are myosin filaments
• Thin filaments are actin filaments
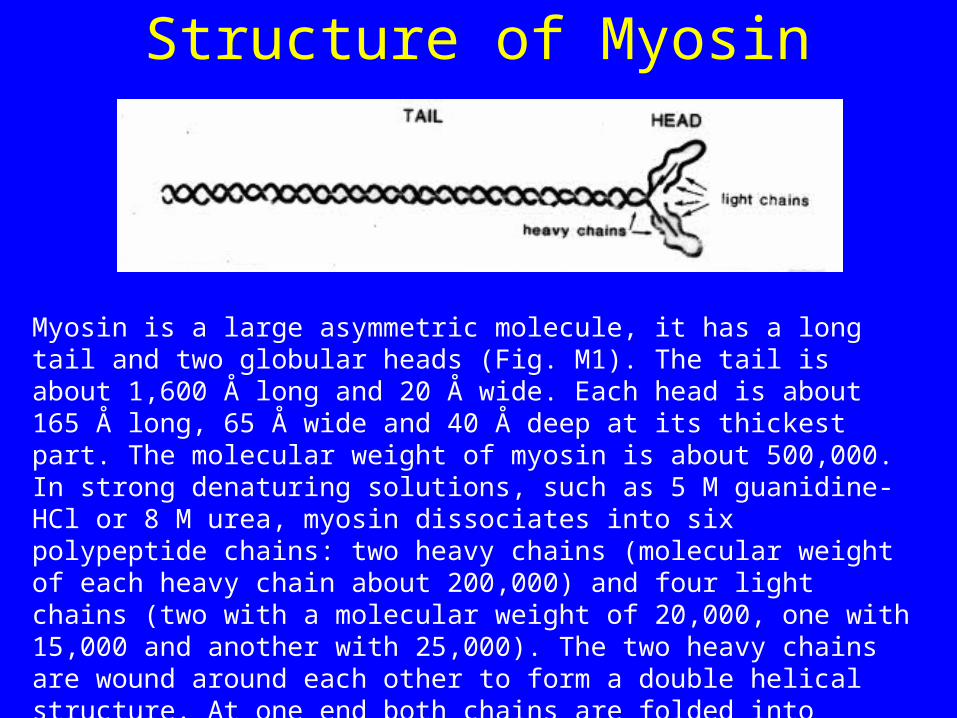
Structure of Myosin
Myosin is a large asymmetric molecule, it has a long tail and two globular heads (Fig. M1). The tail is about 1,600 Å long and 20 Å wide. Each head is about 165 Å long, 65 Å wide and 40 Å deep at its thickest part. The molecular weight of myosin is about 500,000. In strong denaturing solutions, such as 5 M guanidine-HCl or 8 M urea, myosin dissociates into six polypeptide chains: two heavy chains (molecular weight of each heavy chain about 200,000) and four light chains (two with a molecular weight of 20,000, one with 15,000 and another with 25,000). The two heavy chains are wound around each other to form a double helical structure. At one end both chains are folded into separate globular structures to form the two heads. In the muscle, the long tail portion forms the backbone of the thick filament and the heads protrude as crossbridges toward the thin filament. Each head contains two light chains.

More myosin structure
More details of the myosin structure. When myosin is exposed to the proteolyticenzyme trypsin, fragmentation occurs in the middle of the tail yielding heavy meromyosin (HMM, molecular weight about 350,000) and light meromyosin(LMM, molecular weight about 150,000) HMM containing the head and a short tail can be further split by proteolytic enzymes, such as papain, into subfragment 1 (S1,molecular weight about 110,000) and subfragment 2 (S2). The regions of proteolyticfragmentation may serve as hinges. HMM and S1 bind actin, hydrolyze ATP and are water-soluble. LMM has no sites for actin or ATP binding, but inherits the solubility of myosin in 0.6 M KCl and the self-assembling property of myosin in 0.03 M KCl. S2 is water-soluble. Myosin and its proteolytic fragments can be visualized by electronmicroscopy

Arrangement of Myosin Molecules in Thick Filaments
• bipolar polymer of myosin
• myosin tails align and point to center of sarcomere
• myosin heads arranged in a helical pattern pointing away from center
• myosin heads reach out from the thick filaments to contact the actin filaments
• contain ~300 molecules of myosin

Myosin filament
Thin Filaments
• actin filaments in the sarcomere are of fixed length
• actin filaments are cross-linked by -actinin at Z-line
• both ends of actin filaments are capped
• barbed ends are embedded at the Z-line
• tropomyosin and troponins bind along each filament

Structure of actin filament

Actin in detail

Actin structure• Folding of the actin molecule is represented by ribbon tracing of
the a-carbon atoms. N and C correspond to the amino- and carboxyl-terminals, respectively. The letters followed by numbers represent amino acids in the polypeptide chain. A hypothetical vertical line divides the actin molecule into two domains "large", left side, and "small", right side. ATP and Ca2+ are located between the two domains. These two domains can be subdivided further into two subdomains each, the small domain being composed of subdomains 1 and 2, and the 2 has significantly less mass than the other three subdomains and this is the reason of dividing actin into small and large domains). The four subdomains are held together and stabilized mainly by salt bridges and hydrogen bonds to the phosphate groups of the bound ATP and to its associated Ca2+ localized in the center of the molecule.

Actin domains
• 1. Where does it polymerize with actin?
• 2. Where does it interact with troponin and tropomyosin?
• 3. Where does it interact with myosin?
• 4. How could we answer this question?
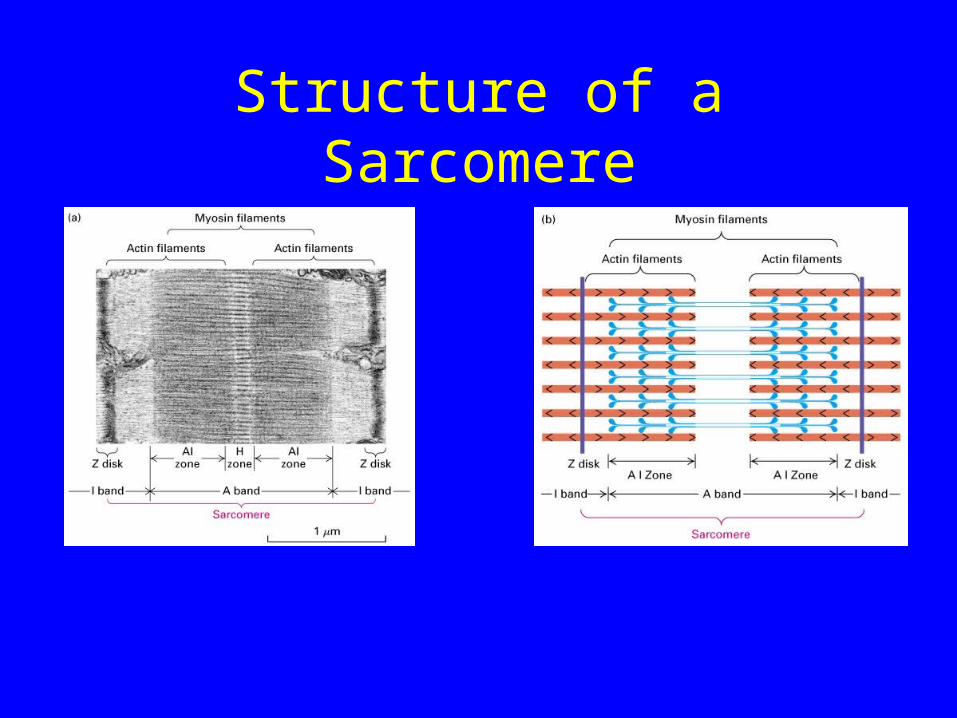
Structure of a Sarcomere

Muscle Contraction
Neither thick or thin filaments change length during muscle contraction, only the overlap between them changes, leading to changes of sarcomere length (z- to z distance)
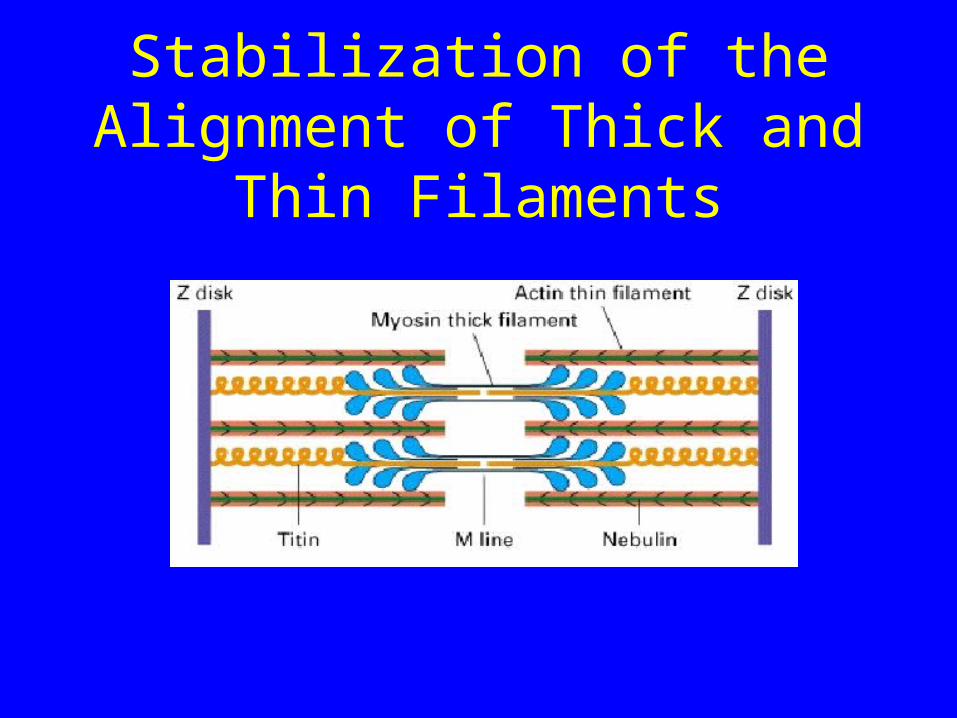
Stabilization of the Alignment of Thick and Thin Filaments
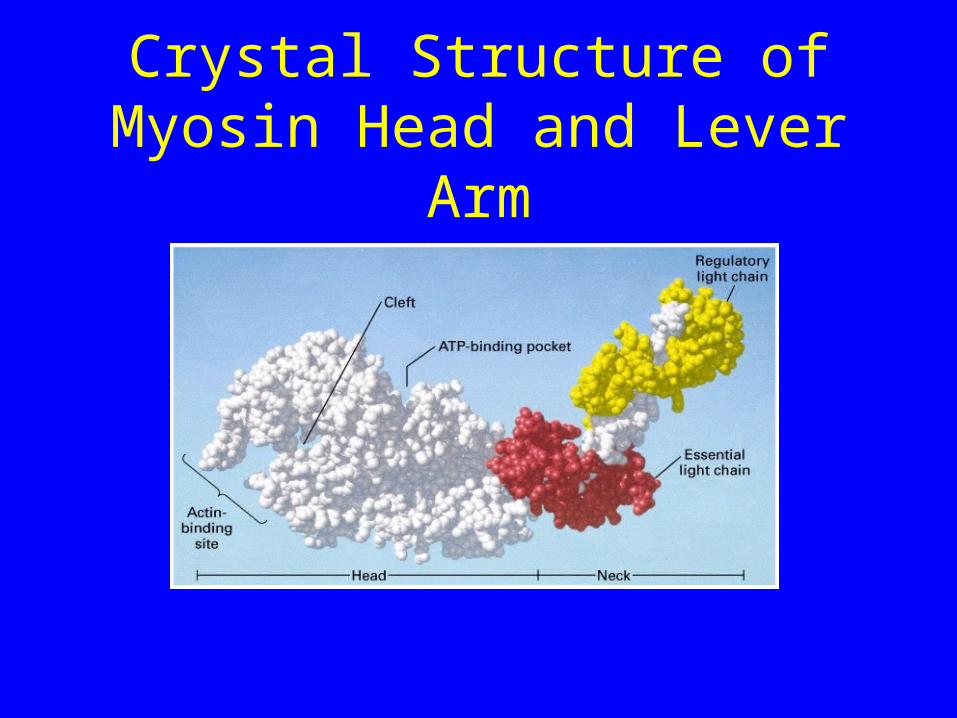
Crystal Structure of Myosin Head and Lever Arm
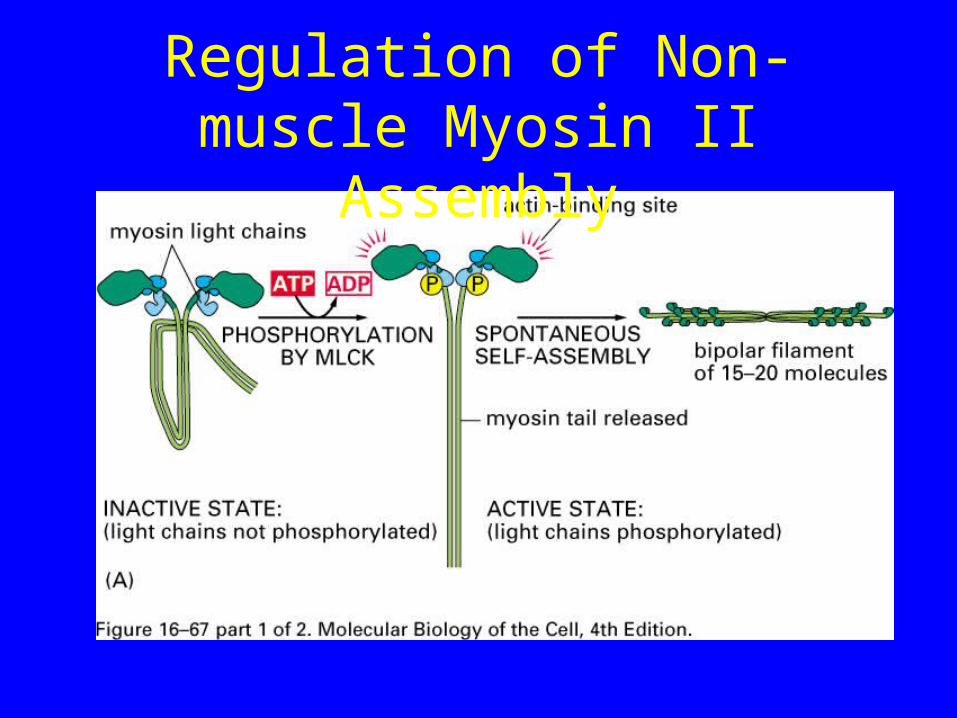
Regulation of Non-muscle Myosin II Assembly
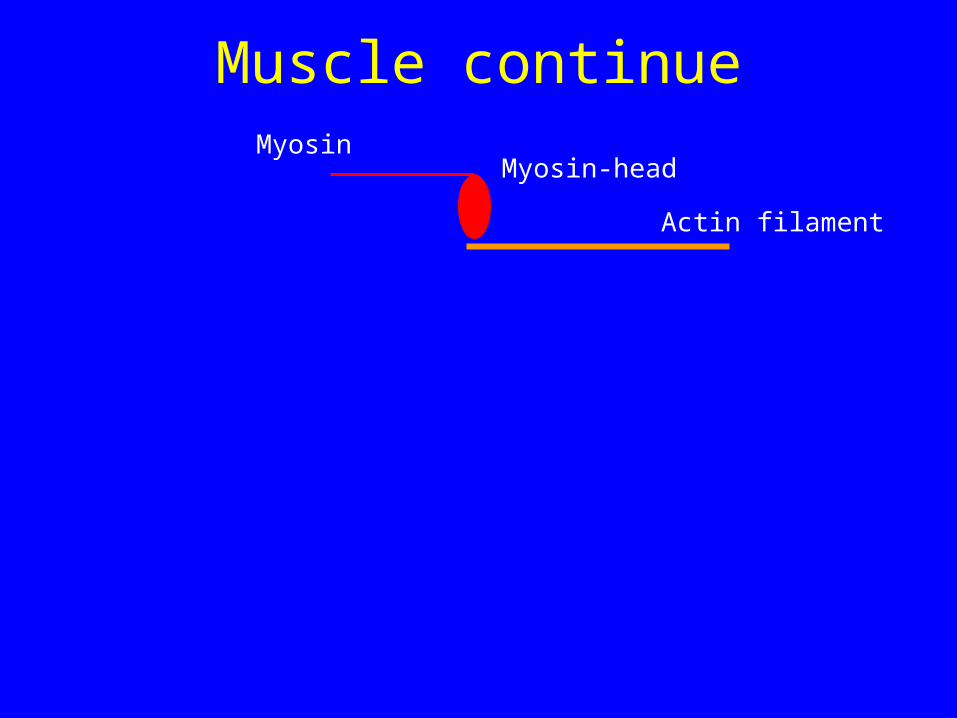
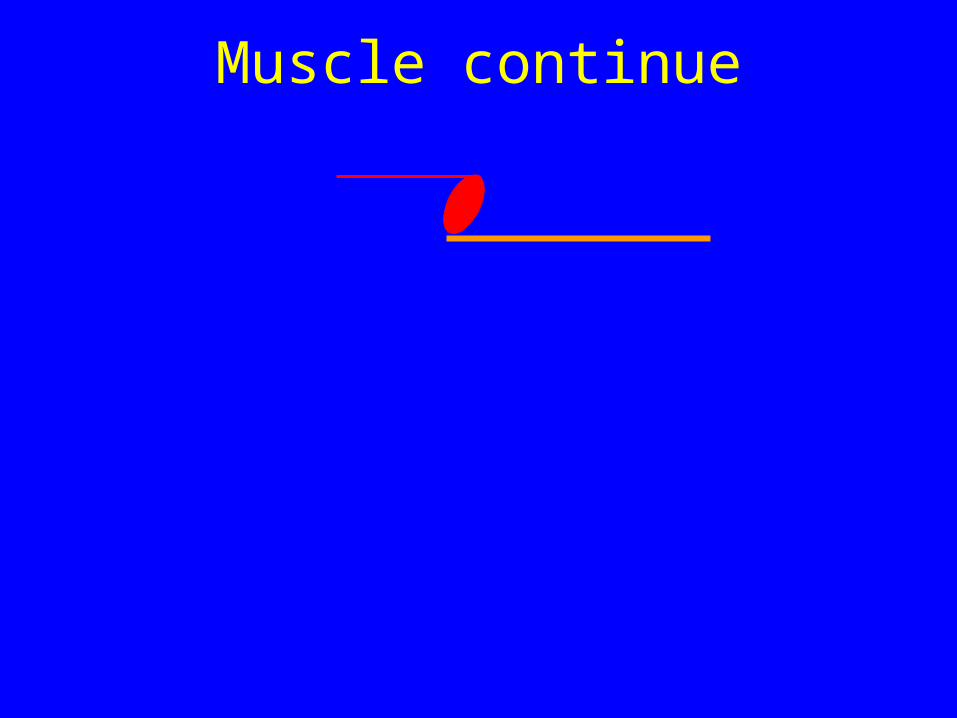
Muscle continueMyosin
Myosin-head
Actin filament

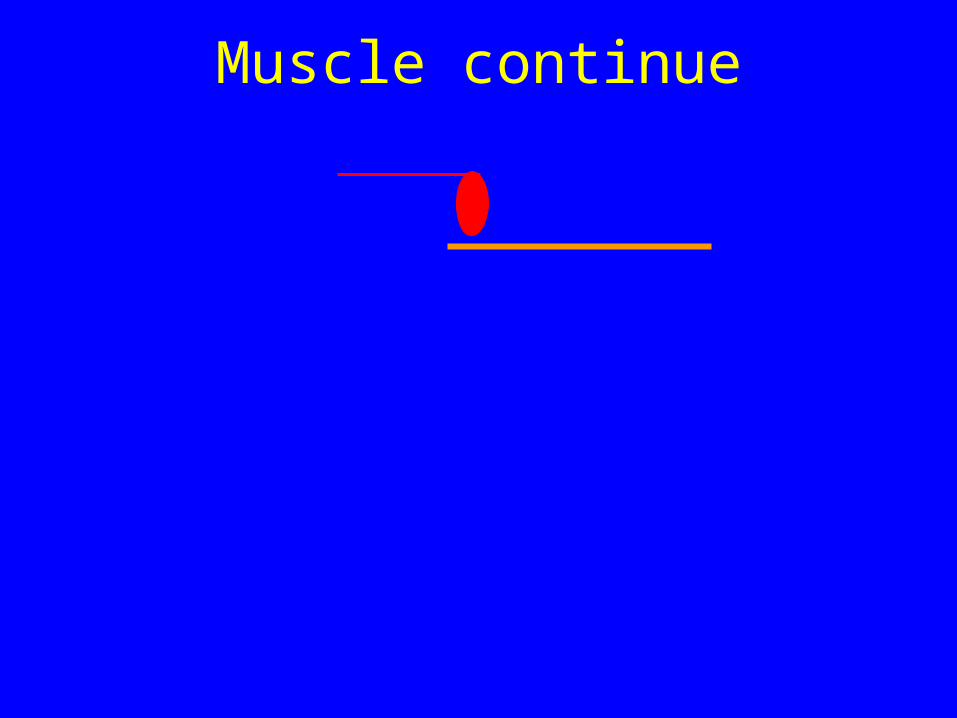
Muscle continue
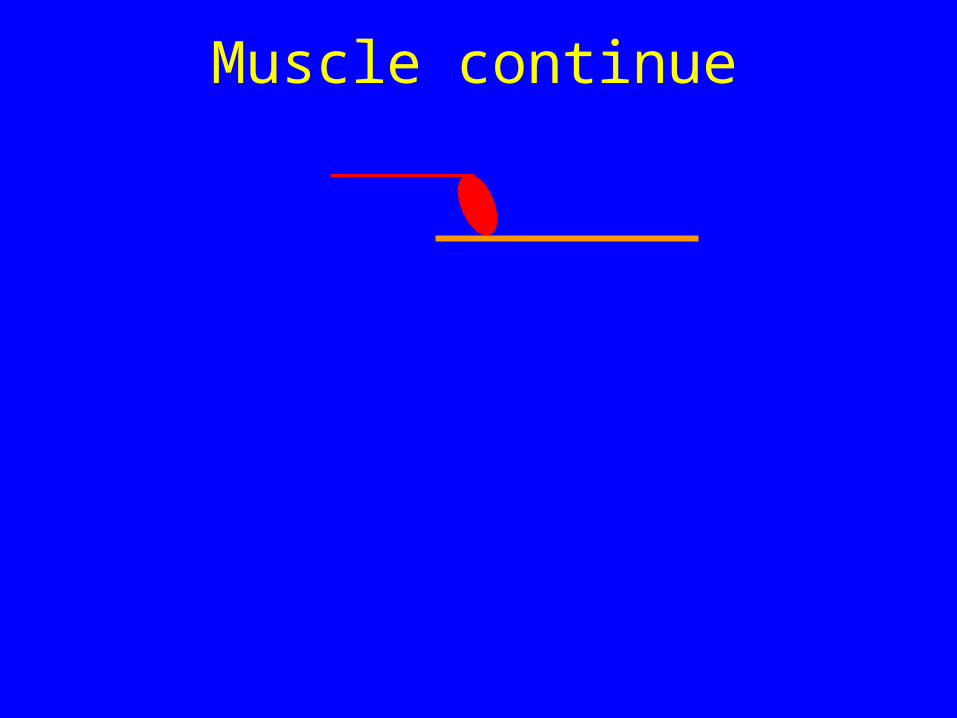
Muscle continue
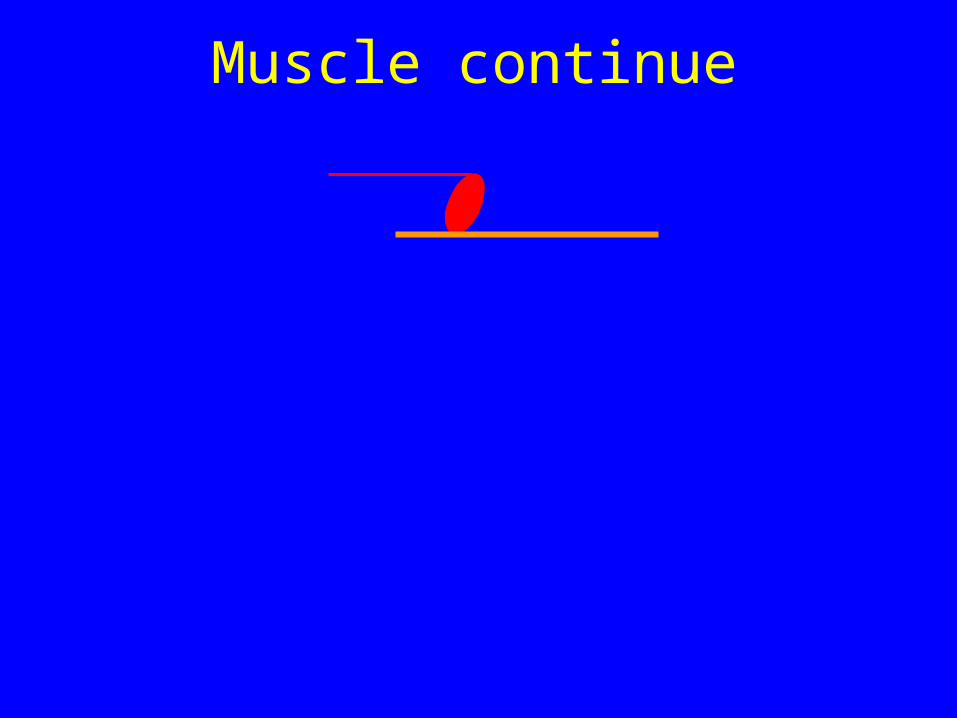
Muscle continue
Muscle continue

Muscle continue
Muscle continue

Muscle continue

Muscle continue

Myosin Superfamily
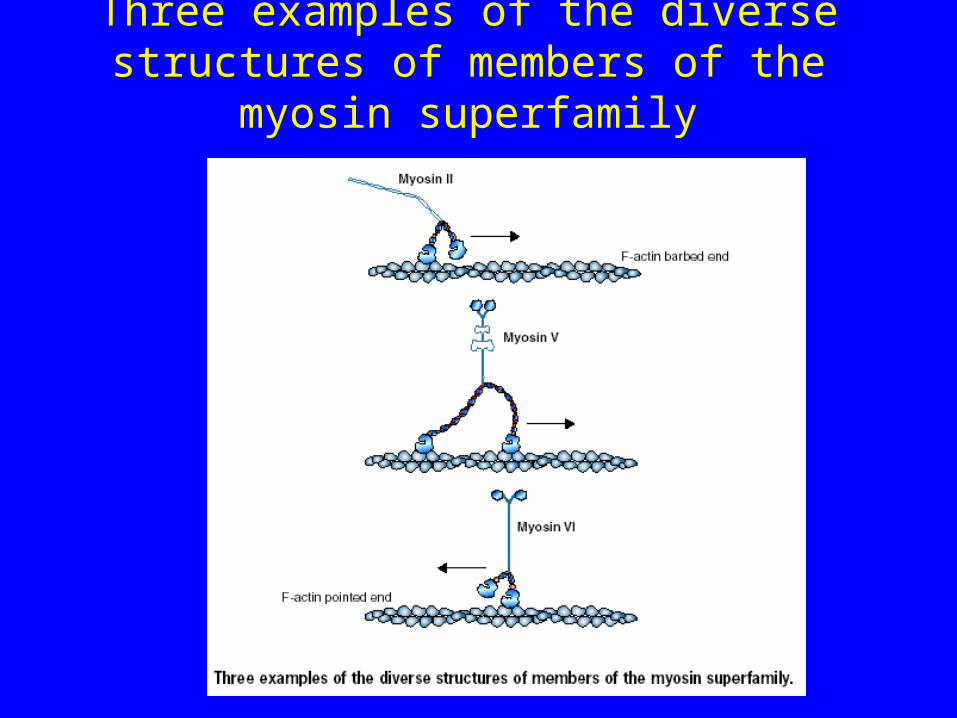
Three examples of the diverse structures of members of the myosin superfamily
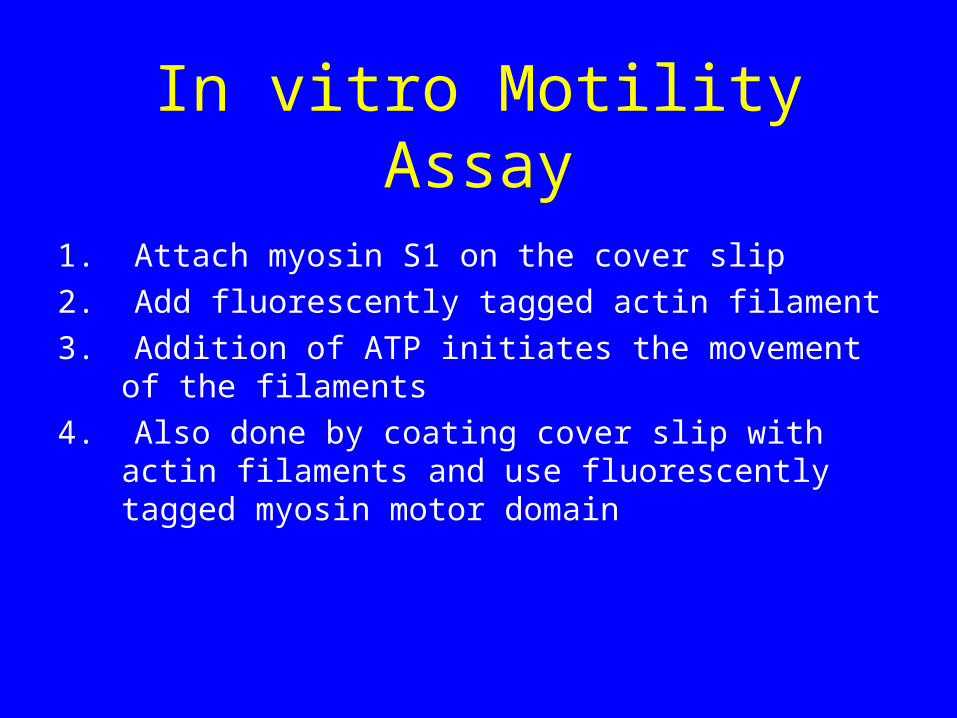
In vitro Motility Assay
1. Attach myosin S1 on the cover slip
2. Add fluorescently tagged actin filament
3. Addition of ATP initiates the movement of the filaments
4. Also done by coating cover slip with actin filaments and use fluorescently tagged myosin motor domain

In vitro motility assay

Proteins that are going to be modified are targeted for synthesis on the endoplasmicreticulum by a signal peptide

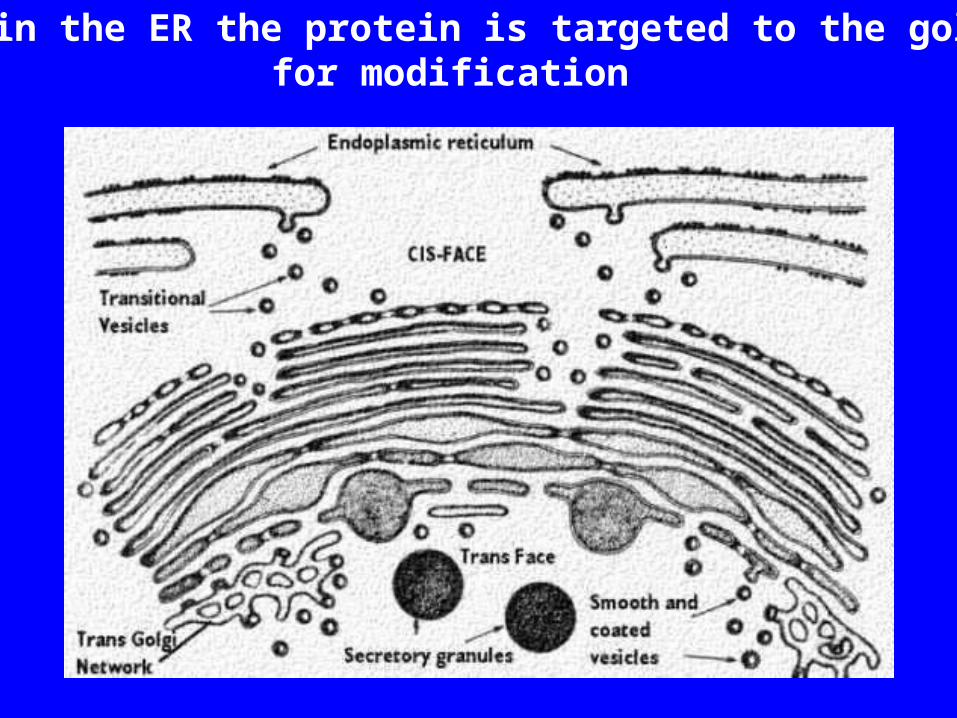
Once in the ER the protein is targeted to the golgifor modification


O-linked carbohydrates
Most O-linked carbohydrate covalent attachments to proteins involve alinkage between the monosaccharide N-Acetylgalactosamine and the amino acids serine or threonine. Currently there is not an O-linked aminoacid consensus sequence.

This image shows the primary structure of glycophorin A, a glycoprotein that spans the plasma membrane ("Lipid bilayer") ofhuman red blood cells. Each RBC has some 500,000 copies of the molecule embedded in its plasma membrane.
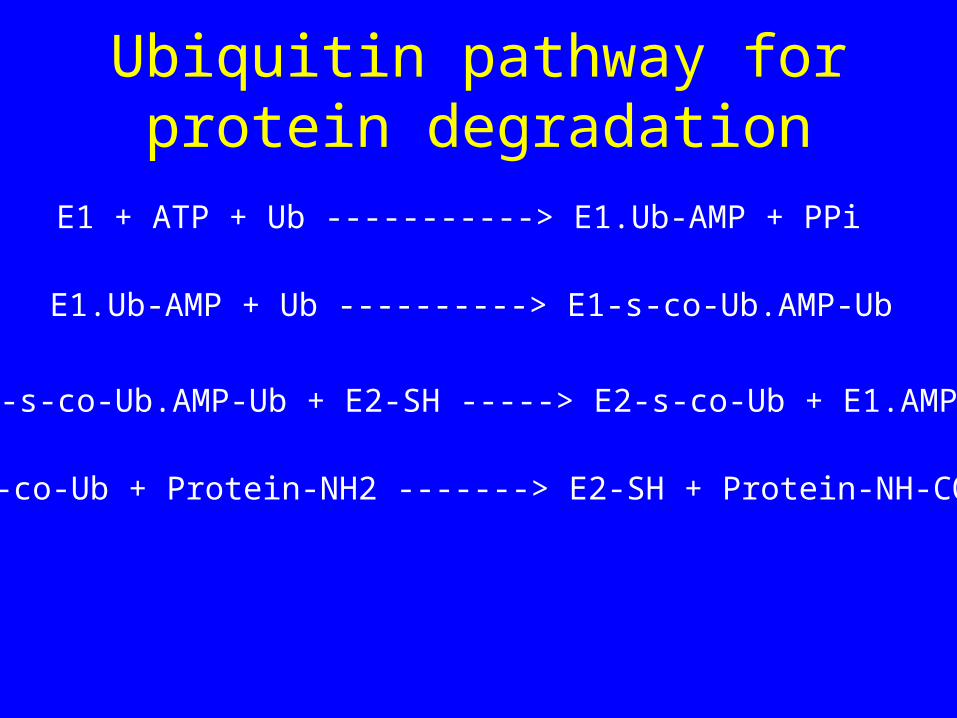
Ubiquitin pathway for protein degradation
E1 + ATP + Ub -----------> E1.Ub-AMP + PPi
E1.Ub-AMP + Ub ----------> E1-s-co-Ub.AMP-Ub
E1-s-co-Ub.AMP-Ub + E2-SH -----> E2-s-co-Ub + E1.AMP-Ub
E2-s-co-Ub + Protein-NH2 -------> E2-SH + Protein-NH-CO-Ub

Thioester bond
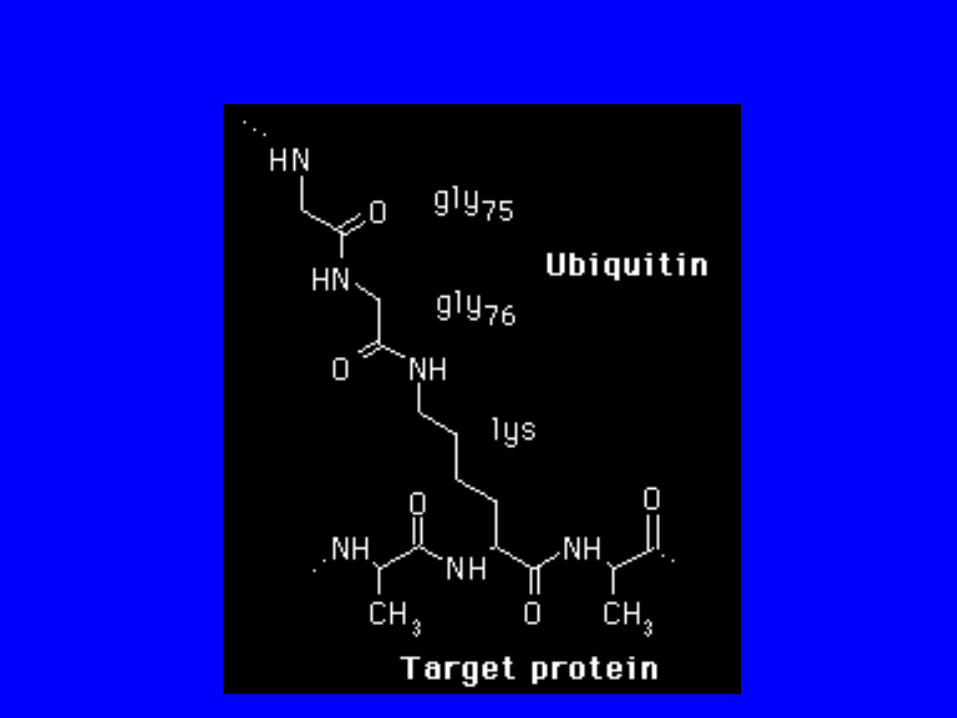
Isopeptide bond
