lecture 7 distribution: exchange and transfer. distribution: who gets what, and how? top-earning...
TRANSCRIPT
Lecture 7
Distribution: Exchange and Transfer
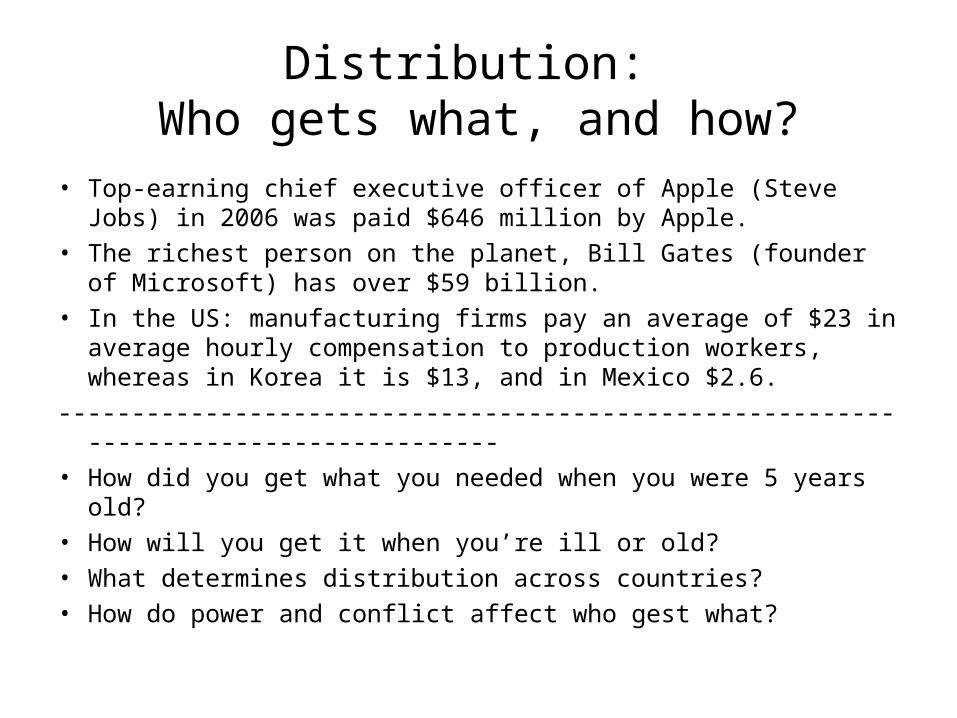
Distribution: Who gets what, and how?
• Top-earning chief executive officer of Apple (Steve Jobs) in 2006 was paid $646 million by Apple.
• The richest person on the planet, Bill Gates (founder of Microsoft) has over $59 billion.
• In the US: manufacturing firms pay an average of $23 in average hourly compensation to production workers, whereas in Korea it is $13, and in Mexico $2.6.
-------------------------------------------------------------------------------------• How did you get what you needed when you were 5 years old?• How will you get it when you’re ill or old?• What determines distribution across countries?• How do power and conflict affect who gest what?
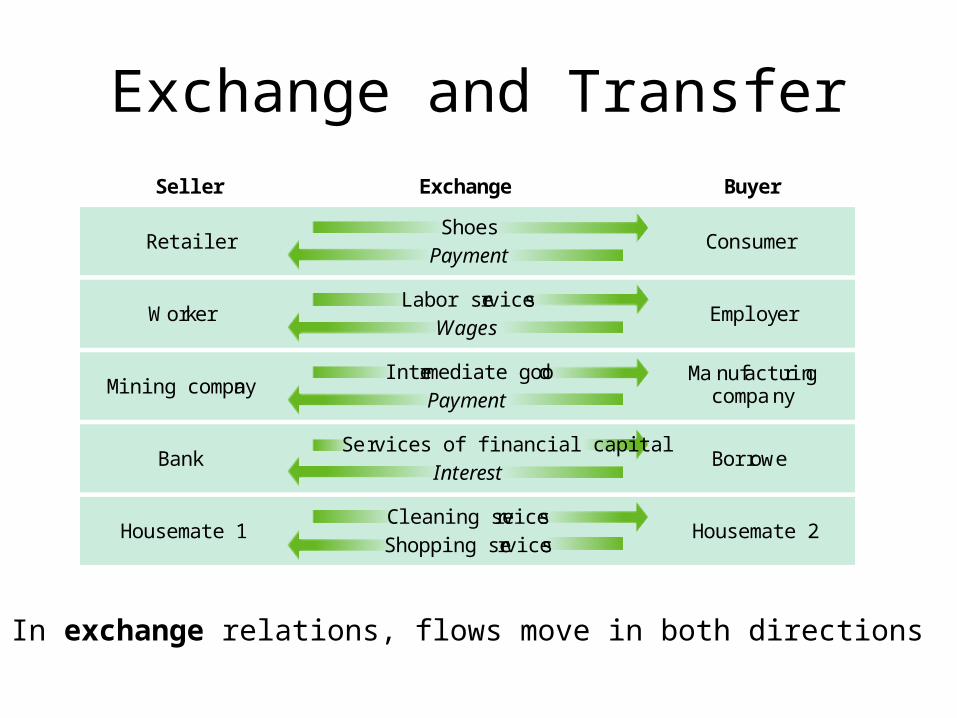
Exchange and Transfer
Seller BuyerExchange
RetailerShoes
PaymentConsumer
WorkerLabor services
WagesEmployer
Mining companyIntermediate good
PaymentManufacturing
company
Services of financial capitalInterest
Housemate 1 Housemate 2Cleaning servicesShopping services
Bank Borrowe
In exchange relations, flows move in both directions
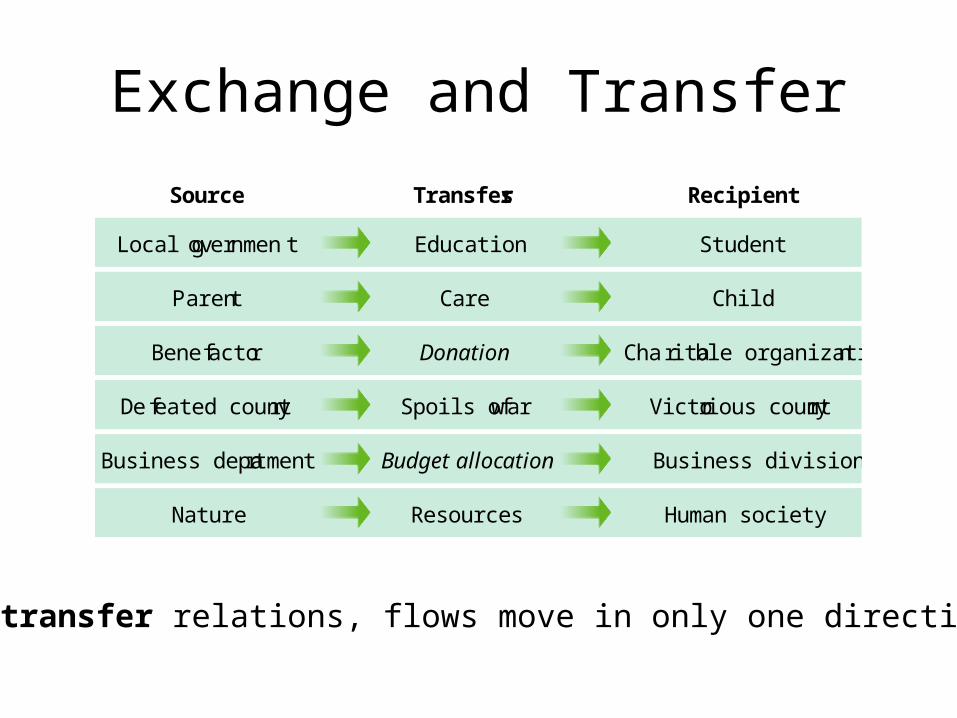
Exchange and Transfer
Source Transfers Recipient
Local government
Charitable organization
Education
Parent Care Child
Nature Resources
Benefactor Donation
Victorious countrySpoils of warDefeated country
Business division
Human society
Budget allocationBusiness department
Student
In transfer relations, flows move in only one direction.
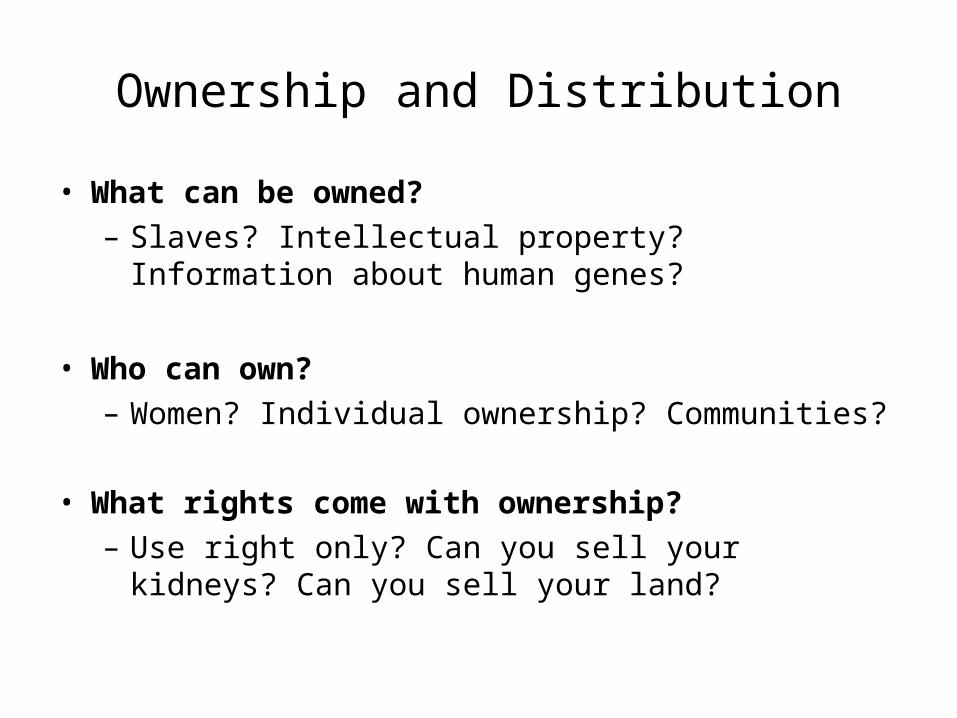
Ownership and Distribution
• What can be owned?– Slaves? Intellectual property? Information about
human genes?
• Who can own?– Women? Individual ownership? Communities?
• What rights come with ownership?– Use right only? Can you sell your kidneys? Can you
sell your land?
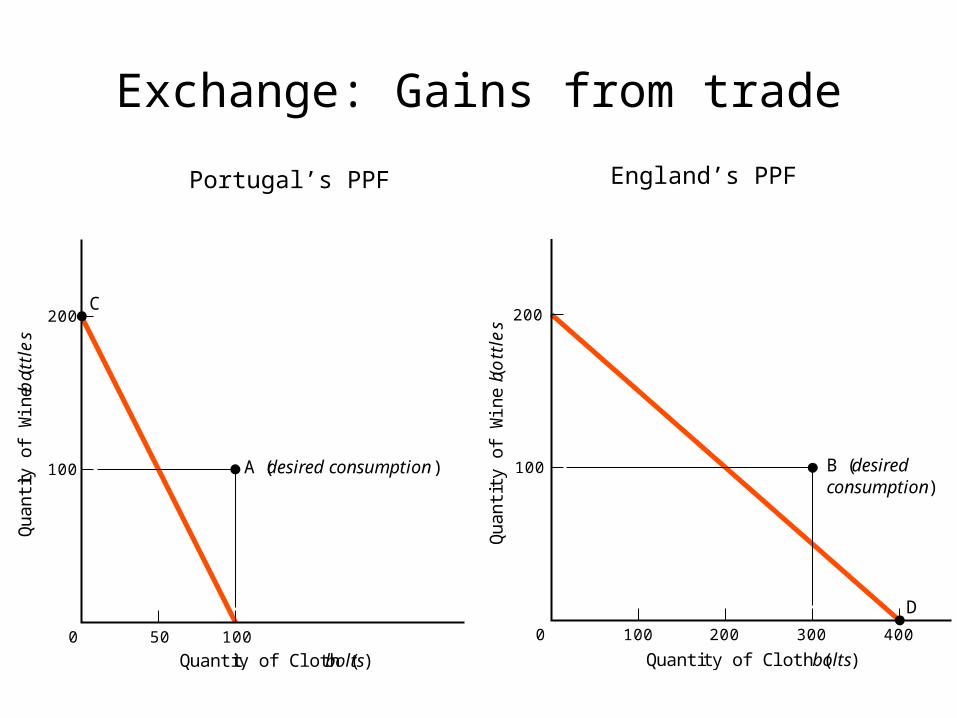
Exchange: Gains from trade
C
A (desired consumption)
100500
100
200
Quantity of Cloth (bolts)
Qu
an
tity
of
Win
e (
bo
ttle
s
D
100 300200 400
Quantity of Cloth ( bolts)
B (desiredconsumption)
0
100
200
Quantit
y of W
ine (
bo
ttle
s
Portugal’s PPF England’s PPF

Exchange: Gains from trade

Exchange: Gains from trade
Comparative advantage:
The ability to produce some good or service at a lower opportunity cost than other producers
Principle of comparative advantage:
Gains from trade occur when producers specialize in making goods for which their opportunity costs are relatively low
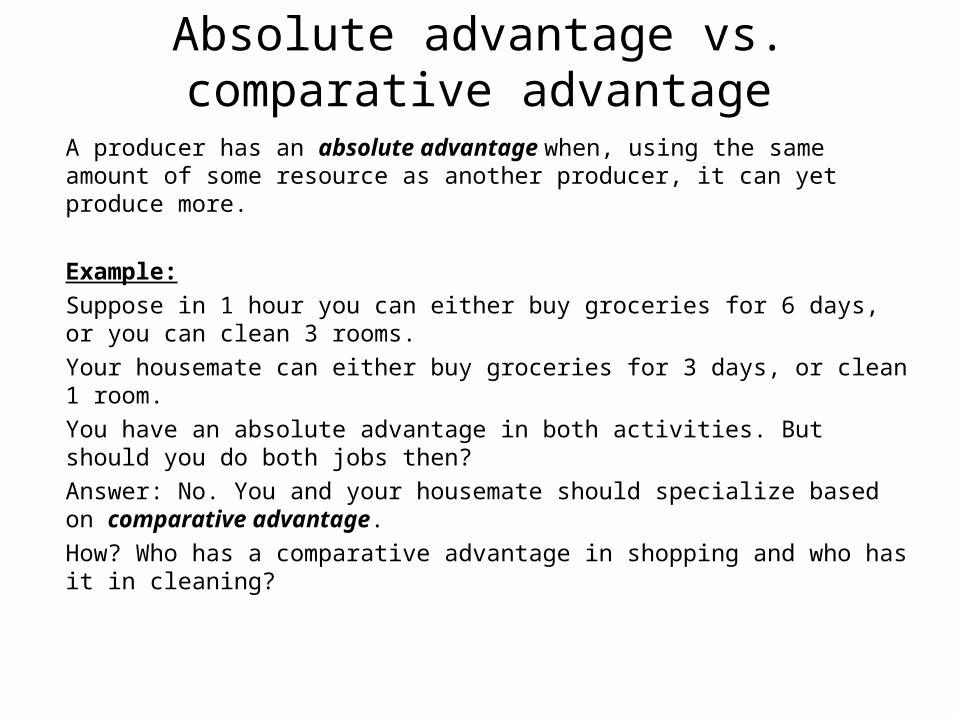
Absolute advantage vs. comparative advantage
A producer has an absolute advantage when, using the same amount of some resource as another producer, it can yet produce more.
Example:Suppose in 1 hour you can either buy groceries for 6 days, or you can clean 3 rooms.
Your housemate can either buy groceries for 3 days, or clean 1 room.
You have an absolute advantage in both activities. But should you do both jobs then?
Answer: No. You and your housemate should specialize based on comparative advantage.
How? Who has a comparative advantage in shopping and who has it in cleaning?

Exchange: Advantages and disadvantages
Advantages:
•Specialization and trade can lead to improvements in economic efficiency (gains from trade)•Exchange gives economic actors incentives to be more productive•People may enter into exchanges voluntarily•Exchange may encourage economic actors in terms of their common interests
Exchange: Advantages and disadvantages
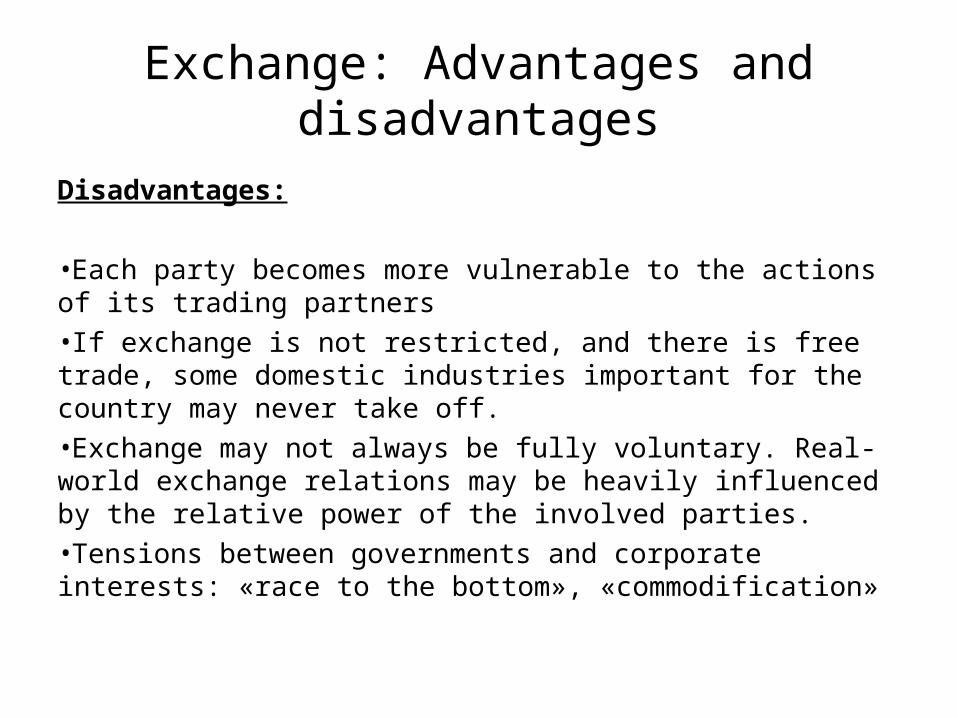
Disadvantages:
•Each party becomes more vulnerable to the actions of its trading partners•If exchange is not restricted, and there is free trade, some domestic industries important for the country may never take off.•Exchange may not always be fully voluntary. Real-world exchange relations may be heavily influenced by the relative power of the involved parties.•Tensions between governments and corporate interests: «race to the bottom», «commodification»
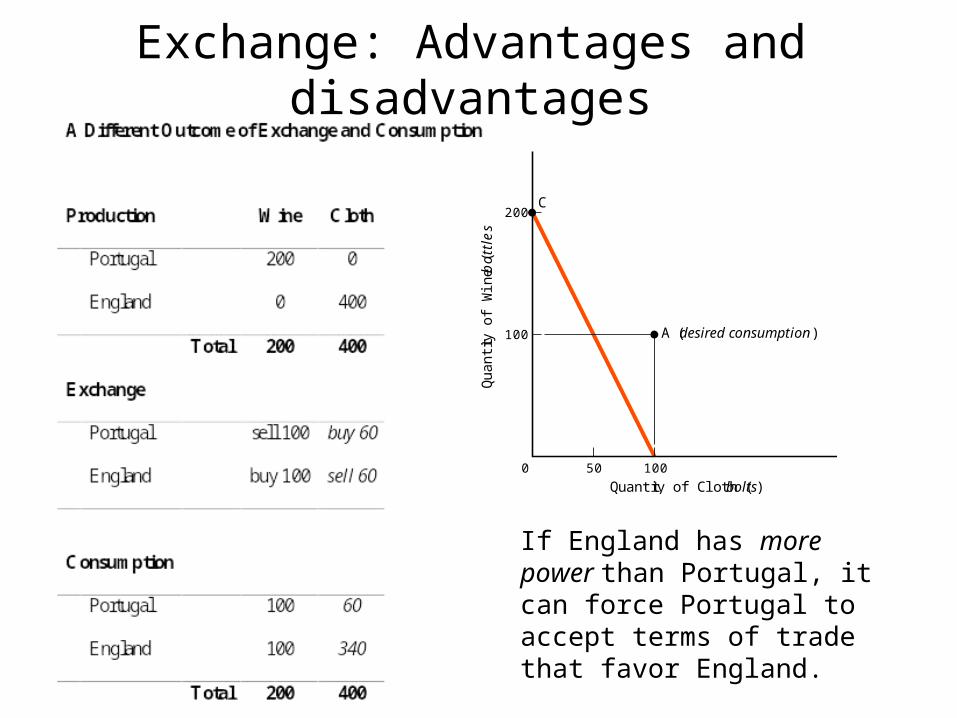
Exchange: Advantages and disadvantages
If England has more power than Portugal, it can force Portugal to accept terms of trade that favor England.
C
A (desired consumption)
100500
100
200
Quantity of Cloth (bolts)Q
ua
ntit
y o
f W
ine
(b
ott
les
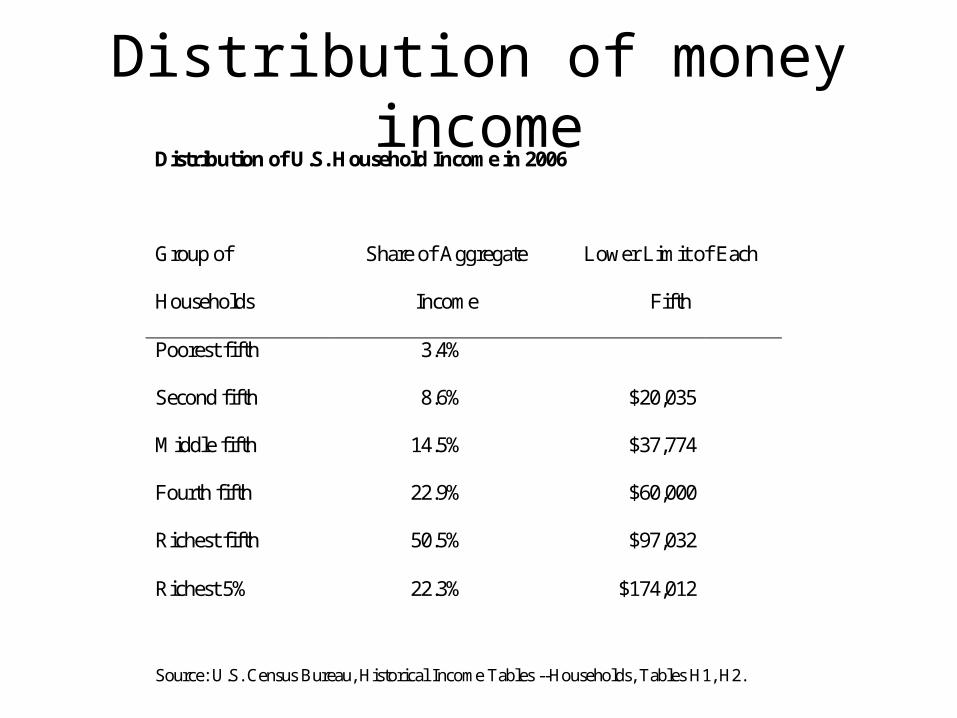
Distribution of money incomeDistribution of U.S. Household Income in 2006
Group of
Households
Share of Aggregate
Income
Lower Limit of Each
Fifth
Poorest fifth 3.4%
Second fifth 8.6% $20,035
Middle fifth 14.5% $37,774
Fourth fifth 22.9% $60,000
Richest fifth 50.5% $97,032
Richest 5% 22.3% $174,012
Source: U.S. Census Bureau, Historical Income Tables --Households, Tables H1, H2.
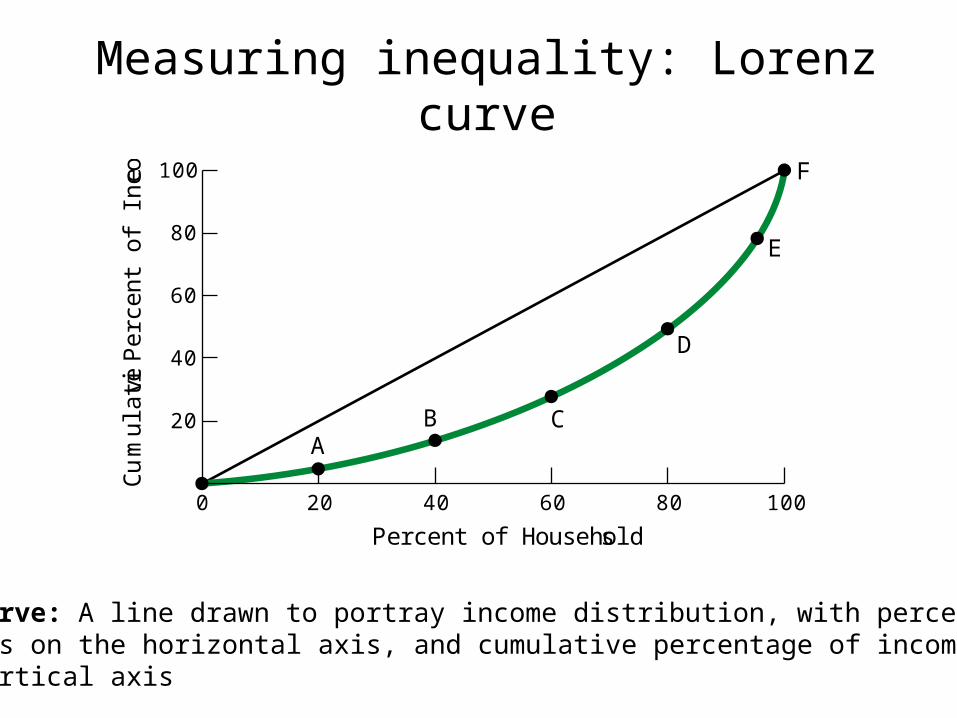
Measuring inequality: Lorenz curve
0 20 6040 10080
20
80
100
60
40
Percent of Households
Cu
mu
lativ
eP
erc
en
t o
f In
com
e
AB C
D
E
F
Lorenz curve: A line drawn to portray income distribution, with percentiles of households on the horizontal axis, and cumulative percentage of income on the vertical axis
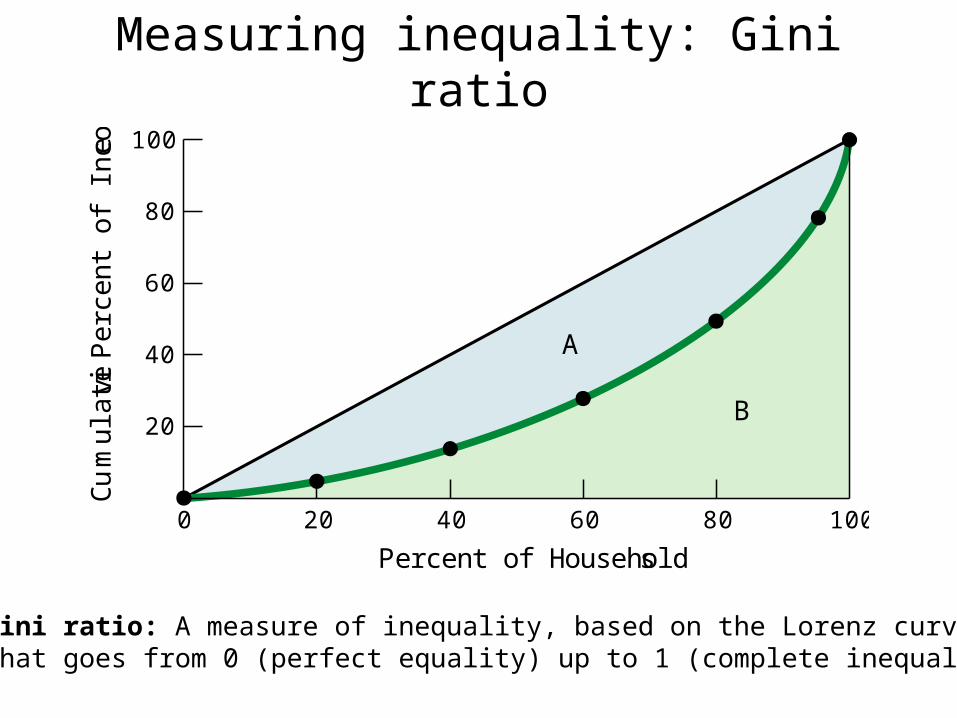
Measuring inequality: Gini ratio
0 20 6040 10080
20
80
100
60
40
Percent of Households
Cu
mu
lativ
eP
erc
en
t o
f In
com
e
A
B
Gini ratio: A measure of inequality, based on the Lorenz curve, that goes from 0 (perfect equality) up to 1 (complete inequality)
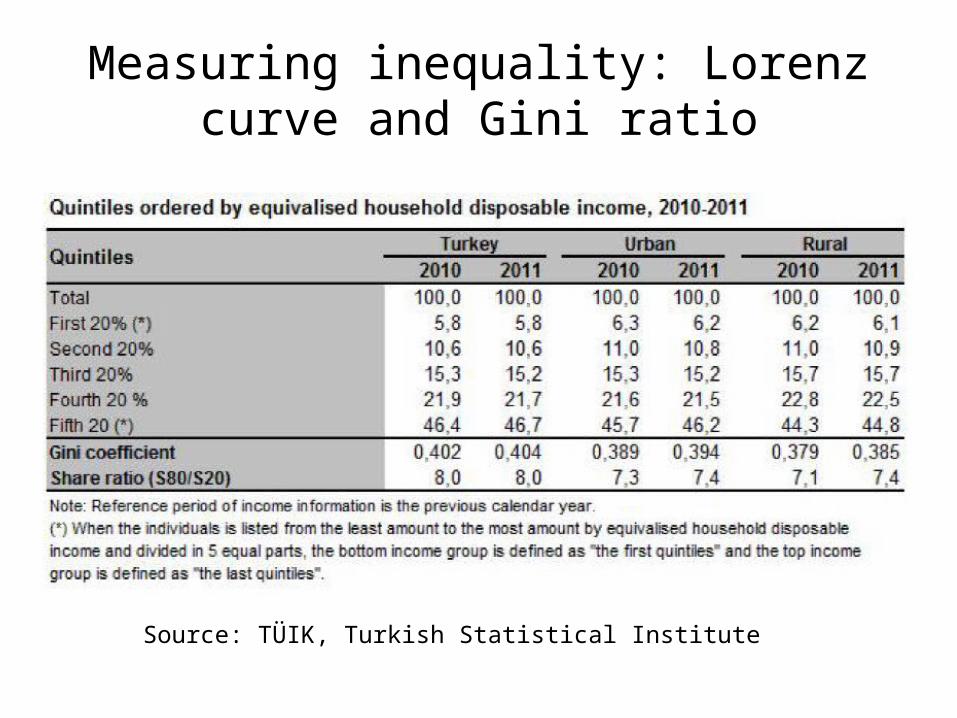
Measuring inequality: Lorenz curve and Gini ratio
Source: TÜIK, Turkish Statistical Institute
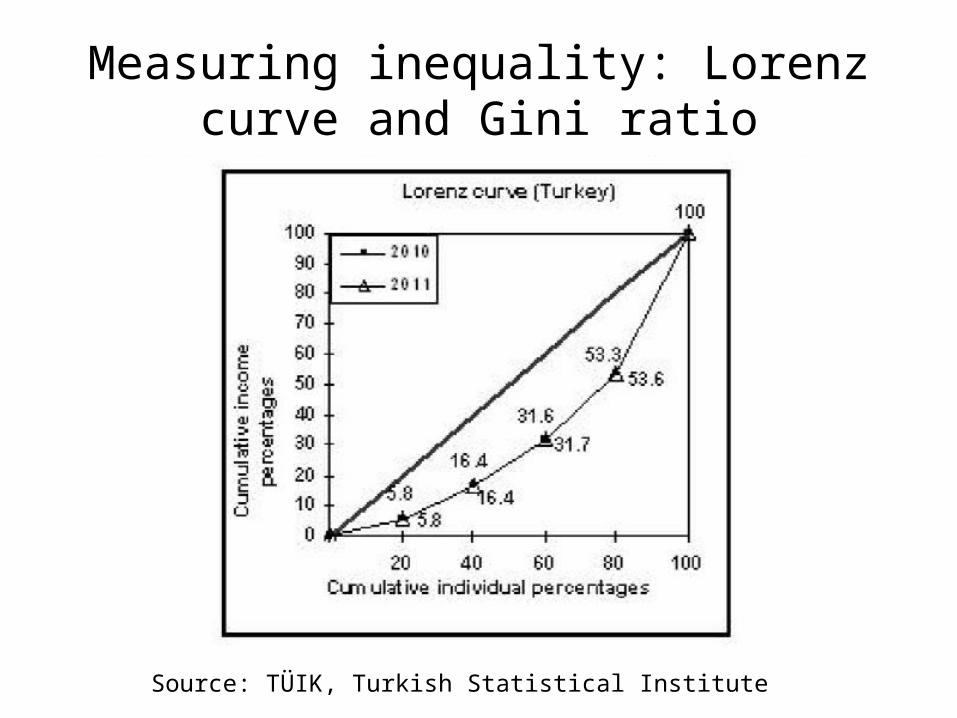
Measuring inequality: Lorenz curve and Gini ratio
Source: TÜIK, Turkish Statistical Institute

Source: OECD Income Distribution Database (mainly based on 2011-2013 data)http://www.oecd.org/social/income-distribution-database.htm

Wealth inequality
• Distribution of wealth (what people own in assets) tends to be much more unequal than the distribution of income (what people receive in the course of a year)
• Results of some studies for the U.S. in 2001:– Gini ratio for distribution of wealth was 0.83– Top 1% of U.S. households owned 33% of all
households assets– Top 10% owned 72% of all household assets– Bottom 40% owned only 0.3%
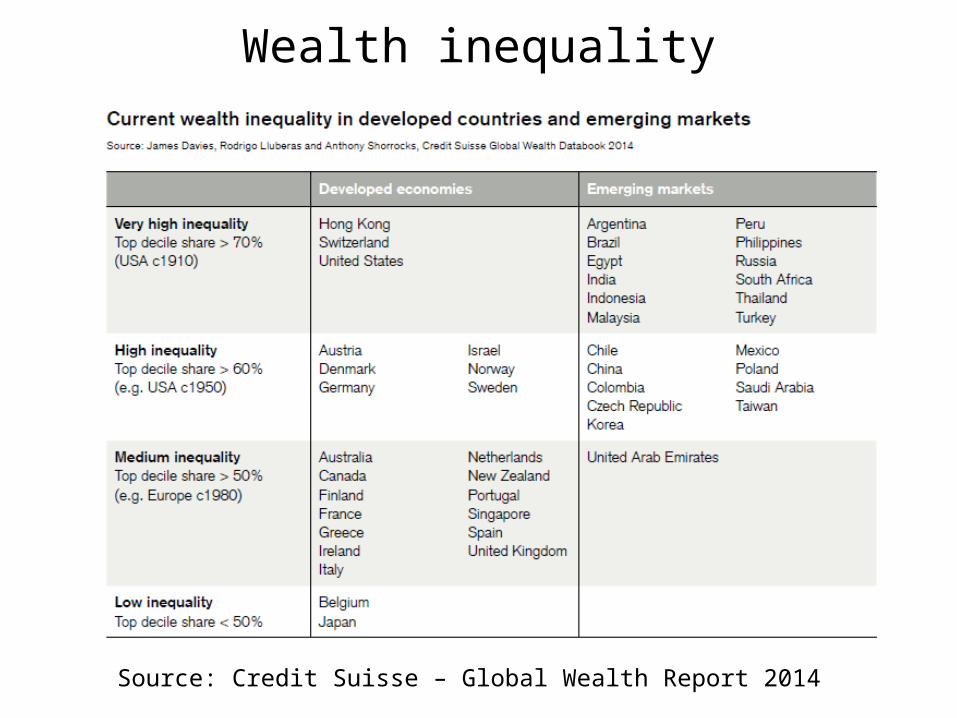
Wealth inequality
Source: Credit Suisse – Global Wealth Report 2014