lecture effectiveness by lecturers from biomedical science department, fskb ukm supervisor: puan...
TRANSCRIPT

Lecture Effectiveness by Lecturers from
Biomedical Science Department,
FSKB UKMSupervisor: Puan Rifina Arlin binti Drs. Haji
Zainal Arifin PM Dr Ahmad Rohi bin Ghazali
GROUP 6 BIOMEDICAL SCIENCE


INTRODUCTION •The study is mainly conducted to provide an useful framework in improving lecture delivery effectiveness among 1st year Biomedical Science lecturers in FSKB, UKM.
•Since most of the studies on lecture delivery effectiveness use only one source of information that can create bias and unreliability, it has initiated us to conduct this study using multiple sources.
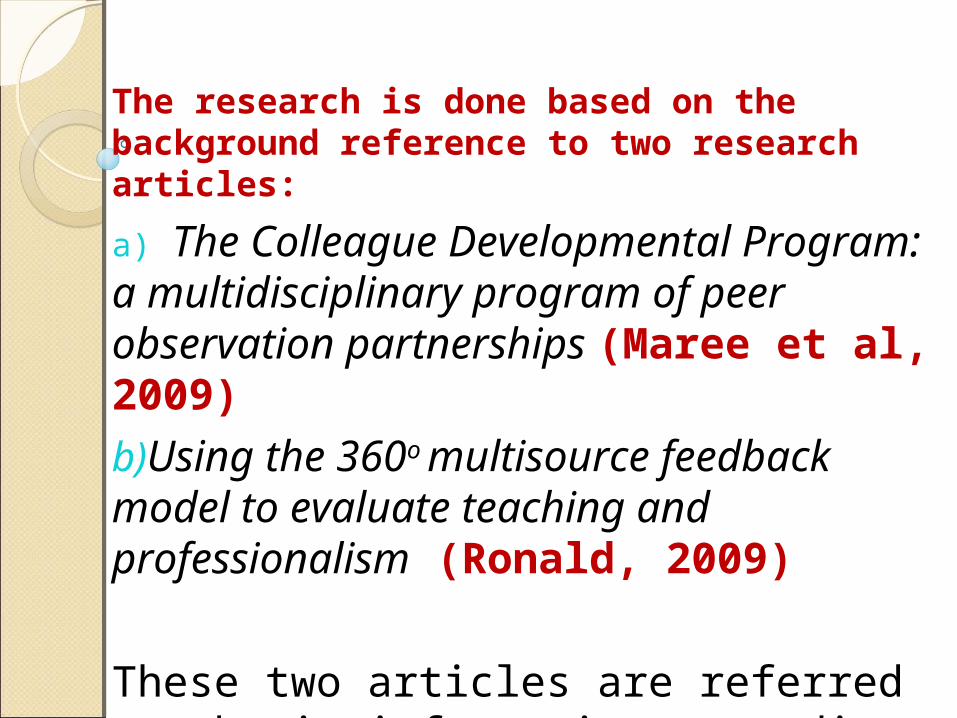
The research is done based on the background reference to two research articles:
a) The Colleague Developmental Program: a multidisciplinary program of peer observation partnerships (Maree et al, 2009)b)Using the 360o multisource feedback model to evaluate teaching and professionalism (Ronald, 2009)
These two articles are referred to obtain information regarding the multisource of lecturing evaluation.

Is the lecture given by lecturers from Biomedical Science Department, FSKB
UKM effective?

Lecture given by lecturers from Biomedical Science Department,
FSKB UKM is effective.
To evaluate the lecture delivery effectiveness given by 1st year Biomedical Science Department, FSKB UKM lecturers.

i) To determine students’ understanding level.
ii) To compare the effectiveness of various teaching methods.
iii)To determine the association between lecturers self-preparation with students’ understanding.
iv)To determine the association between the effectiveness of lectures and students’ academic performance.

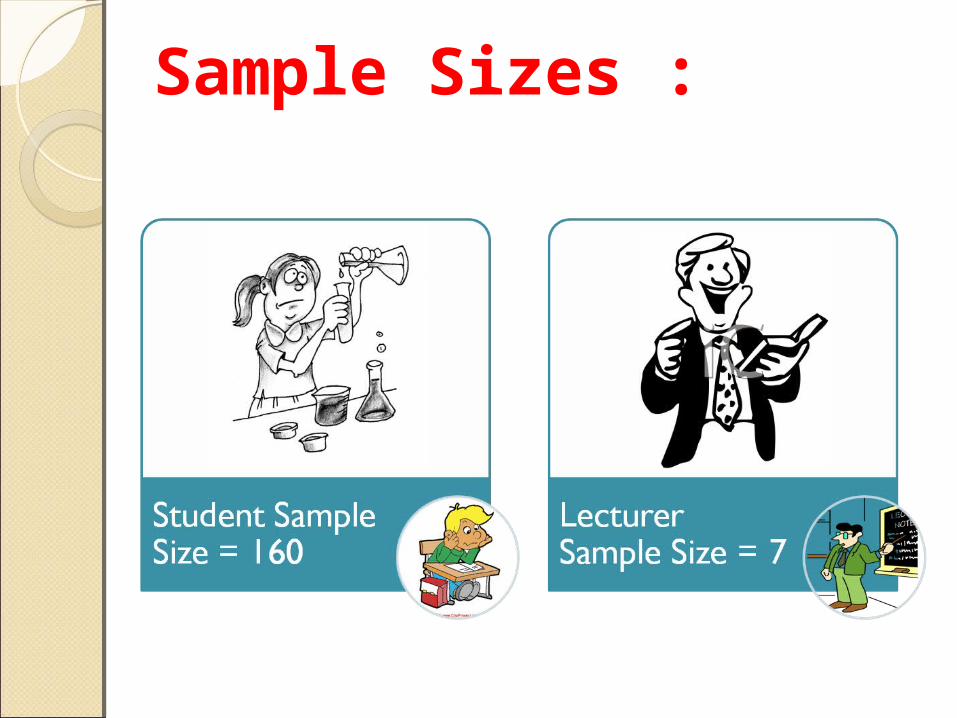
Sample Sizes :
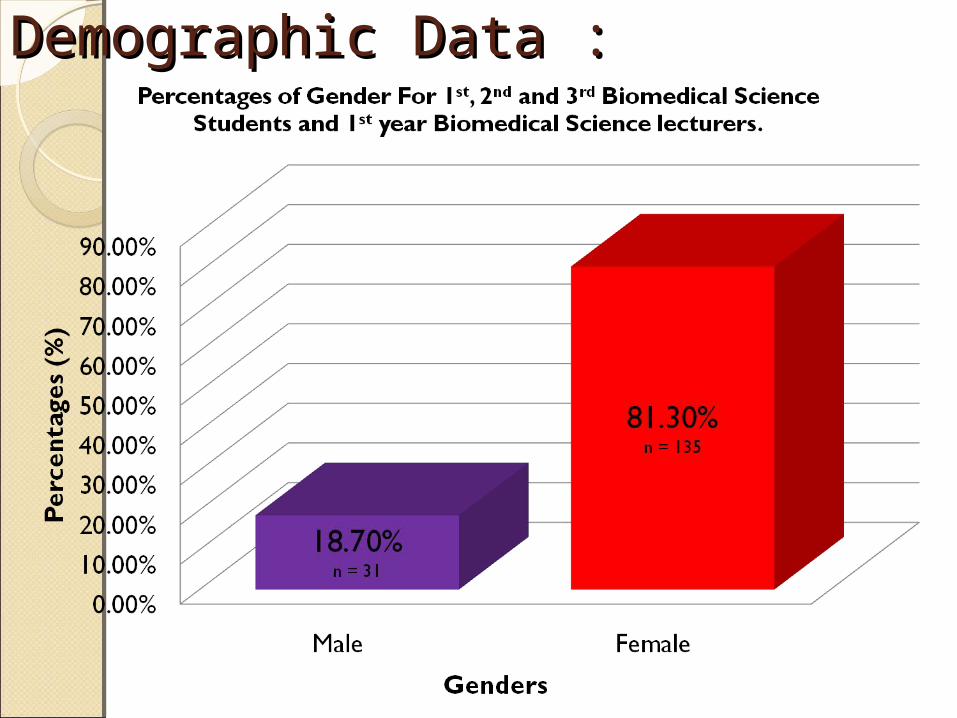
Demographic Data :Demographic Data :

Demographic Data :Demographic Data :

Demographic Data :Demographic Data :


SPECIFIC OBJECTIVE 1
To Determine Students’ Understanding Level

Questionnaires Questionnaires UsedUsedI am able to summarize the main points after every lecture.
Lecturers using terms and explanation that I am able to understand.
I am able to understand every lecture given by the lecturers.

Test Used
Descriptive Statistic

Descriptive Statistic:Descriptive Statistic:
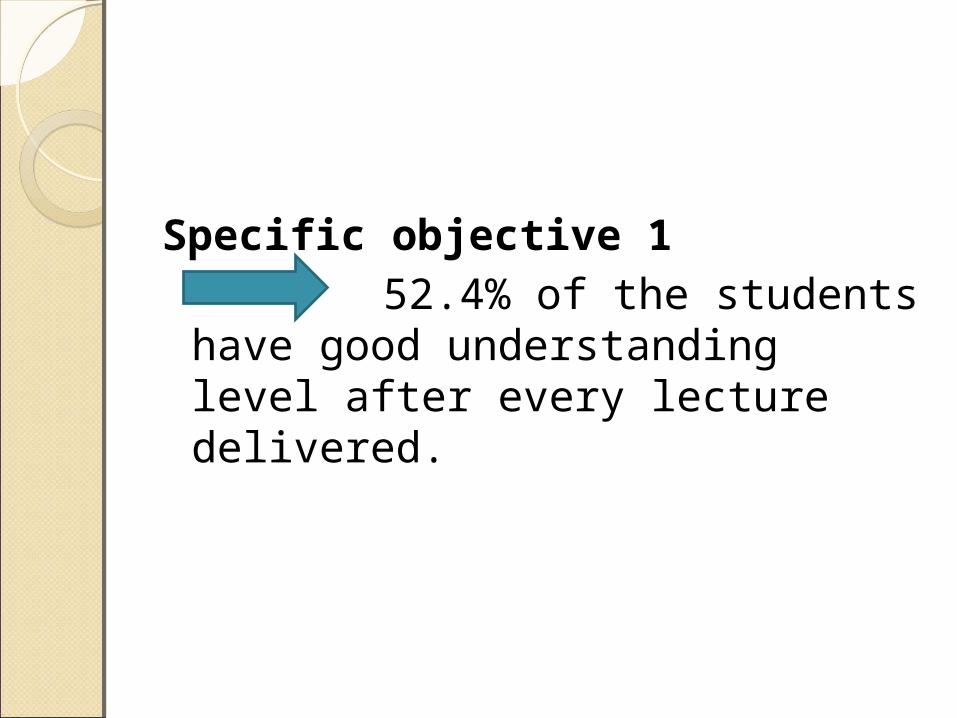
Specific objective 152.4% of the students
have good understanding level after every lecture delivered.
SPECIFIC OBJECTIVE 2
To Determine The Effectiveness of Various Teaching Methods
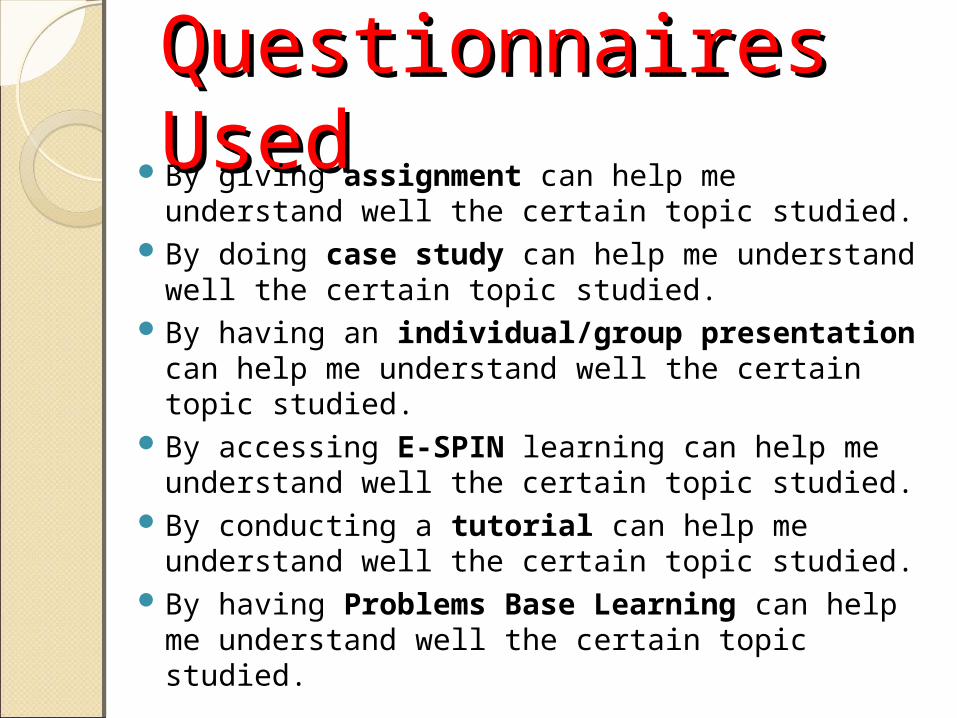
Questionnaires Questionnaires UsedUsedBy giving assignment can help me understand well the certain topic studied.
By doing case study can help me understand well the certain topic studied.
By having an individual/group presentation can help me understand well the certain topic studied.
By accessing E-SPIN learning can help me understand well the certain topic studied.
By conducting a tutorial can help me understand well the certain topic studied.
By having Problems Base Learning can help me understand well the certain topic studied.

Test Used
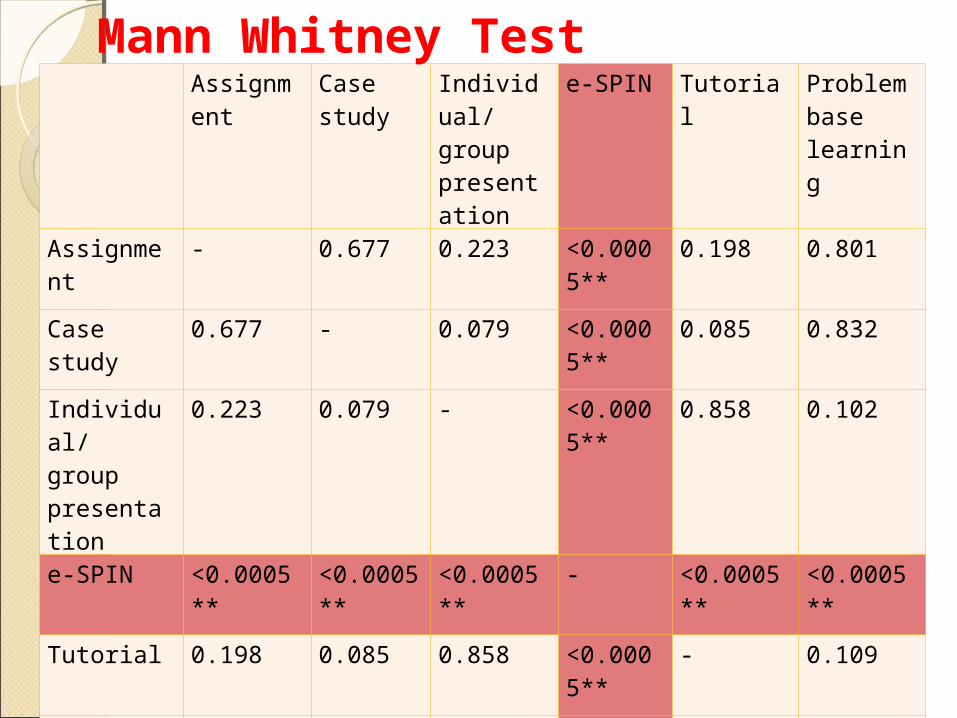
1. Kruskal Wallis2. Mann Whitney Test

Normality TestingKolmogorov-Smirnov
Sig. Value <0.0005**
Kruskal-Wallis
Sig. Value <0.0005**
Highly significant difference between the 6 groups of teaching methods.
PROCEED to Mann-Whitney test, to know where the significance lies.
KRUSKAL-WALLIS
Proceed to Kruskal-Wallis since data is not normally distributed.
Assignment
Case study
Individual/group presentation
e-SPIN Tutorial Problem base learning
Assignment
- 0.677 0.223 <0.0005**
0.198 0.801
Case study
0.677 - 0.079 <0.0005**
0.085 0.832
Individual/group presentation
0.223 0.079 - <0.0005**
0.858 0.102
e-SPIN <0.0005**
<0.0005**
<0.0005**
- <0.0005**
<0.0005**
Tutorial 0.198 0.085 0.858 <0.0005**
- 0.109
Problem base learning
0.801 0.832 0.102 <0.0005**
0.109 -
Mann Whitney Test
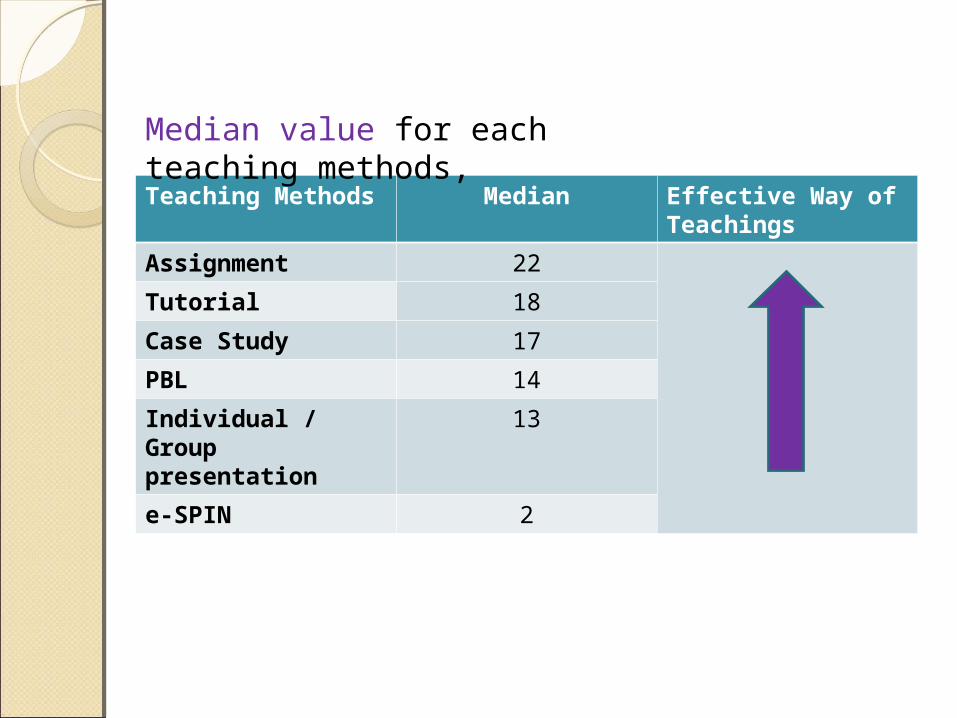
Teaching Methods
Median Effective Way of Teachings
Assignment 22
Tutorial 18
Case Study 17
PBL 14
Individual / Group presentation
13
e-SPIN 2
Median value for each teaching methods,
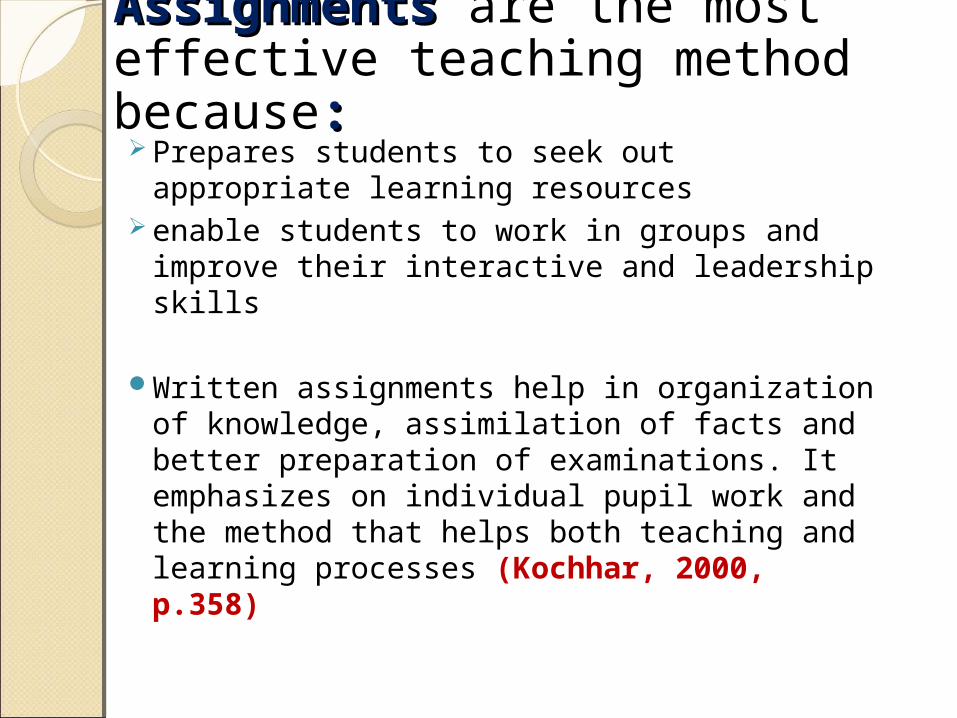
Prepares students to seek out appropriate learning resources
enable students to work in groups and improve their interactive and leadership skills
Written assignments help in organization of knowledge, assimilation of facts and better preparation of examinations. It emphasizes on individual pupil work and the method that helps both teaching and learning processes (Kochhar, 2000, p.358)
Assignments Assignments are the most effective teaching method because::

e-SPIN e-SPIN is the least effective teaching method because ::Unmotivated learners or those
with poor study habits may fall behind.
Lecturers may not always be available on demand.

Specific objective 2
Assignments are the most effective teaching method while e-SPIN is the least effective teaching method.

SPECIFIC OBJECTIVE 3 To determine the
association between lecturers’ self-preparation and lecture delivery effectiveness

Questionnaires Questionnaires UsedUsedLecture notes or related informations are given by lecturers before every lecture.
Lecturers deliver lectures based on “Student Guide Book''.
Lecturers mentioned his/her objective and simple outline of the topic before delivering the whole topic.
Lecturers uses flow charts and diagrams for teaching purposes.
Lecturers update his/her notes with the latest information frequently.
Lecturers discuss the recent development and researches with students during the lecture.
Lecturers provide additional information (articles, journal, website address) related to the topic.
Test Used
Spearman Correlation
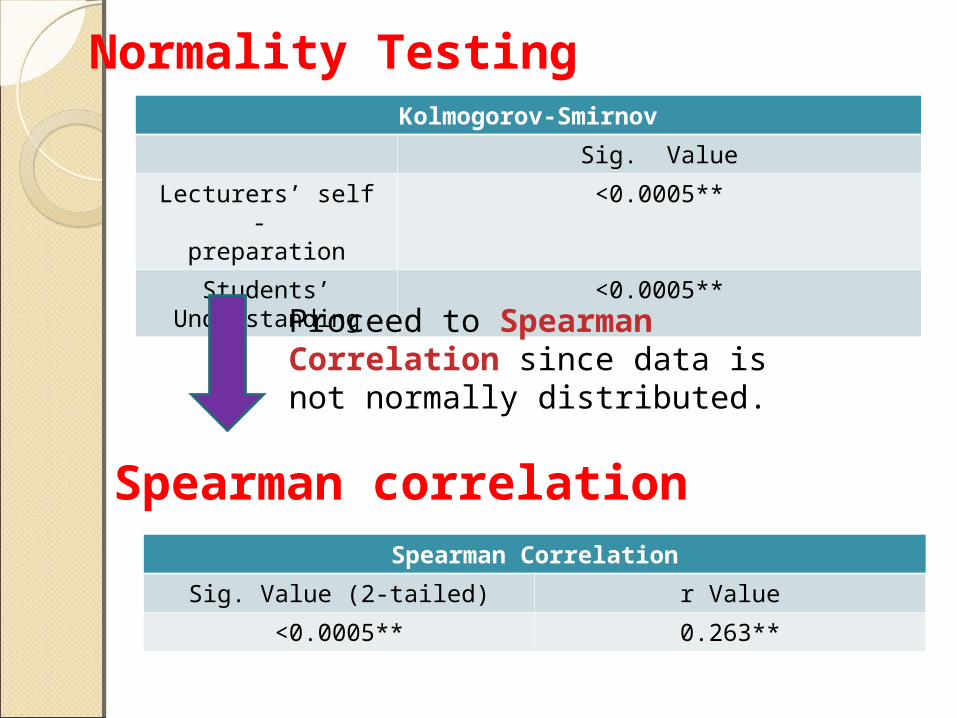
Kolmogorov-Smirnov
Sig. Value
Lecturers’ self - preparation
<0.0005**
Students’ Understanding
<0.0005**
Normality Testing
Spearman Correlation
Sig. Value (2-tailed) r Value
<0.0005** 0.263**
Spearman correlation
Proceed to Spearman Correlation since data is not normally distributed.
Specific objective 3
Lecturer’s self preparation have a weak correlation with lecturers delivery effectiveness

Cox and Rogers (2005) described a well-prepared lecture as an interactive experience that actively engages students in the process of learning and can support diverse student learning.
When the objective is to communicate basic facts, introduce intitial concepts or convey passion about a topic, a well prepared lecture is very useful (Cox & Rogers, 2005, Gleitman, 2006)
Self-preparation of teachers in US tends to increase personal teaching efficacy (Hoy & Woolfolk, 1990; Wenner, 2001)
SPECIFIC OBJECTIVE 4 To determine the
association between effectiveness of lecture and students’ academic performance during 1st year 1st semester

Test Used
Spearman Correlation

Kolmogorov-Smirnov
Sig. Value
Effectiveness of lectures
<0.0005**
GPA <0.0005**
Normality Testing
Spearman Correlation
Sig. Value (2-tailed) r Value
0.819 0.018
Spearman correlation
Proceed to Spearman correlation since data is not normally distributed.
Specific objective 4
Effectiveness of lecture delivery does not influence students’ academic performance during first year first sem study.

This might be due to students not depending solely on the lecturer’s lecture delivery and lecture notes.
Students may find other sources to perform academically besides lecture notes only, which is also known as active learning.
Active learning refers to situations where students are involved in the educational process instead of passively listening to lectures (Hermanson, 1994)
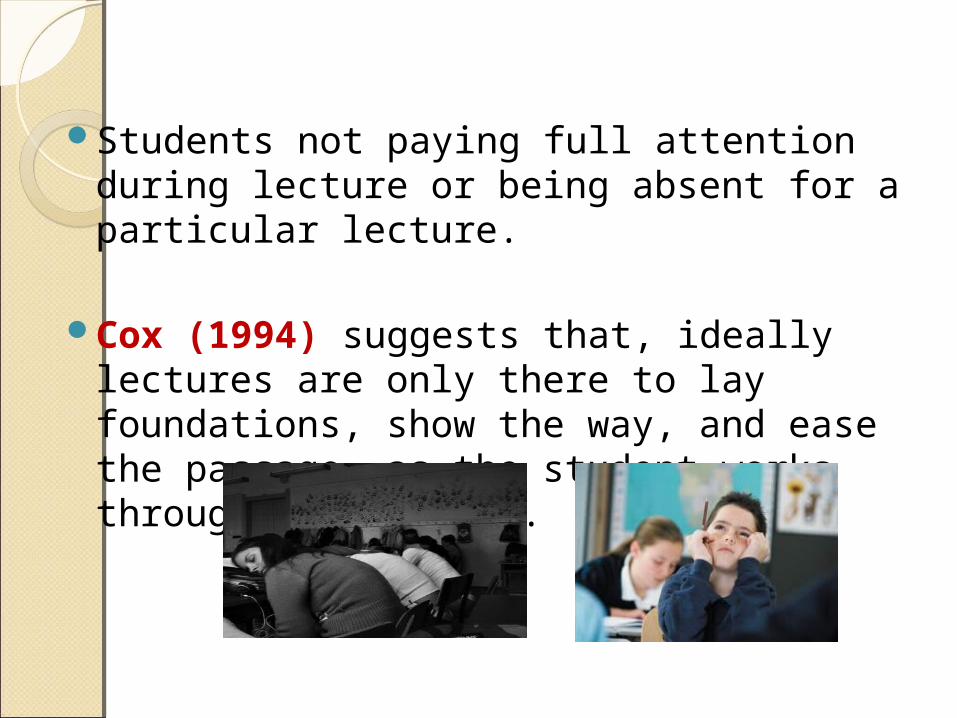
Students not paying full attention during lecture or being absent for a particular lecture.
Cox (1994) suggests that, ideally lectures are only there to lay foundations, show the way, and ease the passage, as the student works through the subject.

General General conclusionconclusion
Lecture delivery given by 1st year Biomedical Science Department, FSKB UKM lecturers is effective but there is no correlation between the effectiveness of lectures and students’ academic performance.
Reference Naoto I. 2000. A cross-sectional study on constipation by
questionnaire to students in Meiji University of Oriental Medicine. Journal of Meiji University Of Oriental Medicine 27(2): 47-53.
Guimaraes E.V. 2001. Dietary fiber intake, stool frequency
and colonic transit time in chronic functional constipation in children. Brazilian Journal of Medical and Biological Research 34(9): 1147-1153.
Williams J.. 2008. A study to determine actual consumption, awareness of health benefits and factors influencing fruit and vegetable consumption in first-year undergraduate students. Journal of Human Nutrition and Dietetics 13(5): 363-371.
Morais M.B. 1999. Measurement of low dietary fiber intake as a risk factor for chronic constipation in children. Journal of Pediatric Gastroenterology and Nutrition 29(2): 132-135.
M. Galisteo. 2009. Effects of dietary fibers on disturbances
clustered in the metabolic syndrome. The Journal of Nutritional Biochemistry 19(2): 71-84.
Warren TK. 2007. Increased prevalence of constipation in
pre- school children is attributable to under-consumption of plant foods: A community-based study. Journal of Paediatrics and Child Health 44(4): 170-175.
Garrigues V. 1991. Prevalence of constipation: Agreement
among several criteria and evaluation of the diagnostic accuracy of qualifying symptoms and self-reported definition in a population-based survey in Spain. American Journal of Epidemiology 159(5): 520-526.

ACKNOWLEDGEMENTSWe want to thank to all
biostatistics lecturers especially Puan Rifina Arlin binti Drs. Haji Zainal Arifin & PM Dr Ahmad Rohi bin Ghazali for being our supervisor. We also would like to express our appreciation to all Biomedical Science students first, second and third years that had participated in answering questionnaires to assist our study.

THANK YOU