lecture notes - chapter 6 - macro - week 6
DESCRIPTION
Canadian Macroeconomics for the course of the lecture used in 2013 for classes business stocks and bondsTRANSCRIPT
1
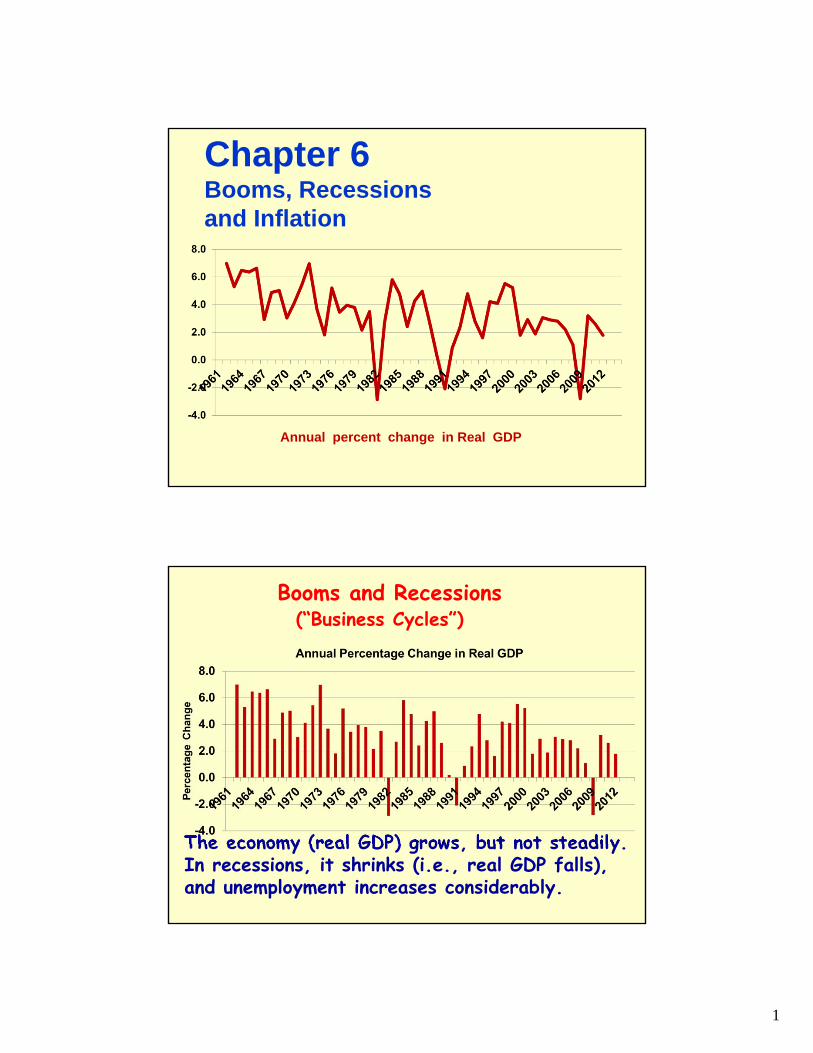
Chapter 6Booms, Recessions and Inflation
Annual percent change in Real GDP
The economy (real GDP) grows, but not steadily.In recessions, it shrinks (i.e., real GDP falls),and unemployment increases considerably.
Booms and Recessions(“Business Cycles”)
2
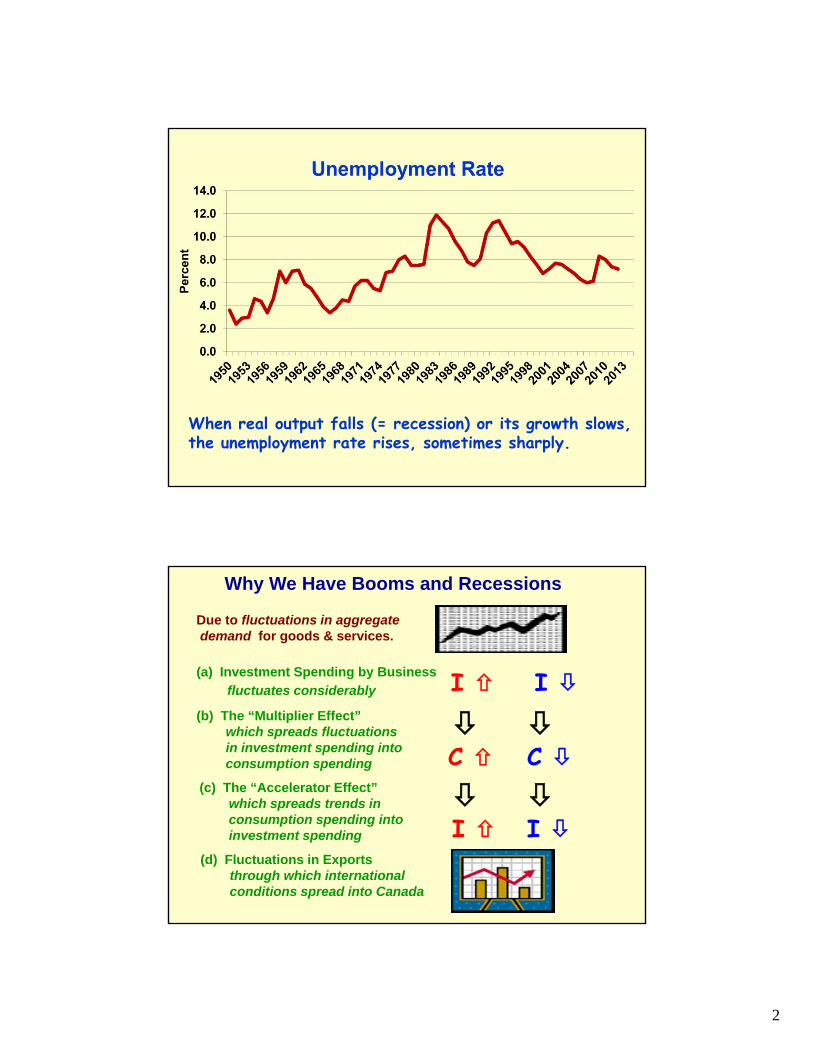
When real output falls (= recession) or its growth slows, the unemployment rate rises, sometimes sharply.
Why We Have Booms and Recessions
Due to fluctuations in aggregatedemand for goods & services.
(a) Investment Spending by Business
fluctuates considerably
(b) The “Multiplier Effect”which spreads fluctuationsin investment spending intoconsumption spending
(c) The “Accelerator Effect”which spreads trends inconsumption spending intoinvestment spending
(d) Fluctuations in Exportsthrough which internationalconditions spread into Canada
I
C I
I
C I
3
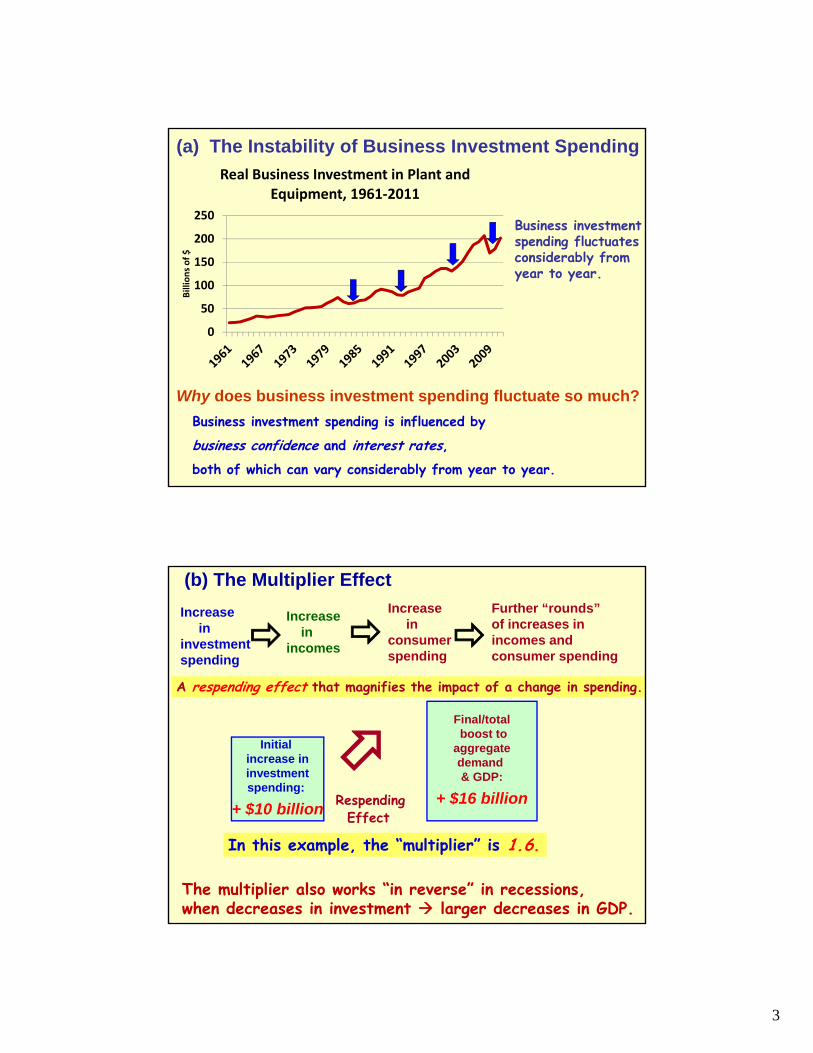
(a) The Instability of Business Investment Spending
Why does business investment spending fluctuate so much?
Business investment spending is influenced by
business confidence and interest rates,both of which can vary considerably from year to year.
Business investmentspending fluctuatesconsiderably from year to year.
0
50
100
150
200
250
Billions of $
Real Business Investment in Plant and Equipment, 1961‐2011
(b) The Multiplier Effect
RespendingEffect
In this example, the “multiplier” is 1.6.
Increasein
investmentspending
Increasein
incomes
Increasein
consumerspending
Further “rounds”of increases inincomes andconsumer spending
A respending effect that magnifies the impact of a change in spending.
Initial increase ininvestmentspending:
+ $10 billion
Final/totalboost to
aggregatedemand & GDP:
+ $16 billion
The multiplier also works “in reverse” in recessions,when decreases in investment larger decreases in GDP.
4
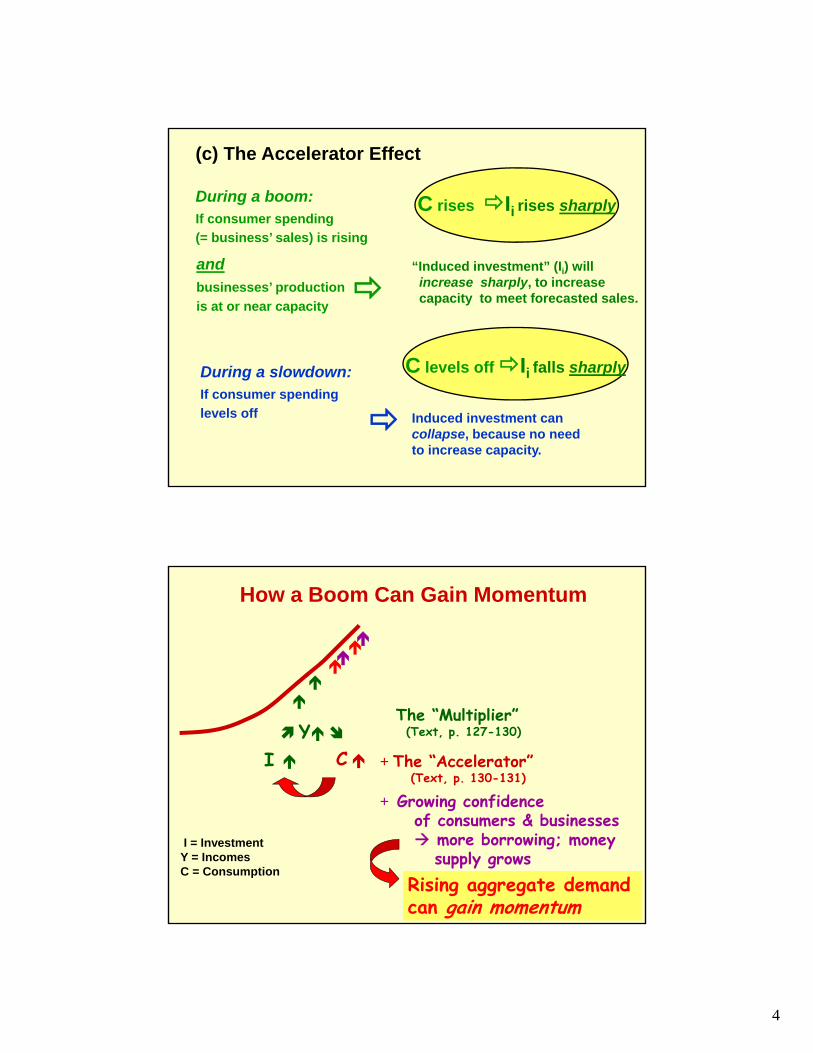
(c) The Accelerator Effect
During a boom:If consumer spending
(= business’ sales) is rising
andbusinesses’ production
is at or near capacity
“Induced investment” (Ii) will increase sharply, to increase capacity to meet forecasted sales.
Induced investment cancollapse, because no need to increase capacity.
During a slowdown:If consumer spending
levels off
C rises Ii rises sharply
C levels off Ii falls sharply
How a Boom Can Gain Momentum
C Y
I
The “Multiplier”(Text, p. 127-130)
+ The “Accelerator”(Text, p. 130-131)
+ Growing confidence of consumers & businesses more borrowing; money
supply grows
Rising aggregate demandcan gain momentum
I = InvestmentY = IncomesC = Consumption
5
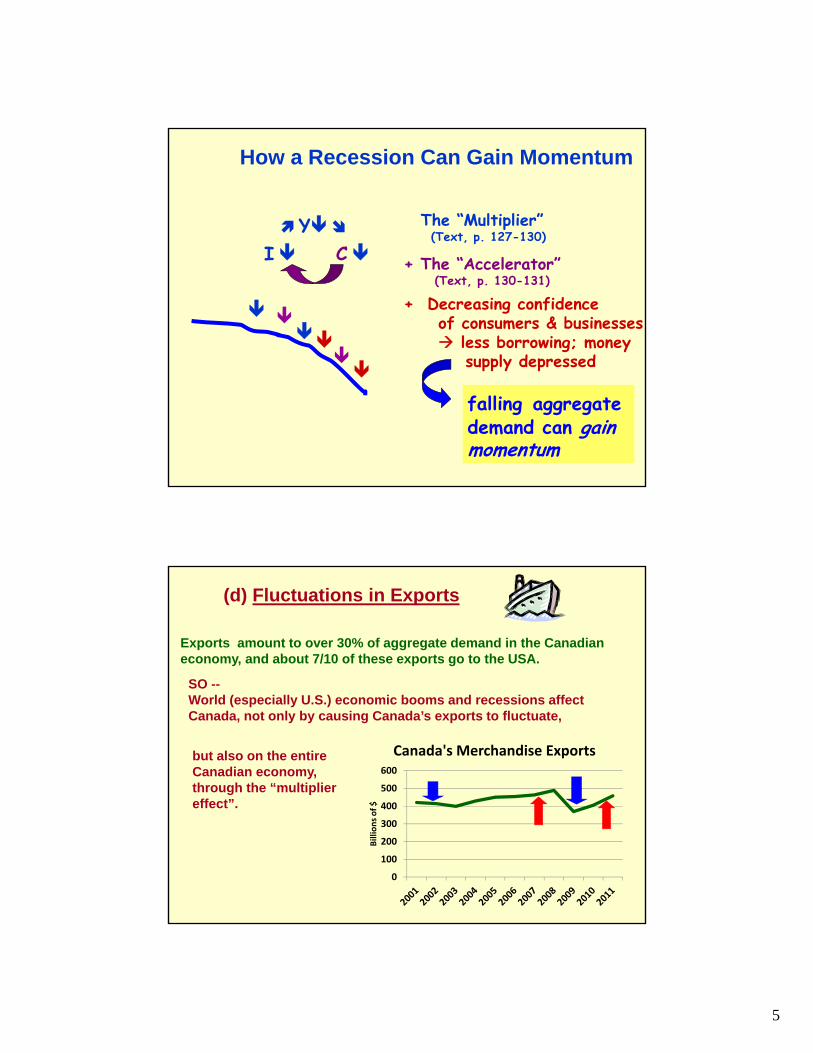
How a Recession Can Gain Momentum
C Y
I
The “Multiplier”(Text, p. 127-130)
+ The “Accelerator”(Text, p. 130-131)
+ Decreasing confidence of consumers & businesses less borrowing; money
supply depressed
falling aggregate demand can gain momentum
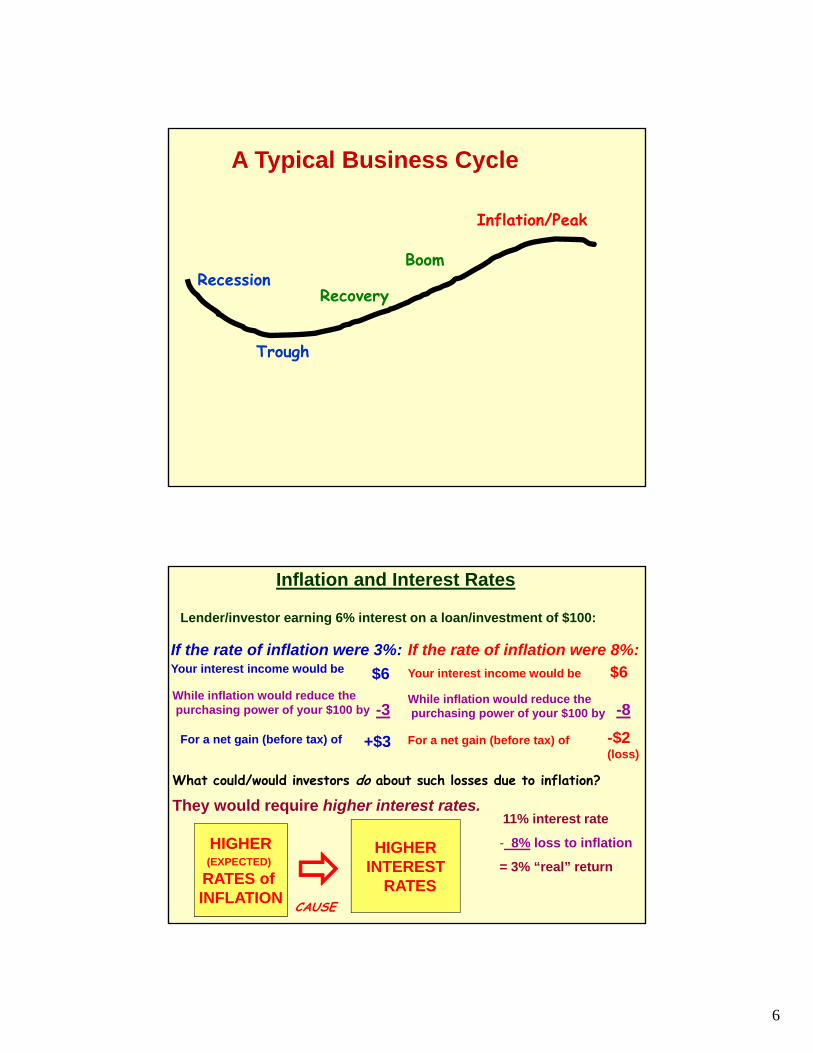
(d) Fluctuations in Exports
Exports amount to over 30% of aggregate demand in the Canadian economy, and about 7/10 of these exports go to the USA.
SO --World (especially U.S.) economic booms and recessions affectCanada, not only by causing Canada’s exports to fluctuate,
but also on the entire Canadian economy,through the “multiplier effect”.
0
100
200
300
400
500
600
Billions of $
Canada's Merchandise Exports
6
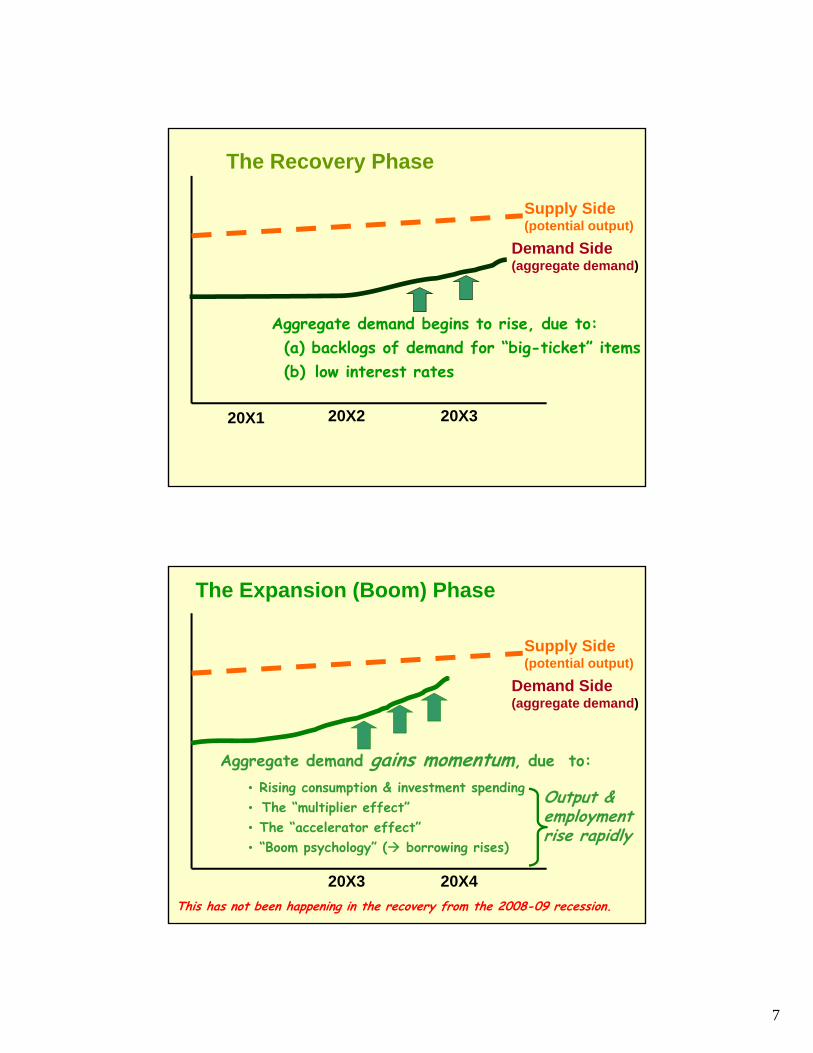
Recession
Trough
Recovery
Boom
Inflation/Peak
A Typical Business Cycle
Inflation and Interest Rates
Lender/investor earning 6% interest on a loan/investment of $100:
If the rate of inflation were 3%:Your interest income would be
While inflation would reduce thepurchasing power of your $100 by
$6
-3
For a net gain (before tax) of +$3
If the rate of inflation were 8%:Your interest income would be $6
While inflation would reduce thepurchasing power of your $100 by
For a net gain (before tax) of
-8
-$2(loss)
What could/would investors do about such losses due to inflation?
They would require higher interest rates.11% interest rate
- 8% loss to inflation
= 3% “real” returnCAUSE
HIGHER(EXPECTED)
RATES of INFLATION
HIGHERINTEREST
RATES
7
Supply Side(potential output)
20X1 20X2 20X3
Demand Side(aggregate demand)
Aggregate demand begins to rise, due to:(a) backlogs of demand for “big-ticket” items(b) low interest rates
The Recovery Phase
Supply Side(potential output)
20X3 20X4
Demand Side(aggregate demand)
The Expansion (Boom) Phase
Aggregate demand gains momentum, due to:• Rising consumption & investment spending• The “multiplier effect”• The “accelerator effect”• “Boom psychology” ( borrowing rises)
Output & employmentrise rapidly
This has not been happening in the recovery from the 2008-09 recession.
8
20X4 20X5 20X6
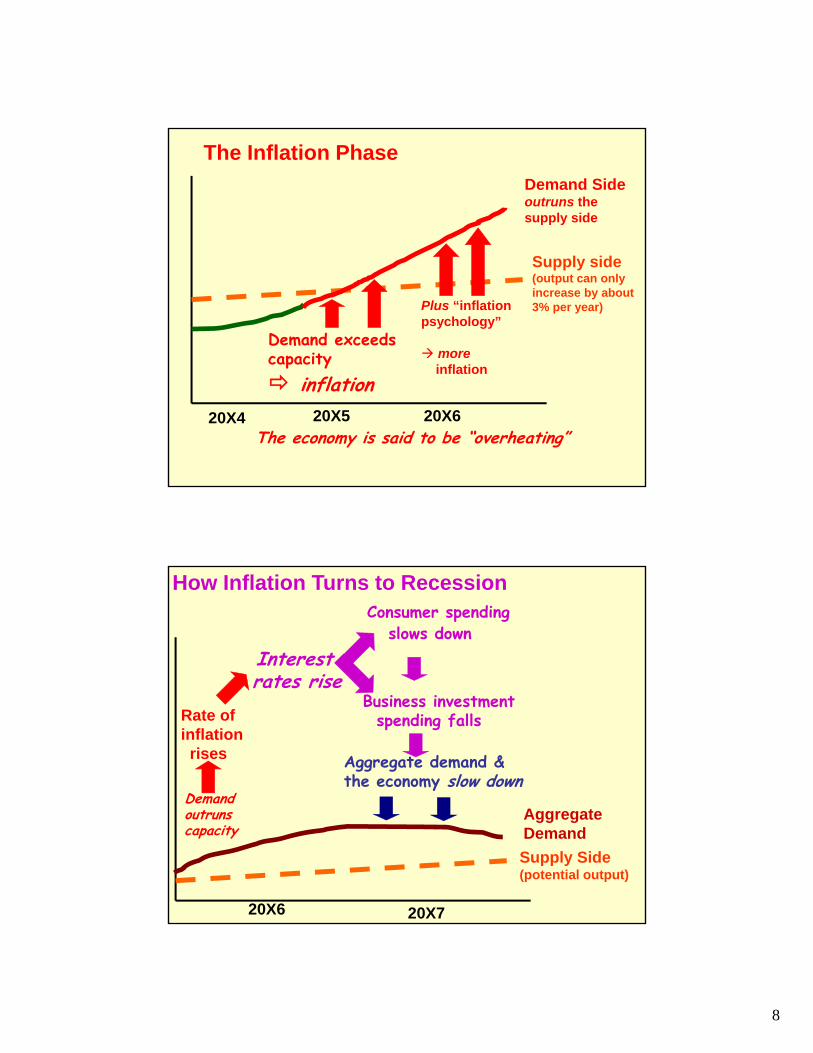
The Inflation Phase
Supply side(output can onlyincrease by about 3% per year)
Demand Sideoutruns the supply side
Demand exceeds capacity inflation
Plus “inflationpsychology”
moreinflation
The economy is said to be “overheating”
How Inflation Turns to Recession
Supply Side(potential output)
AggregateDemand
Demandoutrunscapacity
Interestrates rise
Consumer spendingslows down
Business investment spending falls
Aggregate demand & the economy slow down
Rate ofinflationrises
20X6 20X7
9
Supply Side(capacity output)
AggregateDemand
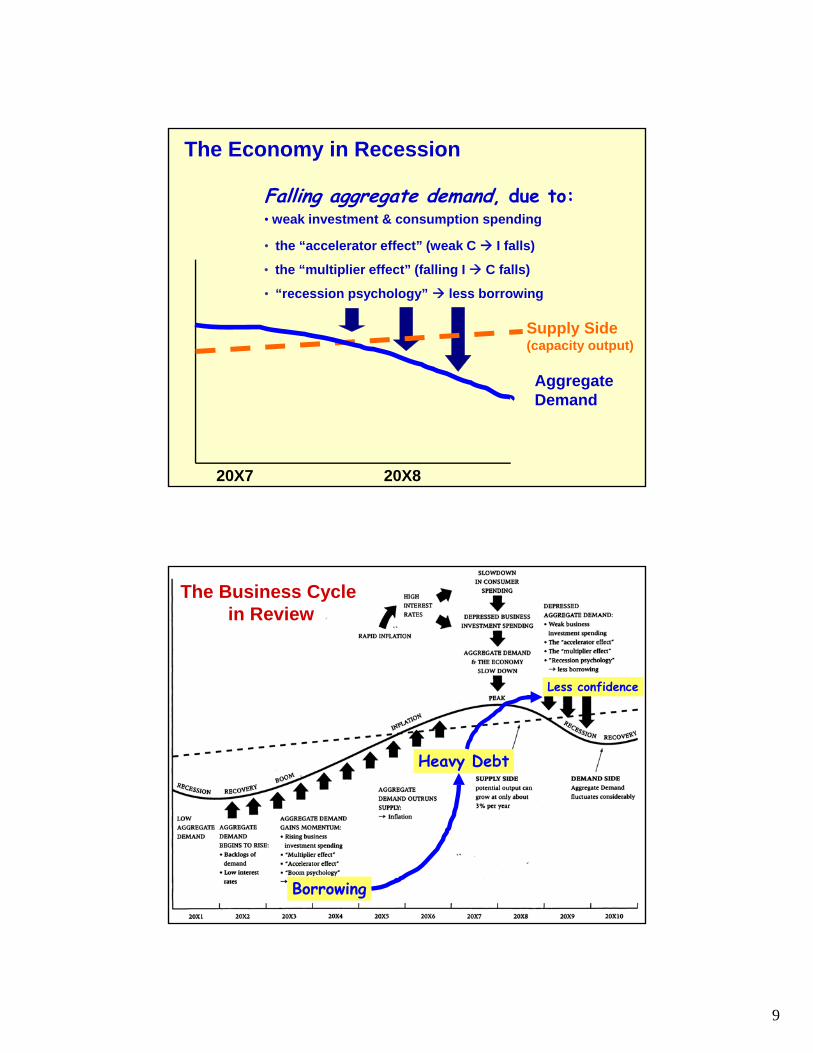
The Economy in Recession
Falling aggregate demand, due to:• weak investment & consumption spending
• the “accelerator effect” (weak C I falls)
• the “multiplier effect” (falling I C falls)
• “recession psychology” less borrowing
20X7 20X8
Heavy Debt
The Business Cycle in Review
Borrowing
Less confidence
10
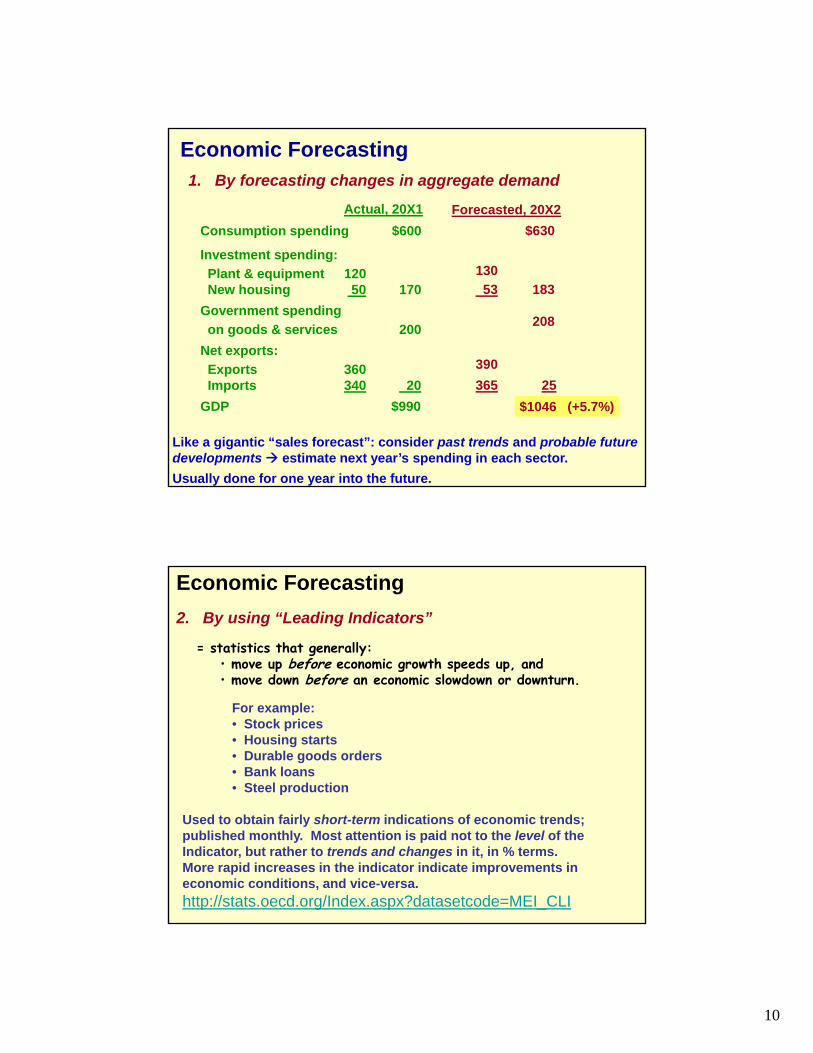
Economic Forecasting1. By forecasting changes in aggregate demand
Actual, 20X1
Consumption spending $600
Investment spending:
Plant & equipment 120New housing 50 170
Government spending
on goods & services 200
Net exports:
Exports 360Imports 340 20
GDP $990
Forecasted, 20X2
$630
130
53 183
208
390
365 25
Like a gigantic “sales forecast”: consider past trends and probable futuredevelopments estimate next year’s spending in each sector.
Usually done for one year into the future.
$1046 (+5.7%)
Economic Forecasting
2. By using “Leading Indicators”
= statistics that generally:• move up before economic growth speeds up, and • move down before an economic slowdown or downturn.
For example:• Stock prices• Housing starts• Durable goods orders• Bank loans• Steel production
Used to obtain fairly short-term indications of economic trends; published monthly. Most attention is paid not to the level of the Indicator, but rather to trends and changes in it, in % terms. More rapid increases in the indicator indicate improvements in economic conditions, and vice-versa.
http://stats.oecd.org/Index.aspx?datasetcode=MEI_CLI
11
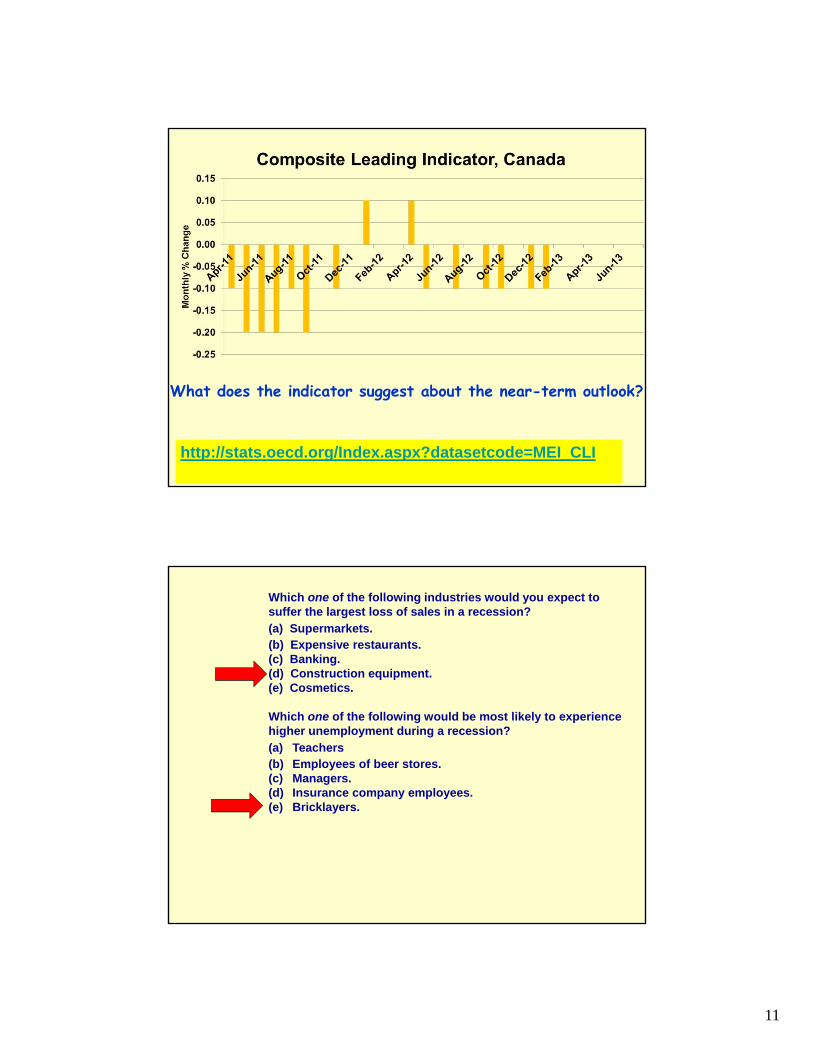
http://stats.oecd.org/Index.aspx?datasetcode=MEI_CLI
What does the indicator suggest about the near-term outlook?
Which one of the following industries would you expect tosuffer the largest loss of sales in a recession?
(a) Supermarkets.(b) Expensive restaurants.(c) Banking.(d) Construction equipment.(e) Cosmetics.
Which one of the following would be most likely to experiencehigher unemployment during a recession?
(a) Teachers(b) Employees of beer stores.(c) Managers.(d) Insurance company employees.(e) Bricklayers.
12
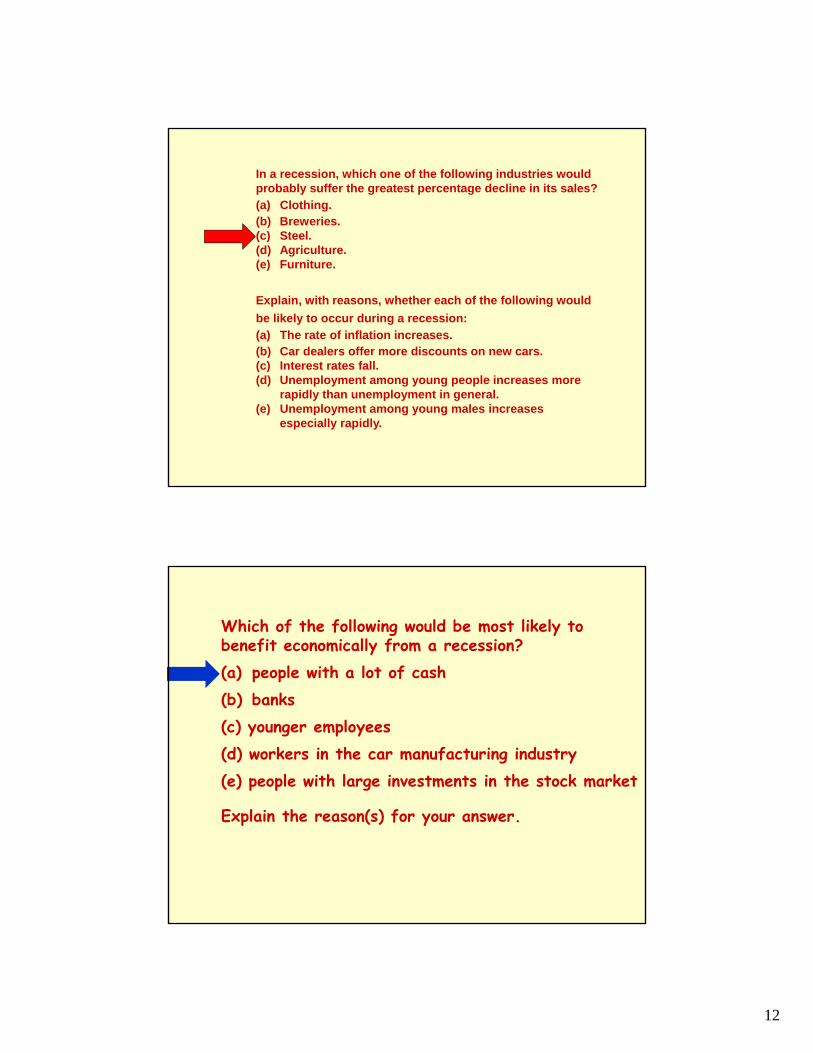
In a recession, which one of the following industries wouldprobably suffer the greatest percentage decline in its sales?
(a) Clothing.(b) Breweries.(c) Steel.(d) Agriculture.(e) Furniture.
Explain, with reasons, whether each of the following would
be likely to occur during a recession:
(a) The rate of inflation increases.(b) Car dealers offer more discounts on new cars.(c) Interest rates fall.(d) Unemployment among young people increases more
rapidly than unemployment in general.(e) Unemployment among young males increases
especially rapidly.
Which of the following would be most likely tobenefit economically from a recession?(a) people with a lot of cash(b) banks(c) younger employees(d) workers in the car manufacturing industry(e) people with large investments in the stock market
Explain the reason(s) for your answer.
13
Update on the current economic situation
Read the Chapter 6 “Recent Developments” file on SLATE.
UPDATE ON THE CURRENT SITUATION
Unusual nature of 2002-07 U.S. Economic Boom:
Boom was led by extremely high spending by U.S.consumers, largely financed by borrowing, and usingtheir homes as collateral.
AND high demand for housing created a housing price“bubble”, which increased the ability of consumersto borrow even more against their homes.
AND when the boom ended, it was not because rising interest rates slowed the economy down – it was muchmore serious, and sudden.
Credit was very readily available and demand high, butthe rate of inflation remained low, and interest ratesremained unusually low.
14
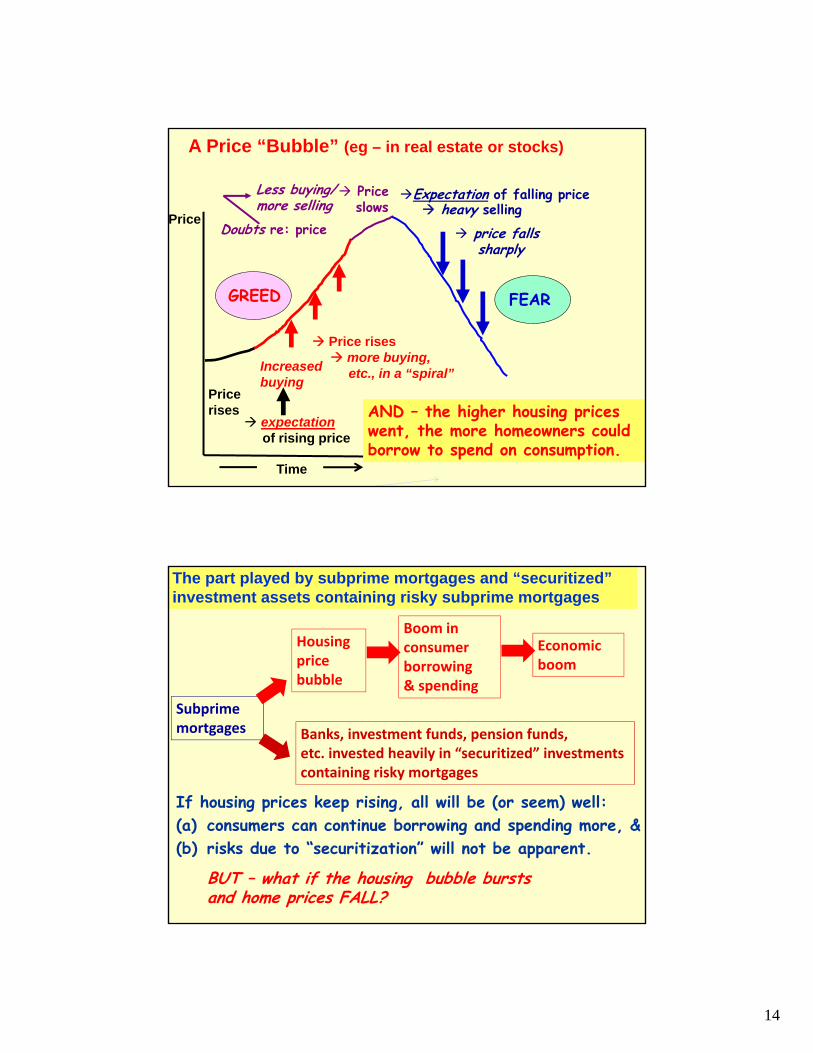
A Price “Bubble” (eg – in real estate or stocks)
Price
Pricerises
expectationof rising price
Increasedbuying
Price rises more buying,
etc., in a “spiral”
Doubts re: price
Less buying/more selling
Priceslows
Expectation of falling price
price fallssharply
GREED FEAR
heavy selling
Time
AND – the higher housing priceswent, the more homeowners couldborrow to spend on consumption.
Subprimemortgages
Housingprice bubble
Boom in consumer borrowing& spending
Economic boom
Banks, investment funds, pension funds, etc. invested heavily in “securitized” investments containing risky mortgages
If housing prices keep rising, all will be (or seem) well: (a) consumers can continue borrowing and spending more, &(b) risks due to “securitization” will not be apparent.
BUT – what if the housing bubble bursts and home prices FALL?
The part played by subprime mortgages and “securitized”investment assets containing risky subprime mortgages
15
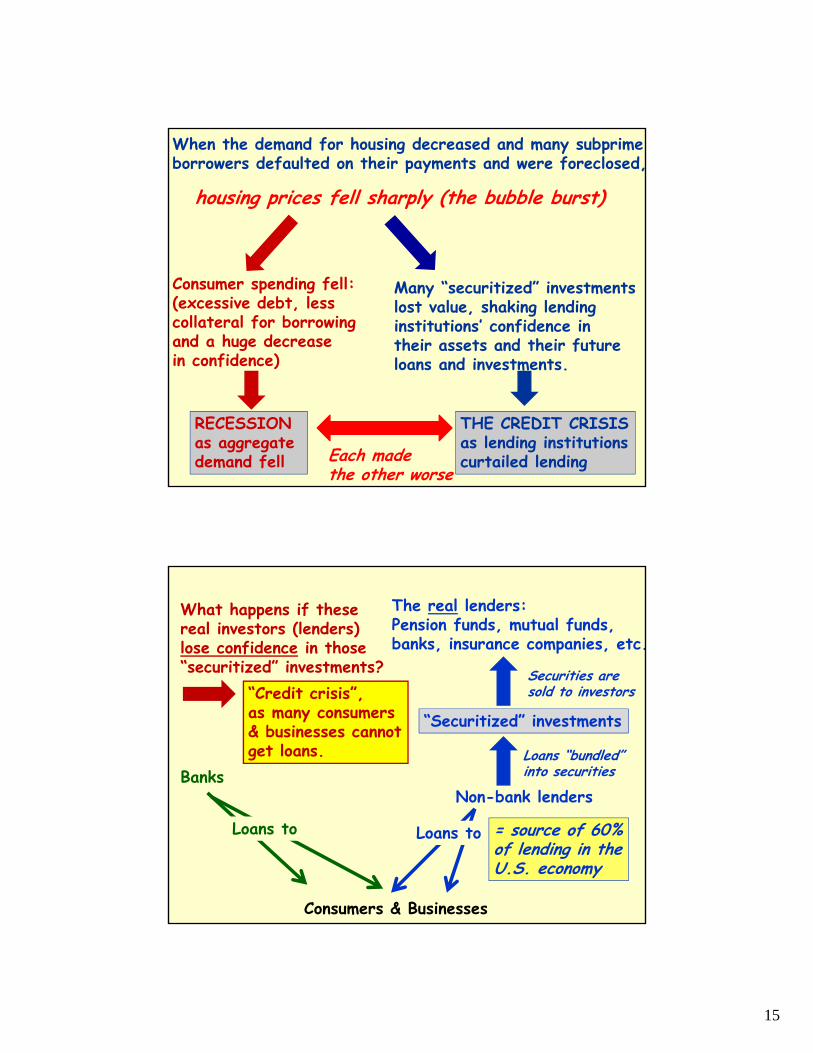
When the demand for housing decreased and many subprimeborrowers defaulted on their payments and were foreclosed,
housing prices fell sharply (the bubble burst)
Consumer spending fell:(excessive debt, lesscollateral for borrowingand a huge decrease in confidence)
Many “securitized” investmentslost value, shaking lending institutions’ confidence in their assets and their future loans and investments.
THE CREDIT CRISISas lending institutionscurtailed lending
RECESSIONas aggregate demand fell Each made
the other worse
Consumers & Businesses
BanksNon-bank lenders
= source of 60%of lending in theU.S. economy
“Securitized” investments
Loans “bundled” into securities
Securities aresold to investors
The real lenders:Pension funds, mutual funds,banks, insurance companies, etc.
What happens if thesereal investors (lenders)lose confidence in those“securitized” investments?
“Credit crisis”,as many consumers& businesses cannotget loans.
Loans to Loans to
16
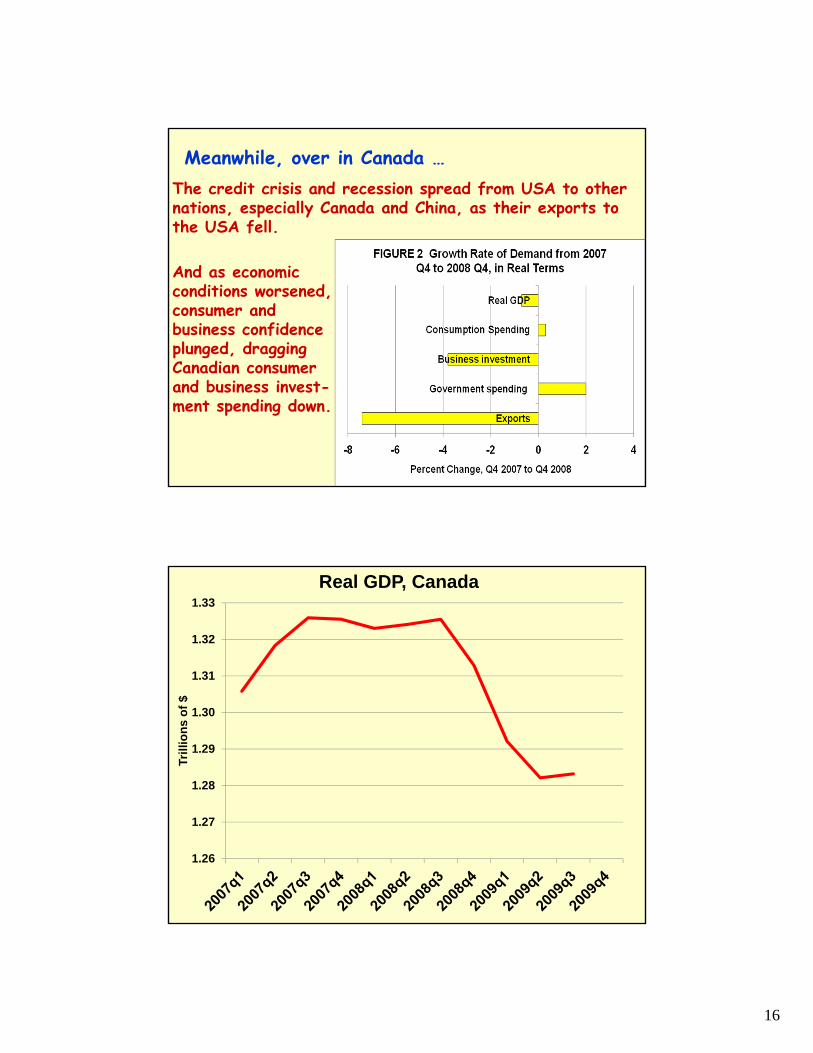
Meanwhile, over in Canada …The credit crisis and recession spread from USA to other nations, especially Canada and China, as their exports to the USA fell.
And as economic conditions worsened,consumer andbusiness confidenceplunged, dragging Canadian consumerand business invest-ment spending down.
1.26
1.27
1.28
1.29
1.30
1.31
1.32
1.33
Tri
llio
ns
of
$
Real GDP, Canada
17
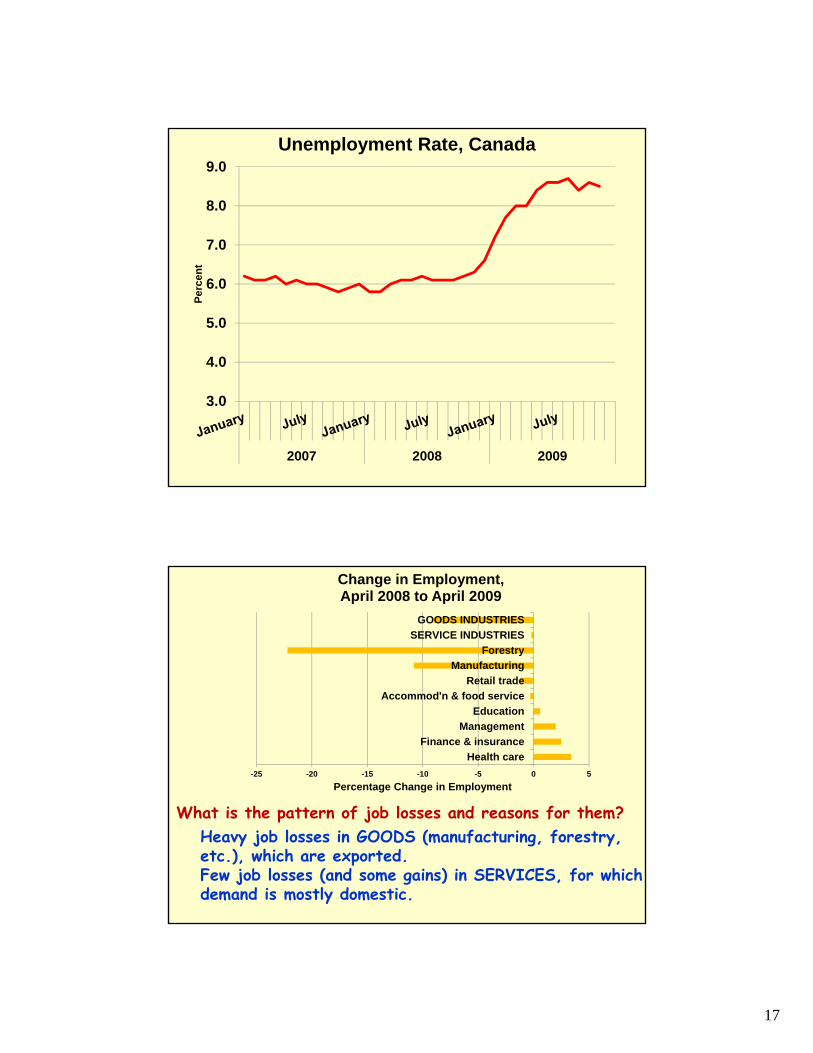
3.0
4.0
5.0
6.0
7.0
8.0
9.0
2007 2008 2009
Per
cen
t
Unemployment Rate, Canada
-25 -20 -15 -10 -5 0 5
Health care
Finance & insurance
Management
Education
Accommod'n & food service
Retail trade
Manufacturing
Forestry
SERVICE INDUSTRIES
GOODS INDUSTRIES
Percentage Change in Employment
Change in Employment, April 2008 to April 2009
What is the pattern of job losses and reasons for them?Heavy job losses in GOODS (manufacturing, forestry, etc.), which are exported.Few job losses (and some gains) in SERVICES, for whichdemand is mostly domestic.
18
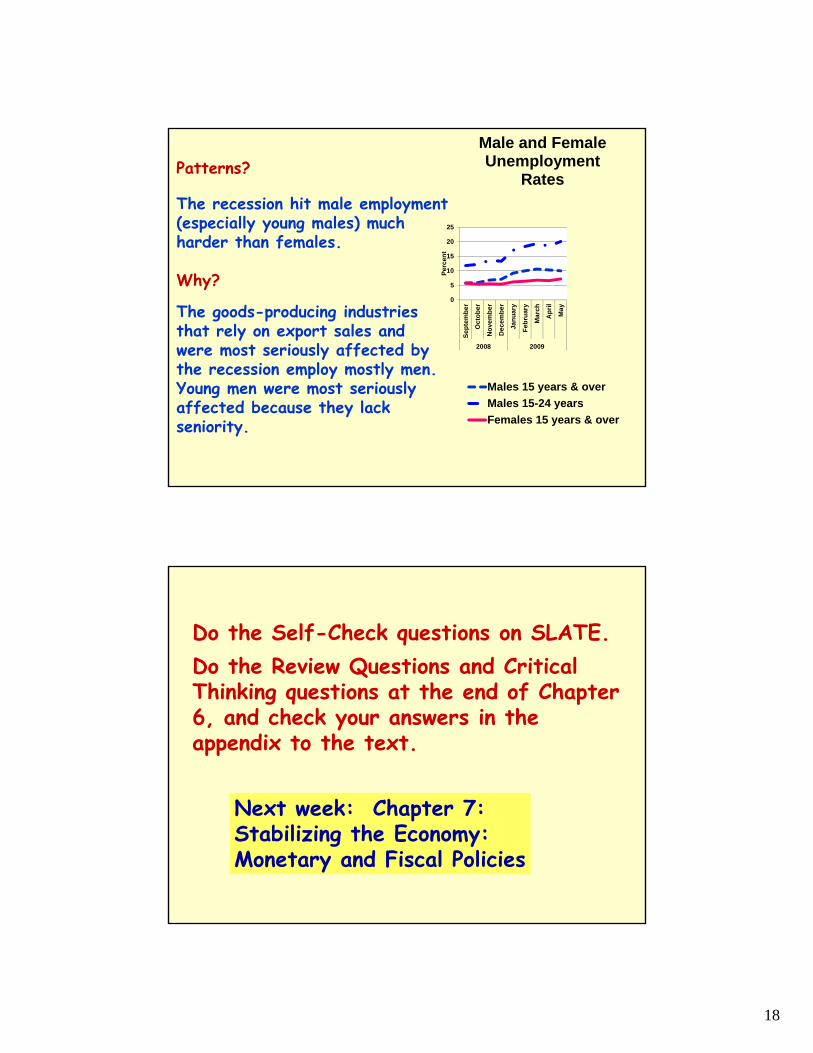
0
5
10
15
20
25
Sep
tem
ber
Oct
ob
er
No
vem
ber
De
cem
be
r
Jan
uar
y
Feb
ruar
y
Ma
rch
Ap
ril
Ma
y
2008 2009
Per
cen
t
Male and Female Unemployment
Rates
Males 15 years & over
Males 15-24 years
Females 15 years & over
Patterns?
The recession hit male employment (especially young males) much harder than females.
Why?
The goods-producing industriesthat rely on export sales and were most seriously affected by the recession employ mostly men.Young men were most seriouslyaffected because they lackseniority.
Next week: Chapter 7:Stabilizing the Economy:Monetary and Fiscal Policies
Do the Self-Check questions on SLATE.Do the Review Questions and Critical Thinking questions at the end of Chapter 6, and check your answers in the appendix to the text.